 Xiaohang Wen
 Chenghan Liu
 Siqiong Luo
94% of researchers rate our articles as excellent or good
Learn more about the work of our research integrity team to safeguard the quality of each article we publish.
Find out more
ORIGINAL RESEARCH article
Front. Earth Sci., 01 October 2020
Sec. Atmospheric Science
Volume 8 - 2020 | https://doi.org/10.3389/feart.2020.576461
This article is part of the Research TopicOrigins and Predictability of the Intraseasonal to Interannual Variabilities of Regional ClimateView all 31 articles
We used a High-Resolution Assimilation Dataset of the water-energy cycle in China (HRADC) to study the land-atmosphere interactions and meteorological characteristics in inhomogeneous underlying surface of the Qinghai-Tibet Plateau (QTP). Three different underlying surfaces (i.e., grassland, open shrubland, and barren or sparsely vegetated) of the QTP are selected and the meteorological elements on each underlying surface grid are averaged. We compared and analyzed the Green Vegetation Fraction, precipitation, soil moisture and soil temperature, and energy fluxes for three different land-use types in QTP. The results showed that the vegetation coverage of HRADC showed a gradual decrease trend from southeast to northwest throughout the Qinghai-Tibet Plateau. The Green Vegetation Fraction of the grassland in the southeast can reach more than 60% in summer, and only about 20% in sparse vegetation areas. HRADC can well reproduce the seasonal change trend of soil temperature and soil moisture in different underlying surfaces. The annual variation trend of soil temperature shows that the time of the deep soil temperature reaching the peak value lags behind the shallow layer. The annual averaged soil moisture over grassland is higher than that of open shrubland and barren land, which is consistent with the plateau precipitation distribution. The peak value of sensible heat flux over grassland is only 80 W·m−2 in April, and the latent heat flux can reach 90 W·m−2, and the net radiation of the barren land can reach 210 W·m−2 in July. This study is important to discover the water-energy cycle characteristics of QTP.
High-elevation areas are the most susceptible to the effects of climate change (Salerno et al., 2008). The Qinghai-Tibet Plateau (QTP), which has been called “the third pole” and “the world’s water tower” has its unique terrain height and land use types plays an important role in the global climate change and water-energy cycle (Xu et al., 2008b; Zhao et al., 2011). Owing to the effects of changing climate and frequent human activities, the ecosystem and climate of the QTP have undergone great changes since the 1980s. Therefore, the study of QTP is very important, especially the study of its land surface processes (Zhang et al., 2005; Tian et al., 2015; Chen et al., 2018).
The land surface processes are the exchange of heat, water, and momentum between the land surface and the atmosphere. These processes are including water and heat transfer process, ecological process, energy and material exchange process, and water and heat transfer process in soil, etc. (Dickinson, 1983; Noilhan and Planton, 1989; Nicholson, 2000). The transport of heat and water in the soil complicates the interaction between land and atmosphere. Albedo, heat capacity, and vegetation growth conditions are all related to soil moisture, which affects short-term climate change (Cahill and Parlange, 1998; Hansson et al., 2004). The soil temperature represents the thermal state of the underlying surface, and its change will affect the soil moisture transfer process, thereby affecting the energy and moisture exchange of the underlying surface (Lawrence and Slater, 2010; Naranjo-Mendoza et al., 2018). Some studies have used soil moisture and soil temperature observations to study water and heat transfer in soil (Choudhury et al., 1982; Hinkel et al., 2001; Novák and Hlaváčiková, 2019), numerical models (Peng et al., 2016; Zhang et al., 2016), and satellite data (Muzylev et al., 2018; Corbari et al., 2019). The condition of the underlying surface of the Qinghai-Tibet Plateau is more complicated, as the land surface is covered by different types of vegetation and soil types (Xie et al., 2017; Zhang et al., 2019). The vegetation type leads to differences in surface energy distribution, which in turn leads to differences in surface energy flux, affecting the lower QTP and even East Asia Climate change (Duveiller et al., 2018). The change of latent heat flux and sensible heat flux between land surface and atmosphere affects the formation and evolution of the East Asian monsoon, and also plays a vital role in the water and energy cycle of the global climate system (Zuo and Zhang, 2016). Soil moisture and climate variation using observation data and found that soil moisture in spring has an impact on the East Asia summer monsoon circulation and precipitation in East China area (Zhang and Zuo, 2011; Feng et al., 2015a, Feng et al., 2015b). Since the soil temperature, humidity, latent heat, and sensible heat flux are all affected by the underlying surface, studying the characteristics of meteorological elements on different underlying surfaces of the Qinghai-Tibet Plateau has certain reference significance for researching the land surface process and climate change in QTP (Ma et al., 2017; Chen et al., 2020; Zhan et al., 2020).
Because there are few meteorological observatories on the Qinghai-Tibet Plateau, surface observation is very difficult, and there are few studies on water and energy transfer on different underlying surfaces (Liu et al., 2006). Ge et al. (2017) used the observation data from Beiliuhe observation station (degraded alpine meadow) and Maqu flux station (alpine steppe) of the QTP in 2014 to compare the surface energy distribution characteristics of the two different types of underlying surfaces, and found that precipitation and air temperature are the main factors affecting the latent heat of degraded alpine meadow and alpine steppe, respectively. Yang and Ma (2012) analyzed the spatial and temporal distribution characteristics of soil temperature and moisture on the three different types of underlying surfaces using observation data in QTP, and found the annual trend of soil temperature is basically consistent with the characteristics of solar radiation. There are also some studies using NCEP reanalysis data to study the energy and water circulation and soil heat transfer on different underlying surfaces on QTP (Frauenfeld et al., 2005; Xie et al., 2007; Cui and Wang, 2009; Wang et al., 2012; Zhu et al., 2012; Bao and Zhang, 2013; Shi and Liang, 2014). Due to the difference in vegetation coverage on different underlying surfaces in plateau region, the soil water content will be different (Wang et al., 2008; Guo et al., 2011), and soil water content conditions can affect soil temperature changes and trends. The difference in hydrothermal properties of different underlying surfaces will cause differences in land-atmosphere interactions (Hu et al., 2018). Therefore, differences in underlying surfaces will lead to differences in surface radiation and energy exchange processes (Li et al., 2012). This difference is of great significance to the surface energy distribution (Gu et al., 2015).
In view of that different underlying surfaces of the QTP have different energy and water transport characteristics and water-energy transport processes. In this paper, we use meteorological observation data and High-Resolution Assimilation Data in China (HRADC) to compare the Green Vegetation Fraction (GVF), soil temperature and moisture, precipitation, and surface energy fluxes over the three main types of underlying surfaces (grassland, open shrubland, and barren or sparsely vegetated) in QTP. The problem to be solved in this study is to evaluate and analyze whether the mesoscale regional meteorological model that has assimilated meteorological data and improved the underlying surface vegetation coverage and terrain height is carried out for long-term simulation, and whether the simulation results correctly reflect the land-atmosphere interaction and energy-water cycle process in three main different underlying surfaces in the QTP. Moreover, from the long-term data series, it is found that how vegetation and soil temperature and moisture on different underlying surfaces and in different seasons affect the energy flux, which is the problem to be solved in this paper. The characteristics of these meteorological elements were compared and analyzed to reveal the characteristics and differences of water-energy circulation on different underlying surfaces in QTP.
In this paper, The HRADC data are derived from scientific and technological achievements of the National High Technology Research Development Program (863 program), “Study of Remote Sensing Technology System for Carbon Verification” (Wen et al., 2015). The HRADC data are generated by weather Research and Forecast (WRF) Model version 3.4.1 and three-dimensional variation Data Assimilation System (WRF-3Dvar). WRF-3Dvar was used to assimilate meteorological data from 824 automatic weather stations at fixed time in China from 2005 to 2012.
The meteorological data assimilated into the WRF-3Dvar system include surface pressure, 2-m temperature, 2-m relative humidity, wind speed and direction. GVF is calculated by MODIS monthly normalized difference vegetation index (NDVI), and topographic height data in the model initial field is obtained from Digital Elevation Model (DEM) data generated by the Space Shuttle Radar topography Mission (SRTM). Finally, WRF-3Dvar generated the assimilation re-analyzed data and supporting documents from 2005 to 2012.
In the numerical model, the terrain height of the underlying surface will affect the thermal and dynamic processes of local weather processes, and will also affect the water-energy cycle process between land surface and atmosphere. The static terrain height data used in the initial field of the default WRF model uses GTOPO 30 data from the US Geological Survey (USGS), which contains global terrain height data of different resolutions (10, 5, 2 min, and 30 s) (Moya-Álvarez et al., 2019). The accuracy of the GTOPO 30 usually is not uniform because they use various data sources in their construction without a universally accepted standard. The error of the GTOPO is less than 30 m (Nikolakopoulos et al., 2006). In this study, we use the SRTM DEM data in WRF mode. The SRTM data is mainly measured jointly by National Aeronautics and Space Administration, the National Surveying and Mapping Agency, the German Space Agency, and the Italian Space Agency (Reuter et al., 2007). Although SRTM data is more and more widely used in terrain geography (Gorokhovich and Voustianiouk, 2006), vegetation (Walker et al., 2007) and tsunami assessment (Dall’Osso et al., 2010), there is a lack of research in the field of meteorology. SRTM data has undergone various verifications, including various altimetry (Gorokhovich and Voustianiouk, 2006; Potts et al., 2008) and digital elevation models (Carabajal and Harding, 2005; Ludwig and Schneider, 2006). The absolute horizontal accuracy of SRTM is 20 m, which has passed the 90% confidence test (Kiamehr and Sjöberg, 2005). The SRTM data set can be downloaded on the server: ftp://edcsgs9.cr.usgs.gov/pub/data/srtm/.
The multi-source data for generating HRADC includes satellite data and in-situ observation data, which are combined with WRF models for simulation and assimilation. HRADC was compared with the observation data in the semi-arid Northeast China, and the verification results showed that HRADC can better reproduce the energy-water cycle process on grassland and cropland underlying surfaces, and the simulated results were in good agreement with the observation values (Ruan et al., 2017; Yan et al., 2020). In this paper, we selected for analysis data from 0000 UTC, January 1, 2005, to 1800 UTC, December 31, 2012. The spatial range is from 73°E to 105°E in longitude, 27.7°N–40°N in latitude, and the spatial resolution of the study area is 25 km. Figure 1 shows the distribution of terrain height and automatic weather stations in the QTP, and Figure 2 shows the distribution of land use types/vegetation types in the QTP.
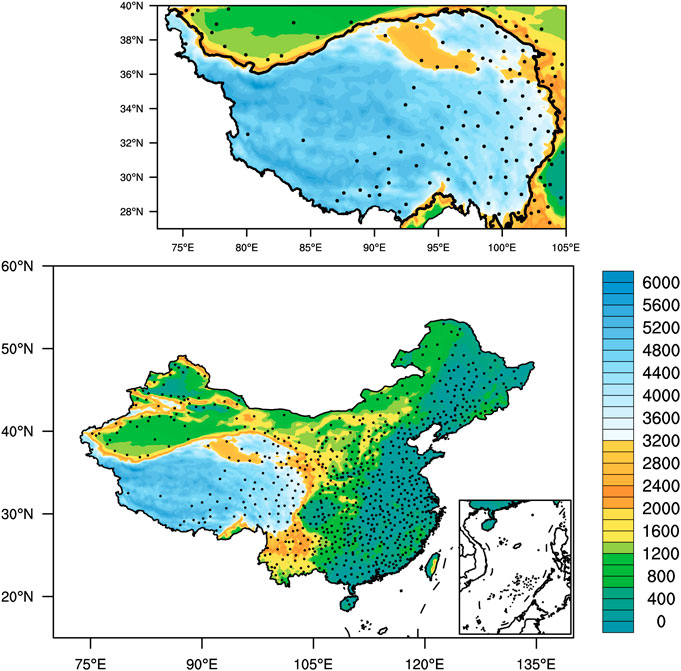
FIGURE 1. The location of the Qinghai-Tibet Plateau (QTP) in China, and the distribution of Elevation (Unit: m). The 824 automatic weather stations (symbol) in China including 80 automatic weather stations in the QTP.
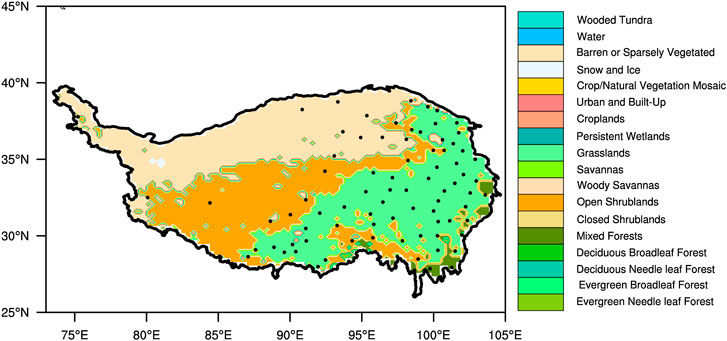
FIGURE 2. The distribution of land use types in Qinghai-Tibet Plateau.
Changes in land use types in the numerical model can lead to changes in related static parameters, such as reflectivity, surface roughness, emissivity, and soil moisture (Schicker et al., 2016). This ultimately leads to changes in surface energy balance, turbulent kinetic energy, latent heat flux, and temperature. The WRF model provides land use data obtained from MODIS satellite sensors (Terra and Aqua satellites). For the classification of MODIS land-use data, 8-day composites for one one-year normalized bidirectional reflectance distribution function adjusted reflectance and land surface temperature were used. MODIS land use type data includes five different classification data sets: IGBP data set (Friedl et al., 2010), University of Maryland data set, 10 types of MODIS LAI/FPAR algorithm data set (Lotsch et al., 2003a; Lotsch et al., 2003b), a dataset of eight biomes (Running et al., 1995) and 12 types of plant functional classification (Bonan et al., 2002). The version used here and provided by WRF is based on the 20-class IGBP 1 km grid resolution database (Bhati and Mohan, 2016). Schicker et al. (2016) used the WRF model and different underlying land use data sets (USGS, MODIS and a reclassified European dataset based on the CORINE CLC06 data) to simulate the meteorological elements of European mountainous areas. The results show that classification errors were found in both MODIS and USGS land use data, but if there are only built-in land use data available, MODIS data should be preferred. The MODIS classification land use data used in this paper may be misclassified in the QTP region, but the WRF model results can reproduce the land-atmosphere interaction process in the QTP region.
In this paper, the observed 2-m temperature, relative humidity, and precipitation data are using “The gridded dataset of near surface temperature and precipitation of China” dataset, from China Meteorological Administration (Zhao et al., 2019). The digital elevation terrain data and thin-plate spline method are used to reduce the effect of elevation on the accuracy of spatial interpolation. This 0.5° × 0.5° grid dataset includes daily and monthly temperature, humidity and precipitation in China from 1961 to the present. The assessment of this dataset indicates that: The gridded observations have a high correlation relationship with the original data sequence, and the root-mean-square error (RMSE) is reduced (Zhao et al., 2014). This gridded data can be found at http://www.escience.gov.cn/metdata/page/index.html.
A long-term (2005–2016) dataset of integrated land-atmosphere interaction observations on the Tibetan Plateau has been used to validate the HRADC results. This dataset including the South-East Tibetan plateau Station for integrated observation and research of alpine environment (SETORS), NAQU cold climate environment observation station (NAQU), Nam Co Station for Multisphere Observation and Research (NAMORS), Ngari Station for Desert Environment Observation and Research (ALI) by hourly meteorological data, radiation data, soil data, and flux heat data from 2005 to 2016 (Ma, 2020). These data can be widely used in the analysis of meteorological features of the QTP, the evaluation of remote sensing products and the evaluation and development of numerical models. This data can be found at https://data.tpdc.ac.cn/.
In this study, we use high-resolution (0.25° × 0.25°) global latent heat flux, sensible heat flux, and net radiation data at the Earth’s surface released by the European Center for Medium and Long-Term Weather Forecasting (ERA5 grid data) to obtain regional distribution and time series maps in QTP for January 2005 to December 2012. ERA5 reanalysis data combine vast amounts of historical observations into global estimates using advanced modeling and data assimilation systems and provide hourly to monthly estimates of a large number of atmospheric, land and oceanic climate variables (Dragani et al., 2015; Urraca et al., 2018). The data cover the Earth on a 30 km grid and resolve the atmosphere using 137 levels from the surface up to a height of 80 km (Hersbach et al., 2020).
Three main types of underlying surfaces in QTP (Grassland, Open Shrubland and Barren or Sparsely Vegetated) are selected and the characteristics of land-atmosphere transmission on different underlying surfaces are analyzed. Table 1 shows the three main types of underlying surfaces in the study area and their percentages ratio. The averaged values of the same underlying surface grids were selected and used to represent each underlying surface.
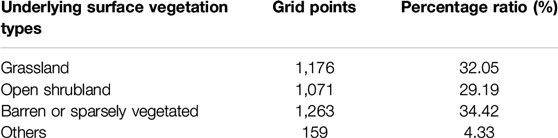
TABLE 1. The grid points and percentages of the main types of underlying surfaces in Qinghai-Tibet Plateau.
Although the HRADC data used in this paper have been verified and compared (Wen et al., 2014; Wen et al., 2015), they have not been carefully verified in the QTP region, which is also the purpose of this paper. The applicability of HRADC in northeast China is verified. It shows that the simulation results of near-surface temperature and relative humidity are in good agreement with the observed data and can be applied to the analysis of semi-arid areas in northeast China (Ruan et al., 2017). In this paper, in order to verify the applicability of HRADC in QTP, we compared the average 2-m temperature and relative humidity on the three underlying surfaces between HRADC and “The gridded dataset of near surface temperature and precipitation of China” data set, and the results showed that the HRADC data were agree well with the observation data, as shown in Figure 3. The error statistics of 2-m temperature and 2-m relative humidity between observations and HRADC of the QTP are listed in Table 2.
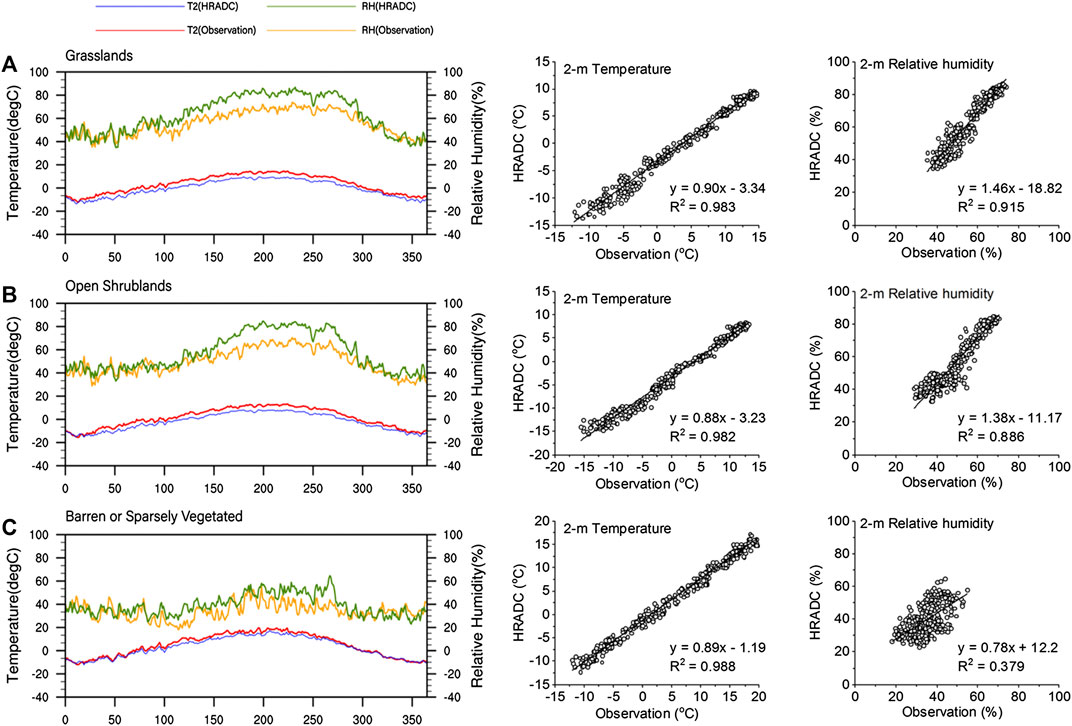
FIGURE 3. Comparison of observations and High-Resolution Assimilation Dataset of the Water-Energy Cycle in China simulations, from three different underlying surfaces in Qinghai-Tibet Plateau, of the average daily value of 2-m temperature (°C) and relative humidity (%) during 2005–2012.
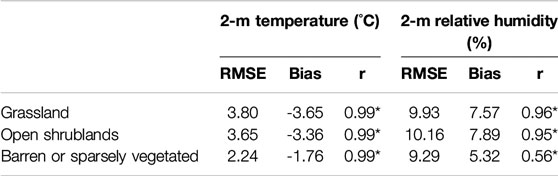
TABLE 2. Root-mean-square error (RMSE), bias and correlation coefficient (r) of the daily averaged value of 2-m temperature (°C) and 2-m relative humidity (%) between observations and High-Resolution Assimilation Dataset of the Water-Energy Cycle in China simulated results over Qinghai-Tibet Plateau, * indicates result passed the significance level t-test of α = 0.01.
GVF is a key land-surface parameter in land-surface processes, and is defined as the fraction of the grid cell for which midday downward solar is intercepted by a photosynthetically active green canopy (Vahmani and Ban-Weiss, 2016). In Noah Land Surface Model (LSM), seasonal variation of GVF also defines seasonal variation in other surface physical characteristics, such as albedo, LAI, surface emissivity, and roughness length (Chen and Dudhia, 2001).
Figure 4 shows the spatial distribution characteristics of GVF in HRADC in the four seasons of the QTP. The distribution of GVF in the plateau gradually decreases from the southeast to the northwest throughout the year. The underlying surface of the southeastern QTP is mainly forests and alpine grasslands. Due to the impact of precipitation and temperature, the vegetation coverage in this area is high throughout the year, especially in summer. The vegetation coverage can reach more than 60%. The underlying surface types in the middle of the QTP are mainly open shrublands. GVF has a clear seasonal change trend. The GVF in summer and autumn is appropriately 30–40%, while the GVF in winter and spring is reduced, below 20%. The northwest part of the QTP is mainly covered with bare ground or sparsely vegetated, so the GVF is relatively low throughout the year, which is basically less than 10%. The spatial distribution of vegetation coverage on the plateau throughout the year shows a trend of higher vegetation coverage in the southeast region and less in the northwest region. In recent years, on the southern ridge of the QTP, warming trends contribute to humid weather and conditions conducive to vegetation growth. In contrast, high temperature lead to drought and lack of rainfall in the northern part of the TP, leading to drought which are not conducive to increased vegetation cover (Xu et al., 2008a).
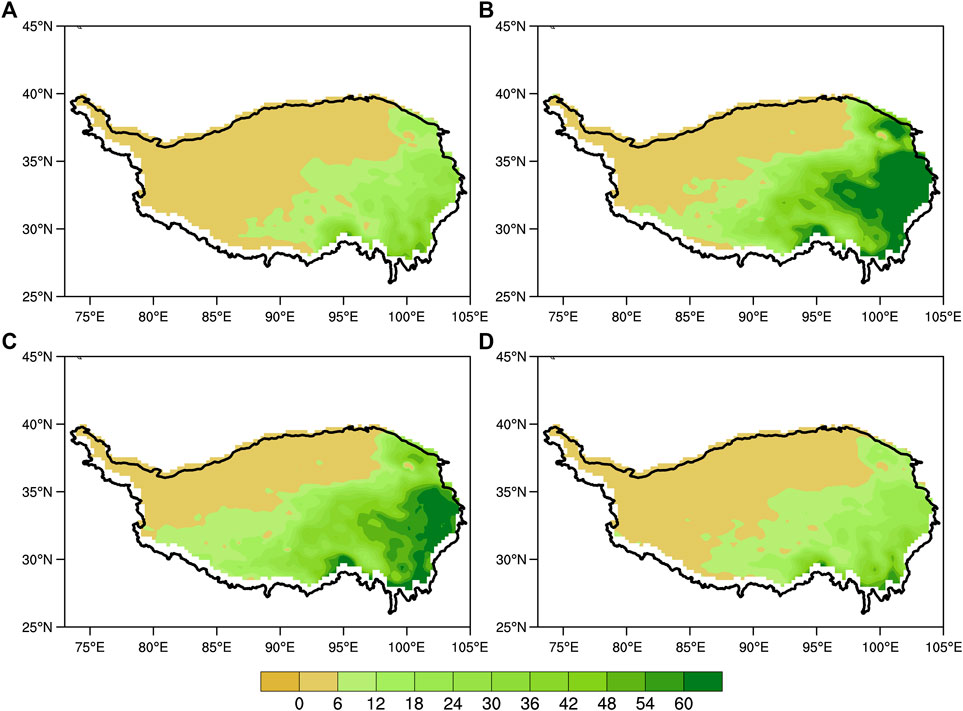
FIGURE 4. The spatial distribution characteristics of Green Vegetation Fraction in different seasons of High-Resolution Assimilation Dataset of the Water-Energy Cycle in China in Qinghai-Tibet Plateau (Unit: %). (A) MAM, (B) JJA, (C) SON, (D) DJF.
Precipitation is a key factor for vegetation growth. Ruan et al. (2017) found that precipitation has a positive correlation with vegetation coverage and has a significant correlation with surface albedo. In the QTP, precipitation and air temperature are also the main factors of water and heat that determine the growth status of vegetation (Nielsen et al., 2013). As shown in Figure 5A, the GVF on different types of underlying surfaces shows an obvious trend of a single peak variation. From January to May, there is no obvious change, and the GVF for grassland, Open shrubland and Barren land is approximately 18%, 9%, 2%, respectively. After May, the GVF increases continuously, and reach to its peak value in August, which is 65%, 20%, and 5%, respectively. Then it started to decline again in the next few months. On different underlying surfaces, vegetation began to grow only when the precipitation reached its highest value within a year, and after the end of the rainy season on the plateau in August, GVF began to decrease, and GVF lags behind precipitation by 3 months. After July, the monthly averaged precipitation on the open shrubland is not much different with the grassland, but the GVF of the open shrubland is only 1/3 of the grassland. After July, the precipitation on the barren land can reach 40 mm/m, but the GVF has not increased rapidly, which shows that precipitation is not the only factor affecting the change of GVF. It indicates that the combined effects of vegetation type, temperature and soil water content of the underlying surface may be a comprehensive factor affecting the growth of vegetation. In the QTP region, vegetation growth lags behind precipitation by two months. Precipitation on the grassland surface peaked in June (63 mm), while vegetation coverage peaked in August (60%). The peak value of GVF on the grassland is three times that of open shrubland, while the barren or sparsely vegetated underlying surface has the lowest GVF, with a peak value of only about 5% in August throughout the year. It can be seen from Figure 5B that the albedo of the grassland has been higher than the barren land and open shrubland throughout the year. It is lower in summer and higher in winter. We also plotted the snow cover image of QTP in four seasons according to the snow cover data of ERA5, and found that the snow cover in spring and winter on the grassland is more than 80%, and the snow cover in autumn is about 50% (figure omitted). This may be the main reason for the high albedo of the underlying surface of the grassland. The increase in the albedo of the grassland led to a decrease in the soil temperature, making the average annual soil temperature in grassland lower than that of the barren land in shallow layer (0–10 and 40–40 cm). Due to the snow cover impact, the higher surface albedo results in lower net radiation and lower surface sensible heat transfer, and increase the surface latent heat flux during the soil complete freezing period and the melt period, reduce the heat transfer from the soil to the atmosphere during the complete freezing period, and reduce the heat transfer from the atmosphere to the soil during the melt period. Snow had a cooling effect during the freezing period, and the soil temperature was lower than that under the barren land. In winter and spring, the area under the grassland has a higher snow cover, which leads to the water retention effect on the shallow soil.
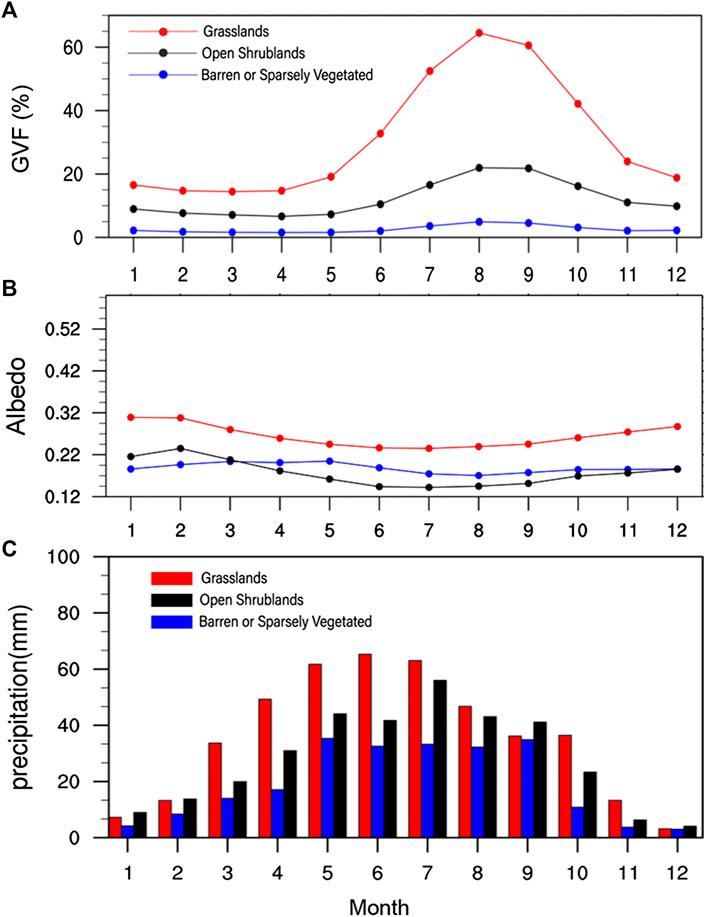
FIGURE 5. The monthly averaged variation of (A) Green Vegetation Fraction (Unit: %), (B) Albedo and (C) precipitation (Unit: mm) over Grassland, Open shrublands, and Barren or sparsely vegetated in Qinghai-Tibet Plateau.
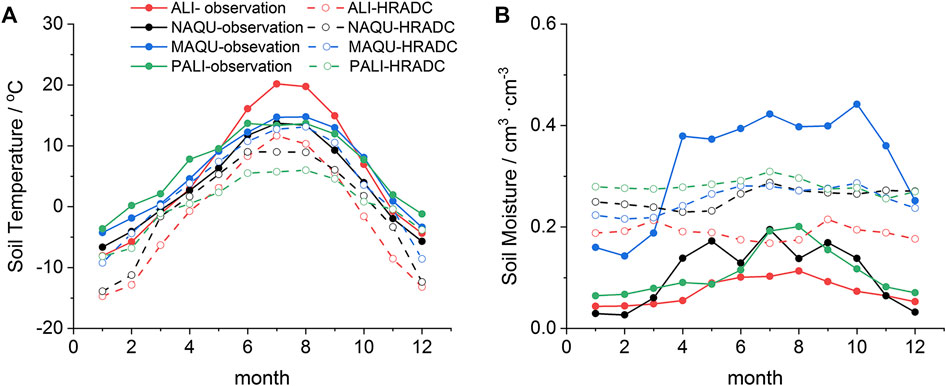
FIGURE 6. Comparison of monthly averaged observations and High-Resolution Assimilation Dataset of the Water-Energy Cycle in China simulations, from four observation stations in Qinghai-Tibet Plateau, (A) soil temperature (°C) and (B) soil moisture (cm3·cm−3) from 2010–2012.
Soil temperature can directly affect the surface energy flux, and thus play a vital role in feedback of climate change. Soil temperature and surface temperature directly or indirectly restrict upward long-wave radiation, net radiation, and sensible heat flux between soil and atmosphere, and soil temperature anomalies will affect energy balance, which in turn will affect atmospheric circulation (Wang and Bras, 1999; Yang and Wang, 2008; Luo et al., 2017). By analyzing the change trend of soil temperature on different underlying surfaces of the QTP, we can have a deeper understanding of the feedback of different underlying surfaces to the atmosphere. Soil moisture is the most important factor of water-energy circulation process. In the LSM model, the main factors affecting soil moisture include runoff, gradient and vertical diffusion, water absorption and gravity (Niu et al., 2011; Wen et al., 2012; Zhang et al., 2012).
The observations data of soil temperature and moisture at four stations on the QTP are selected and compared with the HRADC. The four observation stations represent the barren land [ALI (79.7°E, 33.4°N)] and open shrubland [NAQU (92.1°E, 31.5°N)] and the grassland [MAQU (102.1°E, 33.9°N] and PALI (27.5°N, 88.9°E), respectively. We found that the observed soil temperature of the bare underground surface is higher in summer, and the soil temperature of HRADC on the barren land surface is also higher than that of grassland and shrub land, this is more consistent with the observed value. The soil temperature of HRADC is overall lower than the observed value. It can be seen from the comparison of the annual change of soil moisture, except for the higher soil moisture value in MAQU (0.4 cm3·cm−3), the soil moisture of the other three stations is lower than 0.2 cm3·cm−3, and the soil moisture value of the barren land is only about 0.1 cm3·cm−3 in summer. The soil moisture in barren land of HRADC is also lower than the other two underlying surfaces, but the soil moisture of HRADC is overall higher than the observed values (range from 0.2 to 0.3 cm3·cm−3). By comparing with the observed values, we can conclude that HRADC can simulate the variation characteristics of soil temperature and moisture more accurately over different underlying surfaces in the QTP, but the simulated higher soil moisture may overestimate the latent heat flux and net radiation simulations.
The soil temperature in different underlying surfaces shows a gradually decreasing trend from shallow to deep layers (Table 3). This is because with the increase of solar radiation in summer, the surface skin temperature begins to increase, and heat is transferred from the land surface to deep soil layer, lead to forms a vertical soil temperature gradient. The annual averaged soil temperature decreases from the land surface to deep soil layer, and the peak value gradually lags behind. The peak value of soil temperature in first layer appears in July, while the deep layer appears in August. The time for the soil temperature in deep layer to reach the annual peak is about one or two months behind the surface and shallow layers, indicating the lag of soil heat storage.
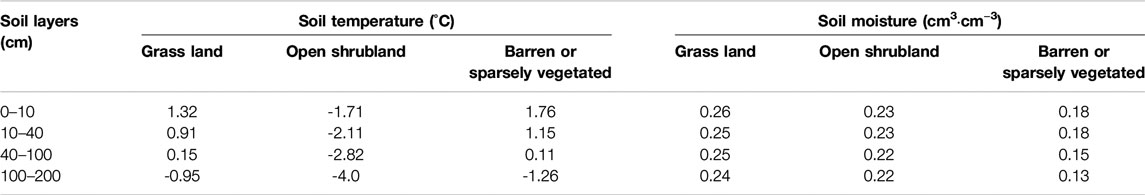
TABLE 3. Comparison of the annual averaged soil temperature and soil moisture data on different underlying surfaces in Qinghai-Tibet Plateau.
We can see that the peak and valley value of soil temperature in upper layer occurred in July and January, respectively (Figures 7A,B). The HRADC can well reproduce the annual change trend of the soil temperature of each layer on the three different underlying surfaces in the QTP. The intra-annual change of the soil temperature in the QTP is affected by solar radiation and is consistent with the annual change of solar radiation (Fu and Rich, 2002). The soil temperature of all four layers is higher than that of the grassland begore 100 days and lower than that of the grassland after 280 days. The daily average annual variation range of soil temperature on the three different underlying surfaces was the highest on barren or sparsely vegetated, followed by open shrubland and grassland. This may be because the plateau snow began to melt in spring, and the vegetation on the underlying surface gradually began to grow. Due to the scarcity of vegetation on the barren ground surface, the soil was affected by solar radiation, and the temperature increased more quickly than open shrubs and grasslands. In autumn, because the vegetation coverage of open shrubs and grass underlays is higher than that of bare land, the vegetation coverage of grass underlays is around 50%. The heat preservation effect of the vegetation makes it difficult to lost heat in the soil of open shrubs and grass underlays. In the winter, the solar radiation gradually decreases, and the soil temperature of the barren ground surface decreases more rapidly, followed by open shrubs, and the grass ground surface is the slowest. It can be seen from Figures 7C,D that the variation of daily mean soil temperature has strong mutagenicity, which is not similar to other soil levels. This is because we use the piecewise-integration method in the WRF mode (Shao et al., 2015). The piecewise-integration method is significantly superior to the conventional continuous integration method. It can effectively reduce the accumulation errors caused by long-term continuous integration and improve the simulation accuracy of the reference state and the perturbed state (Zhang et al., 2008). However, it may take a long time for the temperature and humidity of the deep soil to reach the water and energy balance state due to the re-use of the initial field and boundary conditions for the piecewise-integration every month. In the process of integrating HRADC data, we used 5 days to spin-up, but it seems that it may take longer for the deep soil temperature and moisture to reach balance.
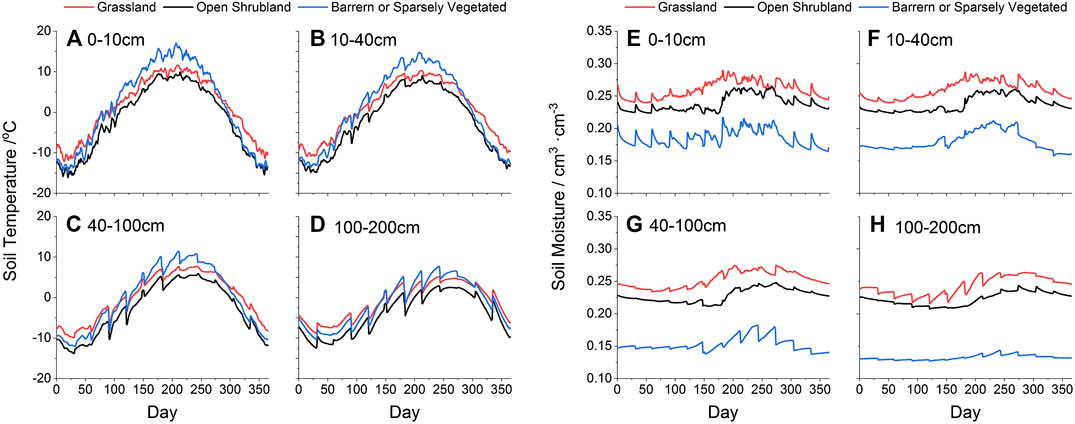
FIGURE 7. The daily averaged variation of soil temperature (°C) and soil moisture (cm3·cm−3) over Grassland (red line), Open shrubland (black line), and Barren or sparsely vegetated (blue line) in the Qinghai-Tibet Plateau.
In general, the annual change trend of soil temperature on different underlying surfaces of the QTP is closely related to the GVF. In the southeast grassland area with higher GVF, the soil temperature in winter and spring is higher than that in open shrubs and barren land, while in the lush vegetation growing season in summer, the soil temperature over the barren land is higher than that of open shrubland and grassland; the soil temperature in four soil layers all gradually decreases with increasing depth, and the annual averaged soil temperature of open shrubs in each layer is below 0°C. The soil temperature of the three underlying surfaces shows that the fluctuation of soil temperature gradually decreases with the increase of soil depth. In addition, the time for the deep soil temperature to reach the peak value lags behind the shallow layer by about one or two months.
It can be seen from Table 3 that the soil moisture over the different underlying surfaces in HRADC is the highest in the grassland, followed by open shrubs, and the lowest in the barren or sparsely vegetated. The averaged values of soil temperature over grassland, open shrubland and barren land are 0.25, 0.23, and 0.16 cm3·cm−3 respectively. Since the precipitation over grassland began to increase gradually in March, and reach the peak value (65 mm/m) in June, so the soil moisture of 0–10 cm began to increase slowly on the 90th day, and reach a peak value (0.29 cm3·cm−3 in about 180th days), and then showed a downward trend of fluctuations (Figure 7E). The soil moisture over the open shrubland remained at 0.23 cm3·cm−3 from 0 to 160 days. After 160 days, the 0–10 cm soil moisture increased to 0.26 cm3·cm−3, which may be due to increased precipitation after June, and vegetation began to grow, and water retention by vegetation roots increases soil moisture. Since there is sparsely vegetation growth over barren land, the 0–10 cm soil moisture has almost no obvious increase from April to September with more precipitation. The 10–40 and 40–100 cm layers soil moisture over barren land began to increase after 150 days. It may be due to the lack of water retention of the vegetation root system. The upper layer soil water will reach the deep soil layer through infiltration (Figures 7F,G). The peak value of soil moisture in the deep layer (40–100 and 100–200 cm) over three underlying surfaces is one or two months behind the upper layer (0–10 cm). The annual averaged 100–200 cm soil moisture over the three underlying surfaces is 0.24, 0.22, and 0.13 cm3·cm−3 respectively, with grassland being the highest value and barren land being the lowest value. It is worth noting that there is no obvious peak value of soil moisture over barren land. This may be due to less precipitation in the northwest of the QTP, and it is difficult for the shallow soil moisture to reach deep layer through infiltration after precipitation (Figure 7H). In our study, the soil moisture value of grasslands is closed to other studies. In the northeast QTP, at Tuouohe, Anduo, and Tanggula (ranging from 0.1 to 0.25 cm3·cm−3) (Cuo et al., 2015) and approximately equal to that of the Loess Plateau in middle north China (range from 0.15 to 0.35 cm3·cm−3) (Jia et al., 2017).
The soil moisture in the QTP has obvious seasonal variation. As the spring warms up, the frozen soil begins to melt and the soil moisture is increasing, while in winter the soil begins to freeze and the soil moisture decreases. In spring, the snow begins to melt, and vegetation gradually begins to grow. At this time, the soil temperature is above 0°C. The southwestern plateau area with high vegetation coverage has better soil water retention and higher soil water content, which is beneficial to the growth of grass. However, the soil water content in the western and northern regions of the plateau is lower. After the frozen water melts, the soil water provided for vegetation growth is not enough, and the vegetation grows slowly, which lead to the vegetation types in this area are mainly open shrubland and barren land. In winter, the soil water begins to freeze gradually, and the soil moisture decreases and the GVF begins to decreases.
In general, the distribution characteristics of the annual averaged soil moisture are simulated well by HRADC over grassland, open shrubland and barren land of the QTP. For grassland, the GVF increases rapidly after April, and reaching about 60% in August, and the precipitation exceeds 60 mm/m from May to July, which is beneficial to increase the soil water content of the underlying surface, especially the shallow soil water content. The peak value of GVF over open shrubland and barren land is only about 20 and 5%, respectively. Because of the precipitation is only half of the grassland underlying surface in May and June, the soil moisture is much lower than the grassland. The spatial distribution of soil moisture on different underlying surfaces in the QTP is also similar to the spatial distribution of land use types and vegetation types in Figure 2. The soil moisture gradually decreases from the southeast to the northwest in the QTP (figure omitted), which is consistent with Xia et al. (2019)’s results. It can be seen from Figure 7 that the annual daily averaged soil moisture of the three underlying surfaces in the QTP fluctuate more drastically and gradually increase from the 150 day of the year, which is due to the increase in spring precipitation. The variation of the shallow layer soil moisture is more acutely than that in the deep layer, and the fluctuation of soil moisture tends to be stable and begins to decrease after about 250 days. Since the soil moisture is also affected by the amount of evaporation, the area with a large vegetation coverage has a small amount of evaporation (Martens et al., 2017). Since April, the vegetation on the plateau is in the growing period, the vegetation coverage continues to increase, and the evaporation continues to decrease, so the soil moisture will also remain high, resulting in the difference in the shallow soil moisture of the three different underlying surfaces. The data used to analyze soil temperature, moisture and GVF in this study are from HRADC, which only indicates that WRF can reproduce the impacts of different underlying surface on soil temperature and moisture.
The observed flux data of ALI (79.7°E, 33.4°N), NAMORS (91.0°E, 30.8°N), and SETORS (94.7°E, 29.7°N) are compared with HRADC. The flux stations of ALI, NAMORS and SETORS represent the typical barren land surface, open shrub land and grassland/forest in the QTP, respectively. It is found that the observed value of latent heat flux is agree well with the simulated value, but the simulated value of sensible heat flux over the barren land is over 150 W·m−2 in summer in ALI flux station. The observed peak value of sensible heat flux is only 70 W·m−2, and the simulated value is more than twice of observation (Figure 8). The sensible heat flux in HRADC is generally higher in barren land region over the western QTP, resulting in a higher net radiation in this region. Wang and Shi (2007) also found that in the western QTP, the sensible heat flux dominates the heat energy balance in summer, followed by the latent heat fluxes. But during the rainy season, the latent heat flux cannot be ignored. Chen and Sun (2005) analyzed the energy balance of the grassland at Qamdo in the eastern QTP, and found that the peak value of latent heat, sensible heat flux and net radiation reached 300, 200, and 600 W·m−2 in August, respectively, and which were consistent with the results of HRADC.
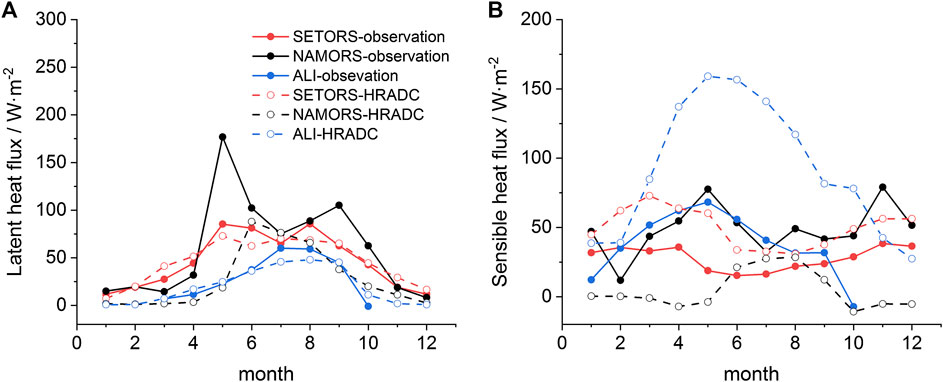
FIGURE 8. Comparison of monthly averaged observations and High-Resolution Assimilation Dataset of the Water-Energy Cycle in China simulations, from three flux stations in Qinghai-Tibet Plateau, (A) latent heat flux and (B) sensible heat flux (Unit: W·m−2).
The values of latent heat flux in HRADC are higher during the vegetation growing season and the values over grassland, open shrubland, and barren or sparsely vegetated are 89.6, 81.3, and 28.1 W·m−2, respectively. The latent heat flux over the grassland is the highest in each month throughout the year, followed by open shrubland and barren land. There is less GVF over the barren land in the central and northern QTP, which leads to a decrease in vegetation evapotranspiration and a decrease in latent heat transport. An increase in surface temperature leads to an increase in sensible heat transport and an increase in soil energy transfer to the atmosphere, indicating a significant change in GVF changed the distribution ratio of energy transmission between land surface and atmosphere (Chu et al., 2005; Pan et al., 2012). The value of latent heat flux over the open shrubland is higher than that of grassland and barren land throughout the year, and the latent heat flux gradually decreases from southeast to northwest, which is consistent with the regional distribution of simulated latent heat flux of the QTP by Lv and Ji (2002). Due to differences in precipitation and vegetation distribution, there are differences in latent heat fluxes on different underlying surfaces. The vegetation on the grassland is lush in the growth period, and has more precipitation in summer, so the latent heat flux is higher, while the latent heat over open shrubland and barren land is lower. The peak values of latent heat flux from HRADC and ERA5 are very similar on the grassland, but the peak value of latent heat flux in ERA5 (70 W·m−2) is much higher than that of HRADC (28 W·m−2) over the barren ground, and the peak value in HRADC (81 W·m−2) was higher than ERA5 (55 W·m−2) over the open shrubland. Since the 0–10 cm layer soil moisture over the barren land is only 0.18 cm3·cm−3 in HRADC, which is lower than that of grassland and open shrubland, this may be the reason for the lower latent heat flux over the barren land.
The peak value of sensible heat flux over grassland, open shrubland, and barren or sparsely vegetated in HRADC are 90.4, 133.2, and 123.5 W·m−2, respectively (Figure 9B). Li et al. (2002) analyzed the observed surface sensible heat flux at the four flux stations in Lhasa, Shigatse, Naqu and Nyingchi, and pointed out that the maximum value of sensible heat is from May to June, and the minimum value occurs in December. This is similar to the variation of sensible heat flux found in this study: the sensible heat flux over three different underlying surfaces reaches its maximum value from April to June, and gradually decreases after June, and reaches its minimum value in December. It also can be seen from Figure 9B that the sensible heat flux over grassland and open shrubland has a rapid downward trend from June to September after reaching the peak value. This may be due to the vegetation growth period of the plateau and the rainy season from June to September. Increased GVF will increase latent heat transport, reduce the temperature difference between land surface and atmosphere, and reduce the sensible heat flux (Chen et al., 2016). Over the three different underlying surfaces, the peak value of the sensible heat flux in HRADC is higher than in ERA5 in summer, and the sensible heat flux in ERA5 is almost the same (range from 10 to 40 W·m−2). This may be caused by overestimation of soil moisture in ERA5. The 0–7 cm layer soil moisture can reach about 0.4 cm3·cm−3 over the grassland in ERA5, and the peak value over the barren land also reaches about 0.25 cm3·cm−3 in summer (figure omitted). Higher soil moisture will cause a decrease in sensible heat flux.
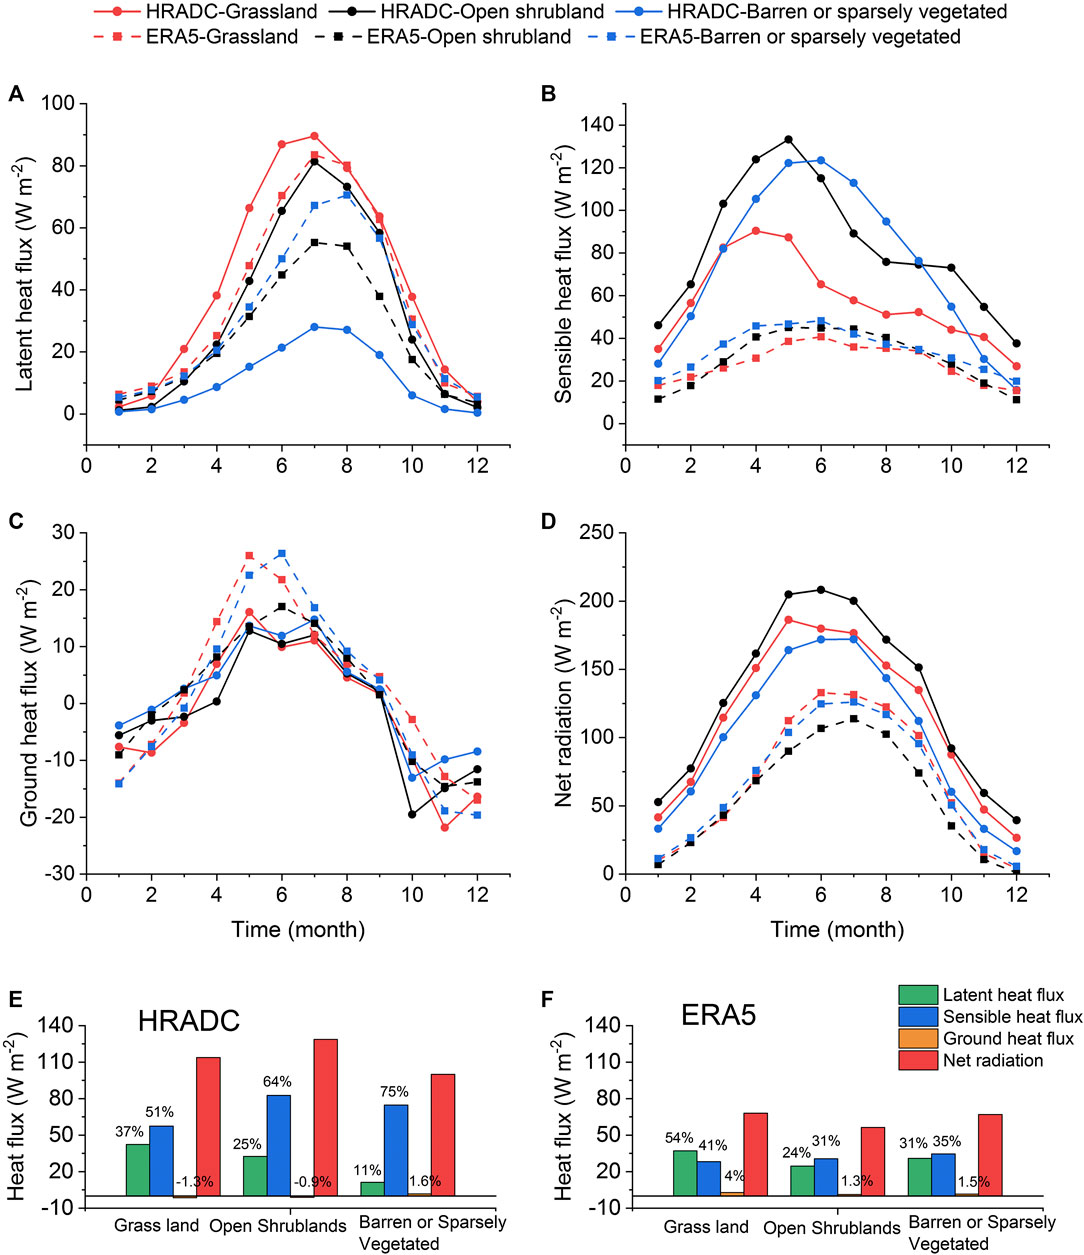
FIGURE 9. The comparison of surface energy flux and net radiation between High-Resolution Assimilation Dataset of the Water-Energy Cycle in China and ERA5 over Grassland (red line), Open shrubland (black line), and Barren or sparsely vegetated (blue line) in the Qinghai-Tibet Plateau (Unit: W·m−2). (A) latent heat flux, (B) sensible heat flux, (C) ground heat flux, (D) net radiation, and the histogram of energy distribution proportion (E,F).
Figure 9C shows the variation trend of ground heat flux on different underlying surfaces. Positive values indicate the heat transfer from the ground surface to the soil, and vice versa. The ground heat flux on different underlying surfaces range from -20 to 20 W·m−2 throughout the year, and reaches the peak value from May to July. The ground heat flux during April to September is positive, which indicating the soil obtains heat from the ground in growing season, and the energy heat transfers from soil to the ground surface from October to March in the non-growing season. The changes of ground heat flux would be affected by the freezing-thawing cycle of frozen soil. As seen in Figure 9C, the maximum positive value of ground heat flux is from April to June, which is the main thawing period of the frozen soil on the TP, while the maximum negative value is from October to December, which is the freezing period of the frozen soil on the TP. The main reason is that the ground heat flux from the atmosphere to the soil is increased in thawing period due to the absorption of phase change energy of thawing soil, while the ground heat flux from the soil to the atmosphere is also increased (negative decreasing) in freezing period due to the release of phase change energy of freezing soil. Similar results were found in numerical simulations (Chen et al., 2014; Chen et al., 2017).
Figure 9D shows the variation trend of net radiation on different underlying surfaces. The net radiation value over the open shrubland was the highest throughout the year, followed by grassland and barren land. The annual averaged net radiation values over grassland, open shrubland and barren land in HRADC are 113.8, 128.7, and 100 W·m−2, respectively. The peak value of net radiation on different underlying surfaces is from May to July, and showed a clear single peak shape. The variation trend of net radiation is closely related to the surface albedo. Some studies have shown that the peak value of net radiation over the Oasis is about 150 W·m−2 higher than that of the Gobi through numerical simulation in the northwest arid region in China (Meng et al., 2009; Wen et al., 2012). The above studies shows that the areas with more GVF have lower surface albedo, and the more surface energy income. In areas with less GVF, the surface albedo is higher, and the energy of the surface income will be less, which is the energy loss area. Figure 9E is a histogram of energy distribution proportion of different underlying surfaces. It can be seen that over the three types of underlying surfaces show that the ratio of sensible heat flux to net radiation (50.5%, 64.2%, and 74.8%, respectively) is higher than the ratio of latent heat flux to net radiation (37.3%, 25.3%, and 11.2%, respectively). However, there is a slight difference over different underlying surfaces. The proportion of latent heat flux over grassland (37.3%) is higher than that of open shrubs (25.3%) and barren ground (11.2%). The three types of underlying surfaces have the highest proportion of sensible heat flux (all above 50%), which indicating that the heat transfer between surface and atmosphere over different underlying surfaces in the QTP is dominated by sensible heat, and in areas with scarce vegetation, the more proportion of sensible heat.
Figure 10 shows the regional distribution of the monthly mean values of latent heat, sensible heat, surface heat flux, and net radiation in HRADC and ERA5. It can be seen that the sensible heat flux can reach more than 100 W·m−2 in the western QTP with scarce vegetation, but only about 50 W·m−2 in the eastern QTP with more GVF (Figure 10B); while the latent heat flux is below 200 W·m−2 in the northern part of the QTP, and the latent heat can reach more than 60 W·m−2 in the southeastern QTP (Figure 10A), indicating that the area with higher GVF also has higher latent heat transmission, while with the lower GVF and lower soil moisture, the energy transmission is mainly sensible heat flux between land surface and atmosphere. As can be seen from the distribution of ground heat flux (Figure 10C), the ground heat flux in the southern part in the QTP is positive, while the northern part is negative, indicating that the soil in the southern part mainly absorbs surface energy throughout the year, while soil in the northern part releases energy to the land surface. The regional distribution of net radiation is also the same. The net radiation value in the southern part of the QTP is larger than the northern part, indicating that the southern plateau receives more energy than the northern part. The latent heat flux in HRADC over the southeastern part of the QTP is significantly higher than ERA5, and much lower than ERA5 over the northern part of the plateau. The sensible heat flux in the central and western parts of the plateau is less than 50 W·m−2 in ERA5, almost only half of that in HRADC. The spatial distribution of net radiation also shows that the net radiation of the entire plateau region in ERA5 is almost only about half that of HRADC, which is consistent with Figure 9. As the soil moisture in QTP may be overestimated in ERA5, it will cause a decrease in sensible heat flux and net radiation.
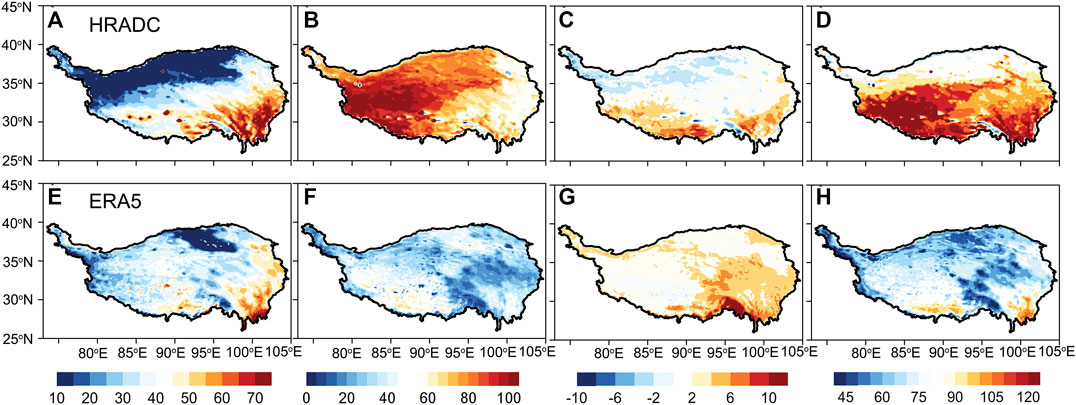
FIGURE 10. The comparison of spatial distribution of heat fluxes between High-Resolution Assimilation Dataset of the Water-Energy Cycle in China and ERA5 in the Qinghai-Tibet Plateau (Unit: W·m−2). (A,E) latent heat flux, (B,F) sensible heat flux, (C,G) ground heat flux, and (D,H) net radiation.
Figure 11 is a schematic diagram of the water-energy cycle over process on different underlying surfaces. Although there is the highest albedo on the grassland, since the entire grassland area is in the southeast of the QTP, it receives more downward shortwave radiation, so it has acquired the medium net radiation. The grassland also acquires the maximum precipitation, GVF and soil moisture, so there is the maximum latent heat flux on grassland. Since there is a minimum albedo on the open shrubland, the net radiation is the maximum. However, due to the open shrubland has acquired the medium precipitation, soil moisture and GVF, the latent heat flux value is medium. As the entire area of the barren land is over the northern part of the QTP, it has acquired the lowest net radiation, and the minimum precipitation, GVF and soil moisture, so the latent heat flux is the lowest and the sensible heat flux is the highest.
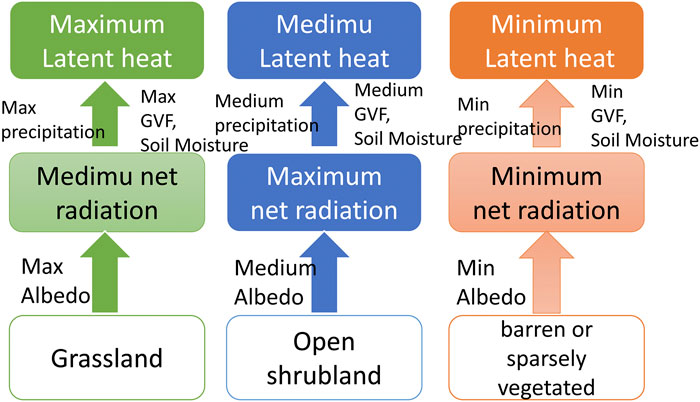
FIGURE 11. The physical processes schematic diagram of water-energy cycle over different underlying surfaces.
The multi-source data of different spatial and temporal scales are added into the WRF model initial field, and the observations of surface weather stations are assimilated into the WRF model. The HRADC generated by WRF model can effectively improve the water and energy cycle process on the inhomogeneous underlying surfaces. HRADC outputs can applied to research of climate change and monitoring of arid environments in the QTP in China. The main conclusions are as follows:
(1) The GVF of HRADC shows a decreasing trend from southeast to northwest on the QTP. The vegetation of the plateau entered the growth period in May and reached its peak in August. The GVF of the grassland in the southeastern QTP can reach more than 60% in summer, about 20% in open shrubland, and only 5% in barren or sparsely vegetated areas. Although the precipitation over the open shrubland can reach about 50 mm from July to September, the GVF has not increased rapidly, indicating that precipitation is not the only factor affecting GVF, and may also be related to temperature and soil moisture.
(2) The soil temperature showed a gradual decrease trend from the shallow layer to the deep layer. The time for the deep soil temperature to reach the peak lags behind the shallow layer by one or two months, indicating that the soil has a significant heat storage effect. In winter and spring, the soil temperature over grassland is higher than that in shrubland and barren land, while in summer when vegetation is flourishing, the soil temperature over barren land is higher than that in open shrubland and grassland.
(3) The annual averaged soil moisture value in four layers over grassland is higher than that of open shrubland and barren land, and the soil moisture in shallow layers (0–10 cm) in three different underlying surfaces is 0.26, 0.23, and 0.18 cm3·cm−3, respectively. The variation trend of soil moisture is consistent with the precipitation, which decreasing from the southeast to the northwest of the plateau.
(4) The surface energy and radiation characteristics in different underlying surfaces in HRADC are as follows: the sensible heat flux over the grassland is lower than shrubland and barren land, and the peak value in April is only 80 W·m−2, and the latent heat flux is up to 90 W·m−2 in July. The net radiation value over barren land is the highest, which is up to 210 W·m−2. The latent heat transport at the barren land over the central and northern QTP is low, while the sensible heat transport is high, and the energy transfers from land surface to the atmosphere.
(5) The latent heat flux in HRADC over the southeastern part of QTP was significantly higher than that in ERA5, and in the northern part of the plateau was significantly lower than in ERA5. The sensible heat flux in the Midwest of the plateau was less than 50 W·m−2 in ERA5, almost half of that in HRADC. The net radiation in ERA5 of the entire QTP region is almost half in HRADC.
The raw data supporting the conclusions of this article will be made available by the authors, without undue reservation.
This research was supported by the National Natural Science Foundation of China (Grant No. 41975096), the Second Tibetan Plateau Scientific Expedition and Research (STEP) program (Grant No. 2019QZKK0103).
The authors declare that the research was conducted in the absence of any commercial or financial relationships that could be construed as a potential conflict of interest.
We thank the editor and reviewers for their valuable comments leading to improvements of this manuscript.
Bao, X., and Zhang, F. (2013). Evaluation of NCEP-CFSR, NCEP-NCAR, ERA-Interim, and ERA-40 reanalysis datasets against independent sounding observations over the Tibetan Plateau. J. Clim. 26, 206–214. doi:10.1175/jcli-d-12-00056.1
Bhati, S., and Mohan, M. (2016). WRF model evaluation for the urban heat island assessment under varying land use/land cover and reference site conditions. Theor. Appl. Climatol. 126, 385–400. doi:10.1007/s00704-015-1589-5
Bonan, G. B., Oleson, K. W., Vertenstein, M., Levis, S., Zeng, X., Dai, Y., et al. (2002). The land surface climatology of the community land model coupled to the NCAR community climate model*. J. Climate. 15, 3123–3149. doi:10.1175/1520-0442(2002)015<3123:tlscot>2.0.co;2
Cahill, A. T., and Parlange, M. B. (1998). On water vapor transport in field soils. Water Resour. Res. 34, 731–739. doi:10.1029/97wr03756
Carabajal, C. C., and Harding, D. J. (2005). ICESat validation of SRTM C‐band digital elevation models. Geophys. Res. Lett. 32, L22S01. doi:10.1029/2005gl023957
Chen, B., Luo, S., Lü, S., Zhang, Y., and Ma, D. (2014). Effects of the soil freeze-thaw process on the regional climate of the Qinghai-Tibet Plateau. Clim. Res. 59, 243–257. doi:10.3354/cr01217
Chen, B. L., Luo, S. Q., Lv, S. H., et al. (2017). Land surface characteristics in soilfreezing and thawing processon the Tibetan Plateau based on community land model. J. Glaciol. Geocryol. 39, 760–770. doi:10.7522/j.issn.1000-0240.2017.0086
Chen, F., and Dudhia, J. (2001). Coupling an advanced land surface-hydrology model with the Penn State-NCAR MM5 modeling system. Part I: model implementation and sensitivity. Mon. Wea. Rev. 129, 569–585. doi:10.1175/1520-0493(2001)129<0569:caalsh>2.0.co;2
Chen, H. S., and Sun, Z. B. (2005). Simulation of land-atmosphere exchange processes at amdo and gaize stations over Qinghai-Xizang Plateau. Plateau Meteorol. 1, 15. doi:10000534(2005)01-0009-07
Chen, J., Wen, J., Tian, H., Zhang, T., Yang, X., Jia, D., and Lai, X. (2018). A study of soil thermal and hydraulic properties and parameterizations for CLM in the SRYR. J. Geophys. Res. Atmos. 123, 8487–8499. doi:10.1029/2017jd028034
Chen, L., Zhang, R., Pryor, S. C., Li, X., and Wang, H. (2020). Influence of wintertime surface sensible heat flux variability over the central and eastern Tibetan Plateau on the East Asian winter monsoon. Clim Dyn. 54, 4589–4603. doi:10.1007/s00382-020-05246-x
Chen, Y. H., Fan, G. Z., Lai, X., Hua, W., Zhang, Y. L., Wang, B. Y., et al. (2016). Characteristics of seasonal variations of energy and water cycles over the complex underlying surface of the Tibetan Plateau. Climat. Environ. Res. 21, 586–600. doi:10000534(2005)01-0009-07
Choudhury, B. J., Schmugge, T. J., and Mo, T. (1982). A parameterization of effective soil temperature for microwave emission. J. Geophys. Res. 87, 1301–1304. doi:10.1029/jc087ic02p01301
Chu, P. C., Lu, S., and Chen, Y. (2005). A numerical modeling study on desert oasis self-supporting mechanisms. J. Hydrol. 312, 256–276. doi:10.1016/j.jhydrol.2005.02.043
Corbari, C., Salerno, R., Ceppi, A., Telesca, V., and Mancini, M. (2019). Smart irrigation forecast using satellite LANDSAT data and meteo-hydrological modeling. Agric. Water Manage. 212, 283–294. doi:10.1016/j.agwat.2018.09.005
Cui, Y., and Wang, C. (2009). Comparison of sensible and latent heat fluxes during the transition season over the western Tibetan Plateau from reanalysis datasets. Prog. Nat. Sci. 19, 719–726. doi:10.1016/j.pnsc.2008.11.001
Cuo, L., Zhang, Y., Bohn, T. J., Zhao, L., Li, J., Liu, Q., et al. (2015). Frozen soil degradation and its effects on surface hydrology in the northern Tibetan Plateau. J. Geophys. Res. Atmos. 120, 8276–8298. doi:10.1002/2015jd023193
Dall’Osso, F., Bovio, L., Cavalletti, A., Immordino, F., Gonella, M., and Gabbianelli, G. (2010). A novel approach (the CRATER method) for assessing tsunami vulnerability at the regional scale using ASTER imagery. Italian J. Remote Sens. 42, 55–74. doi:10.5721/ItJRS20104225
Dickinson, R. E. (1983). “Land surface processes and climate—Surface albedos and energy balance,” in Advances in geophysics. Editor B. Saltzman (Amsterdam, Netherlands: Elsevier), Vol. 25, 305–353.
Dragani, R., Hersbach, H., Poli, P., Pebeuy, C., Hirahara, S., Simmons, A., et al. (2015). “Recent reanalysis activities at ECMWF: results from ERA-20C and plans for ERA5,” in American Geophysical Union, Fall Meeting 2015, Washington, D.C., December 2015 [abstract].
Duveiller, G., Hooker, J., and Cescatti, A. (2018). The mark of vegetation change on Earth’s surface energy balance. Nat. Commun. 9, 679. doi:10.1038/s41467-017-02810-8
Feng, J., Li, J., Li, Y., Zhu, J., and Xie, F. (2015a). Relationships among the monsoon-like southwest Australian circulation, the southern annular mode, and winter rainfall over southwest western Australia. Adv. Atmos. Sci. 32, 1063–1076. doi:10.1007/s00376-014-4142-z
Feng, J., Li, J., Zhu, J., Li, F., and Sun, C. (2015b). Simulation of the equatorially asymmetric mode of the Hadley circulation in CMIP5 models. Adv. Atmos. Sci. 32, 1129–1142. doi:10.1007/s00376-015-4157-0
Frauenfeld, O. W., Zhang, T., and Serreze, M. C. (2005). Climate change and variability using European Centre for Medium-Range Weather Forecasts reanalysis (ERA-40) temperatures on the Tibetan Plateau. J. Geophys. Res. 110, D02101. doi:10.1029/2004jd005230
Friedl, M. A., Sulla-Menashe, D., Tan, B., Schneider, A., Ramankutty, N., Sibley, A., et al. (2010). MODIS collection 5 global land cover: algorithm refinements and characterization of new datasets. Remote Sens. Environ. 114, 168–182. doi:10.1016/j.rse.2009.08.016
Fu, P., and Rich, P. M. (2002). A geometric solar radiation model with applications in agriculture and forestry. Comput. Electron. Agric. 37, 25–35. doi:10.1016/s0168-1699(02)00115-1
Ge, J., Ye, Y. U., Xie, J., and Zan, B. (2017). A study on responses of surface energy partitioning to climatic factors on two types of underlying surface over Qinghai–Xizang plateau. Chin. J. Atmos. Sci. 41, 918–932. doi:10.3878/j.issn.1006-9895.1703.16200
Gorokhovich, Y., and Voustianiouk, A. (2006). Accuracy assessment of the processed SRTM-based elevation data by CGIAR using field data from USA and Thailand and its relation to the terrain characteristics. Remote Sens. Environ. 104, 409–415. doi:10.1016/j.rse.2006.05.012
Gu, L., Yao, J., Hu, Z., and Zhao, L. (2015). Comparison of the surface energy budget between regions of seasonally frozen ground and permafrost on the Tibetan Plateau. Atmos. Res. 153, 553–564. doi:10.1016/j.atmosres.2014.10.012
Guo, D., Yang, M., and Wang, H. (2011). Sensible and latent heat flux response to diurnal variation in soil surface temperature and moisture under different freeze/thaw soil conditions in the seasonal frozen soil region of the central Tibetan Plateau. Environ. Earth Sci. 63, 97–107. doi:10.1007/s12665-010-0672-6
Hansson, K., Simunek, J., Mizoguchi, M., Lundin, L.-C., and van Genuchten, M. T. (2004). Water flow and heat transport in Frozen soil: numerical solution and Freeze-Thaw applications. Vadose Zone J. 3, 693–704. doi:10.2136/vzj2004.0693
Hersbach, H., Bell, B., Berrisford, P., Hirahara, S., Horànyi, A., Muñoz‐Sabater, J., et al. (2020). The ERA5 global reanalysis. Q. J. R. Meteorol Soc. 146, 1999–2049. doi:10.1002/qj.3803
Hinkel, K. M., Paetzold, F., Nelson, F. E., and Bockheim, J. G. (2001). Patterns of soil temperature and moisture in the active layer and upper permafrost at Barrow, Alaska: 1993-1999. Global Planet. Change. 29, 293–309. doi:10.1016/s0921-8181(01)00096-0
Hu, G.-j., Tian, L.-m., Zhao, L., Wu, X.-d., Li, R., Wu, T.-h., et al. (2018). Soil infiltration processes of different underlying surfaces in the permafrost region on the Tibetan Plateau. Hydrol. Sci. J. 63, 1733–1744. doi:10.1080/02626667.2018.1500745
Jia, X., Shao, M., Zhu, Y., and Luo, Y. (2017). Soil moisture decline due to afforestation across the Loess Plateau, China. J. Hydrol. 546, 113–122. doi:10.1016/j.jhydrol.2017.01.011
Kiamehr, R., and Sjöberg, L. E. (2005). Effect of the SRTM global DEM on the determination of a high-resolution geoid model: a case study in Iran. J. Geodesy. 79, 540–551. doi:10.1007/s00190-005-0006-8
Lawrence, D. M., and Slater, A. G. (2010). The contribution of snow condition trends to future ground climate. Clim. Dyn. 34, 969–981. doi:10.1007/s00382-009-0537-4
Li, G. P., Duan, T. Y., Gong, Y. F., and Lu, H. G. (2002). A composite study of the surface fluxes on the Tibetan Plateau. Acta Meteorol. Sin. 60, 453–460.
Li, Y., Liu, X., and Li, W.-P. (2012). Numerical simulation of land surface process at different underlying surfaces in Tibetan Plateau. Plateau Meteorol. 31, 581–591. doi:10.1007/s11783-011-0280-z
Liu, X., Yin, Z. Y., Shao, X., and Qin, N. (2006). Temporal trends and variability of daily maximum and minimum, extreme temperature events, and growing season length over the eastern and central Tibetan Plateau during 1961–2003. J. Geophys. Res. Atmos. 111, D19109. doi:10.1029/2005JD006915
Lotsch, A., Friedl, M. A., Anderson, B. T., and Tucker, C. J. (2003a). Coupled vegetation‐precipitation variability observed from satellite and climate records. Geophys. Res. Lett. 30, 1774. doi:10.1029/2003gl017506
Lotsch, A., Tian, Y., Friedl, M. A., and Myneni, R. B. (2003b). Land cover mapping in support of LAI and FPAR retrievals from EOS-MODIS and MISR: Classification methods and sensitivities to errors. Int. J. Remote Sens. 24, 1997–2016. doi:10.1080/01431160210154858
Ludwig, R., and Schneider, P. (2006). Validation of digital elevation models from SRTM X-SAR for applications in hydrologic modeling. ISPRS J. Photogramm. Remote Sens. 60, 339–358. doi:10.1016/j.isprsjprs.2006.05.003
Luo, S., Fang, X., Lyu, S., Jiang, Q., and Wang, J. (2017). Interdecadal changes in the freeze depth and period of frozen soil on the three rivers source region in China from 1960 to 2014. Adv. Meteorol. 2017, 1–14. doi:10.1155/2017/5931467
Lu, J. H., and Ji, J. J. (2002). A simulation study of atmosphere-vegetation interaction over the Tibetan Plateau. Part Ⅱ: net primary productivity and leaf area index. Chin. J. Atmos. Sci., 26, 255–262.
Ma, Y., Ma, W., Zhong, L., Hu, Z., Li, M., Zhu, Z., et al. (2017). Monitoring and modeling the Tibetan Plateau’s climate system and its impact on East Asia. Sci. Rep. 7, 44574. doi:10.1038/srep44574
Ma, Y. M. (2020). A Long-Term (2005-2016) Dataset of Integrated Land-Atmosphere Interaction Observations on the Tibetan Plateau. Beijing, China: National Tibetan Plateau Data Center.
Martens, B., Miralles, D. G., Lievens, H., van der Schalie, R., and de Jeu, R. A. M., Fernández-Prieto, D., et al. (2017). GLEAM v3: satellite-based land evaporation and root-zone soil moisture. Geosci. Model Dev. 10, 1903–1925. doi:10.5194/gmd-10-1903-2017
Meng, X. H., Lu, S. H., Zhang, T. T., Guo, J. X., Gao, Y. H., Bao, Y., et al. (2009). Numerical simulations of the atmospheric and land conditions over the Jinta oasis in northwestern China with satellite-derived land surface parameters. J. Geophys. Res. Atmos. 114, 100–120. doi:10.1029/2008jd010360
Moya-Álvarez, A. S., Martínez-Castro, D., Kumar, S., Estevan, R., and Silva, Y. (2019). Response of the WRF model to different resolutions in the rainfall forecast over the complex Peruvian orography. Theor. Appl. Climatol. 137, 2993–3007. doi:10.1007/s00704-019-02782-3
Muzylev, E. L., Startseva, Z. P., Uspensky, A. B., and Volkova, E. V. (2018). Modeling water and heat balance components for large agricultural region utilizing information from meteorological satellites. Water Resour. 45, 672–684. doi:10.1134/s0097807818050147
Naranjo-Mendoza, C., Wright, A. J., Oyinlola, M. A., and Greenough, R. M. (2018). A comparison of analytical and numerical model predictions of shallow soil temperature variation with experimental measurements. Geothermics 76, 38–49. doi:10.1016/j.geothermics.2018.06.003
Nicholson, S. (2000). Land surface processes and Sahel climate. Rev. Geophy. 38, 117–139. doi:10.1029/1999rg900014
Nielsen, J. R., Dellwik, E., Hahmann, A. N., and Boegh, E. (2013). “Updated vegetation information in high resolution WRF simulations,” in IAHS-IAPSO-IASPEI joint assembly. Wallingford, UK: IAHS Press, 233–238.
Nikolakopoulos, K. G., Kamaratakis, E. K., and Chrysoulakis, N. (2006). SRTM vs ASTER elevation products. Comparison for two regions in Crete, Greece. Int. J. Remote Sens. 27, 4819–4838. doi:10.1080/01431160600835853
Niu, G. Y., Yang, Z. L., Mitchell, K. E., Chen, F., Ek, M. B., Barlage, M., et al. (2011). The community Noah land surface model with multiparameterization options (Noah‐MP): 1. model description and evaluation with local‐scale measurements. J. Geophys. Res. Atmos. 116, D12109. doi:10.1029/2010JD015139
Noilhan, J., and Planton, S. (1989). A simple parameterization of land surface processes for meteorological models. Mon. Wea. Rev. 117, 536–549. doi:10.1175/1520-0493(1989)117<0536:aspols>2.0.co;2
Novák, V., and Hlaváčiková, H. (2019). “Soil temperature and heat transport in soils,” in Applied soil hydrology. Berlin, Germany: Springer, 303–318.Google Scholar
Pan, X., Li, X., Shi, X., Han, X., Luo, L., and Wang, L. (2012). Dynamic downscaling of near-surface air temperature at the basin scale using WRF-a case study in the Heihe River Basin, China. Front. Earth Sci. 6, 314–323. doi:10.1007/s11707-012-0306-2
Peng, Z., Tian, F., Wu, J., Huang, J., Hu, H., and Darnault, C. J. G. (2016). A numerical model for water and heat transport in freezing soils with nonequilibrium ice-water interfaces. Water Resour. Res. 52, 7366–7381. doi:10.1002/2016wr019116
Potts, L. V., Akyilmaz, O., Braun, A., and Shum, C. K. (2008). Multi‐resolution dune morphology using Shuttle Radar Topography Mission (SRTM) and dune mobility from fuzzy inference systems using SRTM and altimetric data. Int. J. Remote Sens. 29, 2879–2901. doi:10.1080/01431160701408352
Reuter, H. I., Nelson, A., and Jarvis, A. (2007). An evaluation of void‐filling interpolation methods for SRTM data. Int. J. Geogr. Inf. Sci. 21, 983–1008. doi:10.1080/13658810601169899
Ruan, J., Wen, X., Fan, G., Li, D., Hua, W., Wang, B., et al. (2017). Comparative analysis of different underlying surfaces using a high-resolution assimilation dataset in semi-arid areas in China. Theor. Appl. Climatol. 134, 817–828. doi:10.1007/s00704-017-2311-6
Running, S. W., Loveland, T. R., Pierce, L. L., Nemani, R. R., and Hunt, E. R. Jr. (1995). A remote sensing based vegetation classification logic for global land cover analysis. Remote Sens. Environ. 51, 39–48. doi:10.1016/0034-4257(94)00063-s
Salerno, F., Buraschi, E., Bruccoleri, G., Tartari, G., and Smiraglia, C. (2008). Glacier surface-area changes in Sagarmatha national park, Nepal, in the second half of the 20th century, by comparison of historical maps. J. Glaciol. 54, 738–752. doi:10.3189/002214308786570926
Schicker, I., Arnold Arias, D., and Seibert, P. (2016). Influences of updated land-use datasets on WRF simulations for two Austrian regions. Meteorol. Atmos. Phys. 128, 279–301. doi:10.1007/s00703-015-0416-y
Shao, A., Qiu, C., and Niu, G.-Y. (2015). A piecewise modeling approach for climate sensitivity studies: tests with a shallow-water model. J. Meteorol. Res. 29, 735–746. doi:10.1007/s13351-015-5026-6
Shi, Q., and Liang, S. (2014). Surface-sensible and latent heat fluxes over the Tibetan Plateau from ground measurements, reanalysis, and satellite data. Atmos. Chem. Phys. 14, 5659–5677. doi:10.5194/acp-14-5659-2014
Tian, H., Lan, Y., Wen, J., Jin, H., Wang, C., Wang, X., et al. (2015). Evidence for a recent warming and wetting in the source area of the Yellow River (SAYR) and its hydrological impacts. J. Geogr. Sci. 25, 643–668. doi:10.1007/s11442-015-1194-7
Urraca, R., Huld, T., Gracia-Amillo, A., Martinez-de-Pison, F. J., Kaspar, F., and Sanz-Garcia, A. (2018). Evaluation of global horizontal irradiance estimates from ERA5 and COSMO-REA6 reanalyses using ground and satellite-based data. Sol. Energy. 164, 339–354. doi:10.1016/j.solener.2018.02.059
Vahmani, P., and Ban-Weiss, G. A. (2016). Impact of remotely sensed albedo and vegetation fraction on simulation of urban climate in WRF-urban canopy model: a case study of the urban heat island in Los Angeles. J. Geophys. Res. Atmos. 121, 1511–1531. doi:10.1002/2015jd023718
Walker, W. S., Kellndorfer, J. M., and Pierce, L. E. (2007). Quality assessment of SRTM C- and X-band interferometric data: implications for the retrieval of vegetation canopy height. Remote Sens. Environ. 106, 428–448. doi:10.1016/j.rse.2006.09.007
Wang, C. H., and Shi, R. (2007). Simulation of the land surface processes in the Western Tibetan Plateau in summer. J. Glaciol. Geocryol. 29, 73–81. doi:10000240(2007)01-0073-09
Wang, G., Li, Y., Hu, H., and Wang, Y. (2008). Synergistic effect of vegetation and air temperature changes on soil water content in alpine frost meadow soil in the permafrost region of Qinghai-Tibet. Hydrol. Process. 22, 3310–3320. doi:10.1002/hyp.6913
Wang, J., and Bras, R. L. (1999). Ground heat flux estimated from surface soil temperature. J. Hydrol. 216, 214–226. doi:10.1016/s0022-1694(99)00008-6
Wang, M., Zhou, S., and Duan, A. (2012). Trend in the atmospheric heat source over the central and eastern Tibetan Plateau during recent decades: comparison of observations and reanalysis data. Chin. Sci. Bull. 57, 548–557. doi:10.1007/s11434-011-4838-8
Wen, X., Dong, W., Yuan, W., and Zheng, Z. (2015). Establishment and analysis of a high-resolution assimilation dataset of the water-energy cycle in China. Phys. Chem. Earth. 87–88, 126–141. doi:10.1016/j.pce.2015.09.016
Wen, X., Liao, X., Yuan, W., Yan, X., Wei, Z., Liu, H., et al. (2014). Numerical simulation and data assimilation of the water-energy cycle over semiarid northeastern China. Sci. China Earth Sci. 57, 2340–2356. doi:10.1007/s11430-014-4914-4
Wen, X., Lu, S., and Jin, J. (2012). Integrating remote sensing data with WRF for improved simulations of oasis effects on local weather processes over an arid region in northwestern China. J. Hydrometeorol. 13, 573–587. doi:10.1175/jhm-d-10-05001.1
Xia, S., Guangzhou, F., Yongli, Z., and Xin, L. (2019). Temporal and spatial variation characteristics of soil moisture at different layers of the Tibetan Plateau in summer. J. Arid Meteorol. 37, 252–261. doi:10.11755/j.issn.1006-7639(2019)-02-0252
Xie, A., Ren, J., Qin, X., and Kang, S. (2007). Reliability of NCEP/NCAR reanalysis data in the Himalayas/Tibetan Plateau. J. Geogr. Sci. 17, 421–430. doi:10.1007/s11442-007-0421-2
Xie, S., Qu, J., Xu, X., and Pang, Y. (2017). Interactions between freeze-thaw actions, wind erosion desertification, and permafrost in the Qinghai-Tibet Plateau. Nat. Hazards. 85, 829–850. doi:10.1007/s11069-016-2606-4
Xu, X., Chen, H., and Levy, J. K. (2008a). Spatiotemporal vegetation cover variations in the Qinghai-Tibet Plateau under global climate change. Sci. Bull. 53, 915–922. doi:10.1007/s11434-008-0115-x
Xu, X., Lu, C., Shi, X., and Gao, S. (2008b). World water tower: an atmospheric perspective. Geophys. Res. Lett. 35, L20815. doi:10.1029/2008gl035867
Yan, D., Liu, T., Dong, W., Liao, X., Luo, S., Wu, K., et al. (2020). Integrating remote sensing data with WRF model for improved 2-m temperature and humidity simulations in China. Dyn. Atmos. Oceans. 89, 101127. doi:10.1016/j.dynatmoce.2019.101127
Yang, J., and Ma, Y. (2012). Soil temperature and moisture features of typical underlying surface in the Tibetan Plateau. J. Glaciol. Geocryol. 34 (4), 813–820. doi:1000-0240(2012)04-0813-08
Yang, K., and Wang, J. (2008). A temperature prediction-correction method for estimating surface soil heat flux from soil temperature and moisture data. Sci. China Ser. D-Earth Sci. 51, 721–729. doi:10.1007/s11430-008-0036-1
Zhan, C., Shi, Q., and Liang, S. (2020). Assessing the impacts of the spring sensible heat flux over the Tibetan Plateau on Asian summer monsoon rainfall using observational and reanalysis data. Int. J. Climatol. 40, 2342–2358. doi:10.1002/joc.6336
Zhang, M., Wang, J., and Lai, Y. (2019). Hydro-thermal boundary conditions at different underlying surfaces in a permafrost region of the Qinghai-Tibet Plateau. Sci. Total Environ. 670, 1190–1203. doi:10.1016/j.scitotenv.2019.03.090
Zhang, M., Wen, Z., Xue, K., Chen, L., and Li, D. (2016). A coupled model for liquid water, water vapor and heat transport of saturated–unsaturated soil in cold regions: model formulation and verification. Environ. Earth Sci. 75, 701. doi:10.1007/s12665-016-5499-3
Zhang, Q., Zeng, J., and Zhang, L. (2012). Characteristics of land surface thermal-hydrologic processes for different regions over North China during prevailing summer monsoon period. Sci. China Earth Sci. 55, 1872–1880. doi:10.1007/s11430-012-4373-8
Zhang, R., and Zuo, Z. (2011). Impact of spring soil moisture on surface energy balance and summer monsoon circulation over East Asia and precipitation in East China. J. Clim. 24, 3309–3322. doi:10.1175/2011jcli4084.1
Zhang, Y., Chen, W., Smith, S. L., Riseborough, D. W., and Cihlar, J. (2005). Soil temperature in Canada during the twentieth century: complex responses to atmospheric climate change. J. Geophys. Res. Atmos. 110, D03112. doi:10.1029/2004JD004910
Zhang, Z., Qiu, C., and Wang, C. (2008). A piecewise-integration method for simulating the influence of external forcing on climate. Prog. Nat. Sci. 18, 1239–1247. doi:10.1016/j.pnsc.2008.05.003
Zhao, H., Huang, W., Xie, T., Wu, X., Xie, Y., Feng, S., et al. (2019). Optimization and evaluation of a monthly air temperature and precipitation gridded dataset with a 0.025 spatial resolution in China during 1951-2011. Theor. Appl. Climatol. 138, 491–507. doi:10.1007/s00704-019-02830-y
Zhao, T., Zhang, L., Shi, J., and Jiang, L. (2011). A physically based statistical methodology for surface soil moisture retrieval in the Tibet Plateau using microwave vegetation indices. J. Geophys. Res. Atmos. 116, D08116. doi:10.1029/2010jd015229
Zhao, Y., Zhu, J., Yan, X. U., and Center, N. M. (2014). Establishment and assessment of the grid precipitation datasets in China for recent 50 years. J. Meteorol. Sci. 34, 414–420. doi:10.3969/2013jms.0008
Zhu, X., Liu, Y., and Wu, G. (2012). An assessment of summer sensible heat flux on the Tibetan Plateau from eight data sets. Sci. China Earth Sci. 55, 779–786. doi:10.1007/s11430-012-4379-2
Keywords: Qinghai-Tibet plateau, high-resolution assimilation dataset of the water-energy cycle in China, heat flux, soil temperature and moisture, green vegetation fraction
Citation: Wen X, Liu C and Luo S (2020) Comparative Analysis of Water-Energy Cycle Processes Based on High-Resolution Assimilation Dataset of the Water-Energy Cycle in China Data Over Different Underlying Surfaces in Qinghai-Tibet Plateau. Front. Earth Sci. 8:576461. doi: 10.3389/feart.2020.576461
Received: 26 June 2020; Accepted: 07 September 2020;
Published: 01 October 2020.
Edited by:
Zhiwei Zhu, Nanjing University of Information Science and Technology, China
Reviewed by:
Chenghai Wang, Lanzhou University, China
Feng Juan, Beijing Normal University, China
Copyright © 2020 Wen, Liu and Luo. This is an open-access article distributed under the terms of the Creative Commons Attribution License (CC BY). The use, distribution or reproduction in other forums is permitted, provided the original author(s) and the copyright owner(s) are credited and that the original publication in this journal is cited, in accordance with accepted academic practice. No use, distribution or reproduction is permitted which does not comply with these terms.
*Correspondence: Xiaohang Wen, d2VuemVyZ0AxMjYuY29t
Disclaimer: All claims expressed in this article are solely those of the authors and do not necessarily represent those of their affiliated organizations, or those of the publisher, the editors and the reviewers. Any product that may be evaluated in this article or claim that may be made by its manufacturer is not guaranteed or endorsed by the publisher.
Research integrity at Frontiers
Learn more about the work of our research integrity team to safeguard the quality of each article we publish.