 Keir Becker
 Earl E. Davis2
 Martin Heesemann
 John A. Collins
 Jeffrey J. McGuire
- 1Rosenstiel School of Marine and Atmospheric Science, University of Miami, Miami, FL, United States
- 2Pacific Geoscience Centre, Geological Survey of Canada, Sidney, BC, Canada
- 3Ocean Networks Canada, University of Victoria, Victoria, BC, Canada
- 4Woods Hole Oceanographic Institution, Woods Hole, MA, United States
- 5U.S. Geological Survey, Menlo Park, CA, United States
We report 4 years of temperature profiles collected from May 2014 to May 2018 in Integrated Ocean Drilling Program Hole U1364A in the frontal accretionary prism of the Cascadia subduction zone. The temperature data extend to depths of nearly 300 m below seafloor (mbsf), spanning the gas hydrate stability zone at the location and a clear bottom-simulating reflector (BSR) at ∼230 mbsf. When the hole was drilled in 2010, a pressure-monitoring Advanced CORK (ACORK) observatory was installed, sealed at the bottom by a bridge plug and cement below 302 mbsf. In May 2014, a temperature profile was collected by lowering a probe down the hole from the ROV ROPOS. From July 2016 through May 2018, temperature data were collected during a nearly two-year deployment of a 24-thermistor cable installed to 268 m below seafloor (mbsf). The cable and a seismic-tilt instrument package also deployed in 2016 were connected to the Ocean Networks Canada (ONC) NEPTUNE cabled observatory in June of 2017, after which the thermistor temperatures were logged by Ocean Networks Canada at one-minute intervals until failure of the main ethernet switch in the integrated seafloor control unit in May 2018. The thermistor array had been designed with concentrated vertical spacing around the bottom-simulating reflector and two pressure-monitoring screens at 203 and 244 mbsf, with wider thermistor spacing elsewhere to document the geothermal state up to seafloor. The 4 years of data show a generally linear temperature gradient of 0.055°C/m consistent with a heat flux of 61–64 mW/m2. The data show no indications of thermal transients. A slight departure from a linear gradient provides an approximate limit of ∼10−10 m/s for any possible slow upward advection of pore fluids. In-situ temperatures are ∼15.8°C at the BSR position, consistent with methane hydrate stability at that depth and pressure.
Introduction
The stability of methane hydrates in continental margin sediments has long been known to be strongly dependent on temperature and pressure (e.g., Kvenvolden and Barnard, 1983; Hyndman et al., 1992), such that seismically determined depths to bottom-simulating reflectors (BSRs) that often mark the base of gas hydrate stability (BGHS) have been used by many authors to estimate heat flux through the sedimentary section above the BSR (e.g., Yamano et al., 1982; Davis et al., 1990; Hyndman et al., 1992). However, there have been only a few direct measurements of temperature within the gas hydrate stability zone (GHSZ) made in scientific ocean drilling, and even fewer long-term time-series measurements of temperature across the GHSZ. The best previous example of the latter was at Ocean Drilling Program (ODP) Site 892 at Hydrate Ridge in the southern Cascadia accretionary prism, where thermal results were enigmatic with respect to inferred depths of methane hydrate stability (Davis et al., 1995). This paper describes 4 years of temperature time-series data in the northern Cascadia accretionary prism, at Integrated Ocean Drilling Program (IODP) Site U1364, spanning a clear BSR and the GHSZ. These data are consistent with and resolve more clearly the previously interpreted temperature gradient and temperature at the BGHS at the site. They also improve the estimate of heat flux at depth and provide an upper limiting constraint on the rate of any vertical pore-fluid expulsion.
As shown in Figure 1, Site U1364 lies ∼20 km landward of the toe of the Cascadia subduction zone accretionary prism, where much of the thick section of turbidite and hemipelagic sediments deposited on the eastern flank of the Juan de Fuca Ridge is scraped off the underthrusting oceanic crust (Davis and Hyndman, 1989; Hyndman et al., 1992; Westbrook et al., 1994). Convergence of the Juan de Fuca oceanic plate relative to the North American continental plate occurs in a direction roughly normal to the continental margin at a rate of about 42 mm/yr (DeMets et al., 1990). A topographic trench at this subduction zone is absent as a consequence of the extremely high rate of turbidite sediment supply from the continent during the Pleistocene (Davis and Hyndman, 1989). At the accretionary prism toe or deformation front, where the seawardmost thrust fault of the accretionary complex intersects the seafloor, the sediments that bury the eastern Juan de Fuca Ridge flank are approximately 2.7 km thick. At Site U1364 the accreted sedimentary section is nearly doubled to a thickness of approximately 5 km (Yuan et al., 1994). With such tectonic thickening and compaction, pore fluids are expelled, and gas - primarily methane - is transported upward to contribute to the formation of gas hydrates in the upper few hundred meters of the sediment section (Davis et al., 1990; Hyndman and Davis, 1992; Haacke et al., 2007; Riedel et al., 2010a).
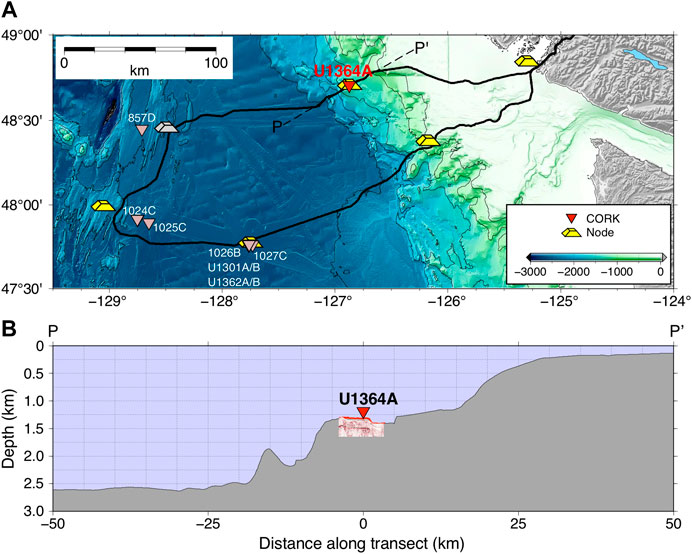
FIGURE 1. (A) Location of Hole U1364A, Ocean Networks Canada (ONC) cabled observatory nodes, and other CORK sites in the northeast Pacific. (B) Location of Hole U1364A along bathymetric profile P-P′ shown in (A). An expanded version of the small seismic section in the vicinity of Hole U1364A is shown in Figure 3.
Site U1364 lies at a position where the fluid expulsion rate, estimated on the basis of the rates of compaction and vertical growth of the prism, reaches a cross-margin maximum, and where a clearly developed BSR marks the BGHS (Davis et al., 1990; Hyndman and Davis, 1982). That rationale had previously been used in selecting the locations of adjacent ODP Site 889 and IODP Site U1327; the three sites essentially share a common location within a diameter of 700 m (Figure 2), with each being at least 1 km away from any mapped locations of seafloor cold vents (Scherwath et al., 2019). Cores and logs from Sites 889, 890, and U1327 (Westbrook et al., 1994; Riedel et al., 2010a) have documented the nature of the incoming undeformed sediments, the compaction history during accretion, the details of the lithology, and the distribution and composition of gas hydrates across the area. In particular, they show that 1) pore fluids are significantly freshened below the upper unit of undeformed slope sediments, which should affect estimates of the depth limit of the GHSZ; and 2) there are geochemical and carbon isotope signatures for primarily microbial gas generation at this location, as summarized by Riedel et al. (2010a). At the three previous sites, ten subseafloor sediment temperature measurements down to ∼210 mbsf constrained an average temperature gradient of 0.055°C/m, with an estimated temperature of 15–16°C at the BGHS estimated at ∼230 mbsf in the area (Exp 311 Scientists et al., 2006a; Riedel et al., 2010a).
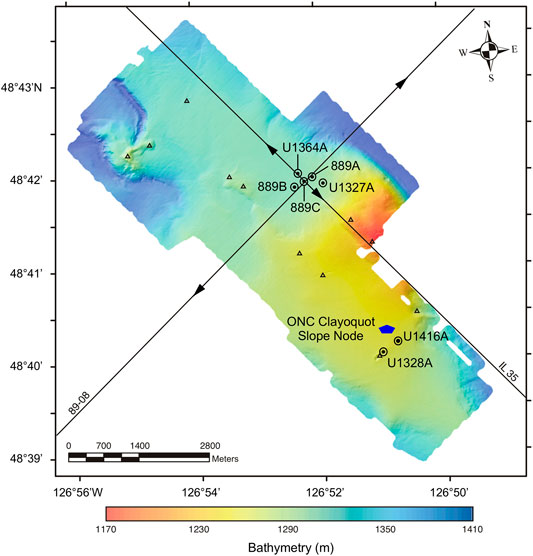
FIGURE 2. Borehole locations from ODP Leg 146 (889A-C), Expedition 311 (U1327A, U1327B, and U1328A), Expedition 341S (U1416A), and Expedition 328 (U1364A) on multibeam bathymetric data from Paull et al. (2015). Also shown is approximate position of the ONC Clayoquot Slope node. Arrowheads on PGC 89-08 and IL35 seismic lines show approximate extents of sections shown in Figure 3. Triangles show locations of mapped seafloor formation fluid or gas seeps from Scherwath et al. (2019). Site U1416A is not discussed in this paper, but it is shown because it is the location of a SCIMPI (Simple Cabled Instrument to Measure Parameters In Situ) observatory also intended to monitor temperatures down to BSR depths (Expedition 341S Scientists and Engineers, 2013; Lado-Insua et al., 2013).
Methods: Borehole Observatory and Temperature Sensor Configuration
During IODP Expedition 328 in 2010, Hole U1364A was drilled without coring or any logging to a total depth of 336 mbsf through roughly 90 m of gently deformed slope-basin deposits and underlying sediments of the accretionary prism that are folded and faulted on a scale too small to be resolved in seismic reflection profiles (Figure 3). An “Advanced CORK” (ACORK) borehole observatory was installed immediately after drilling (Davis et al., 2012), configured as shown in Figure 3A projected onto trench-normal seismic line PGC 89-08. The ACORK was constructed around solid 10.75-inch casing, left open at the wellhead above seafloor but sealed at the bottom of the casing with a bridge plug backed with cement. This left the interior open to a depth of 302 mbsf for instruments requiring thermal or mechanical-but not direct-contact with the formation. Formation fluid pressures are transmitted to sensors at the wellhead via 2.03-m-long circumferential sand-packed filter screens and 3-mm-diameter (1/8-inch i.d.) stainless steel hydraulic tubing mounted on the outside of the casing. Screens (numbered S1 to S4 from bottom to top) are positioned at depths of 304 mbsf, 244 mbsf, 203 mbsf, and 156 mbsf. The middle two pressure monitoring screens were positioned 14 m below and 27 m above the base of the gas hydrate stability zone at 230 mbsf to observe the effects of free gas and gas hydrate in the sediment matrix, and diffusive signals originating at the hydrate-gas boundary. The lowermost and uppermost screens were placed 74 m below and above the boundary, a distance that was anticipated to be sufficient to avoid hydrologic complications originating at the boundary. Initial results (Davis et al., 2012) indicated that collapse of the formation around the installation provided good hydraulic isolation of the three deepest screens, but the seafloor reference pressure gauge had failed. Therefore, the input to the gauge originally assigned to the uppermost screen was switched from formation to the seafloor to provide a continuing reference pressure signal.
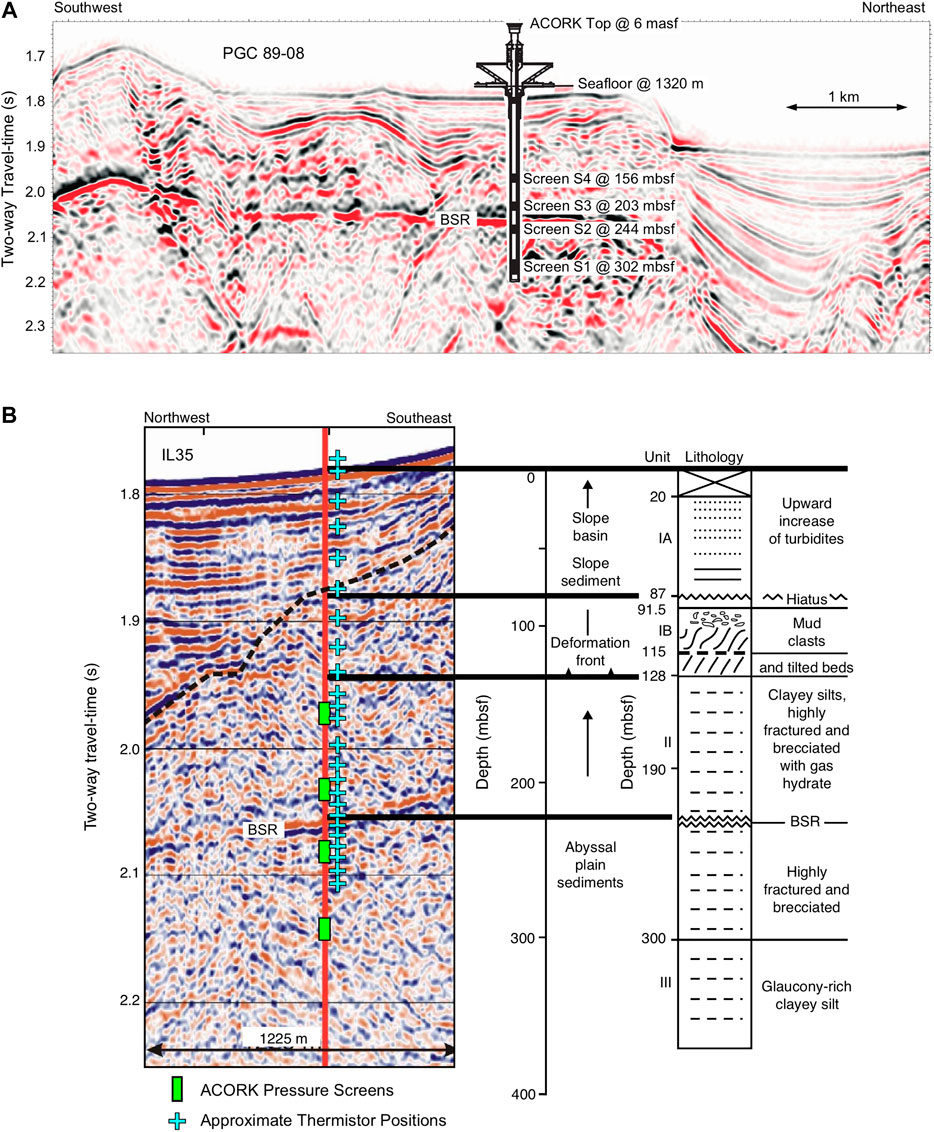
FIGURE 3. (A) Expanded view of the PGC 89-08 seismic image highlighted in Figure 1B, showing BSR and configuration of the ACORK in Hole U1364A including its four downhole pressure-monitoring screens. (B) Position of Hole U1364A (red vertical line) on seismic cross line IL35 correlated with lithology derived from core samples at Sites 899 and U1327A. Approximate positions of ACORK pressure monitoring screens and thermistor cable sensors are shown as green rectangles and blue crosses, respectively, with exaggerated vertical scales. (A) and (B) are both modified from Expedition 311 Scientists (2006b).
In July of 2016, we installed a combined seismometer/tiltmeter/thermistor array in the central bore of the ACORK, using the ROV Jason from R/V Sikuliaq. An earlier depth check conducted in May of 2014 with a Seabird conductivity-temperature-depth (CTD) profiler on an ROV-mounted winch had indicated the likely presence of fill below 300 mbsf. To minimize risk on deployment, the 2016 sensor string was designed to terminate above that section, somewhat above the deepest pressure-monitoring screen. The seismometer/tiltmeter package was mechanically clamped to the casing at 280 mbsf and cabled to a master control unit that landed in the ACORK wellhead (McGuire et al., 2018). During deployment, a 24-thermistor cable was married to the seismometer/tiltmeter string, with the deepest thermistor positioned at 268 mbsf, roughly midway between the two deepest screens. The thermistor cable was a Concerto T24 unit manufactured by Richard Brancker Research Ltd., with nominal resolution of 0.001°C in the expected range of 2–20°C. It had been designed with variable spacing between sensors of 4–18 m, with closely spaced sections around the upper three pressure monitoring screens and BSR and wider spacing elsewhere (Figure 3B). The temperature sensors are numbered T1 to T24 from bottom to top.
The output from the temperature data logger was fed to the master sensor string control unit, which was also designed to allow direct connection for power and data streaming to the Ocean Networks Canada (ONC) cable at its Clayoquot Slope node. That connection could not be completed in 2016 but was successfully made in June of 2017, after which temperature data were logged continuously at one-minute intervals with the exception of a few short ONC outages. During the 2016 deployment cruise, about 1 day of initial temperature data had been logged to a shipboard computer while we remained connected to the installation via Jason. Unfortunately, in May of 2018 the main internet switch in the master control unit failed, ending the streaming of all data including temperature. The entire 2016 inside-casing instrument string was pulled from the hole in late summer 2019, also using Jason from R/V Sikuliaq, for replacement of the internet switch, refurbishment, and redeployment hopefully in the near future. Monitoring of pressure data via an independent ONC cable connection has not been affected.
Results
Hole U1364A Temperature Time-Series Data
Figure 4 shows the eleven-month time-series of thermistor cable data from the June 2017 ONC connection to the May 2018 failure of the internet switch in the main control unit for the sensor string. For most of the sensors, the long-term records are quite stable, but four or five sensors displayed indications of sudden or gradual degradation, possibly due to seawater penetration into the cable. For four of those sensors, only the more stable early sections of data are shown on Figure 4 and used in subsequent analyses. In particular, readings from T14 (154 mbsf) and T10 (200 mbsf) showed abrupt deviations and subsequent unstable readings starting in late September 2017 and mid-March 2018, respectively. In addition, readings from T19 (76 mbsf) and T5 (232 mbsf) showed upward drifts with steadily increasing noise levels (to >1°C) beginning in August and October 2017, respectively. The record from T2 (256 mbsf) also shows a slow upward drift but without increasing noise levels, eventually reaching higher apparent temperatures than the deepest sensor T1 (268 mbsf). This is probably due to slow failure of T2, but we cannot definitively rule out some other cause such as formation warming at that depth or slow convective overturn deep in the hole. Convection of the fluids within casing is not unexpected for a hole of this diameter and temperature gradient, but it does not normally disturb the average gradient (e.g., Diment, 1967; Sammel, 1968). Therefore, the T2 readings are still shown on Figure 4, but they were not used in analyses of temperature gradient or heat flux in sections below. In addition, the record from T24, at a position within the ACORK but above seafloor, clearly shows tidal variations in bottom-water temperatures, and the T23 record from just below seafloor shows more attenuated tidal variations that are barely discernible on Figure 4.
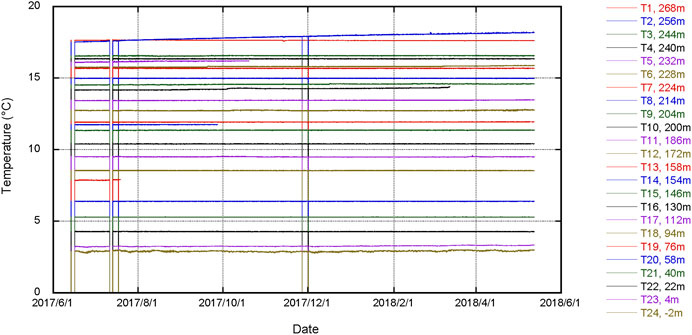
FIGURE 4. Eleven-month time-series of temperatures recorded from June 2017 through May 2018 with the thermistor cable originally deployed in July 2016. As detailed in the text, compromised later sections of readings from five sensors have been masked from this plot.
Hole U1364A Temperature-Depth Profiles
Figure 5 compares 1) initial temperature data from the May 2014 CTD depth check, 2) the values at the end of the day of shipboard monitoring of thermistor cable readings during the July 2016 sensor string deployment, and 3) thermistor cable readings for June 2017, December 2017 and May 2018 excluding the later questionable segments of data for the five sensors described above. Previous ODP/IODP sediment probe data are also shown for reference, and they are discussed in the following paragraph. The 2014 and 2016 readings are quite consistent and nearly linear with depth, with the exception that deeper than 260 mbsf the depth check CTD readings are somewhat higher than the initial cable values, suggesting a slight convex-upward trend in the cable readings. The ACORK casing had been left open at the seafloor from 2010 to 2016, so there could have been some convective exchange of ocean bottom and in-casing fluids during that period. The wellhead control unit for the 2016 sensor string probably would have inhibited any such exchange after its deployment, although it should be noted it was not designed to perfectly seal the casing volume at the wellhead. The 2017–2018 profiles are remarkably linear and best fit with a linear temperature gradient of 0.055°C/m. The profiles constrain a temperature of ∼15.8°C at the ∼230 m depth of the BGHS. This is consistent with the stability field for methane hydrates at that depth/pressure and 3.0–3.5% salinity (Expedition 311 Scientists et al., 2006b, based on Sloan 1998).
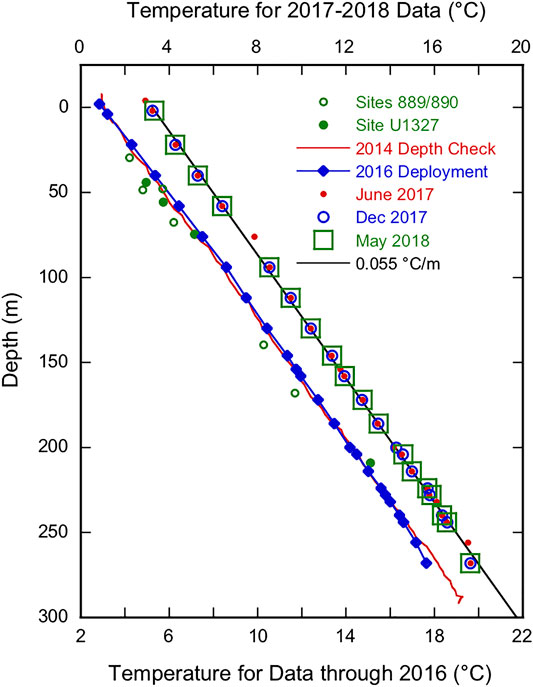
FIGURE 5. Comparison of temperature-depth profiles in Hole U1364A obtained with: the 2014 downgoing CTD depth check, the 2016 initial deployment of the thermistor cable, and representative thermistor cable readings logged by ONC in June 2017, December 2017, and May 2018. Note that the temperature scale for the 2014 and 2016 data is shifted by −2°C for visual clarity. For reference, also shown are earlier downhole temperature probe readings obtained in Sites 889 and 890 in 1992 (Shipboard Scientific Party, 1994) and Site U1327 in 2011 (Expedition 311 Scientists, 2006b).
The best-fit linear gradient from our data of 0.055°C/m is consistent with the value reported for the average of ODP/IODP sediment probe readings at nearby Sites 889, 890, and U1327 (Expedition 311 Scientists et al., 2006b). Despite this consistency, Figure 5 shows that several of those ODP/IODP probe readings seem to plot below our profiles, especially data from Sites 889/890. This may be due to a combination of temporal variability of bottom water temperatures as discussed below in Section 4.3 and uncertainties introduced by the normal ODP/IODP practice of correcting probe readings so that temperatures within the drillpipe measured during a stop at mudline depths match known bottom-water temperature. That correction is based on the assumption that the drillpipe acts as a perfect heat exchanger, cooling the surface seawater used to pump the probe down the pipe to the bottom-water value. The corrections for this effect applied to the two deepest readings from Site 889 shown on Figure 5 were substantial, −1.3°C (Shipboard Scientific Party, 1994), so there may be larger uncertainties with those data compared to our 2014–2018 data.
The 2014–2018 profiles shown in Figure 5 show no clear indications of transients at the level of the BSR or pressure-monitoring screens during the four-year period of collection of temperature data in Hole U1364A. The profiles do hint at a small degree of convex-upward curvature that might arise from diffuse upward pore-fluid migration associated with the gas hydrate stability zone as modeled by Hyndman and Davis (1982) and Riedel et al. (2010a). Estimating heat flux at depth and properly assessing an upper limit on possible fluid advection consistent with the temperature profiles first requires careful assessment of the in-situ thermal conductivity.
Discussion
Thermal Conductivity and Heat Flux Estimates
Unfortunately, there are much greater uncertainties in the in situ thermal conductivity than the temperature profile. As reported by Shipboard and Scientific Party (1994), Expedition 311 Scientists et al. (2006b), and Riedel et al. (2010b), thermal conductivity measurements on ODP and IODP cores from Sites 889 and U1327 display considerable scatter with no clear depth trend. Much of the scatter might be due to variable disturbances in the coring and recovery processes, including de-gassing effects. In addition, Riedel et al. (2010b) noted that Site 889 values are about 10% higher on average than Site U1327 values. The same needle-probe method was used (Von Herzen and Maxwell, 1959), but with different instruments; this is unlikely the cause of the difference in conductivities, but an uncertainty of at least 10% cannot be eliminated (Riedel et al., 2010b). Therefore, Expedition 311 Scientists et al. (2006b) and Riedel et al. (2010b) used an average value of 1.1 W/m-K ± 10% to estimate a heat flux of 61–62 mW/m2 at the sites. Applying that same conductivity value to our nearly linear gradient of 0.055°C/m yields a similar estimate of 60.5 mW/m2 conductive heat flux through the section.
The Expedition 311 Scientists et al. (2006b) also noted that the conductivities for the more competent cores approached the “regional trend” of conductivity vs. depth developed by Davis et al. (1990) based on a seismic velocity to porosity to conductivity transform. Where thermal conductivity varies in a known way with depth, Bullard (1939) first suggested a transform to thermal resistance, the integral to a given depth of the inverse of the conductivity, with the slope of a plot of temperature vs thermal resistance providing a determination of conductive heat flux. The Davis et al. (1990) computation suggested a variation of conductivity that could be fit by a second order polynomial in depth with a seafloor value of 1.07 W/m-K. In an independent and potentially more reliable approach specific to the site, we also applied the relationship between thermal conductivity and porosity developed by Goto and Matsubayashi (2009) for Cascadia Basin sediments to the logging-while-drilling (LWD) porosity profile collected in Hole U1327A. The LWD data showed porosities decreasing with depth down to ∼120 mbsf, a higher porosity zone at ∼120–140 mbsf, and more uniform average values in the deeper section other than higher values just below the BSR (Expedition 311 Scientists et al., 2006b). This approach allowed computation of a detailed profile of the variation of in situ thermal conductivity with depth, and an integration to estimate thermal resistance at each thermistor depth. As shown in Figure 6, plots of thermistor cable temperatures vs. thermal resistance are quite linear for both models. The slopes yield conductive heat flux values of 63 mW/m2 using the Davis et al. (1990) model and 64 mW/m2 using the Goto and Maysubayashi (2009) model.
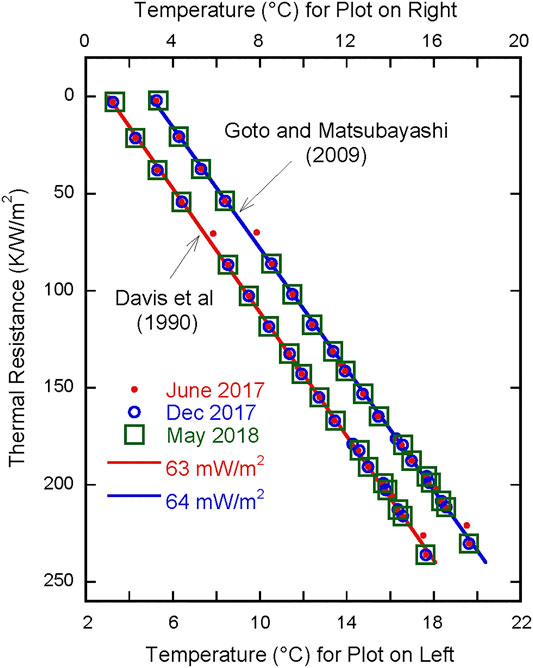
FIGURE 6. Thermistor cable temperatures in Hole U1364A plotted against integrated thermal resistance, using the models of Davis et al. (1990) and Goto and Matsubayashi (2009) for the depth variation of thermal conductivity at the site. Note that the temperature scales for the two plots are offset by 2°C to avoid direct overlap.
Constraints on Advection Rates
The linearity of the temperature-thermal resistance plots in Figure 6 suggests that an increase of conductivity with depth might explain at least some of the slightly convex-upward nature of the temperature-depth plots in Figure 5. Given the uncertainties in the depth variation of the in-situ conductivity profile, it is debatable whether it is valid to interpret an upward advection rate from the slight apparent curvature in the temperatures vs depth. Nevertheless, we applied the method of Bredehoeft and Papadopulos (1965) to define an upper limit to a possible advection rate consistent with the temperature data. That analysis suggests a value of 0.1 for the Bredehoeft and Papadopulos (1965) “β” parameter over the 268 m subseafloor depth range of the May 2018 thermistor cable data (Figure 7). β is defined as vρcL/k, where v is vertical advection rate, ρ and c are density and specific heat of the pore fluid, respectively, L is the vertical range of temperature measurements (268 m), and k is average thermal conductivity in that range. Using 1.1 W/m-K for average conductivity, 1,030 kg/m3 for density of somewhat freshened pore fluids, and 3850 J/kg-K for specific heat of the pore fluids yields an estimate of upward vertical advection rate on the order of ∼1 × 10⁻¹⁰ m/s. This is remarkably similar in order of magnitude to the maximum expulsion rate of nearly 3 mm/yr estimated by Hyndman and Davis (1982) at the general position of Hole U1364A on the northern Cascadia margin and background methane flux rates estimated by Riedel et al. (2006a) at Site U1328. We consider our estimate an upper limit for reasons described above and because the Bredehoeft and Papadopulos (1965) method is especially sensitive to the value of the deepest temperature reading, which in this case falls below the generally linear trends shown in Figures 5 and 6.
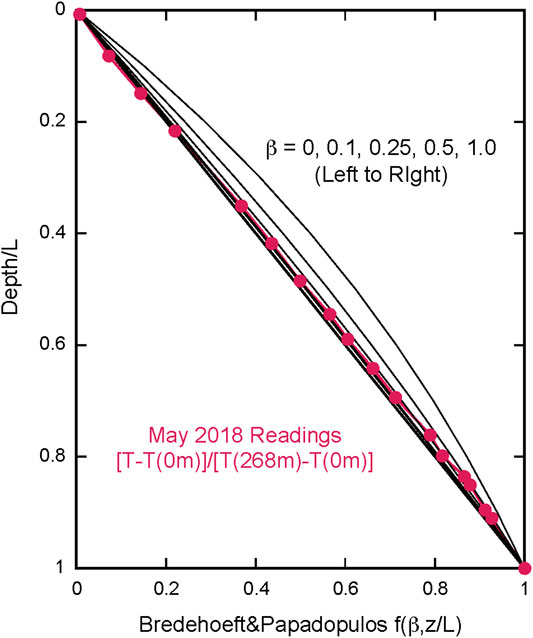
FIGURE 7. Non-dimensionalized May 2018 thermistor cable readings plotted against the Bredehoeft and Papadopulos (1965) f(β,z/L) function along with characteristic type curves values for values of β associated with upward migration of pore-fluids. As detailed in the text, the consistency of the temperature data with the type curve for β = 0.1 suggests an upward pore-fluid migration rate no greater than ∼10−10 m/s.
Relevance to Regional Heat Flux Measurements
Several hundred km farther south along the Cascadia Margin, Tréhu (2006) conducted an extensive program of downhole temperature probe measurements during ODP Leg 204 drilling at southern Hydrate Ridge offshore Oregon. That study produced comparable results to ours: a slightly lower average heat flux value of ∼55 mW/m2 and nearly linear temperature-depth profiles generally consistent with predicted temperatures at the base of the GHSZ as estimated from BSR depths there.
As reported in Section 4.1, the 61–64 mW/m2 range of heat flux values we obtain from the thermistor cable readings in Hole U1364A is very close to the values obtained in nearby Sites 889, 890, U1327, and U1328. It is also close to the average value of 58 mW/m2 obtained with a 4-m long probe during a regional heat flux survey in 2000 with trench-normal and trench-parallel lines crossing over Site U1328 (Riedel et al., 2006a). However, earlier trench normal heat flow surveys with a 2.5-m long probe in the same area yielded significantly higher values (Davis et al., 1990). Riedel et al. (2006b) suggested that this discrepancy might be attributed to time-varying perturbations to shallow sediment temperatures from bottom-water temperature changes at time scales of a few months to years.
This interpretation is supported by the combination of our significantly deeper heat flux determination in Hole U1364A, and a ten-year bottom-water temperature time-series obtained with a nearby bottom pressure recorder (BPR) ∼3 km away near the ONC Clayoquot Slope node (Figure 2). Daily running averages of the BPR temperatures from 2015–2020 are plotted in Figure 8 and clearly show variations in bottom-water temperature of up to ±0.15°C over time scales of months to nearly 2 years. The analysis of Davis et al. (2003) shows that downward propagation of bottom-water temperature variations of those magnitudes and time scales into the sediments will produce significant temporal perturbations to temperature gradients in the uppermost 2–3 m of sediments – the depth range penetrated by shallow heat flow probes. If similar variations in bottom-water temperatures were occurring at the times of the early heat flux surveys, they could indeed explain the differences between the Davis et al. (1990), Riedel et al. (2006a), and Riedel et al. 2006b) regional heat flux trends. This argues for caution in using short-probe heat flux determinations on the upper slopes of accretionary prisms as thermal constraints on models of deep-seated tectonic processes and state at subduction zones.
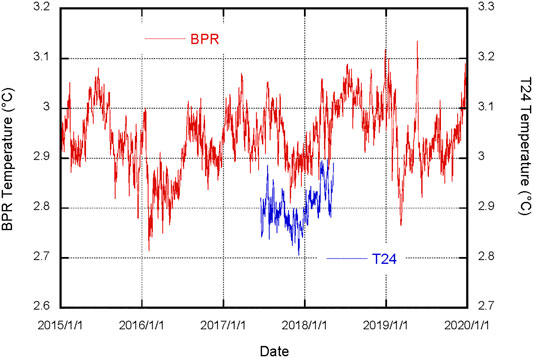
FIGURE 8. Daily running averages of the internal temperature sensor for BPR NC89 deployed near the ONC Clayoquot Slope node, ∼3 km southeast of Hole U1364A. Also shown is the 11-months record of the uppermost Hole U1364A thermistor 4 m above seafloor, with an offset in the vertical temperature scale to avoid obscuring the BPR record during that time.
Deeper borehole data like the thermistor cable data from Hole U1364A - and downhole probe data like those of Tréhu (2006) - are out of range of the effects of such bottom-water temperature perturbations, and in that sense provide much more reliable measurements of seafloor heat flux and deep thermal structure. While our data and those of Tréhu (2006) represent just two well documented studies, it is notable that the downhole temperature profiles are consistent with predicted methane hydrate stability at both locations. This further validates the technique of estimating seafloor heat flux from BSR depths, as long as BSR depths are well constrained by seismic data and thermal conductivity profiles can be accurately determined.
Conclusion
Four years of discrete and continuous temperature logging in Hole U1364A on the Vancouver Margin accretionary prism has provided important constraints on the geothermal state and an upper limit on possible pore-fluid flow in the prism associated with the BSR and BGHS penetrated at ∼230 mbsf at this location. The temperature profiles have remained quite constant over those 4 years, defining a nearly linear temperature gradient of 0.055°C/m with no indications of in-situ transients during the period. This gradient is consistent with a conductive heat flux of 61–64 mW/m2 depending on the model adopted for the less constrained variation of thermal conductivity with depth at the site. The generally linear temperature profiles could also be consistent with a slight convex-upward curvature associated with upward pore-fluid migration at low rates no greater than 10−10 m/s, the same order as previously modeled by Hyndman and Davis (1982) to bring methane from depth to the gas hydrate stability zone. Finally, the temperature data show in-situ values at the BSR depth of ∼15.8°C, consistent with predicted methane hydrate stability at that depth and pressure.
Data Availability Statement
The thermistor cable temperature data used in this report are available from the Ocean Networks Canada data portal as specified in Ocean Networks Canada Society (2020). (Note that the archived thermistor cable data include periodic spikes during the first 6 months of 2017 recording that were caused by regular ground-fault checks of the WHOI borehole instruments; those spikes have been filtered out from any data used in this report.) The 2014 CTD data from Hole U1364A are available on Scholars Portal Dataverse as specified in Davis et al. (2020).
Author Contributions
KB obtained NSF funding for the thermistor cable installed in Hole U1364A, participated in the design and installation of the combined sensor string installed in 2016, and led interpretation of the thermistor cable data and writing of this manuscript. ED was chief scientist of the IODP expedition that installed the ACORK in Hole U1364A in 2010, led interpretation of pressure data from the ACORK and the 2014 effort to conduct a depth check in the hole with CTD, and collaborated on the design of the thermistor cable and interpretation of the geothermal data. MH participated in the ACORK installation expedition and interpretation of pressure data and was instrumental in organizing the ONC archiving of the thermistor cable data. JM led the Woods Hole Oceanographic Institution (WHOI) efforts for Keck Foundation funding for the seismic-strain-tilt components of the sensor string and NSF funding for the 2016 installation cruise, and he was chief scientist for that installation cruise. JC was co-investigator for the WHOI Keck Foundation and NSF funding, participated in the 2016 installation cruise, and was chief scientist on the 2019 cruise to recover the sensor string from Hole U1364A.
Funding
KB was supported by NSF grant OCE-1259718 for construction and deployment of the thermistor cable in the hole. Construction of the seismic-strain-tilt instrumentation was supported by a Keck Foundation grant to WHOI, and deployment and recovery of the integrated sensor string was supported by NSF grant OCE-1259243 to JM and JC. Support for the pressure-monitoring instrumentation and 2014 CTD profile was provided by the Geological Survey of Canada and Ocean Networks Canada.
Disclaimer
Any use of trade, firm, or product names is for descriptive purposes only and does not imply endorsement by the U.S. Government.
Conflict of Interest
The authors declare that the research was conducted in the absence of any commercial or financial relationships that could be construed as a potential conflict of interest.
The reviewer MR declared a past co-authorship with one of the authors MH to the handling editor. The reviewer AMT declared a past co-authorship with one of the authors JC to the handling editor.
Acknowledgments
Drilling of Hole U1364A and installation of the ACORK infrastructure was carried out by the Integrated Ocean Drilling Program using D/V JOIDES Resolution. The CTD used in the 2014 depth check was provided by D. Fornari, WHOI. We thank the officers and crews of the JOIDES Resolution, ROPOS, Sikuliaq, and Jason for outstanding support for the at-sea deployments. We thank J. OBrien and K. von der Heydt for engineering support in designing and deploying the WHOI/RSMAS borehole instrument package, and D. Kot, J. Ryder, and I. Kulin for additional technical support during the deployment cruise. An early draft of this manuscript benefitted greatly from comments by H. Villinger. We thank reviewers C. Ruppel and S. Hickman for careful and constructive comments that prompted significant improvements to this report.
References
Bredehoeft, J. D., and Papadopulos, I. S. (1965). Rates of vertical groundwater movement estimated from the Earth’s thermal profile. Water Resour. Res. 1, 325–328. doi:10.1029/WR001i002p00325
Bullard, E. C. (1939). Heat flow in South Africa. Proc. R. Soc. London Ser. A 173, 474–502. doi:10.1098/rspa.1939.0159
Davis, E., and Heesemann, M. (2012). IODP expedition 328: early results of cascadia subduction zone ACORK observatory. Sci. Rep. 13, 12–18. doi:10.2204/iodp.sd.13.02.2011
Davis, E. E., and Hyndman, R. D. (1989). Accretion and recent deformation of sediments along the northern Cascadia subduction zone. Geol. Soc. Am. Bull. 101, 1465–1480. doi:10.1130/0016-7606(1989)101<1465:AARDOS>2.3.CO;2
Davis, E. E., Becker, K., Wang, K., and Carson, B. (1995). “Long-term observations of pressure and temperature in Hole 892B, Cascadia accretionary prism,” in Proceedings of ODP, Science Results. Editors B. Carson, G. K. Westbrook, R. Musgrave, and E. Suess (College Station, TX: Ocean Drilling Program), Vol. 146, 299–311.
Davis, E. E., Hyndman, R. D., and Villinger, H. (1990). Rates of fluid expulsion across the northern Cascadia accretionary prism: constraints from new heat flow and multichannel seismic reflection data. J. Geophys. Res. 95, 8869–8889. doi:10.1029/JB095iB06p08869
Davis, E. E., McGuire, J. J., Heesemann, M., Becker, K., and Collins, J. A. (2020). CTD profile in IODP CORK U1364A borehole at ONC NEPTUNE observatory site Clayoquot Slope, Cascadia Accretionary Prism. Scholars Portal Dataverse, V1. doi:10.5683/SP2/4QZBZV
Davis, E. E., Wang, K., Becker, K., Thomson, R. E., and Yashayaev, I. (2003). Deep-ocean temperature variations and implications for errors in seafloor heat flow determinations. J. Geophys. Res. 108, 2034–2039. doi:10.1029/2001JB001695
DeMets, C., Gordon, R. G., Argus, D. F., and Stein, S. (1990). Current plate motions. Geophys. J. Int. 101, 425–478. doi:10.1111/j.1365-246X.1990.tb06579.x
Diment, W. H. (1967). Thermal regime of a large diameter borehole: instability of the water column and comparison of air- and water-filled conditions. Geophysics 32, 720–726. doi:10.1190/1.1439885
Expedition 341S Scientists and Engineers (2013). Simple cabled instrument for measuring parameters in situ (SCIMPI) and hole 858G CORK replacement. IODP Preliminary 341S Report. doi:10.2204/iodp.pr.341S.2013
Expedition 311 Scientists (2006a). “Expedition 311 summary,” in The expedition 311 scientists, proceedings of IODP. Editors M. Riedel, T. S. Collett, and M. J. Malone (Washington, DC: IODP-MI), Vol. 311. doi:10.2204/iodp.proc.311.101.2006
Expedition 311 Scientists (2006b). “Site U1327,” in The expedition 311 scientists, proceedings of IODP. Editors M. Riedel, T. S. Collett, and M. J. Malone (Washington, DC: IODP-MI), Vol. 311. doi:10.2204/iodp.proc.311.105.2006
Goto, S., and Matsubayashi, O. (2009). Relations between the thermal properties and porosity of sediments in the eastern flank of the Juan de Fuca Ridge. Earth Planets Space 61, 863–870. doi:10.1186/BF03353197
Haacke, R. R., Westbrook, G. K., and Hyndman, R. D. (2007). Gas hydrate fluid flow and free gas: formation of the bottom-simulating reflector. Earth Planet. Sci. Lett. 261, 407–420. doi:10.1016/j.epsl.2007.07.008
Hyndman, R. D., and Davis, E. E. (1982). A mechanism for the formation of methane hydrate and seafloor bottom-simulating reflectors by vertical fluid expulsion. J. Geophys. Res. 97, 7025–7041. doi:10.1029/91JB03061
Hyndman, R. D., Foucher, J. P., Yamano, Y., and Fisher, A. (1992). Deep sea bottom-simulating-reflectors: calibration of the base of the hydrate stability field as used for heat flow estimates. Earth Planet. Sci. Lett. 109, 289–301. doi:10.1016/0012-821X(92)90093-B
Kvenvolden, K. A., and Barnard, L. A. (1983). “Hydrates of natural gas in continental margins,” in Studies in continental margin geology. Editors J. S. Watkins, and C. L. Drake (American Association of Petroleum Geologists Memoir), Vol. 34, 631–640.
Lado-Insua, T., Moran, K., Kulin, I., Farrington, S., and Newman, J. B. (2013). SCIMPI: a new borehole observatory. Sci. Drill. 16, 57–61. doi:10.5194/sd-16-57-2013
McGuire, J. J., Collins, J. A., Davis, E., Becker, K., and Heesemann, M. (2018). A lack of dynamic triggering of slow slip and tremor indicates that the shallow Cascadia megathrust offshore Vancouver Island is likely locked. Geophys. Res. Lett. 28, 11,095–11,103. doi:10.1029/2018GL079519
Ocean Networks Canada Society (2020). ODP 1364A borehole temperature logger deployed 2016-07-01 (Ocean Networks Canada Society). Available at: https://doi.org/10.34943/1ab823b8-0dcf-48e4-b9f0-67d52989b772.
Paull, C. K., Caress, D. W., Thomas, H., Lundsten, E., Anderson, K., Gwiazda, R., et al. (2015). Seafloor geomorphic manifestations of gas venting and shallow subbottom gas hydrate occurrences. Geosphere 2, 491–513. doi:10.1130/FES01012.1
Riedel, M., Collett, T. S., and Malone, M. (2010a). “The expedition 311 scientists, expedition 311 synthesis: scientific findings,” in Proceedings of IODP. Editors M. Riedel, T. S. Collett, and M. J. Malone (Washington, DC: IODP-MI), Vol. 311. doi:10.2204/iodp.proc.311.213.2010
Riedel, M., Novosel, I., Spence, G. D., Hyndman, R. D., Chapman, R. N., Solem, R. C., et al. (2006a). Geophysical and geochemical signatures associated with gas hydrate-related venting in the northern Cascadia margin. GSA Bulletin 118, 23–38. doi:10.1130/B25720.1
Riedel, M., Tréhu, A., and Spence, G. D. (2010b). Characterizing the thermal regime of cold vents at the northern Cascadia margin from bottom-simulating reflector distributions, heat-probe measurements and borehole temperature data. Mar. Geophys. Res. 31, 1–16. doi:10.1007/s11001-010-9080-2
Riedel, M., Willoughby, E. C., Chen, M. A., He, T., Novosel, I., Schwalenberg, K., et al. (2006b). “Gas hydrate on the northern Cascadia margin: regional geophysics and structural framework,” in The expedition 311 scientists, proceedings of IODP. Editors M. Riedel, T. S. Collett, and M. J. Malone (Washington, DC: IODP-MI), Vol. 311. doi:10.2204/iodp.proc.311.109.2006
Sammel, E. A. (1968). Convective flow and its effect on temperature logging in small-diameter wells. Geophysics 33, 1004–1012. doi:10.1190/1.1439977
Scherwath, M., Thomsen, L., Riedel, M., Römer, M., Chatzievangelou, D., Schwender, J., et al. (2019). Ocean observatories as a tool to advance gas hydrate research. Earth Space Sci. 6, 2644–2652. doi:10.1029/2019EA00762
Tréhu, A. (2006). “Subsurface temperatures beneath southern Hydrate Ridge,” in Proceedings ODP, science results. Editors A. Tréhu, G. Bohrmann, M. E. Torres, and F. S. Colwell (College Station, TX: Ocean Drilling Program), 1–26. doi:10.2973/odp.proc.sr.204.114.2006
Von Herzen, R. P., and Maxwell, A. E. (1959). The measurement of thermal conductivity of deep-sea sediments by a needle probe method. J. Geophys. Res. 64, 1557–1563. doi:10.1029/JZ064i010p01557
Westbrook, G. K., Carson, B., Musgrave, R. J., et al. (1994). Proceedings of ODP, initial reports (College Station, TX: Ocean Drilling Program), Vol. 146.
Shipboard Scientific Party (1994). “Site 889 and 890,” in Proceedings of ODP, initial Reports. Editors G. K. Westbrook, B. Carson, R. J. Musgraveet al. (College Station, TX: Ocean Drilling Program), Vol. 146, 127–239.
Yamano, M., Uyeda, S., Aoki, Y., and Shipley, T. H. (1982). Estimates of heat flow derived from gas hydrates. Geology 10, 339–343. doi:10.1130/0091-7613(1982)10<339:EOHFDF>2.0.CO;2
Keywords: heat flux, geothermal gradient, gas hydrates, bottom-simulating reflector, pore-fluid advection, borehole observatory, Integrated Ocean Drilling Program
Citation: Becker K, Davis EE, Heesemann M, Collins JA and McGuire JJ (2020) A Long-Term Geothermal Observatory Across Subseafloor Gas Hydrates, IODP Hole U1364A, Cascadia Accretionary Prism. Front. Earth Sci. 8:568566. doi: 10.3389/feart.2020.568566
Received: 01 June 2020; Accepted: 20 November 2020;
Published: 21 December 2020.
Edited by:
Tamara Baumberger, Oregon State University, United StatesReviewed by:
Michael Riedel, GEOMAR Helmholtz Center for Ocean Research Kiel, GermanyAnne M. Tréhu, Oregon State University, United States
Man-Yin Tsang, University of Toronto, Canada
Copyright © 2020 Becker, Davis, Heesemann, Collins and Mcguire. This is an open-access article distributed under the terms of the Creative Commons Attribution License (CC BY). The use, distribution or reproduction in other forums is permitted, provided the original author(s) and the copyright owner(s) are credited and that the original publication in this journal is cited, in accordance with accepted academic practice. No use, distribution or reproduction is permitted which does not comply with these terms.
*Correspondence: Keir Becker, a2JlY2tlckByc21hcy5taWFtaS5lZHU=