 Muhammed Fatih Sert1*
 Juliana D’Andrilli2
 Friederike Gründger1,3
 Helge Niemann1,4,5
 Mats A. Granskog6
 Alexey K. Pavlov7,8
 Bénédicte Ferré1
 Anna Silyakova1
- 1CAGE - Centre for Arctic Gas Hydrate, Environment and Climate, Department of Geosciences, UiT the Arctic University of Norway, Tromsø, Norway
- 2Louisiana Universities Marine Consortium, Chauvin, LA, United States
- 3Arctic Research Centre, Department of Biology, Aarhus University, Aarhus, Denmark
- 4NIOZ Royal Institute for Sea Research, Department of Marine Microbiology and Biogeochemistry, and Utrecht University, Texel, Netherlands
- 5Department of Earth Sciences, Faculty of Geosciences, Utrecht University, Utrecht, Netherlands
- 6Norwegian Polar Institute, Fram Centre, Tromsø, Norway
- 7Institute of Oceanology, Polish Academy of Sciences, Sopot, Poland
- 8Akvaplan-niva, Fram Centre, Tromsø, Norway
Dissociating gas hydrates, submerged permafrost, and gas bearing sediments release methane to the water column from a multitude of seeps in the Arctic Ocean. The seeping methane dissolves and supports the growth of aerobic methane oxidizing bacteria (MOB), but the effect of seepage and seep related biogeochemical processes on water column dissolved organic matter (DOM) dynamics is not well constrained. We compared dissolved methane, nutrients, chlorophyll, and particulate matter concentrations and methane oxidation (MOx) rates from previously characterized seep and non-seep areas at the continental margin of Svalbard and the Barents Sea in May and June 2017. DOM molecular composition was determined by Electrospray Ionization Fourier-transform ion cyclotron resonance mass spectrometry (FT-ICR MS). We found that the chemical diversity of DOM was 3 to 5% higher and constituted more protein- and lipid-like composition near methane seeps when compared to non-seep areas. Distributions of nutrients, chlorophyll, and particulate matter however, were essentially governed by the water column hydrography and primary production. We surmise that the organic intermediates directly derived from seepage or indirectly from seep-related biogeochemical processes, e.g., MOx, modifies the composition of DOM leading to distinct DOM molecular-level signatures in the water column at cold seeps.
Introduction
Dissolved organic matter (DOM) is the operationally defined mixture of organic compounds that passes through a 0.7 µm pore size filter (Repeta, 2015) and constitutes the largest reservoir of organic carbon in the oceans. Marine DOM has not been chemically characterized explicitly to date but 60–70% of the structural variability has been classified as major functional groups (Carlson and Hansell, 2015). The distribution and the composition of DOM are mainly controlled by the bioavailability of these groups. The major part (humic acids, condensed aromatics, black carbon etc.) is considered refractory and remains in the water for years or even millennia (Williams and Druffel, 1987; Amon and Benner, 1994; Lechtenfeld et al., 2014). More biologically reactive DOM in the ocean, considered as bio-labile DOM (amino acids, sugars, proteins etc.), is available to heterotrophic microorganisms and rapidly remineralized by prokaryotes in the upper layers of the water column (Carlson et al., 1994; Carlson et al., 2010; Koch et al., 2014). Bio-labile DOM is produced and transformed by numerous biological processes including extracellular release, excretion, cell lysis, solubilisation and chemosynthetic processes (Carlson and Hansell, 2015).
DOM in the ocean is predominantly derived from biological processes, carrying a unique signature, which may comprise a fingerprint of the surrounding ecosystems. One distinct ecosystem of the Arctic Ocean involves cold seeps and methane bearing sediments in which methane emanates from seeps due to dissociation of methane hydrates (Westbrook et al., 2009; Ferré et al., 2012; Berndt et al., 2014; Sahling et al., 2014). Only a limited portion of the seeping methane reaches the atmosphere (Graves et al., 2015; Myhre et al., 2016; Steinle et al., 2016), while the major part remains in the water column as dissolved gas. Concentrations of methane may reach up to thousands times higher than background levels at seeps, yet decreases rapidly with the distance from the point source predominantly as a result of bacterial oxidation, lateral diffusion, and upward mixing (Graves et al., 2015; Silyakova et al., 2020). Microbial oxidation of methane (MOx), performed by methane oxidizing bacteria (MOB) which convert methane into methanol and formaldehyde, is the major removal mechanism of dissolved methane in ocean waters (Reeburgh, 2007; Murrell, 2010). Formaldehyde is then further used in the catabolism (i.e., oxidized to carbon dioxide to supply energy) or in the anabolism (i.e., incorporated into organic compounds to be used as building blocks for growth) (Hanson and Hanson, 1996). Previous culture experiments suggest that MOB produces a variety of organic acids and chemical products as intermediates (Kalyuzhnaya et al., 2013).
The contribution of cold seeps into marine DOM has never been documented despite its potential importance in waters receiving methane from seeps. The main objective of this study is to document the effect of methane seeps on DOM composition at cold seep sites at the continental margins of Svalbard and in the Barents Sea. Our main hypothesis is that methane-driven microbial processes such as MOx and/or seep-associated microbial modifications result in microbial discharge of metabolic intermediates that alter the molecular composition of DOM in the water column at cold seeps.
Methods
Study Area
We collected samples near methane seepages with various hydrographic properties and bathymetric features during two research expeditions with R/V Helmer Hanssen between 16–29 May (CAGE-17-1) and 23–28 June 2017 (CAGE-17-2). Samples were collected at 18 stations at six different sites (Figure 1 and Table 1) comprising two deep water stations at the Vestnesa Ridge (VR) and Yermak Plateau (YP), eight stations at the shallow shelf west of Prins Karls Forland (PKF), two stations at the southern end of Storfjordrenna (SS), three stations at Storfjordrenna pingos (SP) and three stations at the Olga Basin (OB) in the Barents Sea (Figure 1). At all sites, non-seepage stations were also sampled as a control that had similar water masses but only background methane concentrations. Active seeps were located with the ship-mounted EK60 single-beam echosounder. Based on echosounder data, we defined sampling stations that were literally located above active seeps. These stations are considered seep stations, while the others are considered non-seep stations (Table 1). The only exception was station PKF-1 which was not exactly located above seeps but surrounded by numerous seeps and located in the flow direction of many others (Figure 1).
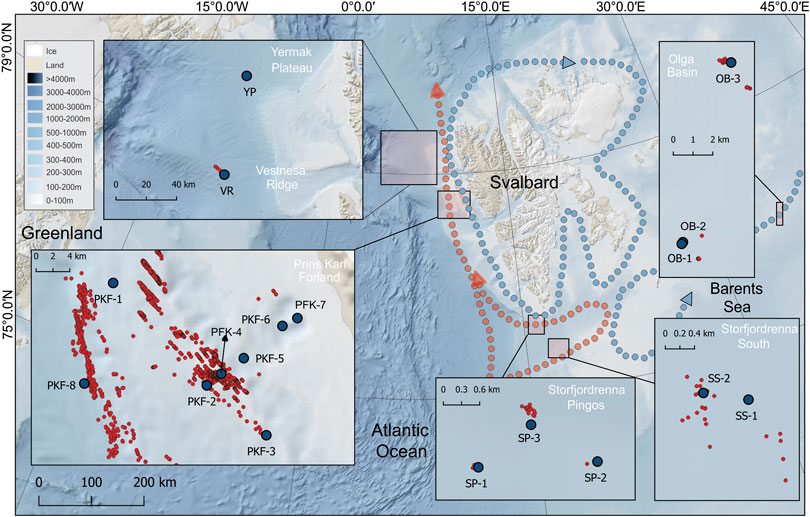
FIGURE 1. Bathymetric map of sampling areas around Svalbard. Pale red and blue dotted lines show directions of the warm West Spitzbergen Current and cold polar currents, respectively. Five insets are shown to magnify the sampling areas with individual spatial scales along with known methane seeps indicated by the red dots. Sampling stations within the insets are indicated by the blue dots and further information is provided in Table 1.
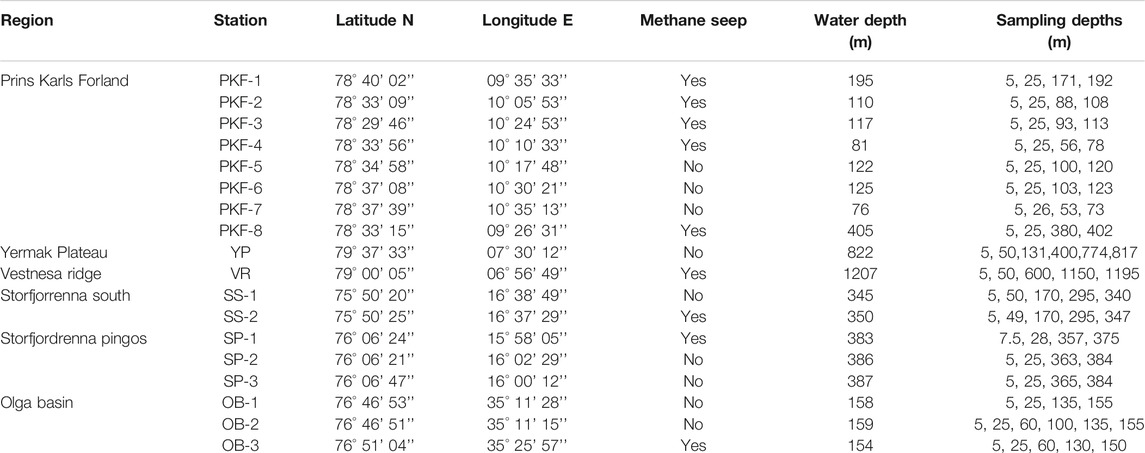
TABLE 1. Detailed information of the sampled stations listing sample regions, sampling stations, station location, methane seep characteristic, water depth, and sampling depth of water samples.
Sampling and Storage
Seawater was sampled from discrete water depths (Table 1) during up-casts of a rosette sampler with 12 × 5 L PTFE lined Niskin bottles and a Sea-Bird 911 plus CTD (Conductivity Temperature Depth) with accuracies of 0.3 db, 0.001°C, and 0.002 for pressure, temperature and salinity, respectively. Dissolved oxygen data were collected using an SBE 43 oxygen sensor (calibrated by Winkler (1888) titration) attached to the CTD. Distribution of chlorophyll fluorescence and turbidity were determined at all stations by Setpoint sensors. All sensor measurements were averaged in 1 m depth bins. Methane and MOx samples were collected immediately after recovery of the rosette on-board. Samples for methane analysis were carefully filled (to prevent bubble formation) into 120 ml (1250 ml for non-seep surface samples) serum bottles amended with 1 M sodium hydroxide solution to stop microbial activity and crimped with butyl rubber septa. Samples were vigorously shaken and stored at 4°C until analysis.
For MOx rate measurements, 20 ml crimp top vials were filled bubble-free with seawater sample, capped with bromobutyl rubber stoppers that do not impede MOx activity (Niemann et al., 2015). Samples were processed immediately after sampling.
Samples for DOM, particulate matter, chlorophyll a (Chl a), and nutrients were collected in acid-washed (2% HCl) glass bottles (4 × 1000 ml) and stored at 4°C in the dark before processing. Samples were filtered within 6 hours after collection by applying low-pressure vacuum (50 mmHg). Triplicates of particulate matter and Chl a samples were collected on GF/F filters (Whatman) using 1 L of water for each sample. Particulate matterfilters were dried and stored at 25°C until X-ray fluorescence analysis. Chl a filters were folded twice in half, placed in 10 mL high density polyethylene tubes (HDPE), and stored at −80°C. The filtrate was collected into pre-rinsed 60 ml HDPE bottles, stored at −20°C, and used for the determination of the concentrations of nitrate, nitrite, phosphate, silicate, ammonia, dissolved organic carbon (DOC), total dissolved nitrogen, and total dissolved phosphorus.
For solid phase extraction DOM 1 L of filtrate was extracted on 500 mg styrene divinyl benzene polymer type cartridges (PPL, BondElut, Agilent Technologies) using a procedure modified from Dittmar et al. (2008). Briefly, filtrates were acidified to pH 2 by HCl (37% v/v, Merck) and transferred into pre-conditioned (6 ml methanol + 12 ml water) solid phase extraction cartridges. Next, 12 ml pH 2 water were flushed through the cartridge and cartridges were dried under air vacuum for 30 min. Concentrated DOM samples were eluted into combusted, Teflon capped amber glass vials by 2 ml methanol and stored at −20°C in the dark until FT-ICR MS analysis.
Biochemical Analyses
Nitrate + nitrite (further nitrate), silicate, phosphate, ammonium, total dissolved nitrogen and total dissolved phosphorus concentrations were measured colorimetrically (Grasshoff et al., 1999) by a segmented flow nutrient analyzer system (ALPKEM Flow Solution IV, OI Analytical). Dissolved organic nitrogen (DON) and dissolved organic phosphorus (DOP) concentrations were calculated by subtracting concentrations of nitrate + ammonium (DIN; dissolved inorganic nitrogen) from total dissolved nitrogen and phosphate from total dissolved phosphorus.
DOC concentrations were measured based on a high-temperature combustion technique (Qian and Mopper, 1996; Peterson et al., 2003). Unthawed samples were allowed to equilibrate at room temperature and acidified to pH 2 with HCl (37%). 15 ml of sample were then transferred into pre-combusted glass vials of the TOC analyzer (MQ-1001). Deep Ocean DOC samples (Hansell Laboratory, University of Miami) were used as reference material.
Particulate nutrient analyses were measured in triplicates using a method based on wavelength dispersive X-ray fluorescence with a detection limit < 0.1 µg per filter (Paulino et al., 2013) for particulate carbon C, nitrogen (N), and phosphorus (P).
The filters for Chl a concentration stored at −80°C were added to 10 ml methanol (Holm-Hansen and Riemann, 1978) and stored overnight at 4°C. Methanol extracted samples were transferred into pre-cleaned vials and maintained at room temperature. Fluorescence of the sample was measured against methanol blanks with recently calibrated Turner Design fluorometer at 440 nm before and after adding two drops of 5% HCl (Holm-Hansen et al., 1965). Final concentrations were determined using a calibration curve of Chl a standards.
Quantification of dissolved methane in seawater samples was conducted on-board using headspace gas chromatography (ThermoScientific, GC Trace 1310, FID detector, MSieve 5A column). 5 ml from the 120 ml (1250 ml for low concentration surface waters) sample bottles was replaced with high purity nitrogen and allowed to equilibrate at least for 24 hours. For Headspace GC measurement hydrogen was used as a carrier gas and oven temperature was set to 150°C (isothermal). 500 µl headspace was injected with a gas-tight syringe resulting in a detection limit of 1 ppm and 5% standard deviation. Dissolved methane concentration (nmol/L) was calculated using previously published solubility coefficients (Wiesenburg and Guinasso, 1979). Reproducibility of measurements was controlled with 2 ppm and 100 ppm methane containing air standards.
MOx rates was quantified by tritium labelled incubations (Niemann et al., 2015; Steinle et al., 2015) with modifications as described in Ferré et al. (2020). Briefly, hexaplicates of seawater samples were amended with trace amounts of 3H-methane (10 μl gaseous C3H4/N2, ∼25 kBq, <50 pmol CH4, American Radiolabeled Chemicals, United States) and incubated for 72 hours at in situ temperature in the dark. After following the procedure described in aforementioned publications, MOx rates were calculated from the fractional tracer turnover and in situ methane concentrations assuming first order reaction kinetics (Valentine et al., 2001; Reeburgh, 2007). All incubations were corrected for (insubstantial) tracer turnover in killed controls (Steinle et al., 2015).
Fourier-Transform Ion Cyclotron Resonance Mass Spectrometry Analysis and Molecular Formula Assignments
DOM mass spectra were obtained with a custom-built 9.4 T Fourier transform ion cyclotron resonance mass spectrometer (FT-ICR MS) instrument (National High Magnetic Field Laboratory [NHMFL], Tallahassee, Florida, United States). Mass spectra were generated in positive and negative ion electrospray ionization (ESI) mode with the following settings: flow rate 0.5 µL/min, needle voltage ± 2.5 kV, tube lens ± 250 V, heated metal capillary operated at 11.2 W, octopole frequency 2 MHz, frequency sweep rate of 50 Hz/ls and temperature 21.7°C. To generate mass spectra, 50 scans (time domain acquisitions) were co-added for each sample, Hanning apodized, and zero-filled once before fast Fourier transformation and magnitude calculation (Marshall and Verdun, 1990). NHMFL software was used to calibrate the data and generate peak lists for each sample prior to molecular formula assignment. Peak lists were generated with a signal to noise ratio threshold of 6x the baseline root mean square noise and internally calibrated with commonly known DOM methylene (-CH2) compounds spanning across the 200–900 Da mass spectral range. DOM molecular compositions were assigned by PetroOrg (Corilo, 2014). Molecular formula assignments included all possible naturally occurring molecular combinations of C, H, N, O, and S within these ranges: 12C1–100,1H1–200, 14N0–2, 16O1–50, and 34S0–1. Formula confirmation was based on individual monoisotopic mass spectral peaks, error < 1 ppm, and homologous series inclusion, as has been conducted previously for manual composition assignments (D’Andrilli et al., 2015). Sodium and chlorine adducts were also considered during the molecular formula assignment procedure for positive and negative mode, respectively. Assigned molecular formulas were generated for each sample as negative and positive mode except samples PKF-1 at 195 m and SP-1 at 344 m which could not be calibrated in positive mode with acceptable error (<1 ppm). Positive and negative molecular assignments per sample were combined to analyze DOM composition and chemical characterization. For each sample containing duplicate molecular formulas in positive and negative mode, one was discarded from further analysis.
Chemical characterizations for the combined positive and negative formula lists of each sample were conducted to get percentages of 1) atomic heterogeneous contents – CHO, CHNO, CHOS, CHNOS – and 2) H:C and O:C atomic ratios and ranges on van Krevelen diagrams (Kim et al., 2003). Based on the elemental compositions of major biochemical compound groups, specific H:C and O:C ratio ranges were related to four compound classes: 1) lipid- & protein-like (LPD), 2) amino sugar- & carbohydrate-like (CAR), 3) unsaturated hydrocarbon- and condensed aromatic-like (UHC), and 4) lignin- & tannin-like (LGN), whose boundaries were obtained from Hockaday et al. (2009) and Hodgkins et al. (2016) (Supplementary Table S1). Samples were also interpreted by the percentages of the formulas above the molecular lability boundary (MLBL; H:C ≥ 1.5) to compare more bioavailable DOM composition with less bioavailable material across all samples (D’Andrilli et al., 2015). The aromaticity (or the aromatic fraction) of the samples were calculated using the equation given in Hockaday et al. (2009).
Statistical Analyses
Statistical analyses and data visualization were performed using R (R Core Team, 2018) with built-in functions and external packages: Vegan (Oksanen et al., 2018), FactoMineR (Lê et al., 2008), MASS (Venables and Ripley, 2002), and indicspecies (De Cáceres and Legendre, 2009).
Principal component analysis was applied on measured environmental variables to obtain multiple correlation between samples and variables.
Chemical diversity of the DOM molecular formulas for each sample was calculated by the ‘diversity’ function in R, which is analogue to biodiversity in ecology, i.e., the Shannon-Weaver index (Oksanen et al., 2018):
where P is the relative abundance of formula i.
Non-metric multidimensional scaling (NMDS) analysis was applied in three steps on the molecular formula lists to determine the variation of DOM between samples. First, a presence/absence matrix was constructed (samples on rows and formulas on columns). Second, a dissimilarity matrix was calculated based on Jaccard formulation (Jaccard, 1912) on binary (0 or 1) data (e.g., [A + B-2*J]/[A + B-J] where A and B are number of formulas in two compared samples and J is the number of formulas that is common in both samples (Oksanen et al., 2018). Third, an NMDS ordination plot was depicted on two sets of scores in which the separation between the samples was largest. Distribution on the biplot states that closer samples are likely to be more similar than the ones further apart.
Permutational multivariate analysis of variance (PERMANOVA) was calculated on Jaccard distance matrices by using the ‘adonis’ function in the Vegan package in R (Oksanen et al., 2018). PERMANOVA was used to interpret how DOM compositions were influenced by categorical variables such as regional distribution, water masses and seep/non-seep association.
Indicator value indices (IndVal) of all detected formulas were calculated following a method developed by De Cáceres and Legendre (2009). IndVal is a product of two quantities (A: group specificity; B: group fidelity) that allow to define lists of formulas that associated to the predefined groups of sites. Statistical significance (p) of the group association were then tested by permutation test against the null hypothesis that a formula is not more frequently found at a group of sites than at sites not belonging to that group (De Cáceres and Legendre, 2009). A threshold of IndVal ≥ 0.7 and p ≤ 0.01 were taken under 1000 permutations for group association.
Results
Distribution of Water Masses and Environmental Variables
The studied sites were characterized by five main water masses (Figure 2). Three of them were classified within the window of σt density 27.70 and 27.97 kg/m3 (Rudels et al. 2000), with the temperature ranges of > 2°C (Atlantic Water; AW), 0–2°C (Modified Atlantic Water; MAW) and < 0°C (Arctic Water; ArW). Waters with σt ≤ 27.70 kg/m3 were considered as surface water (SW) with a wide range of temperature and salinity. Waters that have σt > 27.97 kg/m3 were classified as Arctic deep water (DW). DW reveals two distinct influences depending on the site location (lower right corner in Figure 2). At VR and YP stations the water column was composed of DW that has formed in the polar region and sank below the AW layer. At the lower part of the SP, on the other hand, DW was characterized by higher salinity which were formed in Storfjorden and sank underneath the MAW layer at the southern tip of Spitsbergen (Quadfasel et al., 1988; Loeng, 1991; Fer et al., 2003; Skogseth et al., 2005).
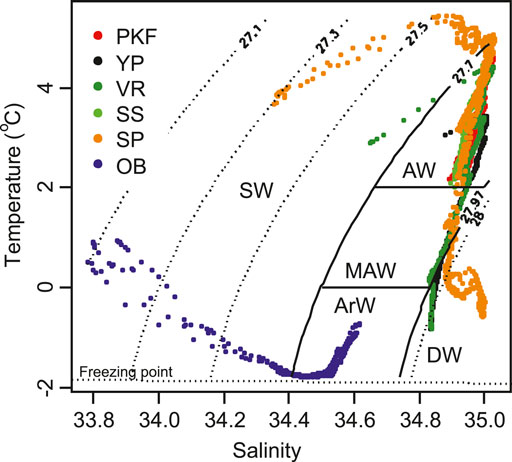
FIGURE 2. Water mass definitions on temperature vs. salinity diagram from the CTD profiles. 27.70–27.97 kg/m3 σt isoclines separate Surface water (SW) and Deep Water (DW) and 0–2°C horizontal temperature lines separate Atlantic Water (AW) and Arctic Water (ArW) from Modified Atlantic Water (MAW). Colored data points indicate the sample data for each region listed in Table 1.
The water column profiles were depicted in Figure 3 by a selected station from each region that represents typical biogeochemical features. As is shown in the figure, the water column was well-mixed at the shallow stations in the PKF, where AW was the dominant water mass with temperature 2°C and salinity 34.9 throughout the water column (Figure 3A). Vertical profiles exhibited clear site-specific patterns for temperature, salinity and density (Figure 3A). At VR and YP, AW occupied the 300–350 m upper layer (Figure 3A). Underneath, the temperature decreased to 0°C with a strong thermocline and MAW extended to the depth of 500 m in YP and 600 m in VR. Underneath MAW, DW displayed a uniform salinity profile (∼34.85) with 0 to −1°C temperature range. Temperature and salinity profiles were distinct in SS and SP despite their proximity (∼30 km). SS was fully occupied with AW (4.3°C, ∼35 salinity) from the surface down to 150 m; at greater depth, temperature decreased slightly to 2°C at the bottom (Figure 3A). Three distinct layers were characterized at SP: a cold, fresh surface layer at the top 20–30 m, a warm and saline AW layer from 30 to 300 m, and cold and saline DW from 300 m to the bottom (Figure 3A). At the OB site strong Arctic influence was prominent with a two-layered structure, consisting of SW (top 20 m) above a sharp pycnocline and ArW from 30 m to the bottom at ∼150 m (Figure 3A).
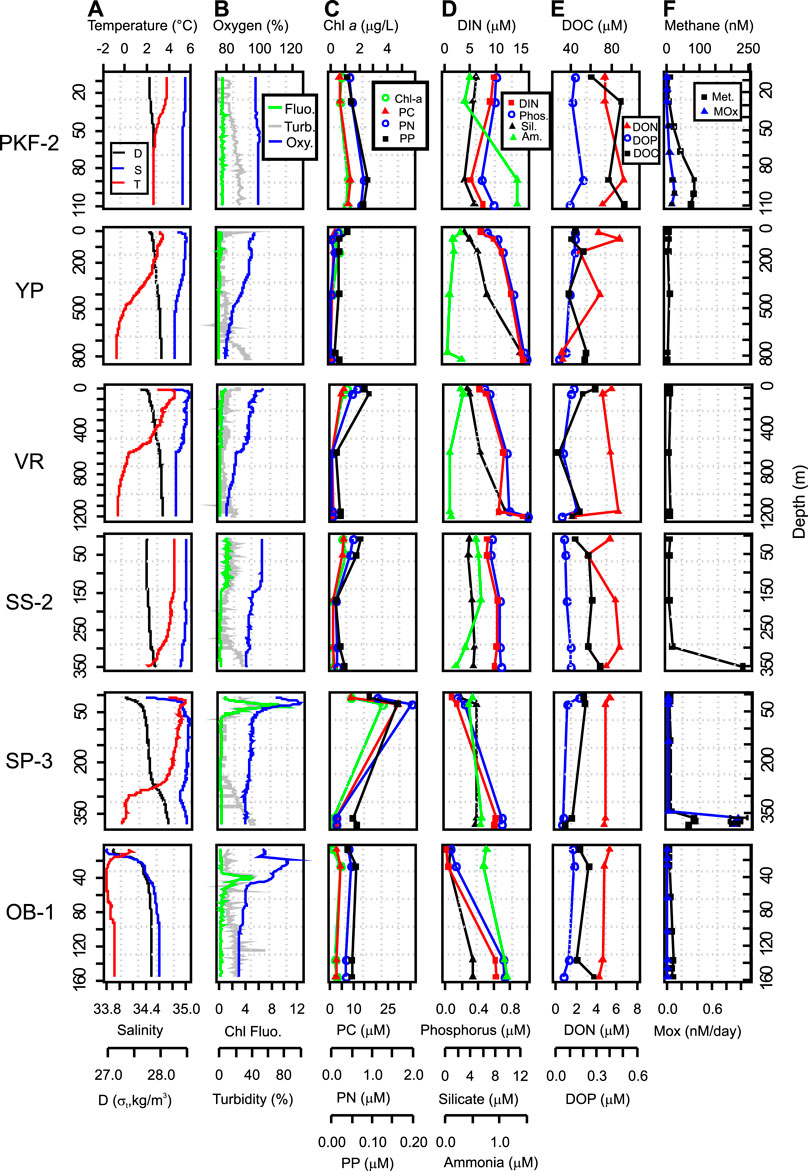
FIGURE 3. Depth profiles of selected stations. Each row of profiles represents the typical features from regions listed in Table 1. Abbreviations are PC, PN, PP, particulate carbon, nitrogen and phosphorus; DOC, DON, DOP, dissolved organic carbon, nitrogen and phosphorus; DIN, dissolved inorganic nitrogen; D, density; T, temperature; S, salinity; Chl Fluo., Chlorophyll fluorescence; Mox, methane oxidation.
Chl fluorescence did not exhibit any clear peak and were around zero in the water column for May 2017 (CAGE-17-1 cruise) whereas distinct maxima were detected at SP and OB at 40 m depth in late June (CAGE-17-2 cruise) (Figure 3B). This difference in Chl fluorescence signal between the cruises was also detected in surface Chl a concentration averages retrieved from satellite data (Supplementary Figure S1). To depict a relative distribution of oxygen more accurately, dissolved oxygen concentrations were converted into oxygen saturation assuming that 100% saturation at 1 atm and 4°C corresponds to 10.92 mg/L. Oxygen saturation varied in 92–102% range within AW that occupied PKF and upper layers of VR, YP, and SS and uniformly decreased to 80–85% at the bottom in DW. Along with the peaks in Chl fluorescence signal, oxygen saturation increased up to 110–125% at the upper layers of OB and SP and dropped back to 85–90% in ArW at the bottom layers (Figure 3B). Turbidity was elevated at the bottom of the water column at all stations and its profiles were analogous to the fluorescence profiles at the upper layers (Figure 3B).
Chl a concentrations ranged from 0.00 to 5.75 µg/L (average 0.75 µg/L) (Supplementary Table S2) with the highest concentration in SP corresponding with the CTD Chl fluorescence peak at 40 m at this site (Figure 3C). Particulate matter concentrations were always in line with the Chl a concentrations (Figure 3C). Maximum concentrations were measured at SP-1 (28 m) for particulate C (35.64 µM) and particulate N (1.93 µM) and in PKF for particulate P (0.21 µM). Chl a vs particulate C, N and P displayed positive linear correlations in all samples (r = 0.93, 0.84, and 0.76, respectively, p < 0.001) (Figures 4C–E).
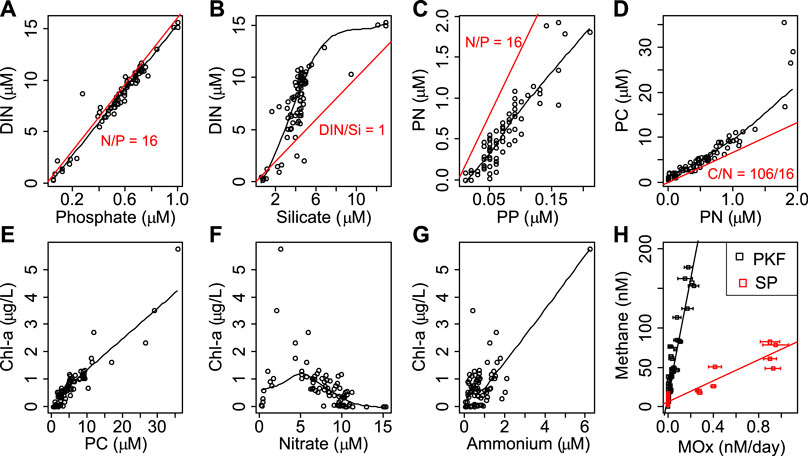
FIGURE 4. Individual relationships between biogeochemical parameters. The black lines show local polynomial regressions between the variables. Redfield ratios are provided in red at the top panel. The relationship between methane and methane oxidation rates (MOx) and corresponding linear regression lines are provided in black and red corresponding to Prins Karl Forland (PKF) and Storfjordrenna Pingos (SP). Error bars represent standard deviation of MOx measurements. Abbreviations are PC, PN, PP, particulate carbon, nitrogen and phosphorus; DIN, dissolved inorganic nitrogen; Chl-a, Chlorophyll a.
Maximum dissolved nutrient concentrations were detected in the DW layer (<800 m; 15.3 µM, 1.00 µM, and 13.0 µM for nitrate, phosphate, and silicate respectively) implying a marked regeneration at depth (Figure 3D). We found lowest concentrations at the OB surface likely due to the dilution by sea-ice meltwaters and earlier surface bloom (Figure 3D). Here, concentrations dropped to 0.19 µM, 0.05 µM, and 0.54 µM for nitrate, phosphate, and silicate, respectively (Supplementary Table S2). Ammonium concentrations varied in a narrow range from 0.04 µM to 2.08 µM in all samples (Supplementary Table S2) except the maximum value (6.21 µM) measured at SP-1 (28 m). DIN and phosphate ratios were close to the Redfield ratio (1958) (ratio of carbon: nitrogen: phosphorus as 106:16:1 often found in marine phytoplankton soft tissue) in all samples (Figure 4). DIN to silicate ratio however, was higher than one in most of the samples.
Our measurements showed that the variation of DOC, DON, and DOP was low comparing all sites (Figure 3E and Supplementary Table S2). The DOC concentration range was from 26.9 to 104.0 µM however, 80% of the measurements were between 40 and 80 µM. The highest DOC concentration was measured at the surface layer (0–5 m) of PKF and the minimum concentration was at the surface of the OB. Similar vertical profiles were observed for DON and DOP concentrations with ranges of 0.00–7.43 µM and 0.00–0.60 µM, respectively (Supplementary Table S2). On average, DON and DOP contributed 39% and 20% of the total dissolved nitrogen and phosphorus pool, respectively, and highest contributions were measured for OB surface water.
Methane concentrations were often elevated in the vicinity of seeps (Figure 3F and Supplementary Figure S2). Dissolved methane resulted in high concentrations in the bottom waters and decreased rapidly to atmospheric equilibrium levels except at PKF (Figure 3F). Here, numerous seeps were located in shallow waters and methane concentrations were ∼five times higher at the surface (14.9 nM) compared to the atmospheric equilibrium (3.2 nM at 34.8 psu and 6°C; (Wiesenburg and Guinasso, 1979)). The highest methane concentration (263 nM) was measured at the bottom of SS-2 (Figure 3F). Average methane concentrations for all stations were 63 nM (bottom), 39 nM (25 m above seafloor) and 9 nM (5 m below surface).
We measured MOx rates at 96 sampling points at PKF, SP, and OB (Supplementarys Table S2 and Figure S2A). Average MOx rates were almost 10 times higher at SP (0.31 nM/day) compared to PKF (0.04 nM/day) and there was no detectable MOx activity at OB (Figure 3 and Supplementary Figure S2B). MOx rates were positively correlated with the methane concentrations in PKF (correlation coefficient r = 0.91, p < 0.001, number of sub-samples n = 64) and SP (r = 0.94, p < 0.001, n = 32) separately and showed two different responses (Figure 4H).
A principal component analysis of the biochemical parameters displayed a correspondence with the water mass characteristics of the samples within the first two principal components (PC) as 36.9 and 21.7% variance explained, respectively (Figure 5). Primary production related parameters (Chl a, particulate C, N, P, Chl fluorescence, ammonium) and dissolved nutrients were the main components on the PC-1 which partially represent the separation between DW and AW, whereas SW largely represented by DON, DOP and oxygen concentrations on the PC-2 axis (Figure 5).
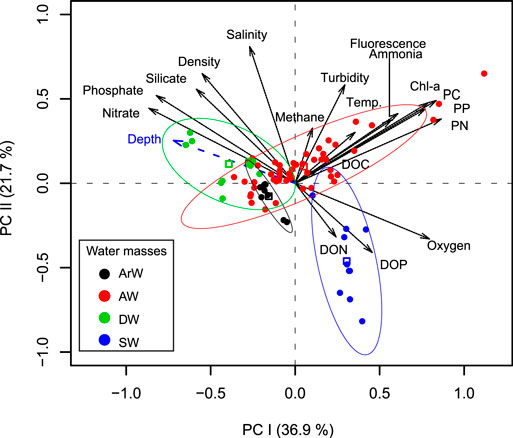
FIGURE 5. Principle Component Analysis biplot of the biochemical parameters. The explained variances are provided on the x- and y-axis in parentheses. Coloured ellipses represent 95% confidence interval for water mass group centroids of Surface water (SW), Deep Water (DW), Atlantic Water (AW), and Arctic Water (ArW). Centroids are represented by open square symbols. Abbreviations are PC, PN, PP, particulate carbon, nitrogen and phosphorus; DIN, dissolved inorganic nitrogen; DOC, DON, DOP, dissolved organic carbon, nitrogen and phosphorus; Chl-a, Chlorophyll a.
Dissolved Organic Matter Molecular Composition
From all the sampling sites, 19,641 distinct formulas were obtained after removing the duplicate formulas in positive and negative mode ESI samples with the molecular mass range of 211 to 989 Da (Figure 6A). From all assigned formulas, 6,947and 2,356 were unique to seep and non-seep samples respectively (Figure 6B), and 10,338 formulas were found in both (Figure 6C). All assigned elemental composition varied in the range of C7-75H6-74N0-2O1-25S0-1 with the percentages of 41% CHO, 39% CHNO, 13% CHNOS, 7% CHOS for seep and 41% CHO, 36% CHNO, 15% CHNOS, 8% CHOS for non-seep samples. Using our modified characterization classification criteria based on H:C and O:C groupings on van Krevelen diagrams, molecular formulas averaged 74% LGN, 8% UHC, 14% LPD, 4% CAR for seep and 76% LGN, 9% UHC, 11% LPD, 4% CAR for non-seep chemical species (Figure 6B).
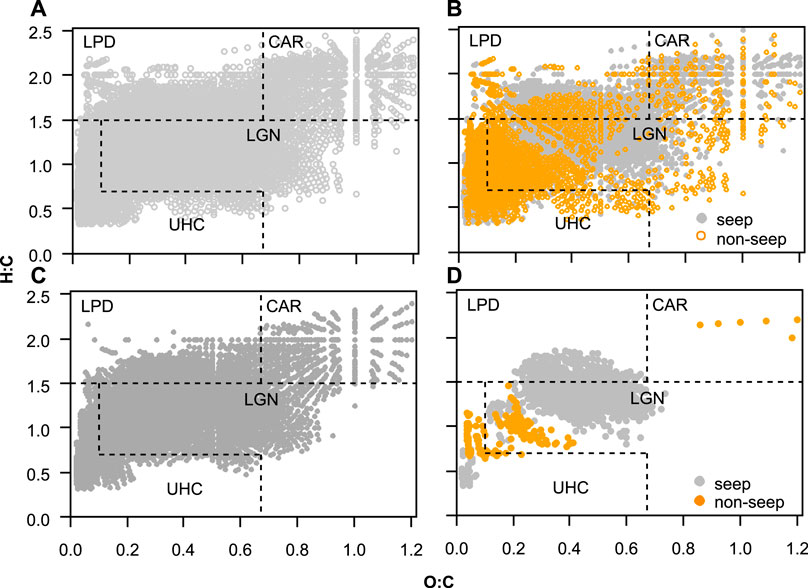
FIGURE 6. (A) All assigned dissolved organic matter formulas in all samples (B) unique molecular formulas that are found in seep (grey) and non-seep (orange) samples (C) molecular formulas commonly found in seep and non-seep samples (D) Seep versus non-seep associated formulas based on comparisons by IndVal analysis (IndVal ≥ 0.7; p ≤ 0.01). Each point in the diagrams represents a single formula assigned from one resolved mass spectral peak. Note: these van Krevelen diagrams contain molecular formulas from combined positive and negative mode ESI FT-ICR MS assignments. Abbreviations are LPD, lipid- and protein-like; CAR, carbohydrate-like; LGN, lignin- &tannin-like; UHC, unsaturated hydrocarbon- &condensed aromatic-like; O:C, oxygen to carbon ratio; H:C, hydrogen to carbon ratio.
IndVal analysis for seep versus non-seep comparisons of all molecular formulas determined that 922 and 129 formulas were associated with the seep and non-seep samples respectively (Figure 6D). That is, the formulas that are more frequently observed in a compound class group (Supplementary Table S1) considered as associated. Given that, seep associated formulas (IndVal ≥ 0.7; p ≤ 0.01) were composed of 72% LGN, 23% LPD, and 5% UHC. Non-seep associated formulas (IndVal ≥ 0.7; p ≤ 0.01) were predominantly composed of LGN (52%), UHC (43%), and only 6 formulas were assigned CAR (5%) chemical species (Figure 6D).
The number of formulas in seep and non-seep samples ranged from 3,211 to 9,534 and from 3,120 to 6,815 respectively (Figure 7A). The lowest number of formulas were obtained in the PKF-7 (non-seep) and the highest number of formulas were obtained in PKF-3 (seep) (Figure 7A). Samples on the seepage sites of PKF and SS were higher in MLBL (18 to 27%) compared to the other samples and had characteristically higher LPD chemical species (12 to 21%) (Figures 7B,C). CAR and UHC contents were highest in non-seep PKF-7 station (8%) and YP station (14%) comparatively and the greatest percentages of LGN (82%) were observed in OB-1 station (Figures 7D–F).
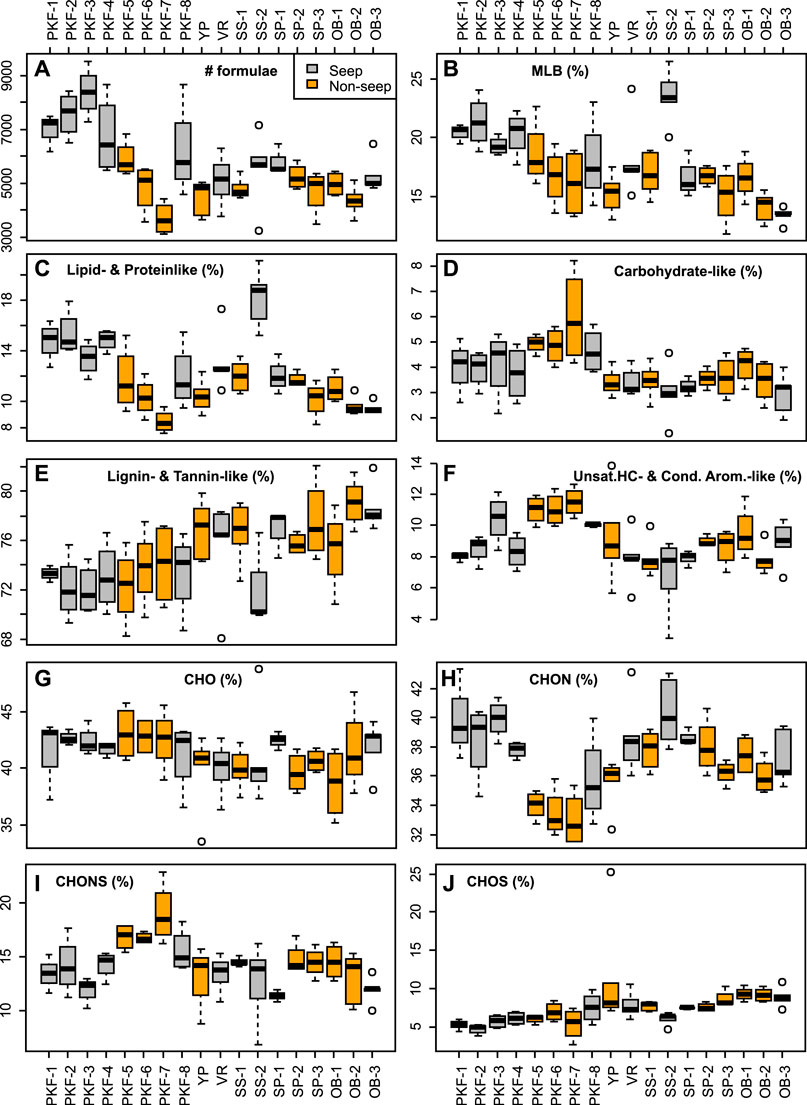
FIGURE 7. Dissolved organic matter composition data determined by ESI FT-ICR MS organized by sampling stations shown as boxplots for (A) number of molecular formulas, (B) percentages of chemical lability (MLBL;; D’Andrilli et al., 2015) (C–F) chemical groups based on modified regions of characterization classes on van Krevelen diagrams (Figure 2), and (G–J) and heteroatomic content. Seep and non-seep stations are colored by grey and orange, respectively. Stations are abbreviated as given in Table 1.
Percentages in CHO and CHOS based formulas were varied in a range from 34 to 49% and 3 to 12%, respectively except the YP bottom sample in which CHOS composition percent was 25% (Figures 7G–I and Supplementary Figure S2). CHON composition percentages were highest in the PKF and SS seep stations (35 to 43%). CHONS composition percentages were highest (23%) in non-seep PKF-7 station (Figure 7J).
NMDS analysis from Jaccard distances based on DOM composition revealed a high level of association at two dimensions (stress = 0.12). Samples from the same site/station displayed similar DOM composition (Figure 8). PERMANOVA test on Jaccard distances revealed that DOM compositions were most significantly (p < 0.001) associated with station (coefficient of determination R2 = 0.59), site (R2 = 0.35) and seep influence (R2 = 0.17). Environmental variables that showed linear correlation to NMDS ordination scores were temperature, salinity, density, oxygen (p < 0.001), methane (p < 0.019), and DOC concentrations (p < 0.028). NMDS scores displayed significant correlations with chemical diversity, number of formulas, heteroatomic compositions and molecular species compositions of the samples (p < 0.001). The most variable DOM composition was found at the PKF seep sites explained by number of formulae and chemical diversity. NMDS biplot revealed that DOM composition of PKF seep samples displayed positive correlation with the percentages of MLBL, LPD, and CHON compositions (Student’s t-test, p < 0.01) and OB samples were associated with higher aromaticity, LGN, and CHOS composition (Student’s t-test, p < 0.01) (Figure 8).
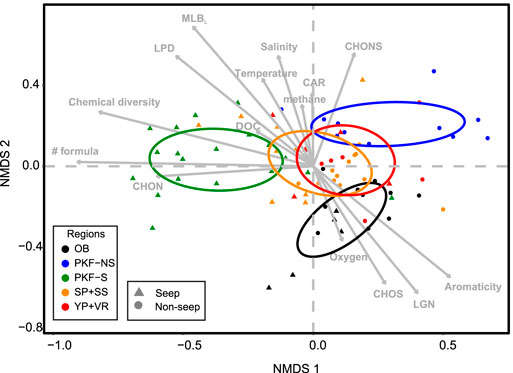
FIGURE 8. Non-metric multidimensional scaling (NMDS) biplot of Jaccard distances from the presence/absence matrix of dissolved organic matter molecular formula compositions containing CcHhNnOoSs by ESI FT-ICR MS. Samples are coded by colour and shape for site and seepage influence, respectively. Arrow vectors represent environmental variables (oxygen, DOC, temperature, salinity, and methane concentration), numerical observations (number of formulas, chemical diversity, aromaticity (Hockaday et al., 2009)) and molecular percentages (CHOS, CHON, CHONS, LPD, LGN, CAR, MLBL,) that show significant correlation (p < 0.05) with the NMDS scores. Coloured ellipses represent 95% confidence interval of the group centroids. Abbreviations are LPD, lipid- and protein-like; CAR, carbohydrate-like; LGN, lignin-&tannin-like; UHC, unsaturated hydrocarbon- &condensed aromatic-like; DOC, dissolved organic carbon; MLBL, percentages of formulas above the molecular lability boundary (D’Andrilli et al. 2015).
Discussion
Oceanographic Characteristics of the Study Sites
As the main driver of the hydrography, the West Spitsbergen Current (WSC) brings AW which gradually mixes with the locally formed cold fjord and shelf waters over the West Spitsbergen Shelf and the Arctic waters in Storfjordrenna and Barents Sea (Loeng, 1991; Harris et al., 1998). Therefore, the water column mainly comprises AW in PKF, VR, YP, SS, and SP sites (Figure 2). DW was dominant in the bottom part of YP, VR, SS, and SP (Figure 3). OB was the only region that was fully occupied by ArW. SW was present in all regions, except at PKF where the well-mixed water column was entirely occupied by AW.
Nutrients and Chl a concentrations were consistent with previous observations in the study sites (Hodal et al., 2012; Tremblay et al., 2015; Randelhoff et al., 2018). Higher nitrate/silicate ratios were apparent in AW (Figure 4B) implying earlier diatom uptake based on 1/1 demand on nitrate and silicate (Erga et al., 2014). Nevertheless, AW seems to be the main source of nutrients in virtue of higher average concentrations and well-developed Chl a sub-surface maxima in the stratified SP region. Ratio of particulate C/N/P – 83/7.6/1 Figures 4A–D in comparison to 106/16/1 - C/N/P Redfield ratio (Redfield, 1958) implies that the nitrogen was the limiting factor on primary production. Yet, the elevation of Chl a and the depletion of nitrate were associated with the increase in ammonia presumably by remineralisation and restored DIN/phosphate ratio back to the Redfield ratio of 16 (Figure 4A). This is also in agreement with the previous findings (Olsen et al. 2003) that defines depletion of nitrate as an indicator of blooms in AW, whereas phosphate and silicate ranges in similar pattern of variability.
Silicate demanding diatoms are the dominant producer in the upper layer of the ArW during the retraction of sea-ice and gradually sink to the deeper layers (Loeng and Drinkwater, 2007). Accordingly, minimum levels of nitrate/silicate ratios were found in ArW as average 2.57 ± 0.7 with depleted surface nutrients indicating a diatom bloom prior to sampling. As the Chl fluorescence peak at 40 m at OB indicates (Figure 3B), the active community of diatoms might have moved along the nitricline in late June.
Bulk concentrations of the dissolved organic matter (DOC, DON, DOP) did not indicate any distinct trend within the studied samples (Figure 3E). High percentages of LPD content and N- containing formulas at PKF were not directly correlated with the bulk DON concentrations. As a proxy to primary production, Chl a concentrations did not show any detectable correlation with the DOM compositions. Chl peaks at SP and the previous diatom bloom at OB were not linked with any unique DOM composition. A similar DOM molecular composition can arise from many biotic processes and these findings may be due to the simultaneous bacterial consumption that follows bio-labile, autochthonous production of DOM. This result is consistent with the previous observation by Osterholz et al. (2014) in Arctic fjords which suggested rapid transformation of DOM by the microbial community without any detectable imprint in neither DOM compositions nor bulk concentrations.
Effect of Hydrography on Methane Concentrations and Methane Oxidation Distributions
Spatial and temporal variability of MOx was shown to be high on the continental margin of Svalbard and at PKF in previous studies where MOx rates were reported between 0.001 and up to 3.2 nM/day (Steinle et al., 2015; Ferré et al., 2020). Our MOx rates from the PKF site (max 0.23 nM/day) were low compared to overall ranges (Supplementary Table S2). Rather than elevated methane concentrations, which were not entirely related to high MOx rates, the size of a MOB community may be the more relevant factor of an active MOB community (Steinle et al., 2015). Moreover, the succession of MOB communities depends largely on circulation patterns and water column hydrography (Steinle et al., 2015; Silyakova et al., 2020). In accordance with this, we observed in our study site-specific positive correlations between methane concentrations and MOx rates at PKF and SP (Figure 4H). MOx was 10 times more efficient at SP (rate constant kMOx = 6 × 10⁻³ day−1) than in PKF (kMOx = 6 × 10⁻⁴ ay−1), presumably due to the difference in the hydrography or the size of methanotrophic community. At SP, a well-defined pycnocline (Figure 4A SP-3 panel) hindered the transport of gas bubbles to upper layers (Damm et al., 2005; Damm et al., 2008; Gentz et al., 2014; Jansson et al., 2019) whereas the vertical transport of methane was easier in uniform and shallow water column at PKF (Figure 4A PKF-2 panel).
Notably, water column stratification and the size of the MOB were possibly not the only parameters affecting MOB efficiency. Since MOx activity was rapidly exhausted at the bottom of SP well before reaching the pycnocline (∼100 m above bottom; Figure 3F SP-3 panel). Water mass distribution and current regimes were different between sites. DW occupied the bottom of SP, whereas PKF was entirely composed of AW (Figure 3A). As previously reported, PKF is influenced by WSC with a strong monthly mean current velocity of 0.2 m/s (von Appen et al., 2016) continuously transporting MOB populations northwards out of the PKF area (Graves et al., 2015; Steinle et al., 2015). In contrast, the mean geostrophic velocity at SP is in the range of 0.02–0.07 m/s (Skogseth et al., 2005; Skogseth et al., 2007). Longer residence times possibly facilitates MOB to metabolize methane more efficiently, therefore higher MOx rates were observed at SP (Figure 3F). MOx was undetected in OB even above the seeps with high methane concentrations (Figure 3F) indicating that a substantial active population of MOB in OB was not present (note that we did not determine MOB community sizes in our survey).
Evaluation of Dissolved Organic Matter Compositions
Analysis of DOM with ESI FT-ICR MS provides a qualitative assessment of molecular-level elemental composition linked to the ionization efficiency of polar constituents of the sample and experimental settings. Using ESI FT-ICR MS, we determined chemical composition, interpreted chemical characteristics, and evaluated the presence or absence of molecular formulas to qualitatively understand DOM composition in the water column at the different sampling sites.
DOM molecular composition patterns were consistent with those of previous reports (Hertkorn et al., 2013; Osterholz et al., 2014; D’Andrilli et al., 2015; Kujawinski et al., 2016), having characteristically large percentages of LGN compounds (68–82%, Figures 6, 7E). Although the FT-ICR MS instrument does not generate structural DOM data, naturally occurring chemical possibilities of CHNOS molecular formula indicate the potential for polycarboxylated substances such as lignins, tannins, terpenes, and carboxyl-rich alicyclic molecules (CRAM) that share similar structural information with a wide range of eukaryotic and prokaryotic membrane constituents and secondary metabolites (Hertkorn et al., 2006). These groups of chemical species are derived from decades of accumulated microbial degradation products which ultimately lead to similar compositional patterns in many marine environments (Koch et al., 2005).
Formulas interpreted as LPD and CAR (12 to 27%, Figures 6, 7B–D) with more hydrogen saturation (H:C ≥ 1.5) are considered to comprise of bio-labile species (D’Andrilli et al., 2015) and likely indicate recent autochthonous microbial production (hours to days). Bio-labile DOM is considered to be most energetically favorable for microbial uptake or for extracellular degradation (Koch et al., 2014; Carlson and Hansell, 2015) and therefore its chemical composition provides insight about the potential biological patterns of seep versus non-seep sites. Accordingly, LPD chemical species were found with greater atomic heterogeneity in seep sites (Figures 7G–J) indicating higher potential for seep-driven microbial activity (Kujawinski, 2011; D’Andrilli et al., 2019).
Three to 14% of the formulas were interpreted as UHC in all samples and similarly represented in seep and non-seep stations (Figure 7F). DOM of this type is most likely generated by legacy sinking of refractory materials (from a microbial perspective), undergoing no further biological degradation, e.g., the end-products of biomass combustion or petrogenic/pyrogenic origin, which were thermally fused in the deep layers of sediment and mechanically brought up into the water column by bubbles and seeping fluids.
All DOM sample molecular compositions were predominantly grouped by site and seep influence (Figure 8). The largest dissimilarity in molecular composition was between the PKF-S (seep stations in PKF) and PKF-NS (non-seep stations in PKF) sites across NMDS-1 axis which correlated with the number of formulas, N-containing composition (see Figure 7H) and chemical diversity (Figure 8). On the diagonal axis between NMDS-1 and NMDS-2, OB DOM composition grouped separately with explained differences positively correlating with the aromaticity, oxygen, CHOS content, and LGN composition. That diagonal axis also implies the correlation of MLBL and LPD composition with the seep samples in PKF and SS. Therefore, we relate higher number of molecular formulas, chemical diversity, CHON composition, and LPD chemical species to unique DOM production at the seep sites. This pattern was most pronounced at PKF-S possibly due to prevalent seepage activity combined with strong ventilation at the shallow water column. We observed a similar pattern also at SS-2 where DOM composition displayed considerably high percentages of bio-labile nature (LPD) compared to the non-seep station SS-1 (Figure 7C). This provides evidence that seep-related microbial processes may have a significant influence on DOM composition with more bio-labile and nitrogen composition.
We suggest that the combination of positive and negative mode ESI contributed greatly to identifying distinct DOM molecular formulas at seep and non-seep sites. CHO and CHON chemical species were more efficiently ionized in positive ESI (Supplementary Figure S5) and provided a more comprehensive analysis of the DOM composition of all samples. Negative ESI is more frequently used in marine DOM research due to its better ionization efficiency of acidic and carboxylic compounds (Sleighter and Hatcher, 2007). However, more information about the polar fraction of marine DOM as well as other natural environments is gained by combining positive and negative ESI FT-ICR MS data sets (Hertkorn et al., 2013; Ohno et al., 2016).
In addition, positive ESI FT-ICR MS also detected unique CHOS composition near the bottom of the YP station (Supplementary Figure S4). These chemical species can be considered as ‘black sulphur’ due to compositional similarity with black carbon and black nitrogen in the condensed aromatics region of the van Krevelen diagram having large hydrogen deficiency and limited oxygenation (Hertkorn et al., 2013; Hertkorn et al., 2016). Although the origin of these chemical species is not known, high sulfur content suggests that anoxic sedimentary microbial processes may play a role in their production.
Do Cold Seeps Alter Dissolved Organic Matter Composition?
Cold seeps in the Arctic Ocean originate from a variety of sources and geochemical mechanisms (Bünz et al., 2012; Sahling et al., 2014; Serov et al., 2015; Andreassen et al., 2017; Panieri et al., 2017). Seeping fluids consist of predominantly methane (99.7–99.9%), yet other hydrocarbons and sulphurous compounds may also migrate with seeping fluids and methane, all of which provide a source for chemosynthetic organisms (Levin, 2005; Vanreusel et al., 2009; Panieri et al., 2017; Sen et al., 2018; Åström et al., 2018). Seeping gases form bubbles and rise up through the water column (Westbrook et al., 2009; Berndt et al., 2014). Along its trajectory towards the upper layers, methane exchanges with more abundant dissolved gases such as nitrogen, enriched in the surrounding water and promotes MOx (James et al., 2016; Steinle et al., 2016; Jansson et al., 2019). Hydroacoustic surveys demonstrated that seeps can stay active for weeks to decades (Gentz et al., 2014; Veloso-Alarcón et al., 2019) however, the fate of methane at active flares sites is highly dependent on bubble size, salinity, and water velocity (Jansson et al., 2019). Therefore, considering the effects of ocean currents, upwelling, or redox changes, availability of methane for MOB can be sporadic and the potential rates may not be maintained persistently (Reeburgh, 2007; Mau et al., 2013; Steinle et al., 2015; Steinle et al., 2016; Steinle et al., 2017). For this reason, seep influence on DOM composition was not always directly linked to methane concentration, and seep versus non-seep definition was solely based on echosounder data. Since MOx is the main removal mechanism of dissolved methane in the water column, low concentration of methane at seep stations (e.g., VR) may indicate efficient microbial filtering which eliminates methane simultaneous to its dispersion. Oppositely, high concentration of methane at non-seep stations (e.g., SP-3, PKF-5, and PKF-6; see Supplementary Figure S2A) may indicate inefficiency of MOx or advection of MOB by currents.
We found a significant correlation between seep activity and DOM composition in terms of its bio-lability, chemical diversity, number of formulas and LPD as well as CHON formula contents (Figures 7, 8). Naturally, MOx is a likely mechanism driving variation in DOM compositions at seep and non-seep stations. However, correlation between seep activity and DOM composition was not observed directly by MOx rates or methane concentrations (Supplementary Figure S2). For instance, despite the differences in DOM compositions, non-seep stations in PKF and SP had similar ranges of MOx rates with the seep stations in the same sites (Supplementary Figure S2B). One possible explanation may be the dynamic hydrography and consequent elimination of MOx in the region (Steinle et al., 2015). All observed ranges of methane concentrations and MOx rates were low during our survey compared to the results reported at Berndt et al. (2014) and Steinle et al. (2015) and slightly higher than Ferré et al. (2020). However, it is possible that distinct DOM composition associated with MOx activity would persist even if MOB communities diminished, MOx rates decreased, and lower concentrations of methane were measured. In effect, this may lead to a “legacy” fingerprint of methane-influenced DOM composition in the water column, which may be considerably diverse. Therefore, we attribute the largest variety of DOM compositions for seep vs. non-seep comparisons to a multitude of biogeochemical factors rather than one driving variable such as MOx rates or methane concentration. This effect was most noticeable at PKF where the contrast in seepage activity (number of active seeps; see Figure 1) and DOM composition was highly variable from seep to non-seep locations.
Although we hypothesised that MOx would be the main cause of the compositional differences of DOM in seep sites to non-seep sites, other mechanisms may contribute to DOM signatures such as seep-driven primary production. Pohlman et al. (2017) showed that the carbon dioxide uptake rate was two times higher at the seep site of PKF than at the non-seep coastal site. They suggested that stimulation of primary production and consequent decrease of the carbon dioxide level were enhanced with the contribution of methane-enriched bottom waters. The compositional differences we observed might support this hypothesis since more bio-labile and heterogeneous composition may be an indication of fresh primary production at the seep site. However, similar to the MOx rates and methane concentrations, Chl a concentration, Chl fluorescence, or nutrient concentrations did not display any noticeable trend from seep to non-seep sites (Supplementary Figure S1).
Seeping DOM is another possible mechanism for the compositional differences at seep and non-seep sites. Sedimentary methanotrophic microbes are predominantly anaerobic (Knittel and Boetius, 2009) and likely produce chemical species, different from the metabolites released from active MOB in the overlaying methane-rich water masses. Sedimentary-derived metabolites reach the upper water layers by ventilation due to the upstream of bubbles and vertical mixing, thereby potentially modifying the DOM composition at seep sites. Seeping DOM and consequent compositional differences were previously shown in hydrothermal vents by stable carbon isotope analyses, highlighting the role of crustal microbial communities in DOM synthesis, strong enough to change the compositional character of the overlying ocean (McCarthy et al., 2011). Similarly, Pohlman et al., (2011) showed the contribution of sedimentary DOC flux from methane hydrate seeps to the deep seawater. However, both studies indicated that carbon flux from the sediment was 14C-depleted, considerably aged (5,000 to 15,000 years) and possibly consisting of recalcitrant nature which may be contributing to the LGN chemical species observed at the seep sites.
Lastly, DOM composition may be affected by seep-driven microbial modifications. For instance, continuous methane flow from the seafloor might disturb higher trophic level organisms which feed on DOM consumers and autochthonous DOM producers enumerate rapidly above seeps. To our knowledge, this theory has not been previously studied at seep sites. However, in glucose augmented incubation experiments, Kujawinski et al. (2016) showed that organisms larger than 1.0 µm dominantly affected the bacterial diversity and the DOM composition in seawater. They found that the DOM composition was comprised of lipid- and peptide-like chemical species in <1.0 µm filtered surface sea water during the nine days incubation. Unfortunately, despite the number of studies on MOB taxonomy (Kalyuzhnaya et al., 2019), DOM composition coupling with other microbes and higher organisms remains unknown.
Overall, the mechanisms of different DOM compositions at seep and non-seep sites are likely a combination of many factors. MOx, seep fertilization, seep-driven microbial modifications, and seeping of sedimentary DOM are identified here as possible factors. DOM reflects a number of geochemical and molecular processes on different timescales and potentially years of aggregation whereas seep-driven processes are site specific and may only persist on shorter timescales. Therefore, the modification of DOM by seep-driven processes and relative contribution on total water column biogeochemistry is difficult to capture in situ when the other factors are not constrained. Controlled experiments with constrained effects may target the exact products more specifically.
Summary and Conclusion
Cold seeps are being studied intensively due to the possible influence of escaping methane on atmospheric gas compositions and consequent effect on global climate change. Our investigation in the water column showed that the direct and indirect impacts of seeping fluids are also evident for water column biogeochemical concentrations and DOM composition. Our findings at cold seeps of the continental shelf of Svalbard and in the Barents Sea revealed that DOM composition is associated with methane influenced water column activity and spatial distribution of active seeps. DOM appeared more bio-labile and had higher chemical diversity and LPD composition at seeps compared to non-seep areas. Compositional differences of DOM between seep and non-seep sites might be related to a multitude of environmental factors such as MOx, seep fertilization, seep-driven microbial modifications, and seeping of sedimentary DOM. However, no single process was identified as the sole mechanism for unique DOM composition at these sites. DOM composition did not directly correlate to Chl a, nutrient concentration, or water temperature, but the hydrography and the nutrient distributions confirmed the local influences of main water masses and primary production cycles.
The underlying mechanisms of seep influence on DOM compositions are yet to be elaborated in controlled laboratory experiments. In order to link the production and consumption of DOM composition to certain seep-specialized microbial groups, incubation experiments with controlled variables (e.g., microbial cultures, temperatures, methane and nutrient concentrations) and further metabolomics analyses on microbe vs. DOM interactions are needed. Expectedly, combinations of all ongoing processes and co-occurring microbial consortia are extremely complex and possibly hinder identifiable interactions on DOM compositions, however in our study, we showed that unique seep DOM compositions and character can be identified. We recommend the analysis technique of ultrahigh resolution mass spectrometry that we used for our analyses as a promising tool to decipher methane seep associated patterns at the molecular level. Moreover, our combination of biological and chemical techniques provided insight into methane-driven biogeochemical DOM processes in the ocean water column.
Data Availability Statement
The data and the code for statistical analyses are available in the UiT Open Research Data repository in Sert et al. (2020).
Author Contributions
MS, FG, AS, and HN designed the study. MS, FG, and HN collected samples. FG and HN measured methane oxidation rates. JD analyzed dissolved organic matter samples, generated formula lists and wrote mass spectrometry methodology. MS wrote the paper with considerable input from JD, FG, HN, MG, AP, BF, and AS.
Funding
This study is funded by the Research Council of Norway through CAGE (Centre for Gas Hydrate, Environment and Climate) project number 223259. The publication charges for this article have been funded by a grant from the publication fund of UiT The Arctic University of Norway. AP and MG were supported by the Norwegian Polar Institute and the Polish‐Norwegian Research Programme operated by the National Centre for Research and Development under the Norwegian Financial Mechanism 2009–2014 in the frame of project contract Pol–Nor/197511/40/ 2013, CDOM‐HEAT.
Conflict of Interest
The authors declare that the research was conducted in the absence of any commercial or financial relationships that could be construed as a potential conflict of interest.
Acknowledgments
We would like to acknowledge the crew of R/V Helmer Hanssen during the cruises CAGE-17-1 and CAGE-17-2 and chief scientists Tine Rasmussen and Giuliana Panieri. We thank Colin A. Stedmon for DOC concentration analyses and valuable discussion on DOM dynamics. Authors would like to thank Jorun Karin Egge, Sigrid Øygarden, Matteus Lindgren, and Linda Fonnes Lunde for the analyses of particulate matter, chlorophyll a, methane and nutrients. FT-ICR mass spectra were generated at the National High Magnetic Field Laboratory (NHMFL), Tallahassee, FL, United States, supported by funding through the National Science Foundation Division of Materials Research 1644779 and the State of Florida. We acknowledge Dr. Rebecca Ware and the Ion Cyclotron Resonance Facility Staff at the NHMFL for FT-ICR MS instrument support and data processing challenges.
Supplementary Material
The Supplementary Material for this article can be found online at: https://www.frontiersin.org/articles/10.3389/feart.2020.552731/full#supplementary-material.
References
Amon, R. M. W.,, and Benner, R. (1994). Rapid cycling of high-molecular-weight dissolved organic matter in the ocean. Nature 369, 549–552. doi:10.1038/369549a0
Andreassen, K., Hubbard, A., Winsborrow, M., Patton, H., Vadakkepuliyambatta, S., Plaza-Faverola, A., et al. (2017). Massive blow-out craters formed by hydrate-controlled methane expulsion from the Arctic seafloor. Science 356, 948–953. doi:10.1126/science.aal4500
Åström, E. K. L., Carroll, M. L., Ambrose, W. G., Sen, A., Silyakova, A., and Carroll, J. (2018). Methane cold seeps as biological oases in the high-Arctic deep sea. Limnol. Oceanogr. 63, S209–S231. doi:10.1002/lno.10732
Berndt, C., Feseker, T., Treude, T., Krastel, S., Liebetrau, V., Niemann, H., et al. (2014). Temporal constraints on hydrate-controlled methane seepage off svalbard. Science 343, 284–287. doi:10.1126/science.1246298
Bünz, S., Polyanov, S., Vadakkepuliyambatta, S., Consolaro, C., and Mienert, J. (2012). Active gas venting through hydrate-bearing sediments on the vestnesa ridge, offshore w-svalbard. Mar. Geol. 332-334, 189–197. doi:10.1016/j.margeo.2012.09.012
Carlson, C. A., Ducklow, H. W., and Michaels, A. F. (1994). Annual flux of dissolved organic carbon from the euphotic zone in the northwestern Sargasso Sea. Nature 371, 405–408. doi:10.1038/371405a0
Carlson, C. A., Hansell, D. A., Nelson, N. B., Siegel, D. A., Smethie, W. M., Khatiwala, S., et al. (2010). Dissolved organic carbon export and subsequent remineralization in the mesopelagic and bathypelagic realms of the north atlantic basin. Deep Sea Res. Part II Top. Stud. Oceanogr. 57, 1433–1445. doi:10.1016/j.dsr2.2010.02.013
Carlson, C. A.,, and Hansell, D. A. (2015). “Chapter 3 - DOM sources, sinks, reactivity, and budgets,” in Biogeochemistry of marine dissolved organic matter. 2nd Edn, Editors D. A., Hansell, and C. A., Carlson (Boston, MA: Academic Press), 65–126.
Damm, E., Mackensen, A., Budéus, G., Faber, E., and Hanfland, C. (2005). Pathways of methane in seawater: plume spreading in an Arctic shelf environment (SW-Spitsbergen). Continent. Shelf Res. 25, 1453–1472. doi:10.1016/j.csr.2005.03.003
Damm, E., Kiene, R. P., Schwarz, J., Falck, E., and Dieckmann, G. (2008). Methane cycling in Arctic shelf water and its relationship with phytoplankton biomass and DMSP. Mar. Chem. 109, 45–59. doi:10.1016/j.marchem.2007.12.003
De Cáceres, M.,, and Legendre, P. (2009). Associations between species and groups of sites: indices and statistical inference. Ecology 90, 3566–3574. doi:10.1890/08-1823.1
Dittmar, T., Koch, B., Hertkorn, N., and Kattner, G. (2008). A simple and efficient method for the solid-phase extraction of dissolved organic matter (SPE-DOM) from seawater. Limnol. Oceanogr. Methods 6, 230–235. doi:10.4319/lom.2008.6
D’Andrilli, J., Cooper, W. T., Foreman, C. M., and Marshall, A. G. (2015). An ultrahigh-resolution mass spectrometry index to estimate natural organic matter lability: FTICRMS organic matter molecular lability index. Rapid Commun. Mass Spectrom. 29, 2385–2401. doi:10.1002/rcm.7400
D’Andrilli, J., Junker, J. R., Smith, H. J., Scholl, E. A., and Foreman, C. M. (2019). DOM composition alters ecosystem function during microbial processing of isolated sources. Biogeochemistry 142 (2), 281–298. doi:10.1007/s10533-018-00534-5
Erga, S. R., Ssebiyonga, N., Hamre, B., Frette, Ø., Rey, F., and Drinkwater, K. (2014). Nutrients and phytoplankton biomass distribution and activity at the Barents Sea polar front during summer near hopen and storbanken. J. Mar. Syst. 130, 181–192. doi:10.1016/j.jmarsys.2012.12.008
Fer, I., Skogseth, R., Haugan, P. M., and Jaccard, P. (2003). Observations of the storfjorden overflow. Deep Sea Res. Oceanogr. Res. Pap. 50, 1283–1303. doi:10.1016/S0967-0637(03)00124-9
Ferré, B., Jansson, P. G., Moser, M., Serov, P., Portnov, A., Graves, C. A., et al. (2020). Reduced methane seepage from Arctic sediments during cold bottom-water conditions. Nat. Geosci. 13, 144–148. doi:10.1038/s41561-019-0515-3
Ferré, B., Mienert, J., and Feseker, T. (2012). Ocean temperature variability for the past 60 years on the norwegian-svalbard margin influences gas hydrate stability on human time scales: bottom water temperature and gas hydrate. J. Geophys. Res. Oceans C10017. doi:10.1029/2012jc008300
Gentz, T., Damm, E., Schneider von Deimling, J., Mau, S., McGinnis, D. F., and Schlüter, M. (2014). A water column study of methane around gas flares located at the West Spitsbergen continental margin. Continent. Shelf Res. 72, 107–118. doi:10.1016/j.csr.2013.07.013
Grasshoff, K., Kremling, K., and Ehrhardt, M. (1999). Methods of seawater analysis. 3rd, completely revised and enlarged edition. New York, NY: Wiley VCH.
Graves, C. A., Steinle, L., Rehder, G., Niemann, H., Connelly, D. P., Lowry, D., et al. (2015). Fluxes and fate of dissolved methane released at the seafloor at the landward limit of the gas hydrate stability zone offshore western svalbard: dissolved methane OFF western svalbard. J. Geophys. Res. Oceans 120, 6185–6201. doi:10.1002/2015JC011084
Hanson, R. S.,, and Hanson, T. E. (1996). Methanotrophic bacteria. Microbiol. Rev. 60, 439–471. doi:10.1128/mmbr.60.2.439-471
Harris, C. L., Plueddemann, A. J., and Gawarkiewicz, G. G. (1998). Water mass distribution and polar front structure in the western Barents Sea. J. Geophys. Res. 103, 2905–2917. doi:10.1029/97JC02790
Hertkorn, N., Benner, R., Frommberger, M., Schmitt-Kopplin, P., Witt, M., Kaiser, K., et al. (2006). Characterization of a major refractory component of marine dissolved organic matter. Geochem. Cosmochim. Acta 70, 2990–3010. doi:10.1016/j.gca.2006.03.021
Hertkorn, N., Harir, M., Koch, B. P., Michalke, B., and Schmitt-Kopplin, P. (2013). High-field NMR spectroscopy and FTICR mass spectrometry: powerful discovery tools for the molecular level characterization of marine dissolved organic matter. Biogeosciences 10, 1583–1624. doi:10.5194/bg-10-1583-2013
Hertkorn, N., Harir, M., Cawley, K. M., Schmitt-Kopplin, P., and Jaffé, R. (2016). Molecular characterization of dissolved organic matter from subtropical wetlands: a comparative study through the analysis of optical properties, NMR and FTICR/MS. Biogeosciences 13, 2257–2277. doi:10.5194/bg-13-2257-2016
Hockaday, W. C., Purcell, J. M., Marshall, A. G., Baldock, J. A., and Hatcher, P. G. (2009). Electrospray and photoionization mass spectrometry for the characterization of organic matter in natural waters: a qualitative assessment. Limnol. Oceanogr. Methods 7, 81–95. doi:10.4319/lom.2009.7.81
Hodal, H., Falk-Petersen, S., Hop, H., Kristiansen, S., and Reigstad, M. (2012). Spring bloom dynamics in Kongsfjorden, Svalbard: nutrients, phytoplankton, protozoans and primary production. Polar Biol. 35, 191–203. doi:10.1007/s00300-011-1053-7
Hodgkins, S. B., Tfaily, M. M., Podgorski, D. C., McCalley, C. K., Saleska, S. R., Crill, P. M., et al. (2016). Elemental composition and optical properties reveal changes in dissolved organic matter along a permafrost thaw chronosequence in a subarctic peatland. Geochem. Cosmochim. Acta 187, 123–140. doi:10.1016/j.gca.2016.05.015
Holm-Hansen, O., Lorenzen, C. J., Holmes, R. W., and Strickland, J. D. H. (1965). Fluorometric determination of chlorophyll. ICES J. Mar. Sci. 30, 3–15. doi:10.1093/icesjms/30.1.3
Holm-Hansen, O., and Riemann, B. (1978). Chlorophyll a determination: improvements in methodology. Oikos 30, 438–447. doi:10.2307/3543338
Jaccard, P. (1912). The distribution of the flora in the alpine zone.1. New Phytol. 11, 37–50. doi:10.1111/j.1469-8137.1912.tb05611.x
James, R. H., Bousquet, P., Bussmann, I., Haeckel, M., Kipfer, R., Leifer, I., et al. (2016). Effects of climate change on methane emissions from seafloor sediments in the Arctic Ocean: a review. Limnol. Oceanogr. 61, S283–S299. doi:10.1002/lno.10307
Jansson, P., Ferré, B., Silyakova, A., Dølven, K. O., and Omstedt, A. (2019). A new numerical model for understanding free and dissolved gas progression toward the atmosphere in aquatic methane seepage systems: marine two-phase gas model in one dimension. Limnol. Oceanogr. Methods 17, 223. doi:10.1002/lom3.10307
Kalyuzhnaya, M. G., Gomez, O. A., and Murrell, J. C. (2019). “The methane-oxidizing bacteria (methanotrophs),” in Taxonomy, genomics and ecophysiology of hydrocarbon-degrading microbes handbook of hydrocarbon and lipid microbiology. Editor T. J., McGenity (Cham, Switzerland: Springer International Publishing), 1–34.
Kalyuzhnaya, M. G., Yang, S., Rozova, O. N., Smalley, N. E., Clubb, J., Lamb, A., et al. (2013). Highly efficient methane biocatalysis revealed in a methanotrophic bacterium. Nat. Commun. 4, 2785. doi:10.1038/ncomms3785
Kim, S., Kramer, R. W., and Hatcher, P. G. (2003). Graphical method for analysis of ultrahigh-resolution broadband mass spectra of natural organic matter, the van krevelen diagram. Anal. Chem. 75, 5336–5344. doi:10.1021/ac034415p
Knittel, K.,, and Boetius, A. (2009). Anaerobic oxidation of methane: progress with an unknown process. Annu. Rev. Microbiol. 63, 311–334. doi:10.1146/annurev.micro.61.080706.093130
Koch, B. P., Kattner, G., Witt, M., and Passow, U. (2014). Molecular insights into the microbial formation of marine dissolved organic matter: recalcitrant or labile?. Biogeosciences 11, 4173–4190. doi:10.5194/bg-11-4173-2014
Koch, B. P., Witt, M., Engbrodt, R., Dittmar, T., and Kattner, G. (2005). Molecular formulae of marine and terrigenous dissolved organic matter detected by electrospray ionization Fourier transform ion cyclotron resonance mass spectrometry. Geochem. Cosmochim. Acta 69, 3299–3308. doi:10.1016/j.gca.2005.02.027
Kujawinski, E. B. (2011). The impact of microbial metabolism on marine dissolved organic matter. Annu. Rev. Mar. Sci. 3, 567–599. doi:10.1146/annurev-marine-120308-081003
Kujawinski, E. B., Longnecker, K., Barott, K. L., Weber, R. J. M., and Kido Soule, M. C. (2016). Microbial community structure affects marine dissolved organic matter composition. Front. Mar. Sci. 3. doi:10.3389/fmars.2016.00045
Lê, S., Josse, J., and Husson, F. (2008). FactoMineR: a package for multivariate analysis. J. Stat. Software 25, 1–18. doi:10.18637/jss.v025.i01
Lechtenfeld, O. J., Kattner, G., Flerus, R., McCallister, S. L., Schmitt-Kopplin, P., and Koch, B. P. (2014). Molecular transformation and degradation of refractory dissolved organic matter in the Atlantic and Southern Ocean. Geochem. Cosmochim. Acta 126, 321–337. doi:10.1016/j.gca.2013.11.009
Levin, L. A. (2005). Ecology of cold seep sediments: interactions of fauna with flow, chemistry and microbes. Oceanogr. Mar. Biol. 43, 1–46. doi:10.1201/9781420037449-3
Loeng, H.,, and Drinkwater, K. (2007). An overview of the ecosystems of the Barents and Norwegian Seas and their response to climate variability. Deep Sea Res. Part II Top. Stud. Oceanogr. 54, 2478–2500. doi:10.1016/j.dsr2.2007.08.013
Loeng, H. (1991). Features of the physical oceanographic conditions of the Barents Sea. Polar Res. 10, 5–18. doi:10.3402/polar.v10i1.6723
Marshall, A. G.,, and Verdun, F. R. (1990). Fourier transforms in NMR, optical, and mass spectrometry. Amsterdam, Netherlands: Elsevier.
Mau, S., Blees, J., Helmke, E., Niemann, H., and Damm, E. (2013). Vertical distribution of methane oxidation and methanotrophic response to elevated methane concentrations in stratified waters of the arctic fjord storfjorden (Svalbard, Norway). Biogeosciences 10, 6267–6278. doi:10.5194/bg-10-6267-2013
McCarthy, M. D., Beaupré, S. R., Walker, B. D., Voparil, I., Guilderson, T. P., and Druffel, E. R. M. (2011). Chemosynthetic origin of 14C-depleted dissolved organic matter in a ridge-flank hydrothermal system. Nat. Geosci. 4, 32–36. doi:10.1038/ngeo1015
Murrell, J. C. (20101953–1966). “The aerobic methane oxidizing bacteria (methanotrophs),” in Handbook of hydrocarbon and lipid microbiology. Editor K. N., Timmis (Berlin, Heidelberg: Springer).
Myhre, C. L., Ferré, B., Platt, S. M., Silyakova, A., Hermansen, O., Allen, G., et al. (2016). Extensive release of methane from Arctic seabed west of Svalbard during summer 2014 does not influence the atmosphere. Geophys. Res. Lett. 43, 4624. doi:10.1002/2016GL068999
Niemann, H., Steinle, L., Blees, J., Bussmann, I., Treude, T., Krause, S., et al. (2015). Toxic effects of lab-grade butyl rubber stoppers on aerobic methane oxidation. Limnol. Oceanogr. Methods 13, 40–52. doi:10.1002/lom3.10005
Ohno, T., Sleighter, R. L., and Hatcher, P. G. (2016). Comparative study of organic matter chemical characterization using negative and positive mode electrospray ionization ultrahigh-resolution mass spectrometry. Anal. Bioanal. Chem. 408, 2497–2504. doi:10.1007/s00216-016-9346-x
Oksanen, J., Blanchet, F. G., Friendly, M., Kindt, R., Legendre, P., McGlinn, D., et al. (2018). Vegan: community ecology package. Available at: https://CRAN.R-project.org/package=vegan.
Olsen, A., Johannessen, T., and Rey, F. (2003). On the nature of the factors that control spring bloom development at the entrance to the Barents Sea and their interannual variability. Sarsia 88, 379–393. doi:10.1080/00364820310003145
Osterholz, H., Dittmar, T., and Niggemann, J. (2014). Molecular evidence for rapid dissolved organic matter turnover in Arctic fjords. Mar. Chem. 160, 1–10. doi:10.1016/j.marchem.2014.01.002
Panieri, G., Bünz, S., Fornari, D. J., Escartin, J., Serov, P., Jansson, P., et al. (2017). An integrated view of the methane system in the pockmarks at Vestnesa Ridge, 79°N. Mar. Geol. 390, 282–300. doi:10.1016/j.margeo.2017.06.006
Paulino, A. I., Heldal, M., Norland, S., and Egge, J. K. (2013). Elemental stoichiometry of marine particulate matter measured by wavelength dispersive X-ray fluorescence (WDXRF) spectroscopy. J. Mar. Biol. Ass. 93, 2003–2014. doi:10.1017/S0025315413000635
Peterson, M. L., Lang, S. Q., Aufdenkampe, A. K., and Hedges, J. I. (2003). Dissolved organic carbon measurement using a modified high-temperature combustion analyzer. Mar. Chem. 81, 89–104. doi:10.1016/S0304-4203(03)00011-2
Pohlman, J. W., Bauer, J. E., Waite, W. F., Osburn, C. L., and Chapman, N. R. (2011). Methane hydrate-bearing seeps as a source of aged dissolved organic carbon to the oceans. Nat. Geosci. 4, 37–41. doi:10.1038/ngeo1016
Pohlman, J. W., Greinert, J., Ruppel, C., Silyakova, A., Vielstädte, L., Casso, M., et al. (2017). Enhanced CO2 uptake at a shallow Arctic Ocean seep field overwhelms the positive warming potential of emitted methane. Proc. Natl. Acad. Sci. U.S.A. 114, 5355–5360. doi:10.1073/pnas.1618926114
Qian, J.,, and Mopper, K. (1996). Automated high-performance, high-temperature combustion total organic carbon analyzer. Anal. Chem. 68, 3090–3097. doi:10.1021/ac960370z
Quadfasel, D., Rudels, B., and Kurz, K. (1988). Outflow of dense water from a svalbard fjord into the fram strait. Deep Sea Res. Part A. Oceanogr. Res. Papers 35, 1143–1150. doi:10.1016/0198-0149(88)90006-4
R Core Team (2018). R: a language and environment for statistical computing. Vienna, Austria: R Foundation for Statistical Computing.
Randelhoff, A., Reigstad, M., Chierici, M., Sundfjord, A., Ivanov, V., Cape, M., et al. (2018). Seasonality of the physical and biogeochemical hydrography in the inflow to the arctic ocean through fram strait. Front. Mar. Sci. 5, 224. doi:10.3389/fmars.2018.00224
Redfield, A. (1958). The biological control of chemical factors in the environment. Sci. Prog. 11, 150–170.
Reeburgh, W. S. (2007). Oceanic methane biogeochemistry. Chem. Rev. 107, 486–513. doi:10.1021/cr050362v
Repeta, D. J. (2015). “Chapter 2–chemical characterization and cycling of dissolved organic matter,” in Biogeochemistry of marine dissolved organic matter. 2nd Edn, Editors D. A., Hansell, and C. A., Carlson (Boston, MA: Academic Press), 21–63.
Rudels, B., Meyer, R., Fahrbach, E., Ivanov, V. V., Østerhus, S., Quadfasel, D., et al. (2000). Water mass distribution in fram strait and over the Yermak Plateau in summer 1997. Ann. Geophys. 18, 687–705. doi:10.1007/s00585-000-0687-5
Sahling, H., Römer, M., Pape, T., Bergès, B., dos Santos Fereirra, C., Boelmann, J., et al. (2014). Gas emissions at the continental margin west of Svalbard: mapping, sampling, and quantification. Biogeosciences 11, 6029–6046. doi:10.5194/bg-11-6029-2014
Sen, A., Åström, E. K. L., Hong, W.-L., Portnov, A., Waage, M., Serov, P., et al. (2018). Geophysical and geochemical controls on the megafaunal community of a high Arctic cold seep. Biogeosciences 15, 4533–4559. doi:10.5194/bg-15-4533-2018
Serov, P., Portnov, A., Mienert, J., Semenov, P., and Ilatovskaya, P. (2015). Methane release from pingo-like features across the South Kara Sea shelf, an area of thawing offshore permafrost. J. Geophys. Res. Earth Surf. 120, 1515–1529. doi:10.1002/2015JF003467
Sert, M. F., D’Andrilli, J., Gründger, F., Niemann, H., Granskog, M. A., Pavlov, A. K., et al. (2020). Replication data for: arctic cold seeps alter dissolved organic matter composition at the svalbard continental margin and the barents Sea. doi:10.18710/JHB371
Silyakova, A., Jansson, P., Serov, P., Ferré, B., Pavlov, A. K., Hattermann, T., et al. (2020). Physical controls of dynamics of methane venting from a shallow seep area west of svalbard. Continent. Shelf Res. 194, 104030. doi:10.1016/j.csr.2019.104030
Skogseth, R., Haugan, P. M., and Jakobsson, M. (2005). Watermass transformations in storfjorden. Continent. Shelf Res. 25, 667–695. doi:10.1016/j.csr.2004.10.005
Skogseth, R., Sandvik, A. D., and Asplin, L. (2007). Wind and tidal forcing on the meso-scale circulation in Storfjorden, Svalbard. Continent. Shelf Res. 27, 208–227. doi:10.1016/j.csr.2006.10.001
Sleighter, R. L.,, and Hatcher, P. G. (2007). The application of electrospray ionization coupled to ultrahigh resolution mass spectrometry for the molecular characterization of natural organic matter. J. Mass Spectrom. 42, 559–574. doi:10.1002/jms.1221
Steinle, L., Graves, C. A., Treude, T., Ferré, B., Biastoch, A., Bussmann, I., et al. (2015). Water column methanotrophy controlled by a rapid oceanographic switch. Nat. Geosci. 8, 378–382. doi:10.1038/ngeo2420
Steinle, L., Maltby, J., Treude, T., Kock, A., Bange, H. W., Engbersen, N., et al. (2017). Effects of low oxygen concentrations on aerobic methane oxidation in seasonally hypoxic coastal waters. Biogeosciences 14, 1631–1645. doi:10.5194/bg-14-1631-2017
Steinle, L., Schmidt, M., Bryant, L., Haeckel, M., Linke, P., Sommer, S., et al. (2016). Linked sediment and water-column methanotrophy at a man-made gas blowout in the North Sea: implications for methane budgeting in seasonally stratified shallow seas: linked sediment and water methanotrophy. Limnol. Oceanogr. 61, S367–S386. doi:10.1002/lno.10388
Tremblay, J.-É., Anderson, L. G., Matrai, P., Coupel, P., Bélanger, S., Michel, C., et al. (2015). Global and regional drivers of nutrient supply, primary production and CO2 drawdown in the changing arctic ocean. Prog. Oceanogr. 139, 171–196. doi:10.1016/j.pocean.2015.08.009
Valentine, D. L., Blanton, D. C., Reeburgh, W. S., and Kastner, M. (2001). Water column methane oxidation adjacent to an area of active hydrate dissociation, Eel River Basin. Geochem. Cosmochim. Acta 65, 2633–2640. doi:10.1016/s0016-7037(01)00625-1
Vanreusel, A., Andersen, A., Boetius, A., Connelly, D., Cunha, M., Decker, C., et al. (2009). Biodiversity of cold seep ecosystems along the european margins. Oceanography 22, 110–127. doi:10.5670/oceanog.2009.12
Veloso-Alarcón, M. E., Jansson, P., Batist, M. D., Minshull, T. A., Westbrook, G. K., Pälike, H., et al. (2019). Variability of acoustically evidenced methane bubble emissions offshore western svalbard. Geophys. Res. Lett. 46, 9072–9081. doi:10.1029/2019GL082750
Venables, W. N.,, and Ripley, B. D. (2002). Modern applied statistics with S. Fourth. New York, NY: Springer.
von Appen, W.-J., Schauer, U., Hattermann, T., and Beszczynska-Möller, A. (2016). Seasonal cycle of mesoscale instability of the West spitsbergen current. J. Phys. Oceanogr. 46, 1231–1254. doi:10.1175/JPO-D-15-0184.1
Westbrook, G. K., Thatcher, K. E., Rohling, E. J., Piotrowski, A. M., Pälike, H., Osborne, A. H., et al. (2009). Escape of methane gas from the seabed along the West Spitsbergen continental margin. Geophys. Res. Lett. 36 L15608. doi:10.1029/2009gl039191
Wiesenburg, D. A.,, and Guinasso, N. L. (1979). Equilibrium solubilities of methane, carbon monoxide, and hydrogen in water and sea water. J. Chem. Eng. Data 24, 356–360. doi:10.1021/je60083a006
Williams, P. M.,, and Druffel, E. R. M. (1987). Radiocarbon in dissolved organic matter in the central north pacific ocean. Nature 330, 246–248. doi:10.1038/330246a0.
Keywords: methane hydrate, methane oxidation, methane oxidizing bacteria, arctic ocean, Fourier-transform ion cyclotron resonance mass spectrometry, nutrients
Citation: Sert MF, D’Andrilli J, Gründger F, Niemann H, Granskog MA, Pavlov AK, Ferré B and Silyakova A (2020) Compositional Differences in Dissolved Organic Matter Between Arctic Cold Seeps Versus Non-Seep Sites at the Svalbard Continental Margin and the Barents Sea. Front. Earth Sci. 8:552731. doi: 10.3389/feart.2020.552731
Received: 16 April 2020; Accepted: 09 November 2020;
Published: 07 December 2020.
Edited by:
Martin Scherwath, University of Victoria, CanadaReviewed by:
Kai Mangelsdorf, Helmholtz Centre Potsdam, GermanyDong Feng, Shanghai Ocean University, China
Copyright © 2020 Sert, D’Andrilli, Gründger, Niemann, Granskog, Pavlov, Ferre and Silyakova. This is an open-access article distributed under the terms of the Creative Commons Attribution License (CC BY). The use, distribution or reproduction in other forums is permitted, provided the original author(s) and the copyright owner(s) are credited and that the original publication in this journal is cited, in accordance with accepted academic practice. No use, distribution or reproduction is permitted which does not comply with these terms.
*Correspondence: Muhammed Fatih Sert, TXVoYW1tZWQuZi5zZXJ0QHVpdC5ubw==