 Sandra Fernández-Alberti
 Rodrigo Abarca-del-Río
 Cristian Bornhardt
 Andres Ávila
94% of researchers rate our articles as excellent or good
Learn more about the work of our research integrity team to safeguard the quality of each article we publish.
Find out more
ORIGINAL RESEARCH article
Front. Earth Sci., 19 January 2021
Sec. Hydrosphere
Volume 8 - 2020 | https://doi.org/10.3389/feart.2020.539905
This article is part of the Research TopicConnecting Mountain Hydroclimate Through the American CordillerasView all 19 articles
The objective of this work is to validate a model to characterize and evaluate the water resources (supply and downstream demands) of the hydrological basins associated with the Conguillío National Park, located in the Andes Mountains in central-southern Chile (38°14'–38°54'S). This area is part of the Chilean biodiversity hotspot, of the first geopark in Chile, and constitutes the core of the Araucaria biosphere reserve, which provides multiple ecosystem services. To describe the behavior of the water resources in the four main river sub-basins originating in the park, the Water Evaluation and Planning System (WEAP) software was used, which was calibrated and validated with local hydrological data from 2000 to 2015. The WEAP System allows to quantify parameters involved in the hydrological cycle and water consumption of the different user sectors, and their interrelationships, to establish the water balance of the basins. Water is supplied by rain and snow, which occurs from June to December upstream in the Andes, and feeds the rivers Cautín, Allipén, Quepe and Lonquimay, which maximum flows occur between June and September, and minimum flows between January and April. The evolution of the water demand during the year was determined for each sub-basin for the following user sectors: human consumption, agriculture, livestock, industry, electricity production, aquaculture and other uses. As expected, the main water consuming sector is agriculture, with an average of 79.4 Mm3/yr. Considering that mountain ecosystems are areas of high productivity value, but are very fragile and vulnerable to anthropic and climatic effects, the use of the obtained data and the calibrated/validated model describing and characterizing these resources, will allow future studies under different socio-economic and climate change scenarios, to assess the importance of mountain basin ecosystem services, providing an example for equivalent studies throughout South America.
Freshwater resources are essential both for society (human consumption, agriculture, and other uses) and for ecosystems. Sustainable water management promotes their development and protection, as socio-economic benefits are provided in a fair balance with environmental sustainability (Clark et al., 2004; Liu et al., 2008; Maliehe and Mulungu, 2017). Water provides various Ecosystem Services (from now on ES), like drinking water supply, recreation, and dilution of pollution discharges (Brauman et al., 2007). The future capacity of natural systems to provide these services will depend on water availability and quality (Sample et al., 2016). “Ecosystem services” are defined as the benefits that people obtain from ecosystems (MEA, 2005), and the direct and indirect contributions that ecosystems make to human well-being. Several studies (Yang et al., 2015; Fan et al., 2016; Liu et al., 2017; Momblanch et al., 2017) indicate that mainly human activity is responsible for the decline in ES. Changes in land use/land cover affect the hydrological cycle, e.g., infiltration (Nelson et al., 2009), evapotranspiration, and groundwater recharge (Fan et al., 2016). There exist few watershed studies in protected areas that analyze the effects of land-use change and climate change (Fan et al., 2016).
Given its biogeographical condition, Chile is endowed with a great and unique diversity (Valdés-Pineda et al., 2014) of terrestrial, marine, coastal, glacial, river, lake, wetland and island ecosystems, hosting nearly 30 thousand endemic species which transform large areas of the territory in dedicated natural laboratories (Rubilar 1994; MMA 2014; MMA, 2015). The natural protected areas have been very significant and effective for ecosystems conservation, such as the different species present (Jorquera-Jaramillo et al., 2012). Each ecosystem, based on its functioning and interactions, provides a series of ecosystem services, ranging from the regulation of the hydrological cycle to the provision of direct goods and services for society (MMA, 2015). A study (Figueroa, 2009; Figueroa, 2010) estimated a value of US$ 1,368 million per year of the ecosystem services provided by the natural protected areas in Chile, and noted that these areas contribute to the country with 0.5% of its GDP.
Different studies point out the importance of mountains as providers of a large number of ES of fundamental importance for life (Bauhus et al., 2010; Decocq et al., 2016; Mori et al., 2017). Studies by Gao et al. (2020) indicate that mountains contribute greatly to the planet's terrestrial biodiversity, hosting 85% of the world's wildlife within 25% of the earth's surface (Rahbek et al., 2019a; Rahbek et al., 2019b). The rich biodiversity of mountains is due to the complex topography, which creates acute vertical heterogeneity in climate, soil and vegetation (Chaplin, 2005). Canedoli et al. (2020) point out that mountain ecosystems are fragile and vulnerable and face serious threats due to climate change, changes in land use or unsustainable exploitation of resources, as well as political decisions and socio-economic pressures (see also Kurz et al., 2008; Huber et al., 2013).
In this context, Protected Areas are very important for Chile, which protect the existing natural heritage, representing a unique biodiversity in the world CONAF, Corporación Nacional Forestal (2012). The distribution from north to south, the altitudinal gradient and the extension of the coast provide the country with a great variety of habitats, being one of the most threatened, according to the global index 200 of WWF and the (World Bank 2011, WWAP, 2014). It should be noted that Chile's economy is heavily dependent on the exploitation and export of natural resources, including resources from sectors that affect or are affected by the condition of biodiversity and the provision of ecosystem services, such as the mining, agricultural, fisheries and forestry sectors (MMA, 2016). In this sense, Chile has the challenge of being able to develop these industries without undermining the biodiversity that sustains them, both because of the wealth of biological diversity that it possesses, and because of its relevance to the economy itself.
Biodiversity, water resources, built infrastructure and economic sectors may be adversely affected by the global climate change within this century (Santibañez et al., 2013). Chile, including its mountain ecosystems, is highly vulnerable to climate change, fulfilling seven of the nine characteristics defined by the UNFCCC (Universidad de Chile, 2007; Universidad de Chile, 2012; CEPAL, 2012). For example, in the central-south zone of the country, in the last 10 years a statistically significant decrease in rainfall has been observed (Schulz et al., 2011; Quintana and Aceituno, 2012; Boisier et al., 2016).
On the other hand, in Chile there is an evident lack of water resources management and there exist only few planning skills to face climate variability and uncertainty. It is urgent to implement strategies for its use in many regions, considering also the country's most important watersheds, which are located within protected areas and at high altitudes. Besides, the allocation of water resources is limited for agricultural and industrial use, and human consumption.
Chile's 1981 Water Code defines water as a “national good of public use,” but at the same time as an “economic good.” It authorizes the privatization of water through the concession of free use rights in perpetuity (it does not set limits to the concession of use rights). It establishes a system of water redistribution through transactions between private parties, thus creating a Water Market, and favors the concentration of ownership of this resource. In this context, several investigations have reported that in Chile there is no adequate water management, and the water use rights are granted more or less in an arbitrary manner, generating that there is no equity in its distribution (Larraín et al., 2010; Larraín, 2012).
Historically, water management has been the responsibility of the Ministry of Public Works (MOP, 2016), with its ministerial departments (General Direction), the Direction of Hydraulic Works, the Direction of Irrigation, the Direction of Planning, and the Department of River Defense, among others. The Ministry of Economy, Development and Reconstruction, through the National Irrigation Commission (CNR), also has a relationship with water. Thus, water resources involve a set of institutions and government agencies that are responsible for water or regulate the actions of users within a basin, making this finally such an intricate and complicated subject, that at the end it is ineffective. As an example we cite the conservation of river flows: the only existing measure is the ecological flow, established with the reform of the Water Code in 2005; but this is very limited and insufficient to preserve the diversity and integrity of the watersheds.
One of the major challenges at national level is the systematization of data and monitoring of water quality and biodiversity in these ecosystems, where the main threats are pressure on water resources. At the global level, this pressure is also present and is occurring in the water-energy-food relationship. In this context, several studies (Biggs et al., 2015; Zhang et al., 2016; Tidwell and Moreland, 2016) pointed out the need to establish a balance between the supply of natural resources and human demand on the environment to promote sustainability.
Insufficient knowledge of the hydrology of a basin can lead to deficiencies in water supply and a failure to meet the water demands of users. It is necessary to know the evolution of the water balance, especially during dry seasons, and to develop allocation and management strategies. Maliehe and Mulungu (2017) reported that basin-scale assessments provide essential information for water resources management, in particular predictions of water supply and demand. There exists high uncertainty in water resource management when it comes to describing future conditions (Forni et al., 2016a; Medellín-Azuara et al., 2016). For these purposes, simulation models are indispensable, which can consider the interaction of different variables in a basin, representing their spatio-temporal dependencies and the effects of climate change and human activities on environmental systems (Bhave et al., 2014). Several studies have been performed to capture various aspects of water resources planning in several parts of the world, using hydrological models (Condom et al., 2011; Bhave et al., 2014; Forni et al., 2016a; Medellín-Azuara et al., 2016).
The Water Evaluation and Planning (WEAP) tool is an integrated model for water resource planning (Yates et al., 2005a; Purkey et al., 2008). Several articles (Yates et al., 2005, Yates et al., 2009) describe how watersheds are integrated into WEAP. A set of climate forcing data (precipitation, temperature, relative humidity, and wind speed) is uniformly applied across each catchment, which is fractionally divided into land use/land cover classes (Yates et al., 2005b). Thus, the WEAP model is a useful tool for advising on water resources development and management alternatives (Forni et al., 2016a; Medellín-Azuara et al., 2016; Maliehe and Mulungu, 2017). It is widely used to support water resources planning, providing an analytical and management framework for decision-makers in an open planning process (Yates et al., 2005a; Forni et al., 2016b; Galaitsi et al., 2016), particularly in Africa (e.g., Mulungu and Taipe, 2012; Droogers et al., 2014), because it can be applied at the basin and sub-basin levels (Bhave et al., 2014; Maliehe and Mulungu, 2017). Also, it has been used at the basin level in Chile (Vicuña et al., 2011) and in California (Yates et al., 2007; Young et al., 2009; Forni et al., 2016a; Medellín-Azuara et al., 2016).
This work focuses on the water network of a natural protected area located in the pre-Andean mountain range of the Araucanía Region. Here is located the Conguillío National Park, formed by the mountain range at a variable height between 750 and 3,125 masl, where the Sierra Nevada and the Llaima Volcano stand out, being one of the most active and voluminous volcanoes of the Southern Andes, with 29 km2 of glaciers (Naranjo and Moreno, 2005). This park has two UNESCO nominations, is the core zone of the Araucaria Biosphere Reserve, and is the first Geopark in the country. It is considered to be of great ecosystemic importance, given the diverse environments typical of this mountain zone, where forests, wetlands, slag heaps, and high peaks are found. Besides, this park is one of the most visited in the country, due to its excellent landscape value. In this context, the magazine National Geographic (2018) chose this park in the fourth place among the ten most beautiful forests on the planet.
The administration and management of Chile's Natural Protected Areas is responsibility of the National Forestry Corporation (CONAF), which is an entity belonging to the Ministry of Agriculture. Its main objective is to protect the preservation of nature and environmental heritage. In this sense, CONAF, Corporación Nacional Forestal (2009) carried out a study to evaluate a management plan for this natural protected area and raised a baseline, which states that within all studies to be conducted (for example studies of flora and fauna, geomorphology, landscape, tourism, archaeological sites, and others), it is necessary to conduct a hydrological study to determine the productive capacity of this area, and the supply and demand of water for the population benefiting from the resource in the sub-basins of the Allipén, Lonquimay, Quepe and Cautín rivers, respectively. It is worth mentioning the importance of this park as a source of water production, since it feeds several communes, providing at the same time countless opportunities for product development. However, they point out the importance of complementing the study with climatological and water quality information that best approximates the reality of the sub-basins. Until now, this study had not been carried out, and this is one of the reasons for our work.
Furthermore, this study is part of a work that includes having a validated model to support the sustainable management of wild protected areas. It will allow for the implementation of proper decision-making strategies in different scenarios, with a focus on sustainable development. Noteworthy, it may allow us to propose and evaluate measures to ensure the ecosystem services sustainability provided by the Conguillío National Park, such as water and landscape resources. In this context, with this study we want to provide a tool that integrates hydrology with the administration and operation of water resource systems, which can be used in micro-basins as well as in big basins.
Thus, the objective of this study is to stablish the actual water balance of the water requirements within the sub-basins fed by the Conguillío National Park.
(1) Characterization of the basins, considering the meteorological data required by the model (rainfall, temperature, wind speed, relative humidity, river flows and land cover of the study area) (see Study Area and Local Data).
(2) Calibration and validation of the WEAP model for the period 2000 to 2015 (see Water Evaluation and Planning Calibration and Validation).
(3) Determination of water requirements at different demand sites and catchment descriptions (see Demand sites and Catchment Description).
(4) Estimation of the water balance of the study area (see Water Balance Estimation Methodology).
The study area (Conguillío National Park) is located in the Araucanía Region of south-central Chile (38°14’-38°49’S) (Figure 1A) (BCN, 2019). It is characterized by its mountainous landscapes, with the presence of active volcanoes in the pre-Andean mountain range, which extends from low valleys to highlands with steep slopes, across an elevation range from 450 to > 3,000 masl (BCN, 2019), with a variety of climatic conditions. The natural forests are composed of Nothofagus sp. (CONAF, 2011), as well as Araucaria araucana, a vulnerable endemic species recognized as a natural monument in Chile, recognized by UNESCO with the nomination of Araucaria Biosphere Reserve (Moreira-Muñoz and Troncoso, 2014). It also plays an essential role for Mapuche indigenous people (Miranda et al., 2015).
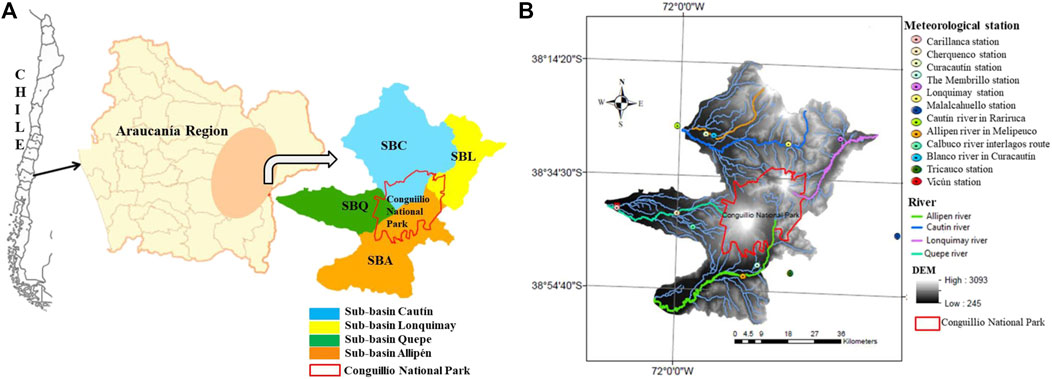
FIGURE 1. (A) Map of Chile, Araucanía Region, sub-basins of the study area, and Conguillío National Park. (B) Geographical data of the study area, including location of meteorological stations and the rivers Cautín, Quepe, Lonquimay and Allipén.
Rainfall in Chile tends to increase with latitude and altitude. Thus, in south central Chile, annual rainfall increases southward from around 100 mm at 30°S to nearly 2000 mm at 40°S. The annual precipitation increases with elevation, up to a maximum of 3,000 mm annually above 1,200 masl in the Andes (Luebert and Pliscoff, 2006). The Andes range isolates this region from the influence of continental air masses (Valdés-Pineda et al., 2014). Thus, south-central Chile has an annual rainfall cycle with a peak in the winter season and lower values in summer, gradually increasing towards the south. In the region under study, climate is characterized by moderate, cold rain with Mediterranean influence under a prominent role by the Pacific Anticyclone, which is the main protection against torrential rainfall in Chile (Garreaud et al., 2009; Orrego et al., 2016), characterized by a significant decrease in rainfall during the summer months, when the highest temperatures are present (Armesto et al., 2008). Rainfall is mainly concentrated in the month's May to September, and climate variability is influenced by the El Niño Southern Oscillation (ENSO) phenomenon (Falvey and Garreaud, 2009; Demaria et al., 2013; Valdés-Pineda et al., 2014; Orrego et al., 2016). ENSO events in central-southern Chile (38°–41°S) are associated with higher than average spring rainfall (35°–38°S) and lower than average summer rainfall (Garreaud et al., 2009; Valdés-Pineda et al., 2014; Orrego et al., 2016). The average annual temperature in the study area is 10.2°C, with a mean maximum of 15.8°C in January and February, and a mean minimum of 4.7°C in June and July (DGA, 2016). An example of this climate is that recorded by the Lonquimay meteorological station (38°45’50’’S - 71°36’19’’W) located at 900 masl in the Andean range, with a mean annual temperature of 8.4°C and annual precipitation of 1,850 mm.
On the other hand, studies by Rubio-Alvarez and McPhee (2010) on the patterns of spatial and temporal variability of river flows in south-central Chile for the period 1952–2003 reported the time series of annual and seasonal flows of 44 rivers in southern Chile, covering the ecoregion between 34°S and 45°S. They found a significant correlation with climatic indexes at different spatial and temporal scales, with El Niño–Southern Oscillation (ENSO) influence being stronger at the northern subregion, and notably, the Antarctic Oscillation (AAO) and the Pacific Decadal Oscillation (PDO), showing strong correlation with summer flows in the southern subregion. Also, they found significant decreasing trends affecting a region between 37.5°S and 40°S. These were consistent with decreasing trends observed in precipitation in the area, and also with a decreasing trend observed in the Southern Oscillation Index (SOI). Also, the drought affecting central Chile is evident, as indicated by studies conducted by Boisier et al. (2016) on the anthropogenic and natural contributions to the decrease in rainfall in the Southeast Pacific and the mega-drought affecting Central Chile.
Chile's natural heritage is protected by the National System of State Natural Protected Areas (SNASPE). It currently includes 105 units, with 41 national parks, covering an area of approximately 18.6 million hectares (21.3% of Chile's continental territory). It should be noted that the study area (Parque Nacional Conguillio) has two UNESCO designations, is part of the Araucaria Biosphere Reserve, and also is part of the first Geopark in Chile around the Llaima volcano. It is worth mentioning that Chile possesses ten (10) Biosphere Reserves (UNESCO, 1995). Three of them are located in the pre-mountain range of the Andes Mountains, as is our study zone, with heights above 3,000 m above sea level and the presence of permanent snow in winter above 1,100 masl. It is also part of a world biodiversity hotspot, defined as regions where a large amount of species biodiversity is concentrated, and where the original habitat has been strongly impacted and threatened by human actions. Only thirty-five hotspots that meet these characteristics have been defined worldwide (Mittermeier et al., 2004). The “Chilean winter rainfall-Valdivian forests” hotspot is located mainly in Chile. It extends from the Pacific coast to the Andean peaks between 25°S and 47°S (Arroyo et al., 2004).
There are several State-Protected Natural Areas (SPA) in the region; one of these is the Conguillío National Park (CNP) (38°30'S; 71°30'W), with an area of 60,833 ha, where we started our study (Figure 1A). The CNP has four defined natural environments: mountain, volcanic slag, forests, and water bodies (rivers, streams, lagoons, lakes, and wetlands). It is characterized by its water network composed of streams, rivers, lagoons, and large lakes, fed by snow-melt, rain, and groundwater. It has two UNESCO distinctions: the Araucaria Biosphere Reserve, and the Kutralkura Geopark, which presents interesting geological characteristics. The landscape and ecological value of the park is dominated by Sierra Nevada and Llaima volcano CONAF, Corporación Nacional Forestal (2012). The presence of the active Llaima volcano, which occupies a large part of the park, has formed the geomorphological characteristics of the park, rising from 700 masl at its base to the crater rim at 3,125 masl. Historically, it is one of the most active volcanoes in South America, with its last recorded eruption in 2008–2009 (Bathke et al., 2011) and one of the largest in the Southern Andes, with more than 29 km2 of glaciers (Naranjo and Moreno, 2005).
The Araucanía Region contains two large basins: the Imperial River Basin and the Toltén River Basin. Additionally, it includes a small part of the Bío-Bío River Basin. The main tributaries are the following: of the Imperial river: Cautín, Blanco, Quepe, Calbuco and Vilcún; of the Toltén river: Truful-Truful and Allipén; and of the Bío Bío river: Lonquimay. The study zone covers an area of 3,365 km2 (IDE, 2017; Universidad de Chile, 2017).
For this study, the basins system was grouped in four sub-basins, with the following notation (associated to the main river of each of them) (see Figure 1A):
• SBA: Sub-basin of the Allipén river
• SBQ: Sub-basin of the Quepe river
• SBC: Sub-basin of the Cautín river
• SBL: Sub-basin of the Lonquimay river
These rivers were selected despite the limitations of data availability in each case. Figure 1B shows the Digital Elevation Model (DEM) of the study area and the meteorological stations of the four sub-basins selected for this study.
Table 1 shows the distribution of land uses, representing the dominant land cover categories present in each sub-basin, each component in km2, which were geo-referenced from the National Native Forests Inventory CONAF, Corporación Nacional Forestal (2012). Bare lands include rocky areas and dunes. Forest plantations are exotic species for timber and paper production, such as Pinus radiata and Eucalyptus spp. The native forest is represented mainly by the genus Nothofagus, mixed with Araucaria araucana, and old-growth native forest (Miranda et al., 2015). Water bodies include rivers, lakes, and estuaries identifiable to the resolution of the images. Farmland and forests have dominated the composition of the landscape in the study area. Currently, pine and eucalyptus plantations have overtaken the area covered by native forests (Miranda et al., 2015). Cover change is spatiotemporally heterogeneous, as significant relationships are found between the spatial distribution of land cover types and different biophysical variables (Schulz et al., 2011; Nahuelhual et al., 2012). These changes in the landscape of south-central Chile are related to the expansion of agriculture and the introduction of exotic tree plantations (Aguayo et al., 2009; Little et al., 2009; Echeverría et al., 2012). The most abundant land cover is the native forest, which predominates in all the catchments of the study area, and crops in SBQ, SBC, and SBA. Next, shrublands are important for SBL and SBC; this class includes both arborescent shrublands of Nothofagus species or other native woody species, as well as shrublands formed by exotic species. Forest plantations are also important in SBA, SBC, and SBQ. Finally, SBA has the most extensive grassland coverage. SBA and SBC are located at higher altitudes. They include large areas of volcanic slag from Llaima Volcano, covered with snow during the year. Table 1 shows that the SBC and SBA sub-basins have the most significant cover by native forest, scrublands, snow, and water bodies, suggesting that they also have a greater volume of water resources.
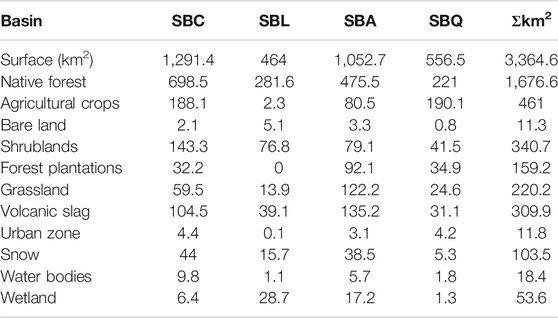
TABLE 1. Land uses in the sub-basins Cautín river (SBC), Lonquimay river (SBL), Allipén river (SBA) and Quepe river (SBQ).
Some of the meteorological stations run by DGA (General Directorate of Waters) and AGROMET (National Agroclimatic Network of Chile) have only operated for a few years, while other records cover different periods. There are significant gaps, extending from a few days to several years. After a preliminary review of these data, a small number were evaluated for data quality, consistency, and extension (Iroumé and Palacios, 2013). Nine precipitation stations were finally selected (see Table 2), covering the four basins (DGA, 2016; Orrego et al., 2016). There are few stations with temperature records (Table 2). We included other AGROMET stations close to the study zone.
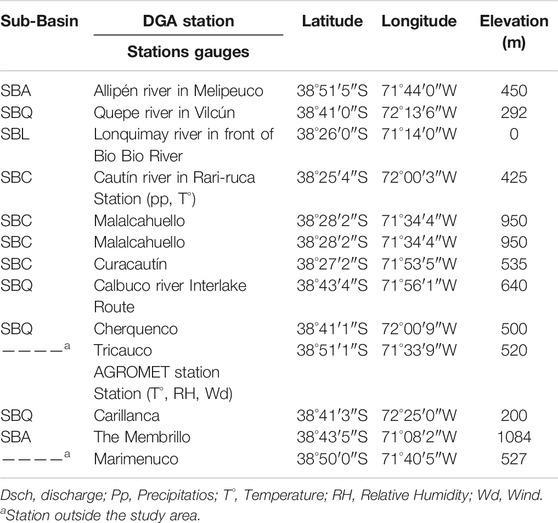
TABLE 2. Meteorological Stations and Streamflow gauging stations (DGA Station) and meteorological stations (AGROMET Station).
The temperature-elevation gradient was estimated considering the average temperature values for stations located at different elevations, based on two index stations for the basin, as suggested by Vicuña et al. (2011). Where there are no station data to estimate the temperature gradient, we used the values generally used in Chile: −0.5°C/m when there is precipitation, and −0.65°C/m when there is no precipitation (Cortes, 2010; DGA, 2017).
The entire watershed contains four (4) stream gauges with records from at least 2000 to 2015. Table 2 shows the location of these gauges (see also Figure 1B). These are the Rari-Ruca gauging station for Cautín river, the Melipeuco gauging station for Allipén river, the Vilcún gauging station for Quepe river, and the Lonquimay river gauging station just arriving the Bío-Bío river.
Wind speed and relative humidity (RH) data were obtained from two AGROMET stations. The average monthly wind speed at that location was 5.1 m/s, and the relative humidity (RH) 81%. WEAP requires this information in each hydrological unit or sub-basin (catchment).
The Water Evaluation and Planning (WEAP) model was developed initially by The Stockholm Environment Institute at Boston, United States (Van Loon and Droogers, 2006). It presents an integrated system of water resources planning by connecting hydrological processes and their operations in a single analytical platform (Forni et al., 2016a; Medellín-Azuara et al., 2016). It also uses a scenario-based method to determine water supply and demand and their priorities for current and future periods. Within these features, WEAP software can simulate catchment hydrology as surface runoff, evaporation and infiltration, and evaluate water availability (Sieber et al., 2005).
The model is based on a one-dimensional soil water accounting scheme with two storage tanks, which uses empirical quasi-physical functions (Yates et al., 2005) that describe evapotranspiration (potential evapotranspiration is derived using a Penman-Monteith formulation (Maliehe and Mulungu, 2017), surface runoff or interflow, and deep percolation (Vicuña et al., 2011).
The model input information includes the following parameters: precipitation, temperature, relative humidity, wind speed, melting point, freezing point, and land cover. These are required to estimate the water balance components of evapotranspiration, infiltration, surface runoff, and baseflow, providing the framework for the water models system operations (Forni et al., 2016a; Medellín-Azuara et al., 2016).
WEAP can integrate the water supplies generated through hydrological processes from a water management model (Yates et al., 2005; Yates et al., 2007; CCG, 2009). Mass balance equations are the basis of WEAP's monthly water accounting, considering total inflows, total outflows, and storage in reservoirs and aquifers (see Eq. 1 and Figure 2).
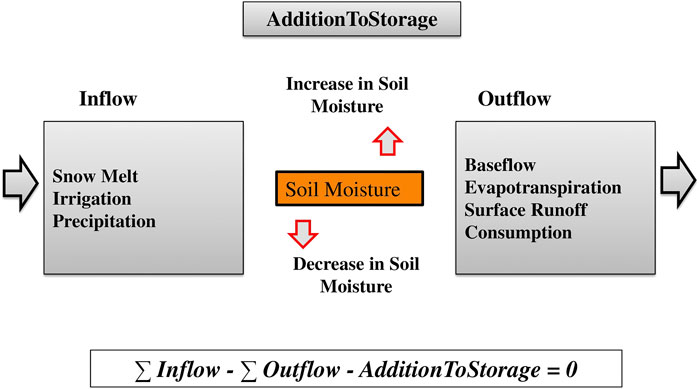
FIGURE 2. Water balance diagram of the WEAP model.
The term AdditionToStorage only applies to reservoirs and aquifers. AdditionToStorage is positive for an increase in storage and negative for a decrease in storage. Outflow includes consumption and losses (http://www.weap21.org/). Every node and link in WEAP has a mass balance equation, and some have additional equations that constrain their flows. Each mass balance equation becomes a constraint in the linear program (LP). Every flow from one point to another is represented by a variable in the LP (http://www.weap21.org/). For example, assume Demand Site A draws from Supplies B and C and returns water to those same supplies, as well as consumes some of the water (http://www.weap21.org/), as described in Eq. 2.
InflowB,A is the inflow from supply B to demand site A.
The current accounts, key assumptions, and scenarios were defined during the model set up. Key assumptions can be built into current accounts (Maliehe and Mulungu, 2017), to represent policy, supply, and hydrology. For our study, irrigation needs for agriculture and water demands for human consumption were included in the characterization of the basins. The definition of the study with the WEAP model includes several steps, such as the spatial-temporal boundaries, all system components, the establishment of the water supply and demand, and the problem configuration. Thus, scenarios based on current accounts allow exploring the impacts of alternative assumptions (Maliehe and Mulungu, 2017). For example, for instance modifying the “key Units Domestic”, “water use”, “irrigation water needs” and “population growth rate” (Van Loon and Droogers, 2006).
The Soil Moisture Method is used for each study basin (http://www.weap21.org/). It represents the basin with two soil layers (Yates et al., 2005) and the potential accumulation of snow (Vicuña et al., 2011). For each catchment, rainfall-runoff processes (Yates et al., 2005) are simulated using a 2-bucket representation of a root zone layer and a deep layer formulation of rainfall-runoff hydrology (Yates et al., 2005; http://www.weap21.org/). The variability of land covers in each catchment is represented by subdividing the area into representative land cover types that are parameterized individually. Finally, demand priorities and supply preferences are established using linear programming to increase water demand satisfaction as an alternative to the multi-criteria weighting or logical approaches based on rules and scenarios (Yates et al., 2005). The model gives an overall water balance for the entire study area.
For the construction of the WEAP model in the study basin, the water system was characterized by water demand sites and flow-gauge stations. The demand sites are represented by nodes and connected to the rivers through transmission and return links. These nodes were created in the diagrammatic view of the WEAP model (Maliehe and Mulungu, 2017), and the demand priority set and supply preferences were established. WEAP computes a mass balance of all water entering and leaving one or more demand sites for every node, linking the system in monthly steps (Purkey et al., 2008; Condom et al., 2011; Harma et al., 2012). Figure 1B shows each of the basins Digital Elevation Model (DEM). Geographic Information System (GIS) data on elevations, catchment, and land cover were obtained and used to define and characterize each basin (Mehta et al., 2013). Elevation data were extracted from the DEM provided by the U.S. Geological Survey (USGS, 2016). To compute water resource systems, the analysis included monthly rainfall, temperature, wind speed, and relative humidity information, where month-to-month variations produce interannual variations in flow rates. In this context, modelling can incorporate climatic factors such as wind, humidity and temperature, and variations in evapotranspiration (Bhave et al., 2014). Thus, this model supports the analysis of the hydrological characteristics of a basin for future scenarios of climate change, land use (Mehta et al., 2013), and water demand (Bhave et al., 2014).
The WEAP model was calibrated and validated using data of the four streamflow gauging stations located in the study area (see Table 2), which represent the natural streamflow of the region. A monthly time step was used for calibration and validation analyses to cover the residence time of the survey area, during which all flows are assumed to occur (Purkey et al., 2008; Bhave et al., 2014). The calibration period extended from January 2000 to December 2007, while the validation period considers from January 2008 to December 2015. The period is the same for all four catchments based on data availability.
The model was manually calibrated to maximize the fit between the observed and simulated flow (Vicuña et al., 2011; Bhave et al., 2014). As shown in Table 3A, four well known statistical criteria were used to evaluate the ability of the model to simulate the measured streamflows. For the Root Mean Squared Error (RMSE), the lower the number, the better the model performance, with a zero RMSE indicating a perfect fit between the model and the observed data. The Nash-Sutcliffe Efficiency (NSE) can vary from minus infinity to 1 (Mehta et al., 2013; Bhave et al., 2014). When it is lower than 0, the mean predicts the variable better than the model; when it is between 0 and 1, the model works with standard cases, and the closer to 1, the better the correspondence between observed and modelled data. Also, lower values of Bias represent better correspondence between observed and modelled data. A positive Bias indicates overestimation and a negative Bias indicates an underestimation of flows (Condom et al., 2011). The coefficient of determination R2 represents how well a linear model fits the data. It varies in the range 0≤R2≤1; a value of 1 means a perfect linear fit, and a value of 0 indicates that the linear model is not representative (Bhave et al., 2014; Maliehe and Mulungu, 2017).
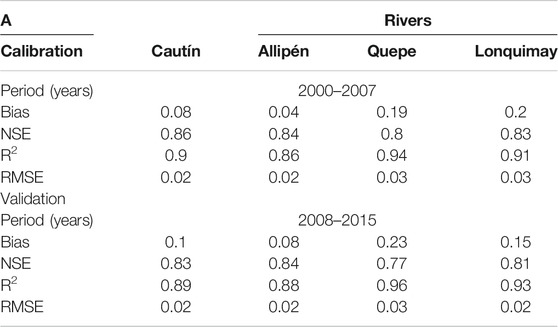
TABLE 3A. (A) Goodness-of-fit statistical criteria for the calibration and validation of the WEAP model to simulate the streamflow of each river. (B)
Calibration was performed by comparing the observed and modelled monthly streamflows at the outlets of the four sub-basins or study catchments (Figures 1A,B and Table 2).
As explained in Basin Characterization, four hydrological units were defined as catchments (sub-basins).
Urban demand was characterized according to the number of inhabitants, population growth rate, and per capita consumption. To estimate the water requirements of the demand sites for human use, eight urban domestic demand sites were identified, composed of small towns with populations of approximately 1,000 to 16,000 people: Vilcún, San Patricio, Cherquenco, Melipeuco, Conguillío National Park, Lonquimay, Malalcahuello, and Curacautín (see Table 4A). According to data from the Chilean General Water Agency (DGA, 2007; DGA, 2016) and the National Institute of Statistics (INE, 2014), the average annual water consumption in Chile is 54.8 m3/person/year. However, in the study area, the average consumption is slightly lower (47 m3/person/year). It is important to note that the estimate of human water consumption is obtained from official sources and companies that provide this service, supported by the last census conducted on the number of population (INE, 2007).
The irrigation needs of the considered sub-basins were determined by selecting the land cover and the annual irrigation requirements. The covers (crops, meadows, and forest plantations) were calculated in ArcGIS 10 (Table 1), as described in Land Uses. The irrigation water demands, together with crop area records and information on their requirements, were obtained from AGRIMED (Universidad de Chile, 2015) and the National Irrigation Commission (CNR, 2011). Agricultural demand sites were created in WEAP to assess irrigation demands. Basins with significant percentages of crop cover, forest plantations, and grassland were considered. The main crops in the study area are cereals, mainly oat and wheat. The forest plantations are Pinus radiata and Eucalyptus globulus (INE, 2014), and the forage grasslands mainly consist of grasses, fescue, and clover. The irrigated area (ha) also was defined.
We can point out that in Chile there are more than 140 hydroelectric plants operating, considering reservoirs, run-of-river and mini run-of-river hydraulics. In total, they exceed 6,600 MW of installed power. The participation of hydroelectricity (reservoir and run-of-river) in the electrical matrix by December 2016 covers 28.8% of the energy generation at the national level (www.cne.cl). Thus, through the use of the WEAP model, we estimate the water demand for hydroelectric use of the four sub-basins under study (SBA, SBC, SBQ and SBL). This information was obtained mainly by reviewing reports from the Environmental Assessment Service (SEIA) of the Ministry of the Environment.
In addition, the water demand for livestock production was calculated, which represents 10.4% of the country's production (ODEPA, 2018). To make this estimation, our calculation base was obtained from the Agricultural Census (INE, 2007), where it is estimated that a cattle consumes 45.4 L per day, a cow that produces milk 132 L per day and poultry between 0.2 and 0.4 L per day.
With respect to water demand for aquaculture, information was obtained from official reports of DGA (2007) and permits granted by this state institution, as well as for industrial and other uses (e.g., manufacturing, agro-industry, tourism, etc.).
Finally, there is no public information available for all the economic activities classified as manufacturing industry, which allows to determine or estimate their use and consumption of water. Therefore, an estimate of the water demand for these uses is constructed by integrating information of the sub-sectors from different public and private entities.
As the basins investigated are mountain basins, the climate forcing gradient was studied with extrapolation at higher elevations (see Processing of Climatic Data). Where a fluviometric record exists, these gradients were adjusted to obtain an acceptable discrepancy term. The estimation of the water balance is based on the mass conservation equation (DGA, 2017), where the main hydrological processes of the system inputs and outputs are precipitation (P), runoff (Q), and evapotranspiration (ET). A discrepancy term is also considered (η). In simplified form, this Eq. (3) can be expressed as follows:
The above equation is applied to a given area and period.
As noted above, the WEAP hydrological model was calibrated for the period 2000–2007, and validated for the period 2008–2015 for the four basins under study, using the Soil Moisture Method, which was developed to model the hydrological processes with a quasi-physical representation, but in a robust method (see Figure 2).
After calibrating (2000–2007) and validating (2008–2015) the WEAP model, we computed the efficiency criteria (Water Evaluation and Planning Modelling Results and Analysis of Efficiency Criteria). We calculated the water resources supply and demand for human consumption (Demand for Human Use), irrigation for agriculture (Irrigation Demand), livestock production, industry, aquaculture and other uses (Livestock Production Demand), and electricity production (Demand for Hydropower). Finally, the whole water resources and demand balance and its components (precipitation, evapotranspiration and runoff) were established for each month in the four basins (Water Balance) throughout the study period.
To calibrate and validate the model and test the validity of the different simulation scenarios, the four efficiency criteria presented in Water Evaluation and Planning Calibration and Validation were used to assess the model accuracy to simulate the observed streamflow at each of the four stations (Bhave et al., 2014). The obtained values are summarized in Table 3. According to all the goodness-of-fit statistical criteria, the model shows an outstanding representation of all rivers, with the best fit to the Quepe river. The best results in the efficiency criterion NSE was obtained for the Cautín river. The Allipén river presents a poorer fit for the R2 adjustment criteria. However, the R2 was higher than 0.86 in both the calibration and validation, which is considered quite significant (Condom et al., 2011; Yan et al., 2015). Thus, these results indicate a more than reasonable ability of the WEAP hydrological model to simulate the flows.
Considering the sensibility of the WEAP model, the factors that most affected the calibration of the streamflows were the Land Use module factors (deep-water capacity, runoff resistance factor, deep conductivity, and preference flow direction) and the Climate module factors (freezing point, melting point, and albedo).
Figure 3(A, B, C and D) shows the average monthly river flow time series for the calibration (2000–2007) and validation (2008–2015) periods. It compares the measured (in blue) and simulated (in red) values for the four rivers (Cautín, Allipén, Quepe and Lonquimay) with the respective values of the efficiency criteria, corroborating the good performance of the WEAP model. Table 3B summarizes the river’s average annual flow and the monthly historical maximum and minimum flows. The Cautín river (SBC) is the most important water body in the study area, followed by the Allipén river (SBA).
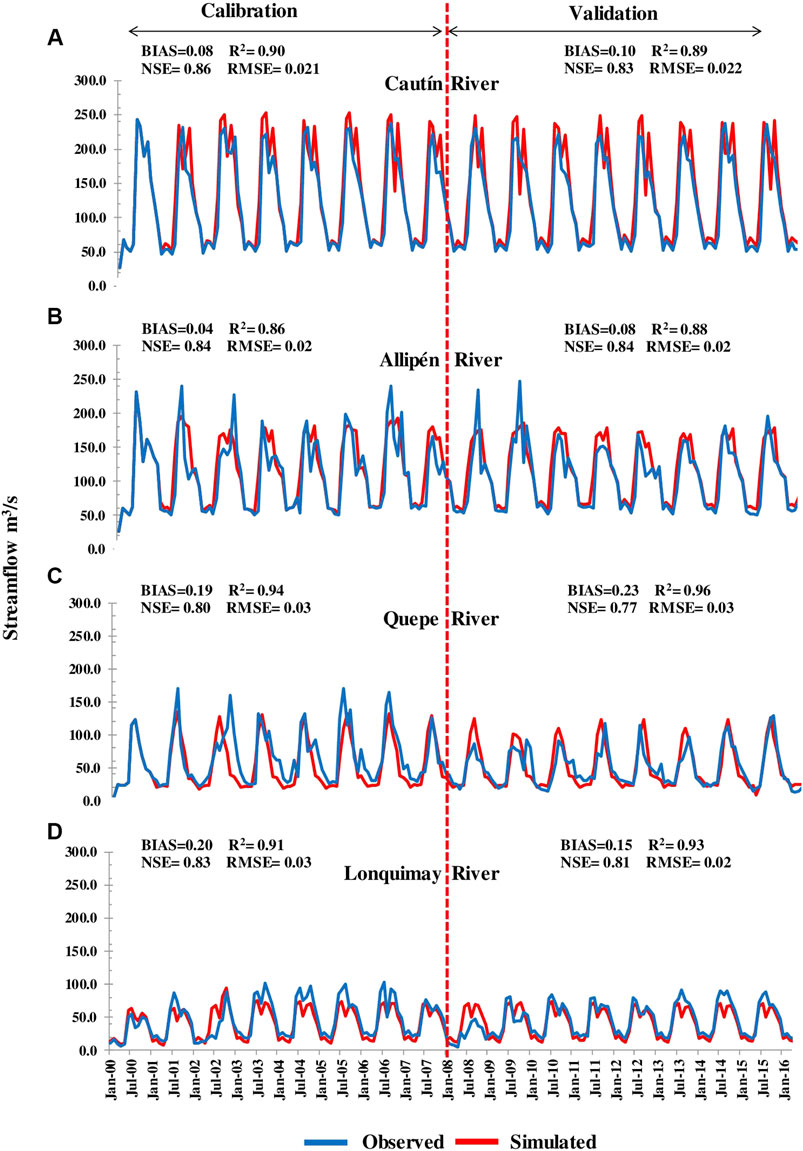
FIGURE 3. Average monthly streamflow time series (m3/s) for the calibration and validation period, comparing observed (blue) and WEAP-simulated (red) data. (A) SBC basin: Cautín river at the Rari-Ruca station. (B) SBA basin: Allipén river at the Melipeuco station. (C) SBQ basin: Quepe river at the Vilcún station. (D) SBL basin: Lonquimay river at the station located before its junction with the Bío-Bío river. For more details see also Table 2.
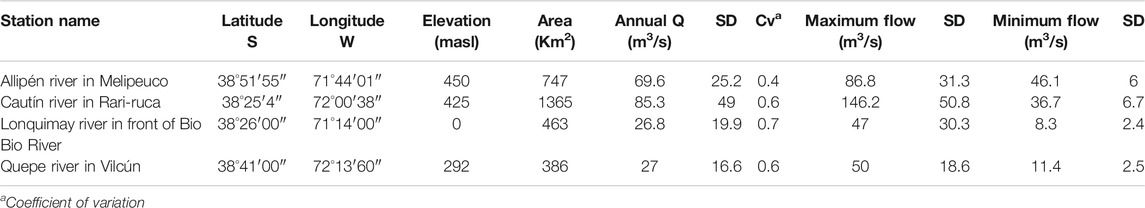
TABLE 3B. Results of the flows in each station: annual Q (m3/s); Coefficient of variation; max and min flows (m3/s) of the study rivers.
From both the figures and the tables, and as expected, the highest flows occur each year between June and September, and the lowest flows between January and April. Thus, the four rivers showed their historical maximum monthly flow in July 2001 and their historical minimum monthly flow in March 2009. We reported a mean maximum flow of 146 m3/s for the Cautín River, and 50 m3/s for the Quepe River, while the minimum mean flow was 36.7 m3/s and 11.4 m3/s respectively.
Note that the study of Rubio-Alvarez and McPhee (2010) shows an interannual variability of 0.4 (for the Rio Cautín station in Rari-Ruca and Quepe River station in Vilcún) and an annual flow of 107 m3/s for the Cautín River in Rari-Ruca and 34 m3/s for the Quepe River in Vilcún. Their results correspond to an average over 50 years of data (1952–2003). In our 16-years study (2000–2015), for these same river stations, the variability is 0.6 (for Cautín and Quepe Rivers), and the annual flows are 85.3 m3/s and 27 m3/s, respectively. Therefore, we can point out that in both cases, there is a more significant variability (0.6 greater than 0.4), and, in addition, for both rivers the annual flows decreased by 20%.
First it is important to note that, as specified in Land Uses and Demand for Irrigation, the model uses land cover information, which is a crucial element for water usage in irrigation. Based on the information showed in Table 1, we can point out that the sub-basin with the largest surface area is the Cautín river basin (SBC, 1,291 km2), of which 54% is native forest, 19% is agricultural use and 2.5% is forest plantations (mainly pine and eucalyptus). With respect to SBA (Allipén river, 1,052.7 km2), 45% is native forest, 19.3% is agricultural use and 8.7% is forest plantations. The information related to land uses for the other sub-basins is also included in Table 1.
The characteristics of the study area suggest the following types of activities that generate water demands: Human consumption, Agriculture (irrigation), Livestock production, Industry, Electricity production, Aquaculture, and Other uses. In Figure 4A, the annual water demands for each activity are shown in millions of cubic meters per year (hereinafter Mm3/yr). Figure 4B shows the domestic demand of the different demand sites. As expected, the highest demand is generated for agricultural uses, mainly irrigation of crops and meadows. Additionally, Figures 5B, C, D, E and F show the monthly distribution of the average water demand of the main activities for each sub-basin. The distribution of the results over all the basins is as follows: Agriculture: 79.4 Mm3/yr; Electricity production: 22.3 Mm3/yr; Livestock production: 6.2 Mm3/yr; Industry: 2.79 Mm3/yr; Aquaculture: 3.58 Mm3/yr; Human consumption: 2.69 Mm3/yr; and other uses: 2.4 Mm3/yr. It can be observed, that the highest demands are produced in agriculture and electricity production. However, results reveal a series of differences between the sub-basins. For example, human consumption is associated mainly to the Quepe and Cautín sub-basins, which correlates with the demands for industrial and other uses, and with its population settlements (Table 4A). Livestock demand is highest for the Cautín and Lonquimay sub-basins. In contrast, agricultural demand is associated mainly with the Allipén sub-basin, which also has the largest surface with agricultural uses (crops, forest plantations, and grassland, as shown in Table 1 and Table 4B). The highest variability during the year is observed in irrigation uses, since it only is required during the dry season, from November to April.
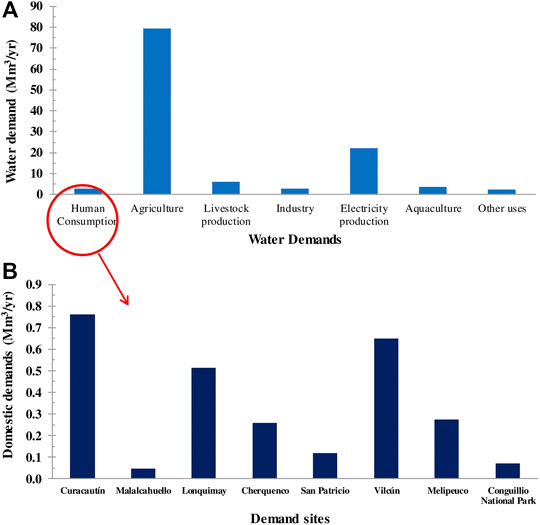
FIGURE 4. (A) Water Demands for different uses (Mm3/yr). (B) Annual domestic water demand of demand sites (Mm3/yr).
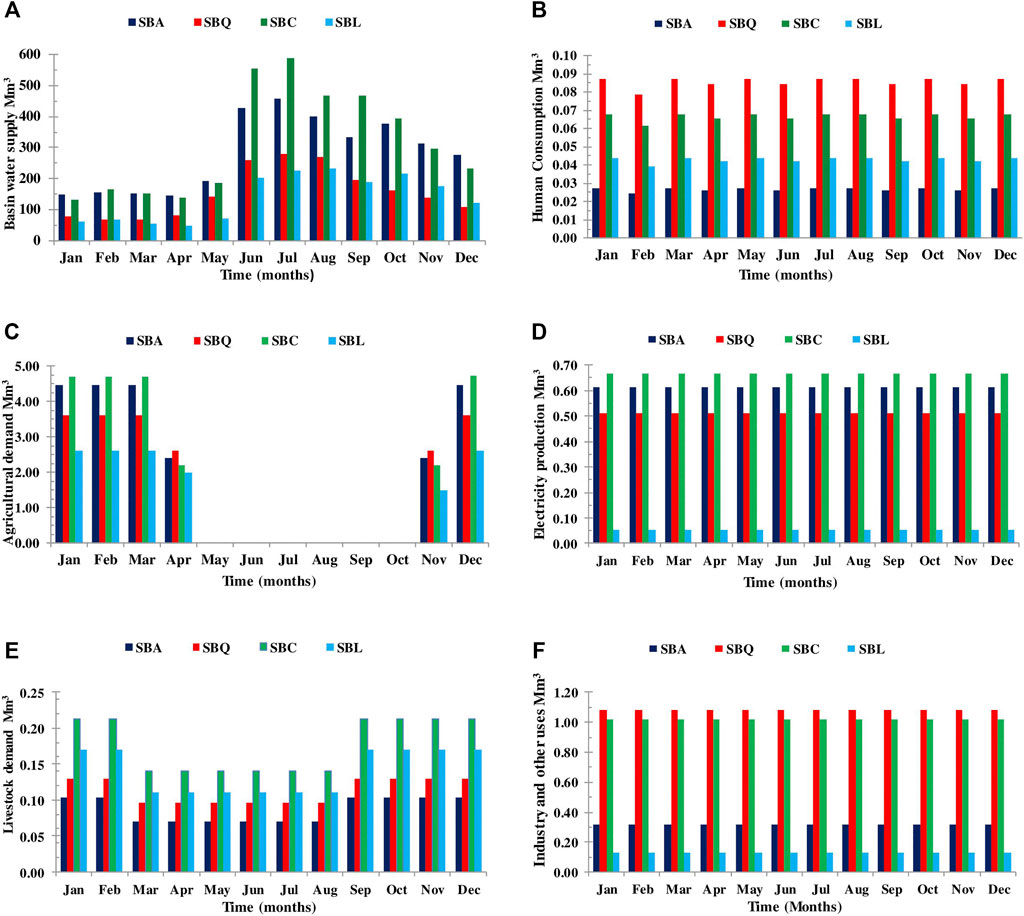
FIGURE 5. (A) Water supply in study sub-basins (Mm3/month); (B) Water demands for human consumption in each basin (Mm3/yr); (C) Water demands for agricultural uses in each basin (Mm3/yr); (D) Electricity production in each basin ((Mm3/yr); (E) Water demands for livestock farming in each basin (Mm3/yr); (F) Water demands for industry and other uses in each basin (Mm3/yr).
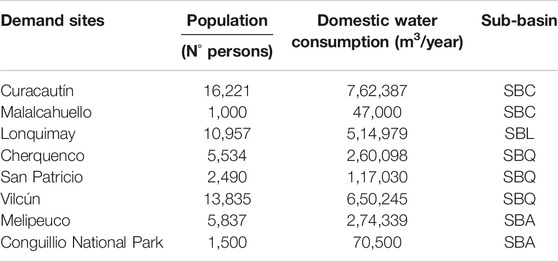
TABLE 4A. Water requirements of each demand site for human consumption (m3/yr).
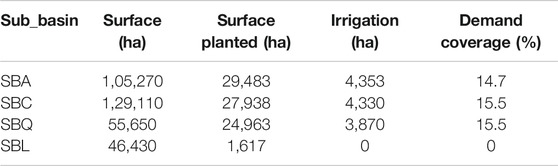
TABLE 4B. Total area (Ha), planted area (Ha), irrigated area (Ha) and coverage of the demand (%)
Considering its relevance, in the following sections the demand for human uses, irrigation, hydropower and livestock are described in more detail.
As described in Demand for Human Use, the water demand for human uses is associated with the eight urban areas identified in Table 4A, where also its water requirements are shown, which correlate with its population. Therefore, the highest demand is recorded in Curacautín (762,387 m3/yr), and the lowest in Malalcahuello (47,000 m3/yr). The Conguillío National Park (70,500 m3/yr) has to be considered as a particular demand site, since it receives many visitors in the summer months (more than 100,000), when the water demand increases significantly. With respect to water consumption at the sub-basin level (Figure 5B), the monthly consumption of these basins is shown: SBQ is the largest with 1,027,373 m3/yr; then SBC with 809,387 m3/yr; then SBL with 514,979 m3/yr, and finally SBA, which demand increases considerably due to visitors to Conguillío National Park during the summer. Without considering these months, the SBA has a demand of 274,339 m3/yr, which increases in the summer period to 344,839 m3/yr.
According to the 2007 Census, the Araucanía Region covers 20.6% of the national surface area dedicated to the forestry and agricultural sector (916,993 ha). The main use corresponds to forestry plantations, with 64.3% of this total, followed by cereals with 18.5% and fodder plants with 9.8%. These three items concentrate 92.6% of the hectares of forestry and agricultural use in the region. At the same time, the region presents great importance, at national level, in six items: industrial crops, cereals, forest plantations, legumes and tubers, seedbeds and fodder plants. With respect to cereals, legumes and tubers, of the total area of the country dedicated to these crops, 52.7% is located in the Araucanía Region, (ODEPA, 2015). It is also important to take full advantage of the excellent soil and climate conditions of the region, such as the yield of cereal crops in Chile, compared to the world, due to the quality of its soil, mainly in this region, which has volcanic soil with a high percentage of organic matter (Fernandez-Alberti et al., 2012). Taking a base of more than 50 years, in the world the yield has increased by 200% and in Chile more than 350% (FAO, 2015).
Table 4B shows the distribution of different types of surfaces associated with irrigation demands. The sub-basin with the largest planted area is SBA (28%), followed by SBC (22%). Thus, the largest sub-basin is the Cautín area, with a total surface of approx. 130,000 ha. About one-third of SBA and SBC correspond to cultivated area (84,000 ha), which potentially may need irrigation. In the case of SBQ, it happens that it has a smaller area than the previous basins (55,650 ha), but its ratio in terms of planted area is 45%, and finally SBL only 3%. However, and this is very important, the area effectively irrigated (12,553 ha) represents only 15% of the potential irrigation demand.
To understand this, it is necessary to know the following: The Office of Agrarian Studies and Policies (INE, 2007; ODEPA, 2015) considers a fixed water demand of 2,700 m3/ha for irrigation during the dry season (November to April). This implies a real irrigation demand of approximately 227 Mm3/yr. On the other hand, the irrigation water effectively authorized for these basins is only 11 Mm3/yr. These facts allow us to suggest that there exists a significant gap between the water effectively used for irrigation purposes, and the potential needs of water resources to cover the future potential demands.
As shown in Figure 5C, which presents the monthly irrigation demands at sub-basin level, the irrigation requirements are associated only to the dry season. At regional level, 21% (634.5 ha) of the territory has a water deficit, with the northern sector of the region being associated with land under strong pressure for agricultural and forestry use, (ODEPA, 2015). This poses the typical challenge of an adequate water resources management system, which inevitably requires the implementation of artificial water reservoirs, and the use of water balance models like WEAP to develop an effective management strategy.
The Araucanía region has approximately 1,000,000 ha of grasslands of excellent quality, which constitute the base for the breeding and feeding of cattle and sheep, and, on a smaller scale, horses and goats. As reported by ODEPA (2018), the region represents 10.4% of the livestock production of the country, and occupies the second place nationally in importance in the bovine mass. Specifically in the area of beef, the region has the necessary conditions to become an important producer - exporter of meat. In 2016, the region contributed with 18% of the country's cattle profit, measured in tons of meat (39,828 tons). In 2015, the region contributed with 7.7% of the milk received by the country's largest dairy industry plants (ODEPA, 2018). Figure 5E shows the average monthly water demand for livestock production during the year. The total demand in the entire basin is 6.2 Mm3/yr, and the highest demand is for SBC (2.12 Mm3/yr), mainly cattle production, followed by SBL (1.68 Mm3/yr) mainly sheep and goat production. It should be noted that the surface area destined to pasture in these sub-basins is 4.6% and 3% respectively.
The results of our study for water demand for electricity production was 22.3 Mm3/year (see Figure 5D). The SBC and SBA subbasins have the highest value of water use for hydroelectric production (8.14 and 7.95 Mm3/year, respectively), and the SBL has a very small value (0.01 Mm3/year). It should be noted that energy demand or consumption also has a relevant spatial component. For example, the Toltén river basin (where the SBA sub-basin is included) has a total hydroelectric potential of 1,123 MW distributed relatively evenly among all the sub-basins that make up the Toltén river basin and ranging from 100 to 500 MW (Energia, 2016).
In addition, when mapping the basin and its respective sub-basins, it was established that the areas with greatest potential for hydroelectric use, coincide with zones where natural protected areas are located. Therefore, there should be greater restrictions on use. However, today the greatest opposition to the installation of small hydroelectric plants are related with areas of important heritage (national parks) and, mainly, associated with cultural aspects of the native Mapuche people. So, the optimization model used seeks to know how much hydroelectric potential does not overlap with natural protected areas.
An essential aspect of estimating the water availability in a specific area is to have reliable data of the local precipitations behavior. This is the leading term of the inflow streams of any water balance model (see Figure 2). Figure 5A shows the average (2000–2015) monthly water supply of the total watershed under study, subdivided into the four sub-basins. This supply is the accumulated water, product of rainfall and snow upstream in the Andean mountain range, mainly in the periods from June to December, with the highest values from June to August.
The main components of the water balance are precipitation, runoff, and evapotranspiration. The monthly behavior of these terms for each catchment area, as simulated by the WEAP model using the available input data, is shown in Figures 6A, B and C, respectively. It can be observed that the catchment which presents the highest precipitation, runoff, and evapotranspiration for the entire period is the Allipén sub-basin (SBA). This catchment shows a well-marked rainfall regime since most of the runoff occurs in the winter months. Precipitation is around 2,175 mm/yr, with higher values in winter, while runoff and evapotranspiration reach 1,420 and 919 mm/yr, respectively. Thus, the runoff factor of the basin is close to 65%, and the evapotranspiration factor is 42%. In principle, the runoff component may be utilized to cover different water demands. However, if there is no adequate infrastructure to accumulate this freshwater, in a few hours, it will flow directly into the ocean. Also, Viviroli et al. (2020) point out that in many parts of the world mountain areas provide excessively high runoff. However, it is projected that 1.5 billion people (24% of the world's lowland population) will be critically dependent on contributions from mountain runoff (39% of the world's land mass) by the middle of the 21st century.
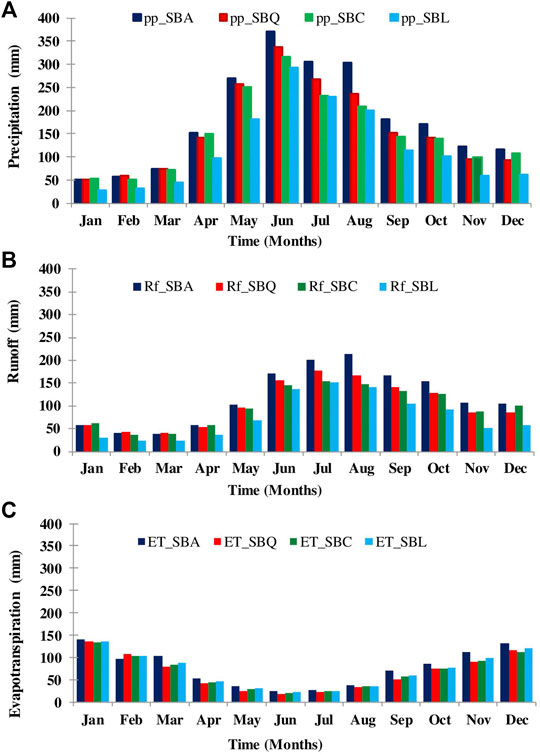
FIGURE 6. Results of the WEAP simulations: Calculated terms of the monthly water balance for each sub-basin (mm). (A) Precipitations (pp). (B) Runoff (Rf). (C) Evapotranspiration (ET).
According to DGA studies (2017), the Toltén River basin, of which the SBA catchment forms part, receives less than 15% of its precipitation in the form of snow, since the elevation of the Andes Mountain Range is lower in these latitudes. Almost the entire precipitation of the basin falls in liquid form, causing a marked pluvial regime in the flows.
Changes in the water balance during the cold, wet season (April-September) dominated those in the hot, dry season (October-March). Precipitation was higher between May and September in all the sub-basins, also causing a consistent runoff increase in that period. The essential point of the model is that supply can be summarized as the sum of direct runoff from precipitation, snow-melt, and baseflow. At the same time, evapotranspiration extracts water stored in the unsaturated subsoil (Yates et al., 2005).
This research aimed to advance in the understanding of the behavior of the mountain basins of the Andean mountain range in south-central Chile. Mountain basins are the primary sources of its freshwater supply (Momblanch et al., 2017) and also for the main watersheds of the Araucanía Region, in addition to providing ecosystem services. The study focused on four watersheds of a protected natural area (Conguillío National Park) located in the pre-Andean range of the Southern Andes. These basins drain their water to different communities, which use it as water resources. Using the different local hydroclimatic data available, the WEAP hydrological model was calibrated and validated, allowing not only to correctly determine the water balance, but also its usage.
Our results show that the total water available in the basin almost all the year is greater than the water consumption in the study area. On the other hand, downstream of the study area, the distribution of water is more complex, since the demand for consumption increases due to the fact that in the lower zones (valleys) there are significant human settlements (cities with populations greater than 100,000 persons), large agricultural and forested areas, and various industries. These conditions have to be considered in a territorial planning strategy, preferably based on watershed management. Unfortunately, at this time, the territorial planning based on watersheds is not yet a common practice in Chile. It is limited mainly to academic initiatives (Larrain et al., 2010).
Even if the obtained results of this study agree with the general behavior expected for this type of systems, to the best of our knowledge it is the first time in Chile that hydroclimatic and related data is processed, systematized, and used to validate a water management model. Therefore, this study developed a highly valuable planning skill to support strategic decision-making in the allocation of water resources to various sectors, including the corresponding investment requirements for water regulation infrastructure. This is a fundamental issue to face successfully the challenges raised by the different potential future changes, both in climate as in water demand for human activities. The increase in demand and changes in cropping patterns, combined with the effects of climate change, could present serious problems for agriculture if this activity and its irrigation demand are not planned.
In the context of global climate change, it is expected that Chile will be affected significantly (Valdés-Pineda et al., 2014). Future scenarios indicate a considerable decrease in precipitations (20–50%) and an increase in temperatures (1–3°C) (Orrego et al., 2016), which will have a dramatic impact on the natural and socio-economic environment, mainly in agro-industry. Droughts and floods may cause crop damage, while increased population growth (INE, 2015) will intensify pressure on freshwater supplies. Indeed, in the near-future global water supply will not be sufficient to cover the increasing demand. It is crucial to develop a public strategy to adapt to this uncertain new conditions (Valdés-Pineda et al., 2014; DGA, 2017).
On the other hand, in Chile the existence of several institutions related to water regulation means that the legal framework is fragmented, which generates coordination and financing problems. The use and management of water resources are regulated by the Water Code of 1981, which focuses on Water Rights. The Water Code defines water as a "national good of public use" but at the same time as an "economic good". It authorizes water privatization through the free use rights in perpetuity concession (it does not set limits to the concession of use rights). It establishes a system of water redistribution through transactions between private parties, thus creating a Water Market, and favors the concentration of ownership of this resource (Larraín et al., 2010; Larraín, 2012). Currently, a great debate takes place in Chile regarding the legislation change concerning water use and management. This debate requires correct knowledge of the distribution of water for different uses.
Therefore, a recommendation is that Chile should have a single institution that regulates and assigns water rights for different uses. For these reasons, a thorough review of the water legislation through the Water Code is needed.
In this context, obtaining calibrated results of a water balance through a water management model, allows to determine the different usages (domestic, agricultural, livestock, fish farming, hydroelectric, and industrial uses). It can be inferred that these sub-basins have a high use value, allowing the supply of water to different communes of the region demanding this resource, providing at the same time abundant opportunities for the development of different economic activities. Besides, it will contribute to a satisfactory and responsible decision-making process, allowing strategies implementation against the different current and future scenarios, such as land-use changes, industrial activities demands (fish farming, hydroelectric, and many others.), and thus will also ensure the Conguillío National Park ecosystem services sustainability.
From an ecosystemic point of view, the presence of these water bodies allows for the maintenance of a balance in the water balance of the basin, controlling runoff, reducing overflows and drying up of downstream flows, offering a high potential for the development of productive activities such as tourism, sport fishing, irrigation and many others CONAF, Corporación Nacional Forestal (2009). Furthermore, protected natural areas are important not only for Chile, since the existing natural heritage is made up of a unique global biodiversity (Mittermeier et al., 2004; Arroyo et al., 2006). Thus, these mountain ecosystems are areas of high production value. However, they are very fragile (Canedoli et al., 2020) and vulnerable to anthropic and climatic effects (Gao et al., 2020; Immerzeel et al. 2020).
Finally, nothing in hydrology can be correctly established without an accurate, modern, and homogeneous network of measurements, both meteorologically and hydrologically. It does not exist in Chile today, even for its most important watersheds. Therefore, it is recommended that the pertinent authorities implement policies oriented to meet the basic needs that allow the reliable follow-up of water flows, both in surface and subsurface, and push forward to effective implementation of watershed-based territorial planning strategies. The results and skills developed in this study are a valuable contribution to these objectives, since the WEAP water resource planning model provides accurate information for decision-making facing different future socio-economic scenarios, such as population growth, land-use changes, forestry, and agricultural use, and of course, those associated with climate change that will influence all the others (de Marsily and Abarca-del-Rio, 2016; Konapala et al., 2020).
The datasets generated for this study are available on request to the corresponding author.
SF-A is the main author who developed her Ph.D.-Thesis in the subject and obtained the results and data. CB is the adviser of the mentioned Ph.D.-Thesis. AÃ. and R-A-d-R are co-advisers of the PhD-Thesis. The co-authors R-A-d-R and CB assisted the first author in different levels of research, such as research design, interpretation of results and editing the manuscript. SF-A and R-A-d-R were in charge of the calibration and software validation.
The authors declare that the research was conducted in the absence of any commercial or financial relationships that could be construed as a potential conflict of interest.
The first author was supported by the Modeling and Scientific Computing Excellence Center (CEMCC) of Universidad de La Frontera, Temuco, Chile, through a Ph.D. program in Engineering at this University.
Aguayo, M., Pauchard, A., Azocar, G., and Parra, O. (2009). Land use change in the south Central Chile at the end of the 20th century. Understanding the spatiotemporal dynamics of the landscape. Rev. Chil. Hist. Nat. 82 (3), 361–374. doi:10.4067/S0716-078X2009000300004
Armesto, J., Arroyo, M., and Hinojosa, L. (2008). “The Mediterranean environment of central Chile,” in The physical geography of South America. Editors T. Vablen, K. Young, and A. Orme New York: Oxford University Press.
Arroyo, M. T. K., Marquet, P., Marticorena, C., Simonetti, J., Cavieres, L., Squeo, F., et al. (2006). “El Hotspot Chileno, prioridad mundial para la conservación,” in Comisión Nacional del Medioambiente. Editors B. de Chile, and P. Y. Desafíos Santiago de Chile: Ocho Libros Editores Ltd., 94–97.
Bathke, H., Shirzaei, M., and Walter, T. R. (2011). Inflation and deflation at the steep-sided Llaima stratovolcano (Chile) detected by using InSAR. Geophys. Res. Lett. 38, L10304. 10.1029/2011GL047168
Bauhus, J., Pokorny, B., van der Meer, P. J., Kanowski, P. J., and Kanninen, M. (2010). “Ecosystem goods and services–the key for sustainable plantations,” in Ecosystem goods and services from plantation forests. London, UK: Routledge, 221–243.
BCN, (2019). Biblioteca del Congreso Nacional de Chile Información Territorial. Available at: https://www.bcn.cl/siit/nuestropais/region9
Bhave, A. G., Mishra, A., and Raghuwanshi, N. (2014). A combined bottom-up and topdown approach for assessment of climate change adaptation options. J. Hydrol. 518, 150–161. 10.1016/j.jhydrol.2013.08.039
Biggs, E. M., Bruce, E., Boruff, B., Duncan, J. M. A., Horsley, J., Pau, N., et al. (2015). Sustainable development and the water-energy-food nexus: a perspective on livelihoods. Environ. Sci. Policy 54, 389–397. 10.1016/j.envsci.2015.08.002
Boisier, J. P., Rondanelli, R., Garreaud1, R. D., and Muñoz, F. (2016). anthropogenic and natural contributions to the Southeast pacific precipitation decline and recentmegadrought in central Chile. AGU Geophys. res. let. 43, 413–421. doi:10.1002/2015GL067265
Brauman, K. A., Daily, G. C., Duarte, T. K., and Mooney, H. A. (2007). The nature and value of ecosystem services: an overview highlighting hydrologic services. Annual Rev. Environ. Res. 32, 67–98. doi:10.1016/j.advwatres.2011.02.010
Canedolia, C., Ferrèa, Ch., Khair, D., Comollia, R., Ligaa, C., Mazzucchellia, F., et al. (2020). Evaluation of ecosystem services in a protected mountain area: soil organic carbon stock and biodiversity in alpine forests and grasslands. Ecosystem Serv. 44, 101135. doi:10.1016/j.ecoser.2020.101135
CCG (2009). Centro. de Cambio Global-Universidad Católica de Chile, Stockholm Environment Institute Guía Metodológica – modelación Hidrológica y de Recursos Hídricos con el Modelo WEAP. Available at: http://www.weap21.org/index.asp?action=40
CEPAL (2012). La economía del cambio climático en Chile. Available at: http.//repositorio.cepal.org/bitstream/handle/11362/35372/S2012058_es.pdf?sequence
Chaplin, G. (2005). Physical geography of the Gaoligong Shan area of southwest China in relation to biodiversity. Proc. Calif. Acad. Sci. 56, 527–556.
Universidad de Chile (2007). Variabilidad climática de Chile para el siglo XXI”. Departamento de Geofísica, Santiago de Chile.
Universidad de Chile (2012). Estado del arte de modelos para la investigación del cambio global. Departamento de Geofísica, Santiago de Chile.
Universidad de Chile (2015). AGRIMED, centro de Estudios de Agricultura y medioambiente Atlas Agroclimático de Chile.
Clark, S., Abbett, E., and Nandagopal, S. (2004). Water resources: Agricultural and environmental issues, Bioscience 54 (10), 909–918. doi:10.1641/0006-3568(2004)054[0909:WRAAEI]2.0.CO;2
CNR, (2011). Comisión Nacional de Riego política nacional de Riego, una mirada a largo plazo. Available at: www.cnr.gob.cl
CONAF, Corporación Nacional Forestal (2009). Unidad de Gestión patrimonio silvestre. Sección parques nacionales y monumentos naturales. Región de la Araucanía de la Araucanía, Chile. Plan de manejo de Parque Nacional Conguillío.
CONAF, Corporación Nacional Forestal (2012). Catastro de los Recursos Vegetacionales Nativos de Chile. Monitoreo de cambios y actualizaciones. Período 1997-2011. Corporación Nacional Forestal, 30.
Condom, T., Escobar, M., Purkey, D., Pouget, J. C., Suarez, W., Ramos, C., et al. (2011). Modelling the hydrologic role of glaciers within a water evaluation and planning system (WEAP): a case study in the Rio santa watershed (Peru). Hydrol. Earth Syst. Sci. Discuss. 8, 869–916. doi:10.5194/hessd-8-869-2011
Código de Aguas, (1981). Decreto con Fuerza de Ley 1122. Libro Primerode las Aguas y del Derecho de Aprovechamiento. Ministerio de Justicia.
Cortés, G. (2010). “Evaluación de un modelo hidrológico semi distribuido para la estimación de la escorrentía de deshielo en el río Juncal,” in Memoria para optar al título de Ingeniero Civil. Chile: Universidad de ChileAvailable at: www.cybertesis.uchile.cl/tesis/uchile/2010/cf-cortes_gs/pdfAmont/cf-cortes_gs.pdf
de Marsily, G., and Abarca-del-Rio, R. (2016). Water and food in the twenty-first century. Surv. Geophys. 37, 503–527. 10.1007/s10712-015-9335-1
Decocq, G., Andrieu, E., Brunet, J., Chabrerie, O., De Frenne, P., De Smedt, P., et al. (2016). Ecosystem services from small forest patches in agricultural landscapes. Curr. Forest. Reports 2 (1), 30–44. doi:10.1007/s40725-016-0028-x
Demaría, E. M. C., Maurer, E. P., Thrasher, B., Vicuña, S., and Meza, F. J. (2013). Climate change impacts on an alpine watershed in Chile: do new model projections change the story?. J. Hydrol. 502, 128–138. 10.1016/j.jhydrol.2013.08.027
DGA, (2007). Dirección. General de Aguas. Evaluación de Recursos Hídricos. Informe Técnico. Departamento de Administración y Recursos Hídricos. Santiago, SDT No 248.
DGA (2016). Dirección General de Aguas. Available at: http://snia.dga.cl/BNAConsultas/reportes
DGA (2017). Dirección General de Aguas, División de Estudios y Planificación, Ministerio de Obras Públicas Metodología para la Actualización del Balance Hídrico Nacional. Ministerio de Obras Públicas de Chile.
Droogers, P., de Boer, F., and Terink, W. (2014). “Water allocation models for the umbeluzi river basin, Mozambique,” in Wetter Skip Frystan and ARA-Sul Report Future Water, Netherlands, 132.
Echeverría, C., Newton, A., Nahuelhual, L., Coomes, D., and Rey-Benayas, J. M. (2012). How landscapes change: integration of spatial patterns and human processes in temperate landscapes of southern Chile. Appl. Geogr. 32, 822–831. doi:10.1016/j.apgeog.2011.08.014
Energía, M. d. (2016). Estudio de cuencas. Análisis de las condicionantes para el desarrollo hidroeléctrico en las cuencas del Maule, Biobío, Toltén, Valdivia, Bueno, Puelo, Yelcho, Palena, Cisnes, Aysén, Baker y Pascua. Santiago: Gobierno de Chile, 104.
Falvey, M., and Garreaud, R. D. (2009). Regional cooling in a warming world: recent temperature trends in the southeast Pacific and along the west coast of subtropical South America (1979–2006). J. Geophys. Res. Atmos 114, D04102. 10.1029/2008JD010519
Fan, M., Hideaki, S., and Wang, Q. (2016). Optimal conservation planning of multiple hydrological ecosystem services under land use and climate changes in Teshio river watershed, northernmost of Japan. Ecol. Indicat. 62, 1–13. 10.1016/j.ecolind.2015.10.064
FAO (2015). Organización de Las naciones Unidad para la Alimentación y la Agricultura. Estudio: Perspectivas de la Agricultura y del Desarrollo Rural en las Américas 2015–2016. ISBN 978-92-9248-577-1. San José, Costa Rica 2015.
Fernández-Alberti, S., Rubilar, O., Tortella, G. R., and Diez, M. C. (2012). Chlorpyrifos degradation in a Biomix: effect of pre-incubation and water holding capacity. J. Soil Sci. Plant Nutr. 12 (4), 785–799. doi:10.4067/S0718-95162012005000032
Figueroa, E. (2010). Valorización Económica Detallada de las Áreas Protegidas. Proyecto GEF SNAP “Creación de un Sistema Nacional Integral de áreas protegidas. Santiago Chile.
Figueroa, E. (2009). “Valor Económico de la Contribución Anual del Sistema Nacional de Áreas Protegidas de Chile y Análisis de su Financiamiento”; en Comisión Nacional del Medioambiente-Chile (CONAMA), Programa de Naciones Unidas para el Desarrollo (PNUD) y World Bank-Global Environmental Facility (GEF),” in Creación de un Sistema Nacional Integral de Áreas Protegidas para Chile. Net impresores SpA. Santiago, Chile, 107–280.
Forni, L. G., Galaitsi, S. E., Mehta, V. K., Escobar, M. I., Purkey, D. R., Depsky, N. J., et al. (2016b). Exploring scientific information for policy making under deep uncertainty. Environ. Model. Software 86, 232–247. doi:10.1016/j.envsoft.2016.09.021
Forni, L. G., Medellín-Azuara, J., Tansey, M., Young, Ch., Purkey, D., and Howitta, R. (2016a). Integrating complex economic and hydrologic planning models: an application for drought under climate change analysis. Water Res. Econom. 16, 15–27. doi:10.1016/j.wre.2016.10.002
Gao, Y., Zhang, S. X., Geng, R. T., Ren, G. P., Cui, L. W., and Xiao, W. (2020). Control selection for the assessment of protected areas in the hengduan mountains: a case study in yunlong tianchi national nature reserve, China. Global Ecology and Conservation 23, e01170. doi:10.1016/j.gecco.2020.e01170
Garreaud, R., Vuille, M., Compagnucci, R., and Marengo, J. (2009). Present-day south American climate. Palaeogeogr. Palaeoclimatol. Palaeoecol. 281 (3), 180–195. doi:10.1016/j.palaeo.2007.10.032
Harma, K. J., Johnson, M. S., and Cohen, S. J. (2012). Future water supply and demand in the Okanagan Basin, British Columbia: a scenario-based analysis of multiple, interacting stressors. Water Resour. Manage 26, 667–689. doi:10.1007/s11269-011-9938-3
Huber, R., Rigling, A., Bebi, P., Brand, F. S., Briner, S., Buttler, A., et al. (2013). Sustainable land use in mountain regions under global change: synthesis across scales and disciplines. Ecol. Soc. 18 (3), 36. doi:10.5751/ES-05499-180336
IDE (2017). Infraestructura de Datos Geoespaciales de Chile. Available at: www.ide.cl.
Immerzeel, W., Lutz, A., Andrade, M., Bahl, A., Biemans, H., Bolch, T., et al. (2020). Importance and vulnerability of the world’s water towers. Nature 577, 364–369. doi:10.1038/s41586-019-1822-y
INE (2007). Instituto. Nacional de Estadísticas Chile Censo agrícola. Santiago, Chile. Available at: http://www.ine.cl/canales/chile_estadistico/censos_agropecuarios/censo_agropecuario_07.php.
INE (2014). Instituto. Nacional de Estadísticas Chile tablas generales de Estadísticas de Población y vitales. ISBN: 978-956-323-178-6.
INE (2015). Instituto. Nacional de Estadísticas Chile tablas generales de Estadísticas de Población y vitales. ISBN: 978-956-323-166-3.
Iroumé, A., and Palacios, H., (2013). Afforestation and changes in forest composition affect runoff in large river basins with pluvial regime and Mediterranean climate, Chile J. Hydrol. 505, 113–125. 10.1016/j.jhydrol.2013.09.031
Jorquera-Jaramillo, C., Vega, J.M., Jaime Aburto, J., Martínez-Tillería, K., León, M.F., Pérez, M.A., et al. (2012). Biodiversity conservation in Chile: new challenges and opportunities in terrestrial and marine coastal ecosystems. Rev. Chil. Hist. Nat. 85, 267–280. doi:10.4067/S0716-078X2012000300002
Konapala, G., Mishra, A. K., Wada, Y., and Mann, M. E. (2020). Climate change will affect global water availability through compounding changes in seasonal precipitation and evaporation. Nat. Commun. 11 (1), 3044. doi:10.1038/s41467-020-16757-w
Kurz, W. A., Stinson, G., Rampley, G. J., Dymond, C. C., and Neilson, E. T. (2008). Risk of natural disturbances makes future contribution of Canada's forests to the global carbon cycle highly uncertain. Proc. Nat. Acad. Sci. 105, 1551–1555. doi:10.1073/pnas.0708133105
Larraín, S. (2012). Water in Chile: Inbetween human rights and the rules of market. Polis Revista Latinoamenricana. Available at: http://journals.openedition.org/polis/5091.
Larraín, S., Aedo, M., Navarrete, K., and Villarroel, C. (2010). Marco Jurídico para la Gestión del Agua en Chile. Diagnóstico y Desafíos. Programa Chile Sustentable and Fundación Heinrich Böll. I.S.B.N.: 978-956-7889-44-0.
Little, C., Lara, A., McPhee, J., and Urrutia, R. (2009). Revealing the impact of forest exotic plantations on water yield in large scale watersheds in South-Central Chile. J. Hydrol. 374, 162–170. doi:10.1016/j.jhydrol.2009.06.011
Liu, J., Li, J., Qin, K., Zhou, Z., Yang, X., and Li, T. (2017). Changes in land-uses and ecosystem services under multi-scenarios simulation. Sci. Total Environ. 586, 522–526. 10.1016/j.scitotenv.2017.02.005
Liu, Y., Gupta, H., Springer, E., and Wagener, T. (2008). Linking science with environmental decision making: experiences from an integrated modeling approach to supporting sustainable water resources management. Environ. Model. Software 23, 846–858. doi:10.1016/j.envsoft.2007.10.007
Luebert, F., and Pliscoff, P. (2006). Sinopsis bioclimática y vegetacional de Chile. Editorial Universitaria. Instituto de Geografía. Pontificia Universidad Católica de Chile. ISBN 9789561125759.
Maliehe, M., and Mulungu, D. M. (2017). Assessment of water availability for competing uses using SWAT and WEAP in South Phuthiatsana catchment, Lesotho. Phys. Chem. Earth 100, 305–316. doi:10.1016/j.pce.2017.02.014
Mehta, V. K., Haden, V. R., Joyce, B. A., Purkey, D. R., and Jackson, L. E. (2013). Irrigation demand and supply, given projections of climate and land-use change, in Yolo County, California. Agric. Water Manag. 117, 70–82. 10.1016/j.agwat.2012.10.021
MMA (2014). Quinto Informe Nacional de Biodiversidad de Chile ante el Convenio sobre la Diversidad Biológica (CBD). Chile, 140.
MMA (2015). Available at: http://www.mma.gob.cl/1304/articles-50880_docomunicadoCambioClimatico.pdf.
MMA (2016). Anteproyecto Plan de Acciótn Nacional de Cambio Climático (2017-2022), Departamento de Cambio Climáttico. Ministerio del Medio Ambiente.
Miranda, A., Altamirano, A., Cayuela, L., Pincheira, F., and Lara, A. (2015). Different times, same story: native forest loss and landscape homogenization in three physiographical areas of south-central Chile. Appl. Geogr. 60, 20–28. doi:10.1016/j.apgeog.2015.02.016
Mittermeier, R. A., Gil, P. R., Hoffmann, M., Pilgrim, J., Brooks, T., Mittermeier, C. G., et al. (2004). Hotspots revisted: earth’s biologically wealthiest and most threatened ecosystems. México D.F.: CEMEX, 99–103.
Momblanch, A., Paredes-Arquiola, J., and Andreu, J. (2017). Improved modelling of the freshwater provisioning ecosystem service in water scarce river basins. Environ. Model. Software 94, 87–99. 10.1016/j.envsoft.2017.03.033
Moreira-Muñoz, A., and Troncoso, J. (2014). “Representatividad biogeográfica de las Reservas de la Biosfera de Chile,” in Reservas de la Biósfera de Chile: laboratorios para la Sustentabilidad. Editors A. Moreira-Muñoz, and A. Borsdorf, Santiago: serie Geolibros, Academia de Ciencias Austriaca, Pontificia Universidad Católica de Chile, Instituto de Geografía, 17, 24–61.
Mori, A. S., Lertzman, K. P., and Gustafsson, L. (2017). Biodiversity and ecosystem services in forest ecosystems: a research agenda for applied forest ecology. J. Appl. Ecol. 54 (1), 12–27. doi:10.1111/1365-2664.12669
Mulungu, D. M., and Taipe, C. I. (2012). “Water evaluation and planning in wami river -basin: application of the WEAP model,” in Bioenergy and Food Security e the BEFS Analysis for Tanzania FAO, Editor E. Beall 54, 47–69.
Nahuelhual, L., Carmona, A., Lara, A., Echeverría, C., and Gonzalez, M. E. (2012). Land-cover change to forest plantations: proximate causes and implications for the landscape in South-Central Chile. Landsc. Urban Plann. 107 (1), 12–20.
Naranjo, J. A., and Moreno, H. Y. (2005). Geología del volcán Llaima, Región de la Araucanía. Servicio nacional de Geología y minería, Carta Geológica de Chile, Serie Geología Básica. Santiago Chile.
Nelson, E., Mendoza, G., Regetz, J., Polasky, S., Tallis, H., and Cameron, D. R. (2009). Modeling multiple ecosystem services, biodiversity conservation, commodity production, and tradeoffs at landscape scales. Front. Ecol. Environ. 7, 4–11. doi:10.1890/080023
ODEPA (2015). Ministerios de Agricultura. Estudio: “Región de la Araucanía información regional 2015
Orrego, R., Abarca del Río, R., Ávila, A., and Morales, L. (2016). Enhanced mesoscale climate projections in TAR and AR5 IPCC scenarios: a case study in a Mediterranean climate (Araucanía Region, south central Chile). SpringerPlus 5, 1669. doi:10.1186/s40064-016-3157-6
Purkey, D., Joyce, B., Vicuna, S., Hanemann, M., Dale, L., Yates, D., et al. (2008). Robust analysis of future climate change impacts on water for agriculture and other sectors: a case study in the sacramento valley. Climatic Change 87 (Suppl. 1), S109–S122. doi:10.1007/s10584-007-9375-8
Qintana, J., and Aceituno, P. (2012). Changes in the rainfall regime along the extratropical west coast of South America (Chile): 30-43°S. Atmósfera 25 (3450), 1–22.
Rahbek, C., Borregaard, M. K., Antonelli, A., Colwell, R. K., Holt, B. G., Nogues-Bravo, D., et al. (2019b). Building mountain biodiversity: geological and evolutionary processes. Science 365 (6458), 1114–1119. 10.1126/science.aax0151
Rahbek, C., Borregaard, M. K., Colwell, R. K., Dalsgaard, B., Holt, B. G., Morueta-Holme, N., et al. (2019a). Humboldt’s enigma: what causes global patterns of mountain biodiversity? Science 365 (6458), 1108–1113. 10.1126/science.aax0149
Rubilar, A. (1994). Diversidad ictiológica en depósitos continentales miocenos de la Formación Cura-Mallín, Chile (37-39°S): implicancias paleogeográficas. Rev. Geol. Chile 21 (1), 3–29. 10.5027/andgeoV21n1-a01
Rubio-Álvarez, E., and McPhee, J. (2010). Patterns of spatial and temporal variability in streamflow records in south central Chile in the period 1952–2003. Water Resour. Res. 46, W05514. doi:10.1029/2009WR007982
Sample, J. E., Baber, I., and Badger, R. (2016). A spatially distributed risk screening tool to assess climate and land use change impacts on water-related ecosystem services. Environ. Model. Softw. 83, 12–26. 10.1016/j.envsoftdoi:.2016.05.011
Santibáñez, F., Santibáñez, P., Caroca, C., González, P., Gajardo, N., Pery, P., Simonetti, J. Y., and Pliscoff, P. (2013). Plan de acción para la adaptación y conservación de la biodiversidad en un contexto de adaptación al cambio climático. Fundación facultad de Ciencias Agronómicas Universidad de Chile, Santiago de Chile.
Schulz, J. J., Cayuela, L., Benayas, Rey., J. M., , and Schroeder, B. (2011). Factors influencing vegetation cover change in Mediterranean Central Chile (1975-2008). Appl. Veg. Sci. 14, 571–582. doi:10.1111/j.1654-109X.2011.01135.x
Sieber, J., Swartz, C., and Huber-Lee, D. (2005). WEAP water evaluation and planning system user guide for WEAP21. Stockholm: Environment Institute.
Tidwell, V., and Moreland, B. (2016). Mapping water consumption for energy production around the Pacific Rim. Environ. Res. Lett. 11, 094008. doi:10.1088/1748-9326/11/9/094008
UNESCO-MAB, Schaaf, T. (1995). “Integrated mountain research and environmental conservation,” in Conference paper No. 21 of EuroMAB IV symposium on mountain zonality facing global change. Editor En A. Breymeyer. Institute of Geography and Spatial Organization, 9-16.
USGS, (2016). Geological surveyscience for a changing world. Available at: www.usgs.gov/
Valdés-Pineda, R., Pizarro, R., García-Chevesich, P., Valdés, J. B., Olivares, C., Vera, M., et al. (2014). Water governance in Chile: availability, management and climate change. J. Hydrol. 519, 2538–2567. 10.1016/j.jhydrol.2014.04.016
Van Loon, A., and Doogers, P. (2006). Water evaluation and planning system. Kitui Kenya-report N° 2. Kenya.
Vicuña, S., Garreaud, R. D., and McPhee, J. (2011). Climate change impacts on the hydrology of a snowmelt driven basin in semiarid Chile. Clim. Change 105, 469–488. doi:10.1007/s10584-010-9888-4
Viviroli, D., Kummu, M., Meybeck, M., Kallio, M., and Wada, Y. (2020). Increasing dependence of lowland populations on mountain water resources. Nature Sust. 3, 917–928. 10.1038/s41893-020-0559-9
World Bank (2011). Departamento de Medio Ambiente y Desarrollo Sostenible Región para América Latina y el Caribe. Chile, Diagnóstico de la gestión de los recursos hídricos.
WWAP (2014). Programa Mundial de Evaluación de los Recursos Hídricos. Informe Mundial sobre el Desarrollo de los Recursos Hídricos 2014: agua y energía. Available at: http://www.unesco.org/new/es/natural-sciences/environment/water/wwap/wwdr/
Yan, D., Wernersa, S. E., Ludwiga, F., and Huang, H. Q. (2015). Hydrological response to climate change: the Pearl River, China under different RCP scenarios. J. Hydrol. Reg. Stud. 4, 228–245. doi:10.1016/j.ejrh.2015.06.006
Yang, X., Li, J., Qin, K., Li, T., and Liu, J. (2015). Trade-offs between ecosystem services in guanzhong-tianshui economic region. Acta geograph. Sin. 4, 1762–1773. doi:10.11821/dlxb201511006
Yates, D., Purkey, D., Sieber, J., Huber-Lee, A., and Galbraith, H. (2005a). WEAP21 – a Demand-,Priority-, and preference-driven water planning model. Part 2: aiding freshwater ecosystem service evaluation. Water Int. 30 (4), 501–512. doi:10.1080/02508060508691894
Yates, D., Sieber, J., Purkey, D., and Huber-Lee, A. (2005b). WEAP21-A demand-, priority-, and preference-Driven Water Planning Model: Part 1: model characteristics. Water Int. 30 (4), 487–500. doi:10.1080/02508060508691893
Yates, D., Purkey, D., Sieber, J., Huber-Lee, A., Galbraith, H., West, J., et al. (2007). A physically-based, water resource planning model of the Sacramento Basin, California USA. ASCE J. Water Res. Manag. (inpress)
Yates, D., Purkey, D., Sieber, J., Huber-Lee, A., Galbraith, H., West, J., et al. (2009). Climate driven water resources model of the sacramento basin, California. J. Water Resour. Plan. Manag. 135.
Young, C. A., Escobar, M. I., Fernandes, M., Joyce, B., Kiparsky, M., Mount, J. F., et al. (2009). Modeling the hydrology of climate change in California's Sierra Nevada for subwatershed scale. Adaptation1. J. Am. Water Resour. Assoc. 45, 1409–1423. doi:10.1111/j.1752-1688.2009.00375.x
Keywords: mountain basin, natural protected areas, ecosystem services, water evaluation and planning, water resources, water balance
Citation: Fernández-Alberti S, Abarca-del-Río R, Bornhardt C and Ávila A (2021) Development and Validation of a Model to Evaluate the Water Resources of a Natural Protected Area as a Provider of Ecosystem Services in a Mountain Basin in Southern Chile. Front. Earth Sci. 8:539905. doi: 10.3389/feart.2020.539905
Received: 02 March 2020; Accepted: 23 November 2020;
Published: 19 January 2021.
Edited by:
Nils Moosdorf, Leibniz Centre for Tropical Marine Research (LG), GermanyReviewed by:
David R. Purkey, Stockholm Environment Institute (Latin America Center), ColombiaCopyright © 2021 Fernández-Alberti, Abarca-del-Río, Bornhardt, and Ávila. This is an open-access article distributed under the terms of the Creative Commons Attribution License (CC BY). The use, distribution or reproduction in other forums is permitted, provided the original author(s) and the copyright owner(s) are credited and that the original publication in this journal is cited, in accordance with accepted academic practice. No use, distribution or reproduction is permitted which does not comply with these terms.
*Correspondence: Sandra Fernández-Alberti, c2FuZHJhLmZlcm5hbmRlekB1ZnJvbnRlcmEuY2w=
Disclaimer: All claims expressed in this article are solely those of the authors and do not necessarily represent those of their affiliated organizations, or those of the publisher, the editors and the reviewers. Any product that may be evaluated in this article or claim that may be made by its manufacturer is not guaranteed or endorsed by the publisher.
Research integrity at Frontiers
Learn more about the work of our research integrity team to safeguard the quality of each article we publish.