 Qin Chen
 Gang Fan
 Jia-wen Zhou
- 1State Key Laboratory of Hydraulics and Mountain River Engineering, Sichuan University, Chengdu, China
- 2College of Water Resource and Hydropower, Sichuan University, Chengdu, China
The mass movement process of the 2017 Xinmo catastrophic landslide was simulated using the discreet element method (DEM). Field investigation indicates that the basal entrainment is a typical feature of this landslide. Hence, the entrained colluvium on the sliding path is considered in the DEM model. According to the terrain elevation data before and after sliding, the slope geometry is divided into three parts: sliding bed, sliding body, and colluvium on the path. The blocks are generated in MATLAB and a fill-remove method has been used to produce the loose colluvium. The key parameter, contact friction angel, which controls the mobility of mass movement, has been obtained through displacement back analysis. The simulated deposit area and main sliding time coincide with actual landslide characteristics. Simulation results indicate that the colluvium is pushed to the bottom of the Songpinggou Valley by the sliding body. The local topography has a significant influence on the sliding direction. Some typical phenomena of substrate entrainment, including frontal plowing, mass spray, shear zones in substrate, thickened substrate, and basal abrasion, are observed in the DEM simulation. During the entrainment process, the frontal plowing, or the thrust, plays an important role in creating the substrate failure compared with basal abrasion. After the failure of the whole colluvium, the magnitude of thrust descends quickly but is still slightly larger than that of shear thrust. Entrainment of dry material on the slope leads to more friction energy consumption and reduces the mobility of mass movement. This work shows a good capability of simulating entrainment of dry materials using a discreet element method and highlights the significance of plowing relative to the basal abrasion under conditions of limited path material supply.
Introduction
Rapid landslides often lead to catastrophic accidents and serious loss of life and property, because of their high velocity and long run-out distance (Pirulli, 2009; Yin et al., 2009; Zhou et al., 2013; Hu et al., 2020). Substrate entrainment is another typical feature of high-speed landslides (McDougall and Hungr, 2005; Zhou et al., 2016). As the loose deposition on run-out paths is entrained by sliding mass, the total volume of landslides increases rapidly, and the final volume of some landslides can reach several times their initial volume. For instance, on 9 April 2000, a catastrophic landslide took place at Yigong Town; the initial volume of the landslide was about 1.0 × 10⁸ m3, while the final volume reached 3 × 10⁸ m3 by scraping the ancient landslide deposits on the landslide path with a volume magnification factor of 2. The entrainment process is affected by many factors, such as topography, landslide volume, thickness of accumulation, water content, and compactness, so it is difficult to accurately predict the amplification effect of a landslide (Aaron and McDougall, 2019).
It is crucial for disaster prediction, prevention, and reduction to include entrainment in landslide dynamics models. However, there is little knowledge about entrainment, because landslides occur suddenly and the process of landslide motion is rarely recorded. Hence the insight into the entrainment effect is mainly based on laboratory experiments. According to the research purposes, experimental investigations are divided into two categories. One is to study the mechanism of entrainment (Barbolini et al., 2005; Sovilla et al., 2006; Lu et al., 2016). Based on the observation of the failure mode of the substrate, it is proposed that the plowing at the flow front and the basal abrasion occurred at the interface between flow mass and static path materials is two main mechanisms in the process of substrate entrainment. The other is to study the dynamic effect of entrainment, such as its influence on the velocity of landslide, the influence on the accumulation morphology of the landslide, etc (Mangeney et al., 2010; Dufresne, 2012). The mobility and runout of a landslide respond significantly to the nature of the substrate. A series of large-scale experiments have been conducted by Iverson et al. (2011) et al. and they suggest that increasing positive pore water pressure in wet substrate caused by debris flow significantly reduces the flowing resistance and leads to an increase of velocity and runout (Hungr and Evans, 2004; Wang et al., 2013; Zhou et al., 2016; Ouyang et al., 2017). For a dry substrate condition, both enhanced and reduced runout distance compared with results in a rigid path were observed under different experimental conditions (Mangeney et al., 2010; Dufresne, 2012), yet it is still difficult to explain the mechanism that the reduction of basal resistance operates under while entraining dry path materials in some particular situations. In addition, although we can accurately capture the movement characteristics of the landslide in these experiments, the results of the model experiments are limited to practical applications because the dynamic similarity between the model and the prototype cannot be strictly satisfied (Friedmann et al., 2006).
The numerical simulation technology can simulate a real-scale landslide which overcomes the disadvantages of scaled experiments. In addition, the scaled experiments provide insight to the mechanism of the entrainment effect, which contributes to developing a variety of mathematical entrainment models. At present, most of the entrainment models simulate the volume change of a landslide by adding a base erosion term to the hydrodynamics equation. These entrainment models can be divided into two categories: (1) empirical model (McDougall and Hungr, 2005; Cuomo et al., 2016) and (2) physical model (Luna et al., 2012; Ouyang et al., 2015). These entrainment models have a common feature, i.e., the failure of the substrate is caused by the shear force parallel to the basal surface, while the plowing at the flow front is ignored. Therefore, further validation is needed when these models are used.
The 2017 Xinmo catastrophic landslide is a typical rapid landslide with an obvious feature of volume enlargement due to basal entrainment. Many researchers had investigated the landslide movement using numerical simulation technology, including entrainment models (Chen and Wu, 2018; Hu et al., 2019; Huang et al., 2019; Liu et al., 2019), while a clear understanding of the entrainment process is still needed. In this paper, the three-dimensional distinct element code (3DEC) is applied to simulate the movement and the entrainment of the Xinmo Landslide. This paper is organized as follows: In Section “BACKGROUND,” the background of the Xinmo Landslide is first introduced. Then, the DEM theory, geometry model establishment, and numerical parameters installation are illustrated in Section “METHOD AND MODEL.” Section “RESULTS” gives the simulation results. The mechanism of frontal plowing and basal abrasion, and influence of substrate entrainment on the mobility of the Xinmo Landslide, is discussed in Section “DISCUSSION.” The last section gives the conclusions of this paper.
Background
On June 24, 2017, a catastrophic landslide took place in the Diexi Town, Maoxian County, Sichuan Province, at the southwest of China (Figure 1). It suddenly collapsed and rushed down the hill to the Xinmo Village at the slope’s toe (Figure 2a), causing 10 fatalities, leaving 73 missing, and burying 64 buildings. The main reason for rock mass instability is that a large amount of rainfall in the two months before sliding and historical earthquakes in the area reduced the rock mass strength (Fan X. et al., 2017). The huge elevation difference and steep slope provided favorable conditions for the high-speed and long-distance movement of the landslide. According to field investigations and seismic acceleration records recorded by the Maoxian seismic station, the landslide runout extended 2,500 m horizontally and 1,200 m vertically (Figure 3B) in 120 s.
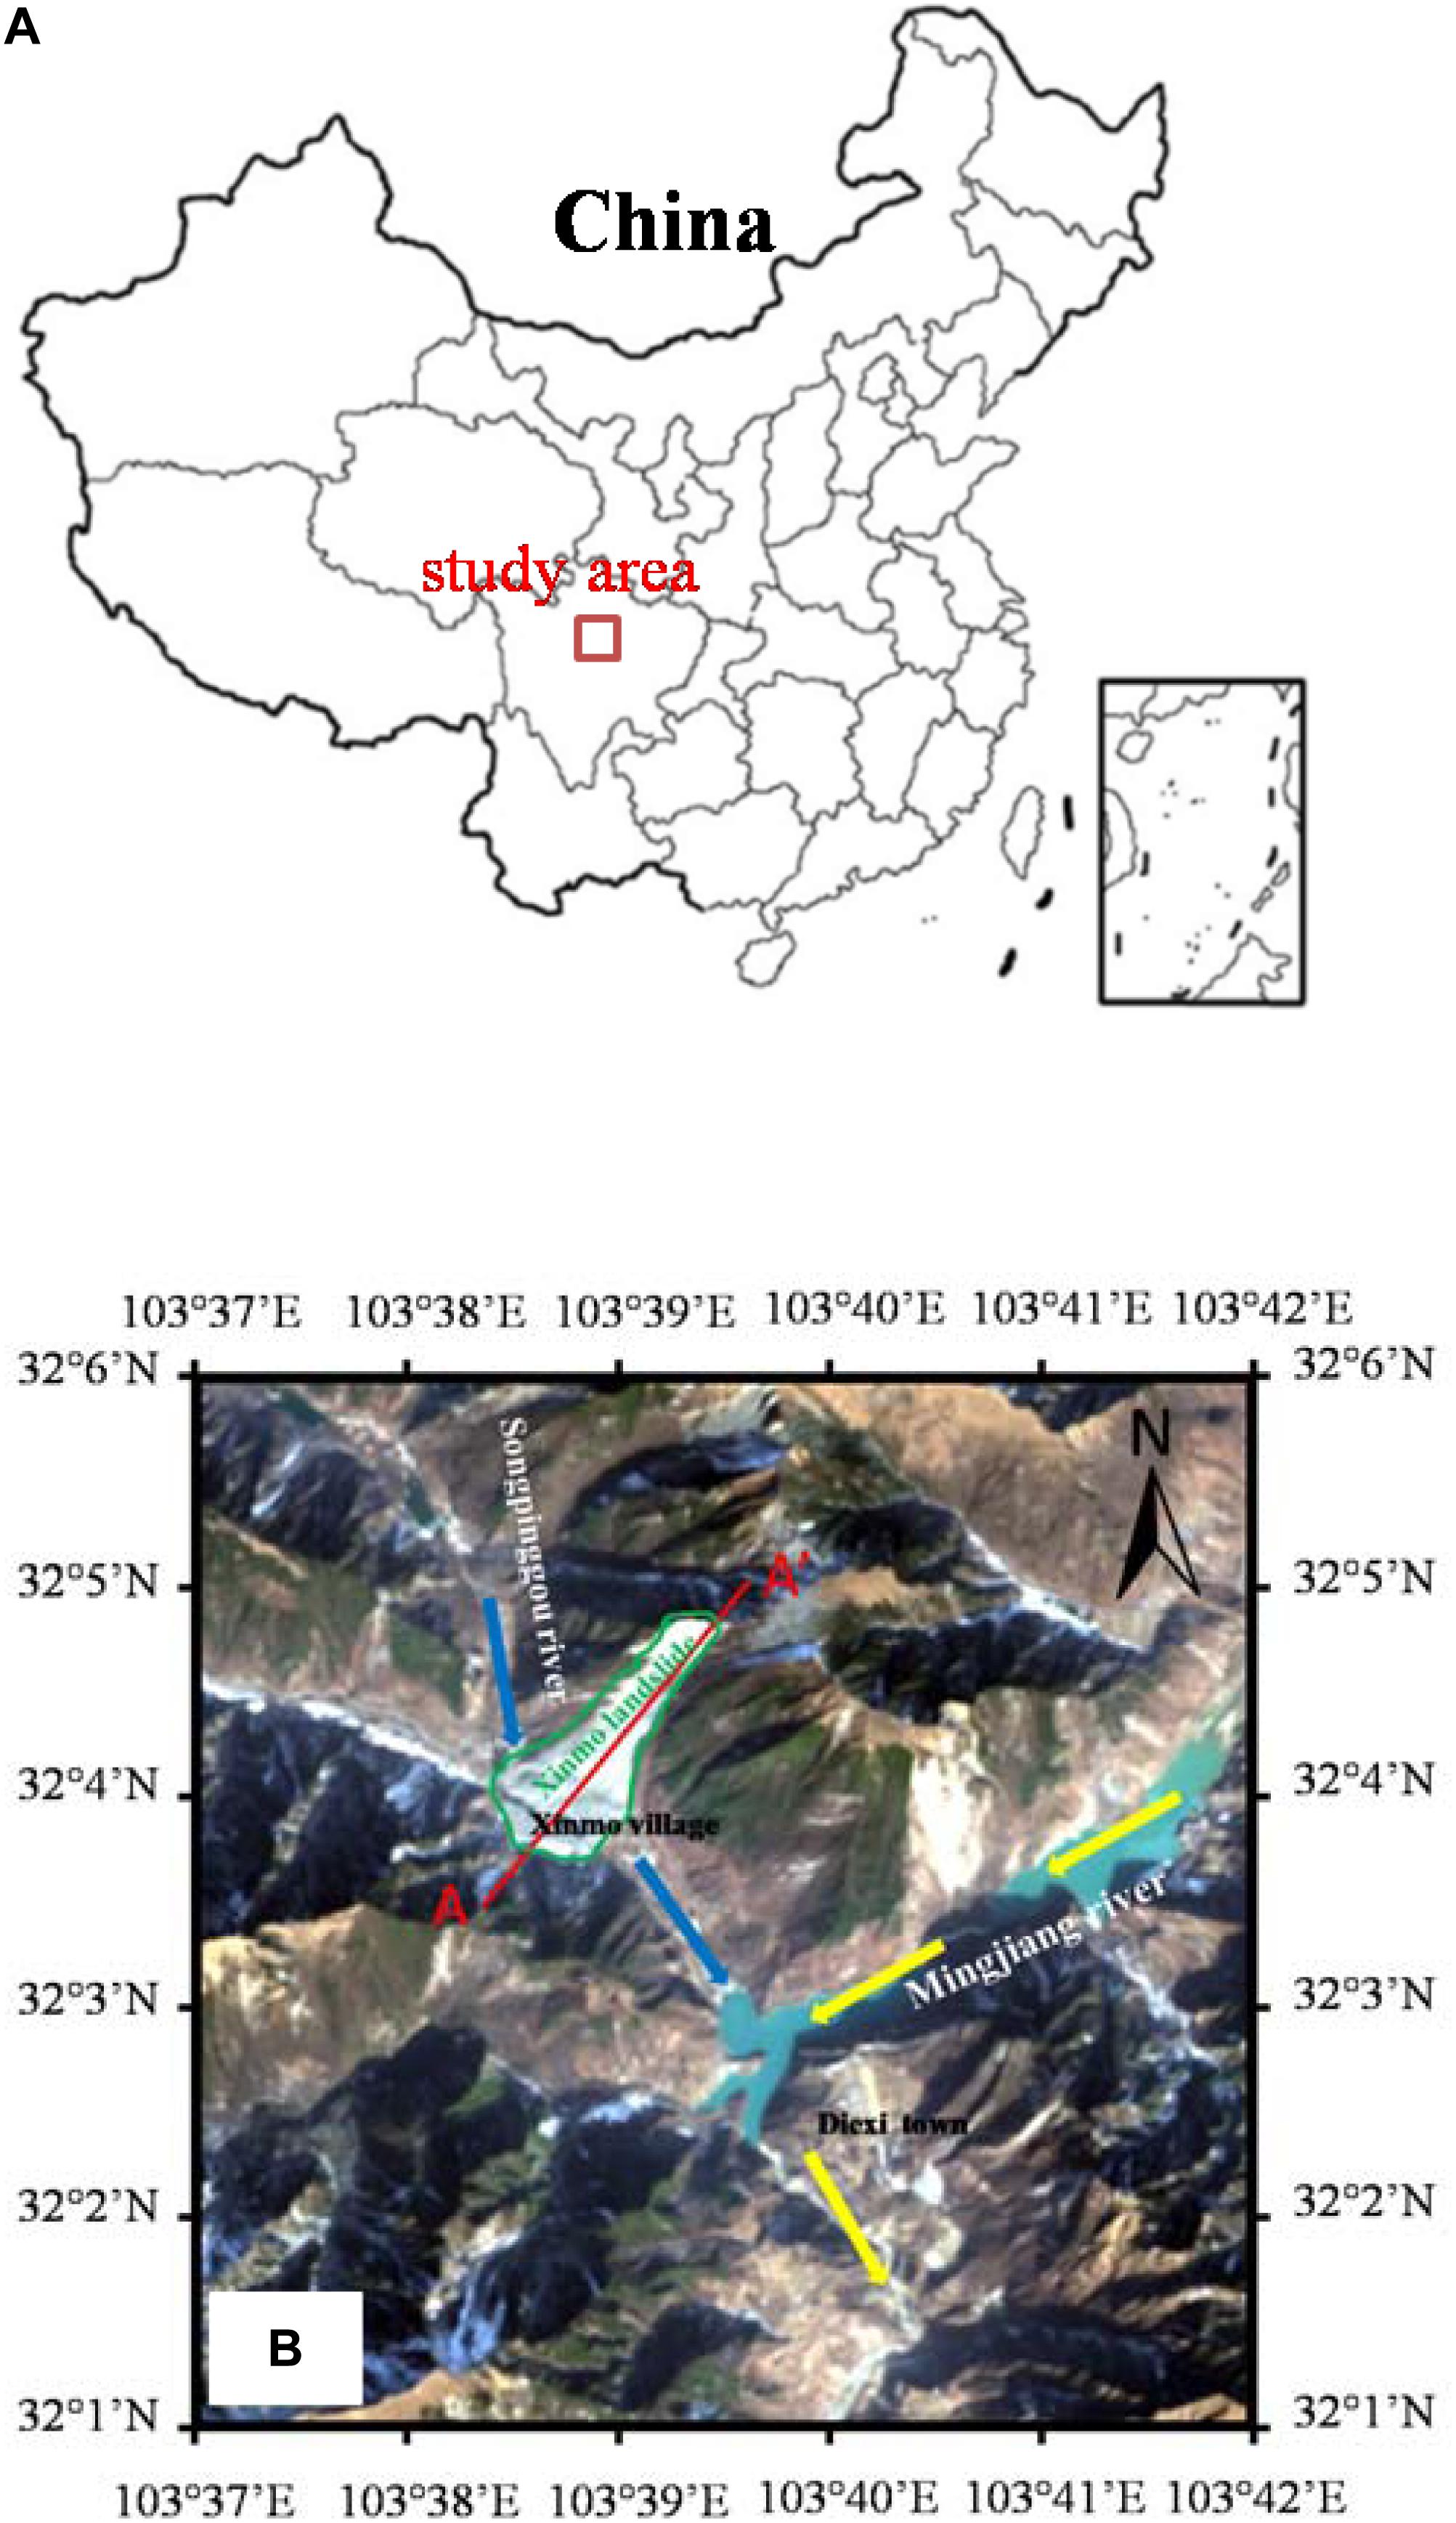
Figure 1. Location of the 2017 Xinmo Landslide: (A) map of China and regional location of the study area. The small inset box in the lower right corner of the map of China is the South China Sea. (B) Landsat-8 image of the study area acquired on Jan. 19, 2018.
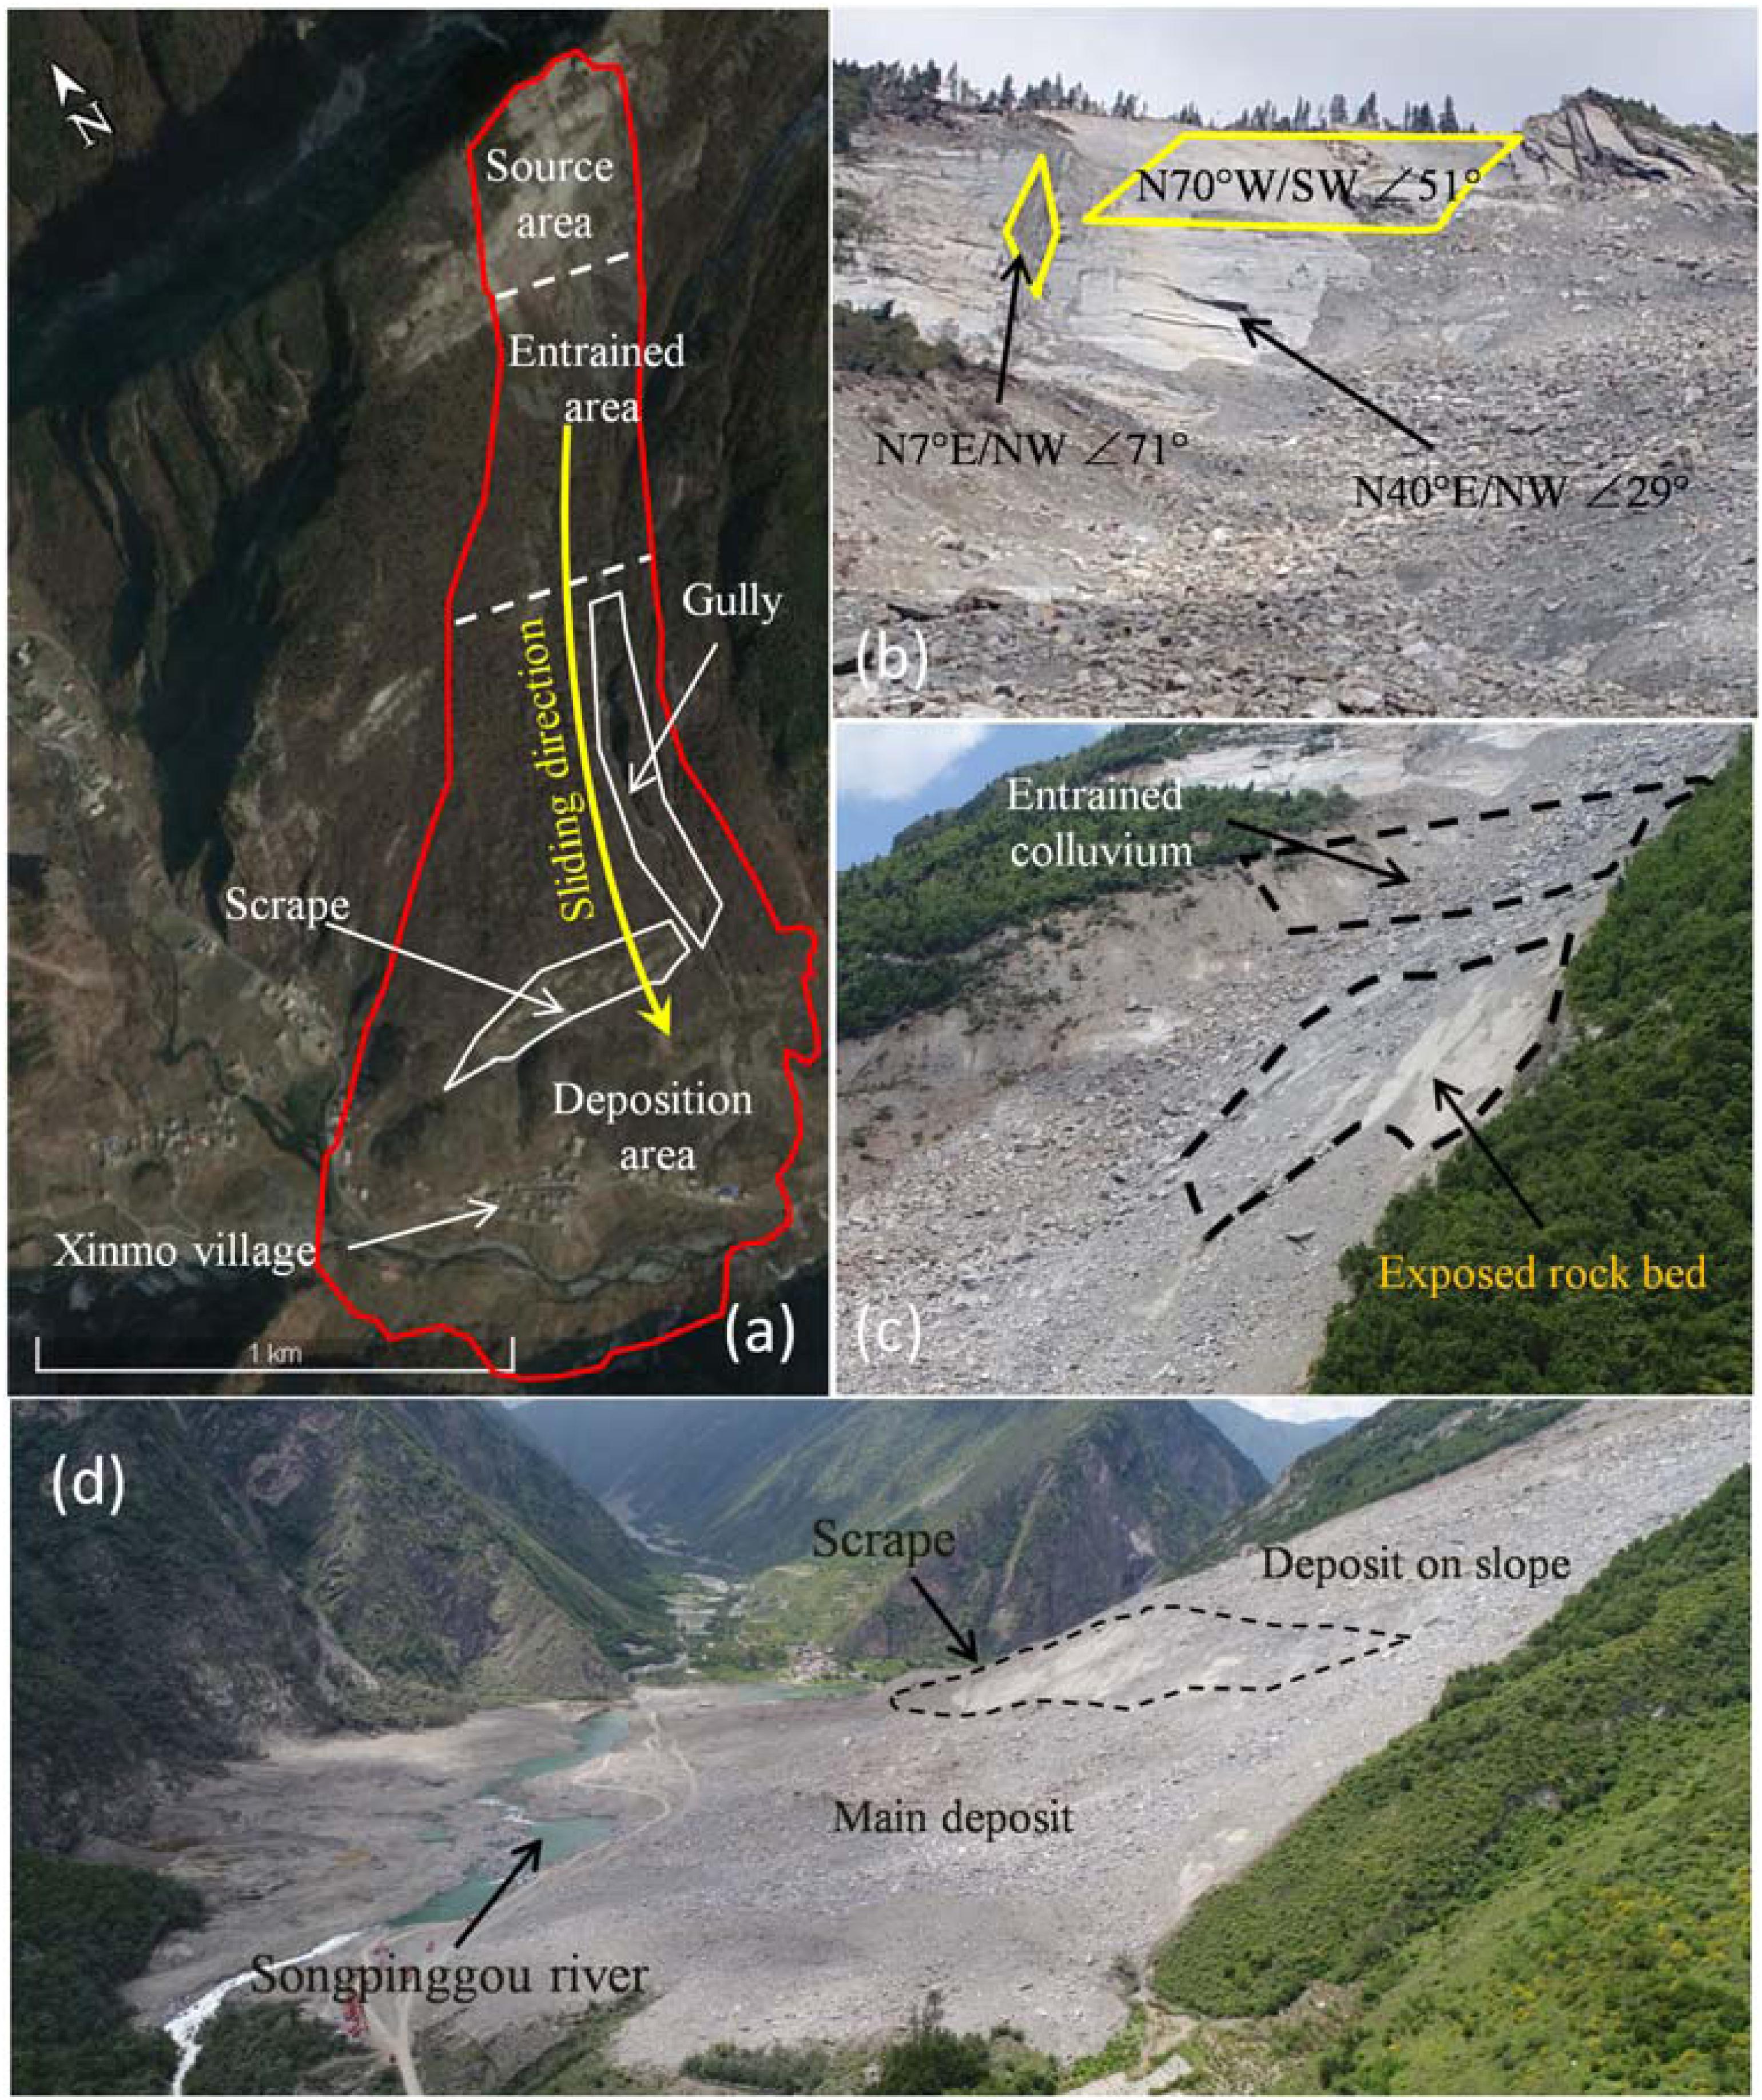
Figure 2. Photos of the Xinmo Landslide before and after failure: (a) Pre-failure satellite image from Google earth on Jan. 9, 2016; (b) three sets of discontinuous (N70°W/SW∠51°, N7°E/NW∠71° and N40°E/NW∠29°) in the source area after failure taken on Oct 4, 2017; (c) scraped colluvium indicated by a schematic cross section and exposed bedrock in the entrained area taken on Jun. 29, 2017; (d) deposit of the Xinmo Landslide viewed from downstream taken on Jun. 29, 2017. Comparing (a) and (d), the scrape at the foothill appears to be intact before and after the Xinmo landslide.
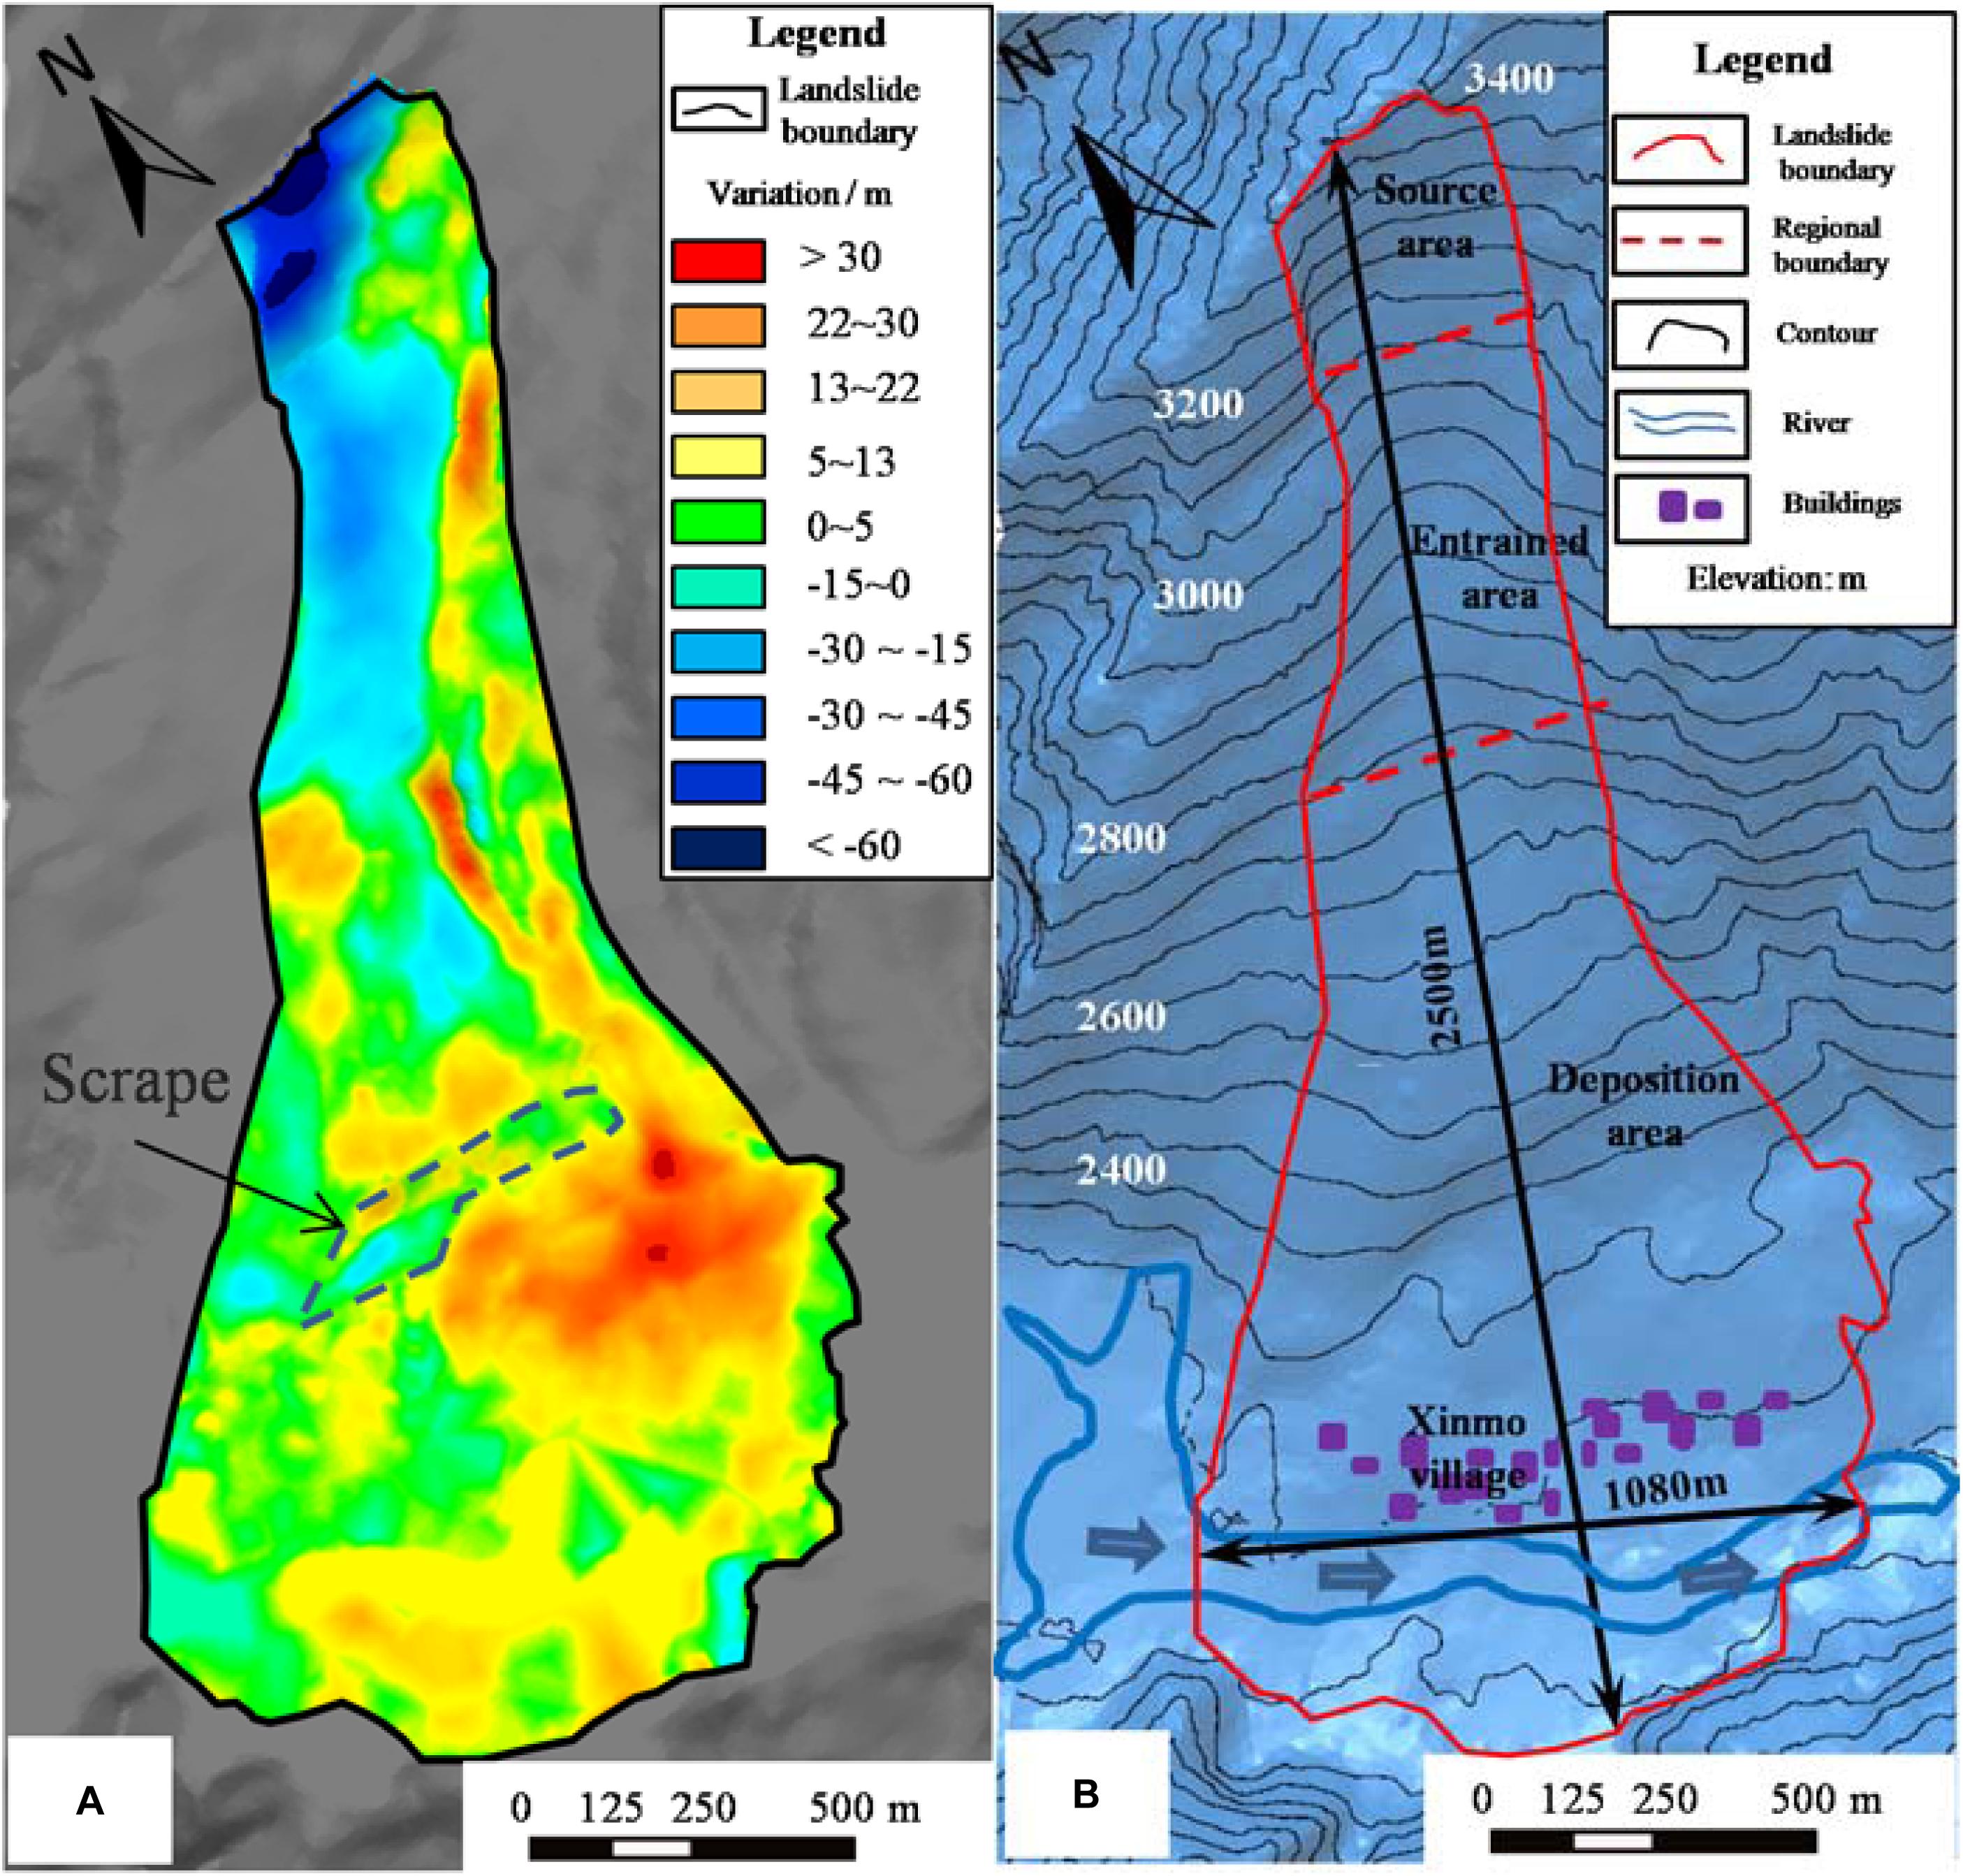
Figure 3. Terrain conditions of the Xinmo catastrophic landslides: (A) elevation variation map of the Xinmo Landslide. Positive values indicate the thickness of deposit and negative values indicate reduction of surface elevation due source rock mass failure and entrainment of path materials. (B) digital elevation model of the Xinmo catastrophic landslide after sliding.
Based on the elevation variation by comparing pre- and post-failure DEM of the Xinmo Landslide, the slide range was divided into three areas (Figure 3A):
(1) Source area: The slip source area is located at the ridge of the Fugui Mountain on the left bank of Songpinggou River, a first-order tributary of the Minjiang River (Figure 1B). The elevation of the rear edge of the slip body is 3460 m a.s.l, the elevation of the shear opening location is about 3100 m a.s.l., and the average slope of the slip surface is about 47°. The length and width of the collapsed rock mass are about 260 and 370 m, respectively, with a maximum thickness of about 66 m. Due to the different accuracies and sources of the pre-failure terrain data, several organizations and researchers had carried out volume estimations of the source mass, and the volume range of the landslide source mass is between 3.0 × 10⁶ m3 and 6.3 × 10⁶ m3 (Dai et al., 2019). The outcropping strata in this area is part of the Middle Triassic Zagunao Formation (T2z), mainly consisting of metamorphic sandstone intercalated with slate (Figure 4). The occurrence of the beddings is N70°W/SW∠51°, which formed the bottom boundary of the sliding surface (Figure 2b). There are two sets of joints developed within the source mass, the occurrence of which are N7°E/NW∠71° and N40°E/NW∠29°, respectively (Fan J. R. et al., 2017). The former constitutes the lateral boundary of the sliding mass.
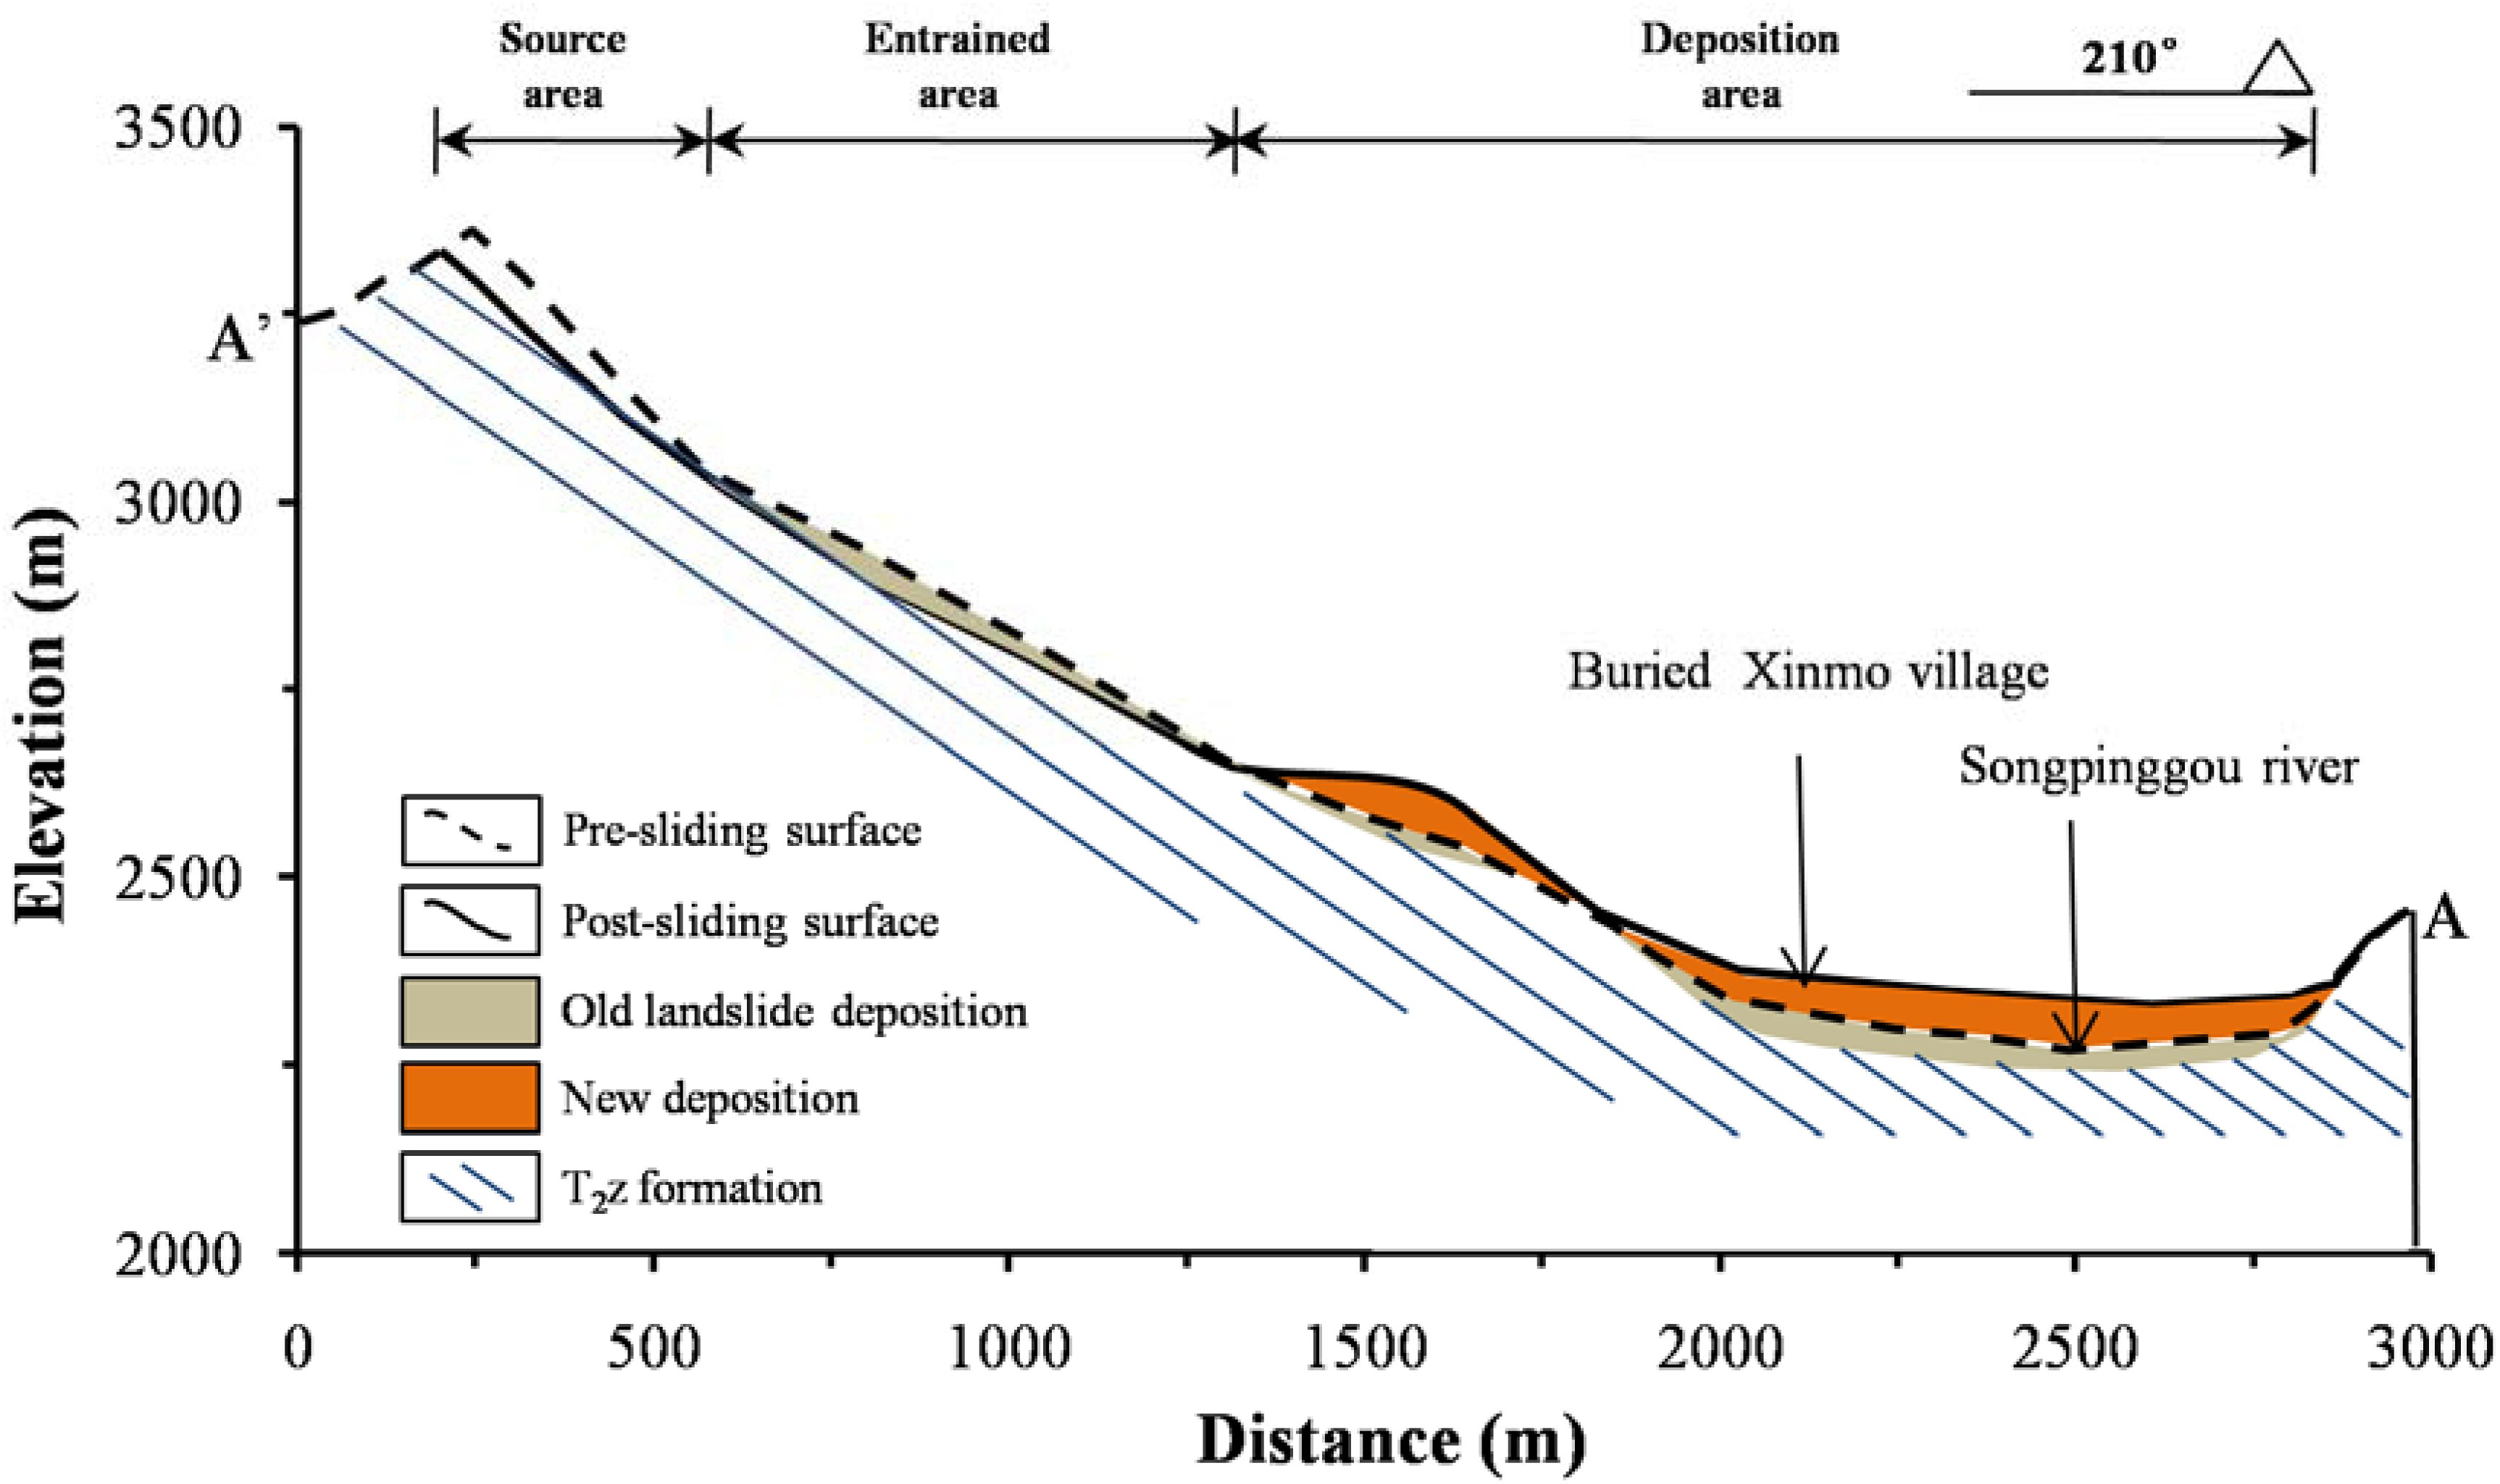
Figure 4. The geological longitudinal profile of the Xinmo landslide along a typical cross section (Section A’-A in Figure 1B).
(2) Entrained area: As shown in Figure 3A, there is an apparent zone of depletion below the source area in which pre-existing loose colluvium of previous landslides induced by the Diexi Earthquake in 1933 were entrained and pushed by the sliding mass. The bedrock under the colluvium was exposed by strong entrainment and then covered again by the new landslide deposit (Figure 2c). The outcrop of bedrock at the slope’s toe is still intact under the impact and erosion by flowing mass (Figure 3A shows there is no elevation difference before and after the landslide in the scrape area) and therefore entrainment of bedrock could be negligible. Entrainment of saturated colluvium by rock avalanche could change it to a debris flow and increase its volume and mobility. However, there is no liquefaction deposit observed according to field investigations, although there was two weeks rainfall prior to sliding (Huang et al., 2019). Hence, we deduce that the colluvium was in low water content during this event. The span of this area is 2,650–3,100 m a.s.l and the length and width are about 700 and 410 m, respectively. Considering about 7 × 10⁵ m3 new landslide deposits formed during this time, the net maximum scraper depth is about 30 m (Xu et al., 2017).
(3) Deposition area: The Deposition area is located below the elevation of 2,650 m a.s.l to the elevation of 2,300 m a.s.l. It is a fan-shaped accumulation, with a length of 1,600 m along the sliding direction and a maximum width of 1,080 m along the Songpinggou River. By comparing the terrain elevation changes before and after the landslide, the average accumulation thickness of the landslide is more than 10 m, and the maximum accumulation thickness is about 31 m. The final deposition volume is estimated between 6.4 × 10⁶ m3 and 13.81 × 10⁶ m3 (Dai et al., 2019). Due to the pre-existing terrain topography, the movement direction of the sliding mass moved eastward along a gully with NE strike (Figure 2a), resulting in the overall distribution of the deposition depth showing high in the East and low in the West (Figure 3A). The deposit can be divided into two parts by the scrape: the deposit on the slope and the deposit at the slope toe (Figures 2d, 3A). Most of the deposit is located on the left riverbank, except for a small part that crosses the Songpinggou River.
Method and Model
Numerical Method
The commercial three-dimensional distinct element code (3DEC) program, which has the capability to solve the problem of discontinuous deformation and failure of rock mass, is employed to simulate the run-out of the Xinmo Landslide. In 3DEC, the rock mass is simplified as a set of polyhedron blocks connected by specific contact models and the block could be deformable through meshing into finite-difference tetrahedral elements internally. The motion of each block is calculated by Newton’s second law, the stress and strain of the block is solved by finite difference method, and the contact force between blocks is determined by the force-displacement law (Hart et al., 1988). The equilibrium of the block system is solved by repeat iteration calculation; Figure 5 shows the calculation cycle in 3DEC.
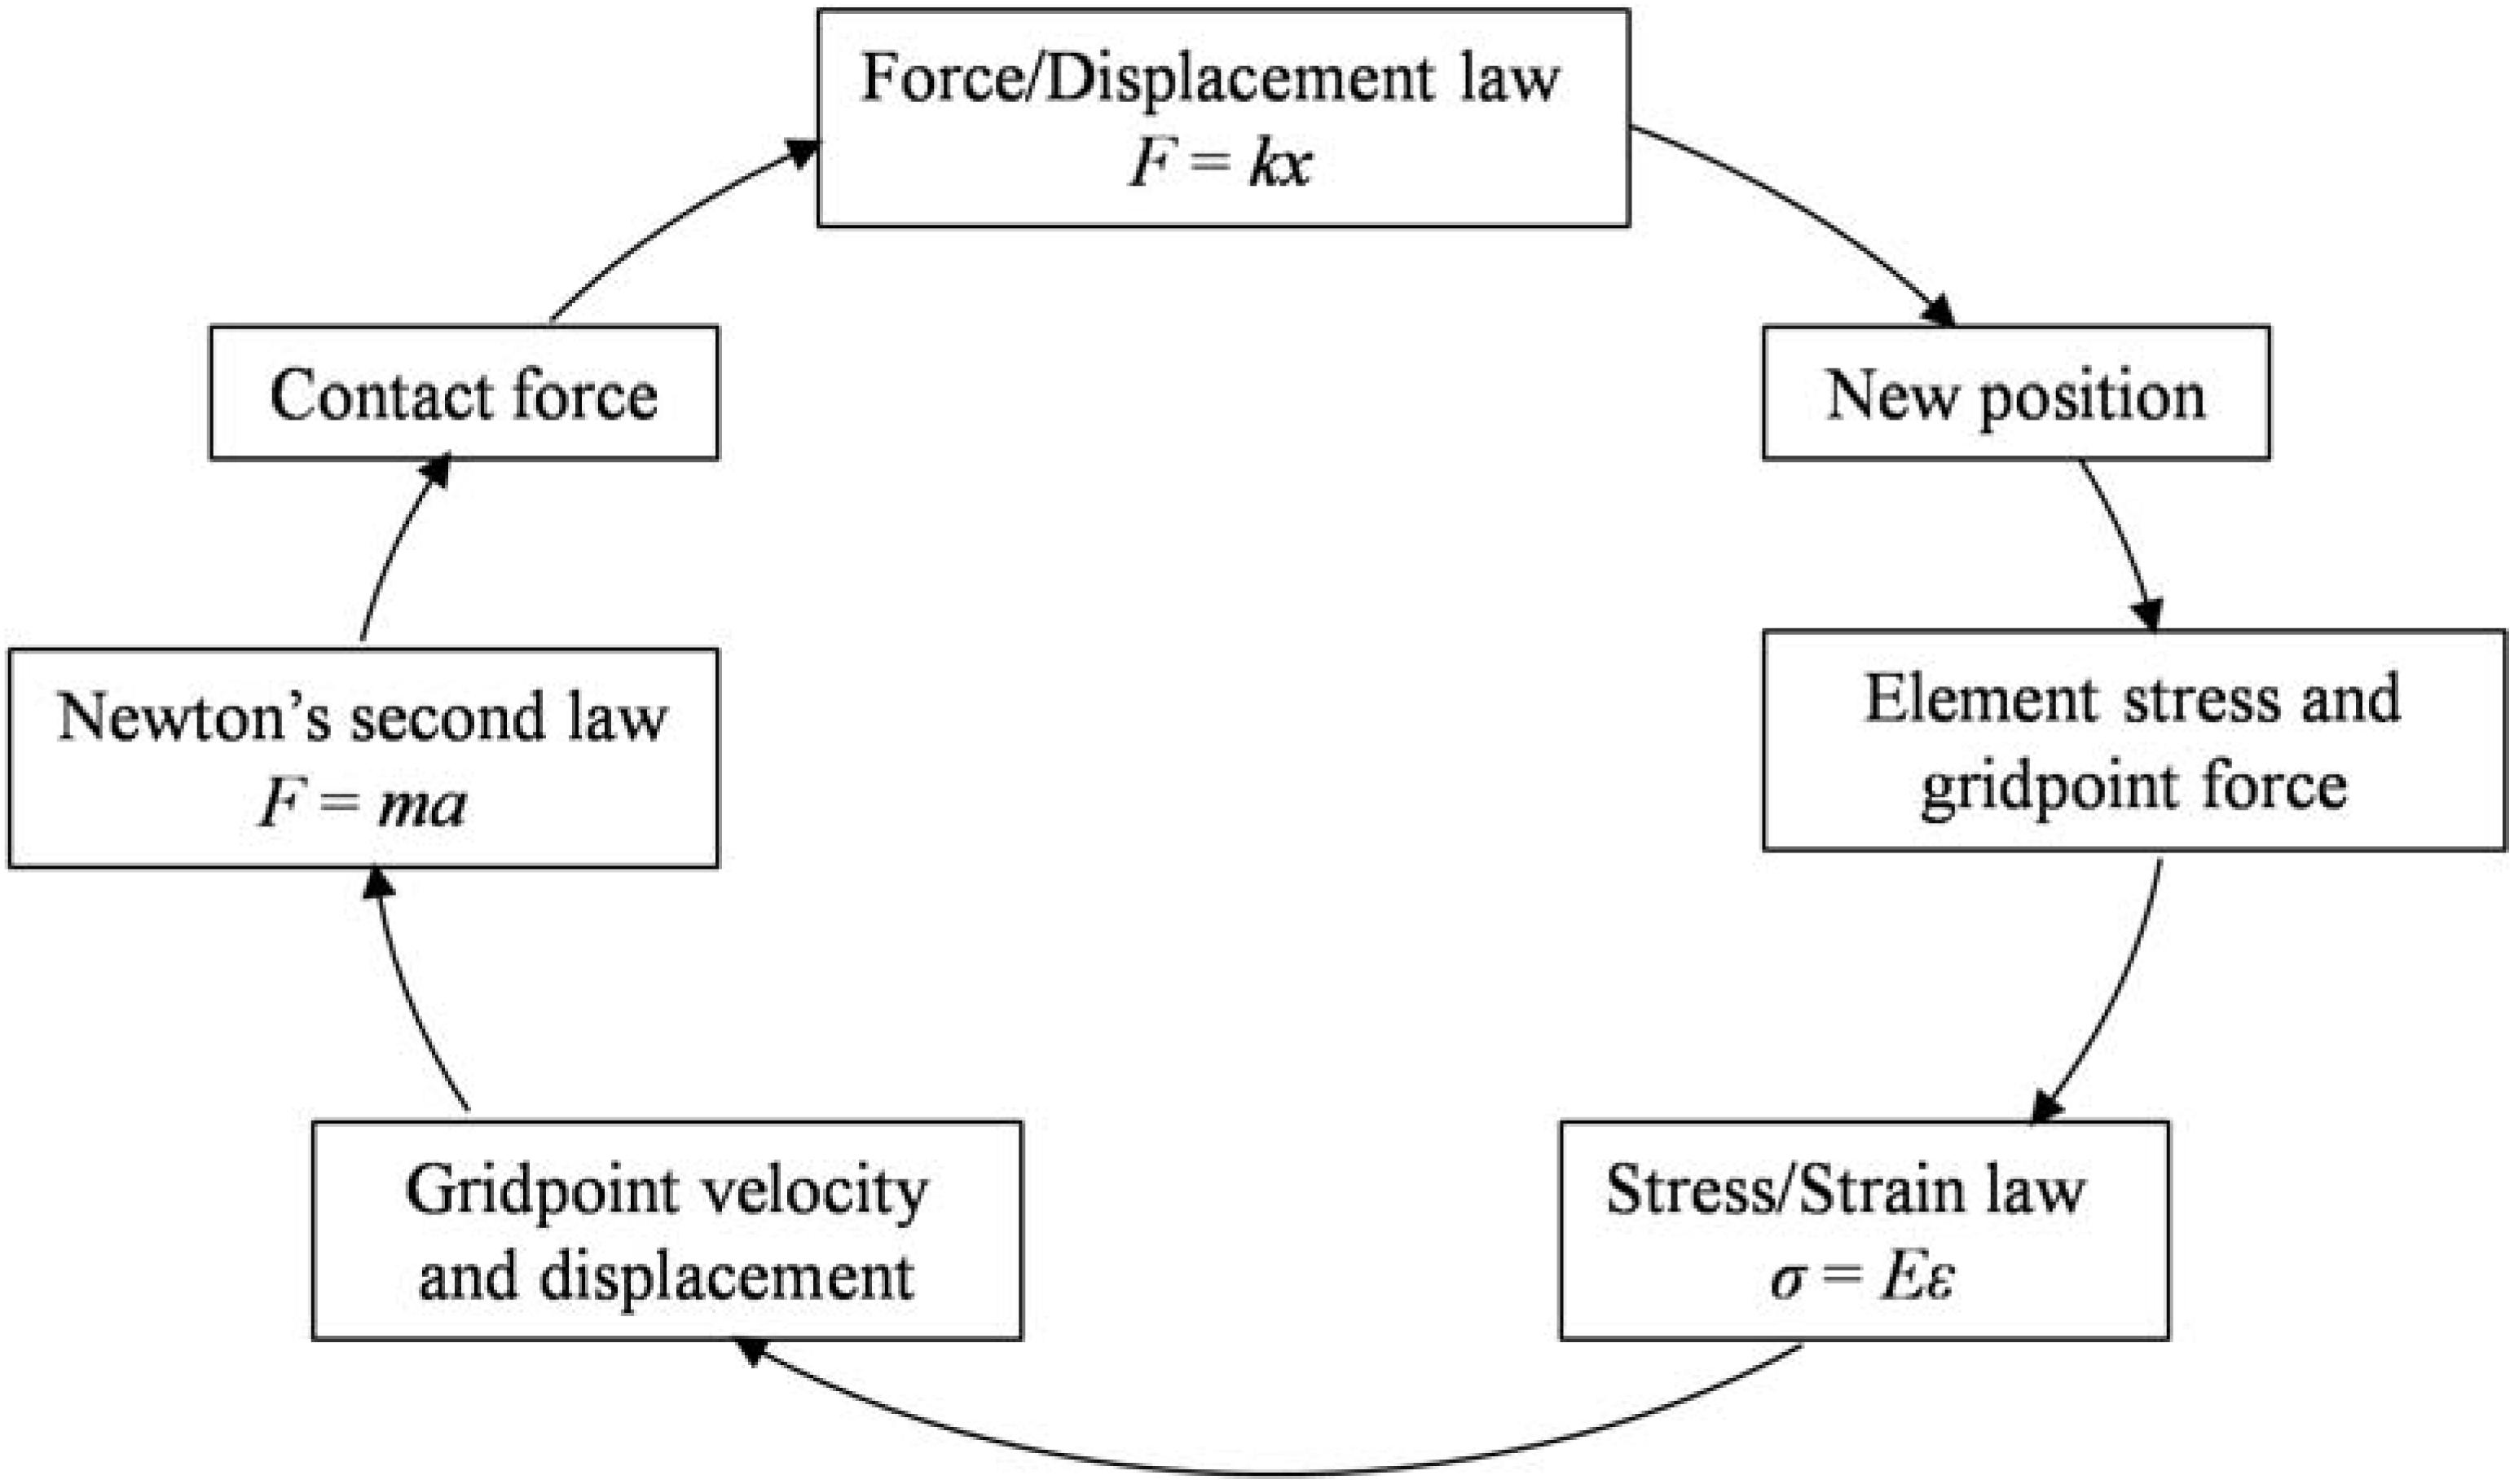
Figure 5. Calculation cycle in the 3DEC (modified after Itasca Consulting Group Inc., 2016).
Numerical Model
According to the division of the slide range mentioned in the second section, the landslide model is also divided into three parts: sliding mass in source area, loose colluvium in the entrained area, and sliding bed. Figure 6 shows the process of 3DEC landslide modeling including the following three steps:
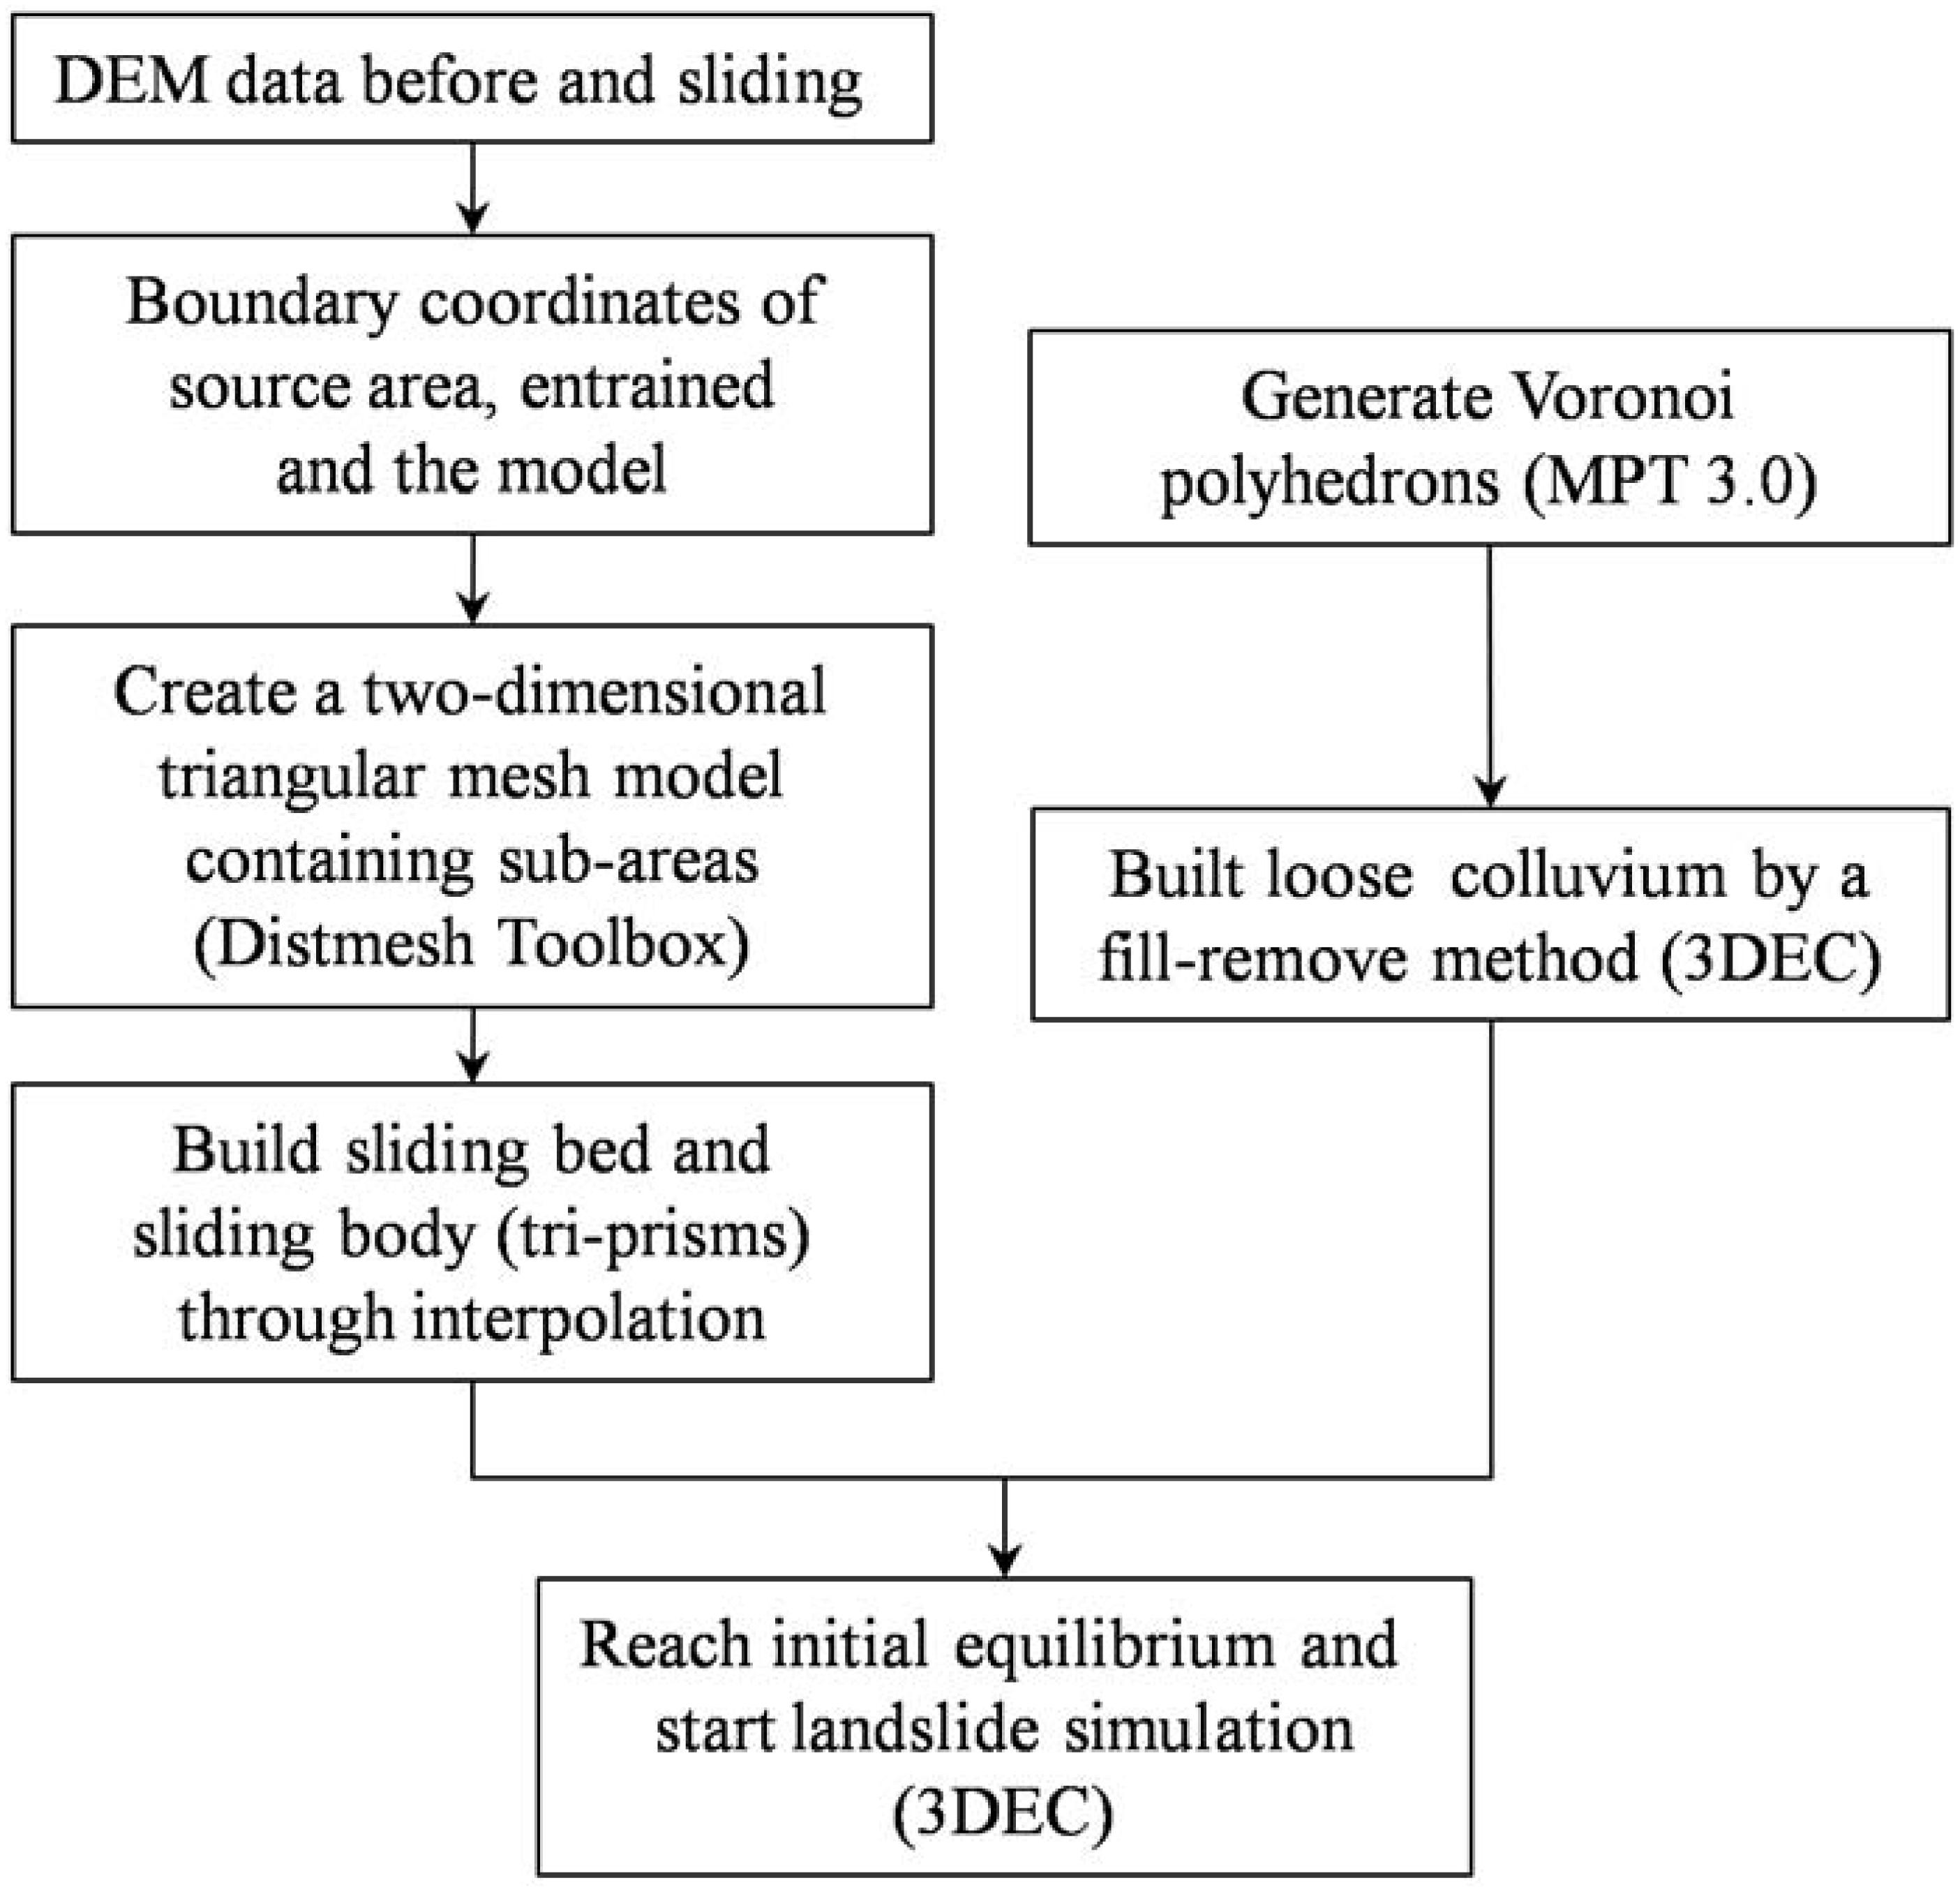
Figure 6. Flowchart of numerical modeling for mass movement of landslides.
(1) The first step is to build a two-dimensional model of the landslide and subdivide it into three areas. Add the boundary points of the source area and the entrained area in a rectangle area of 2910 × 1480 m, and use the Dismesh toolbox (Persson and Strang, 2004) in MATLAB to generate triangle meshes in each region, respectively. A total of 6,317 triangles are generated with an average side length of 40 m, including 159 in the source region, 296 in the entrained region, and 5816 in the outer region (Figure 7).
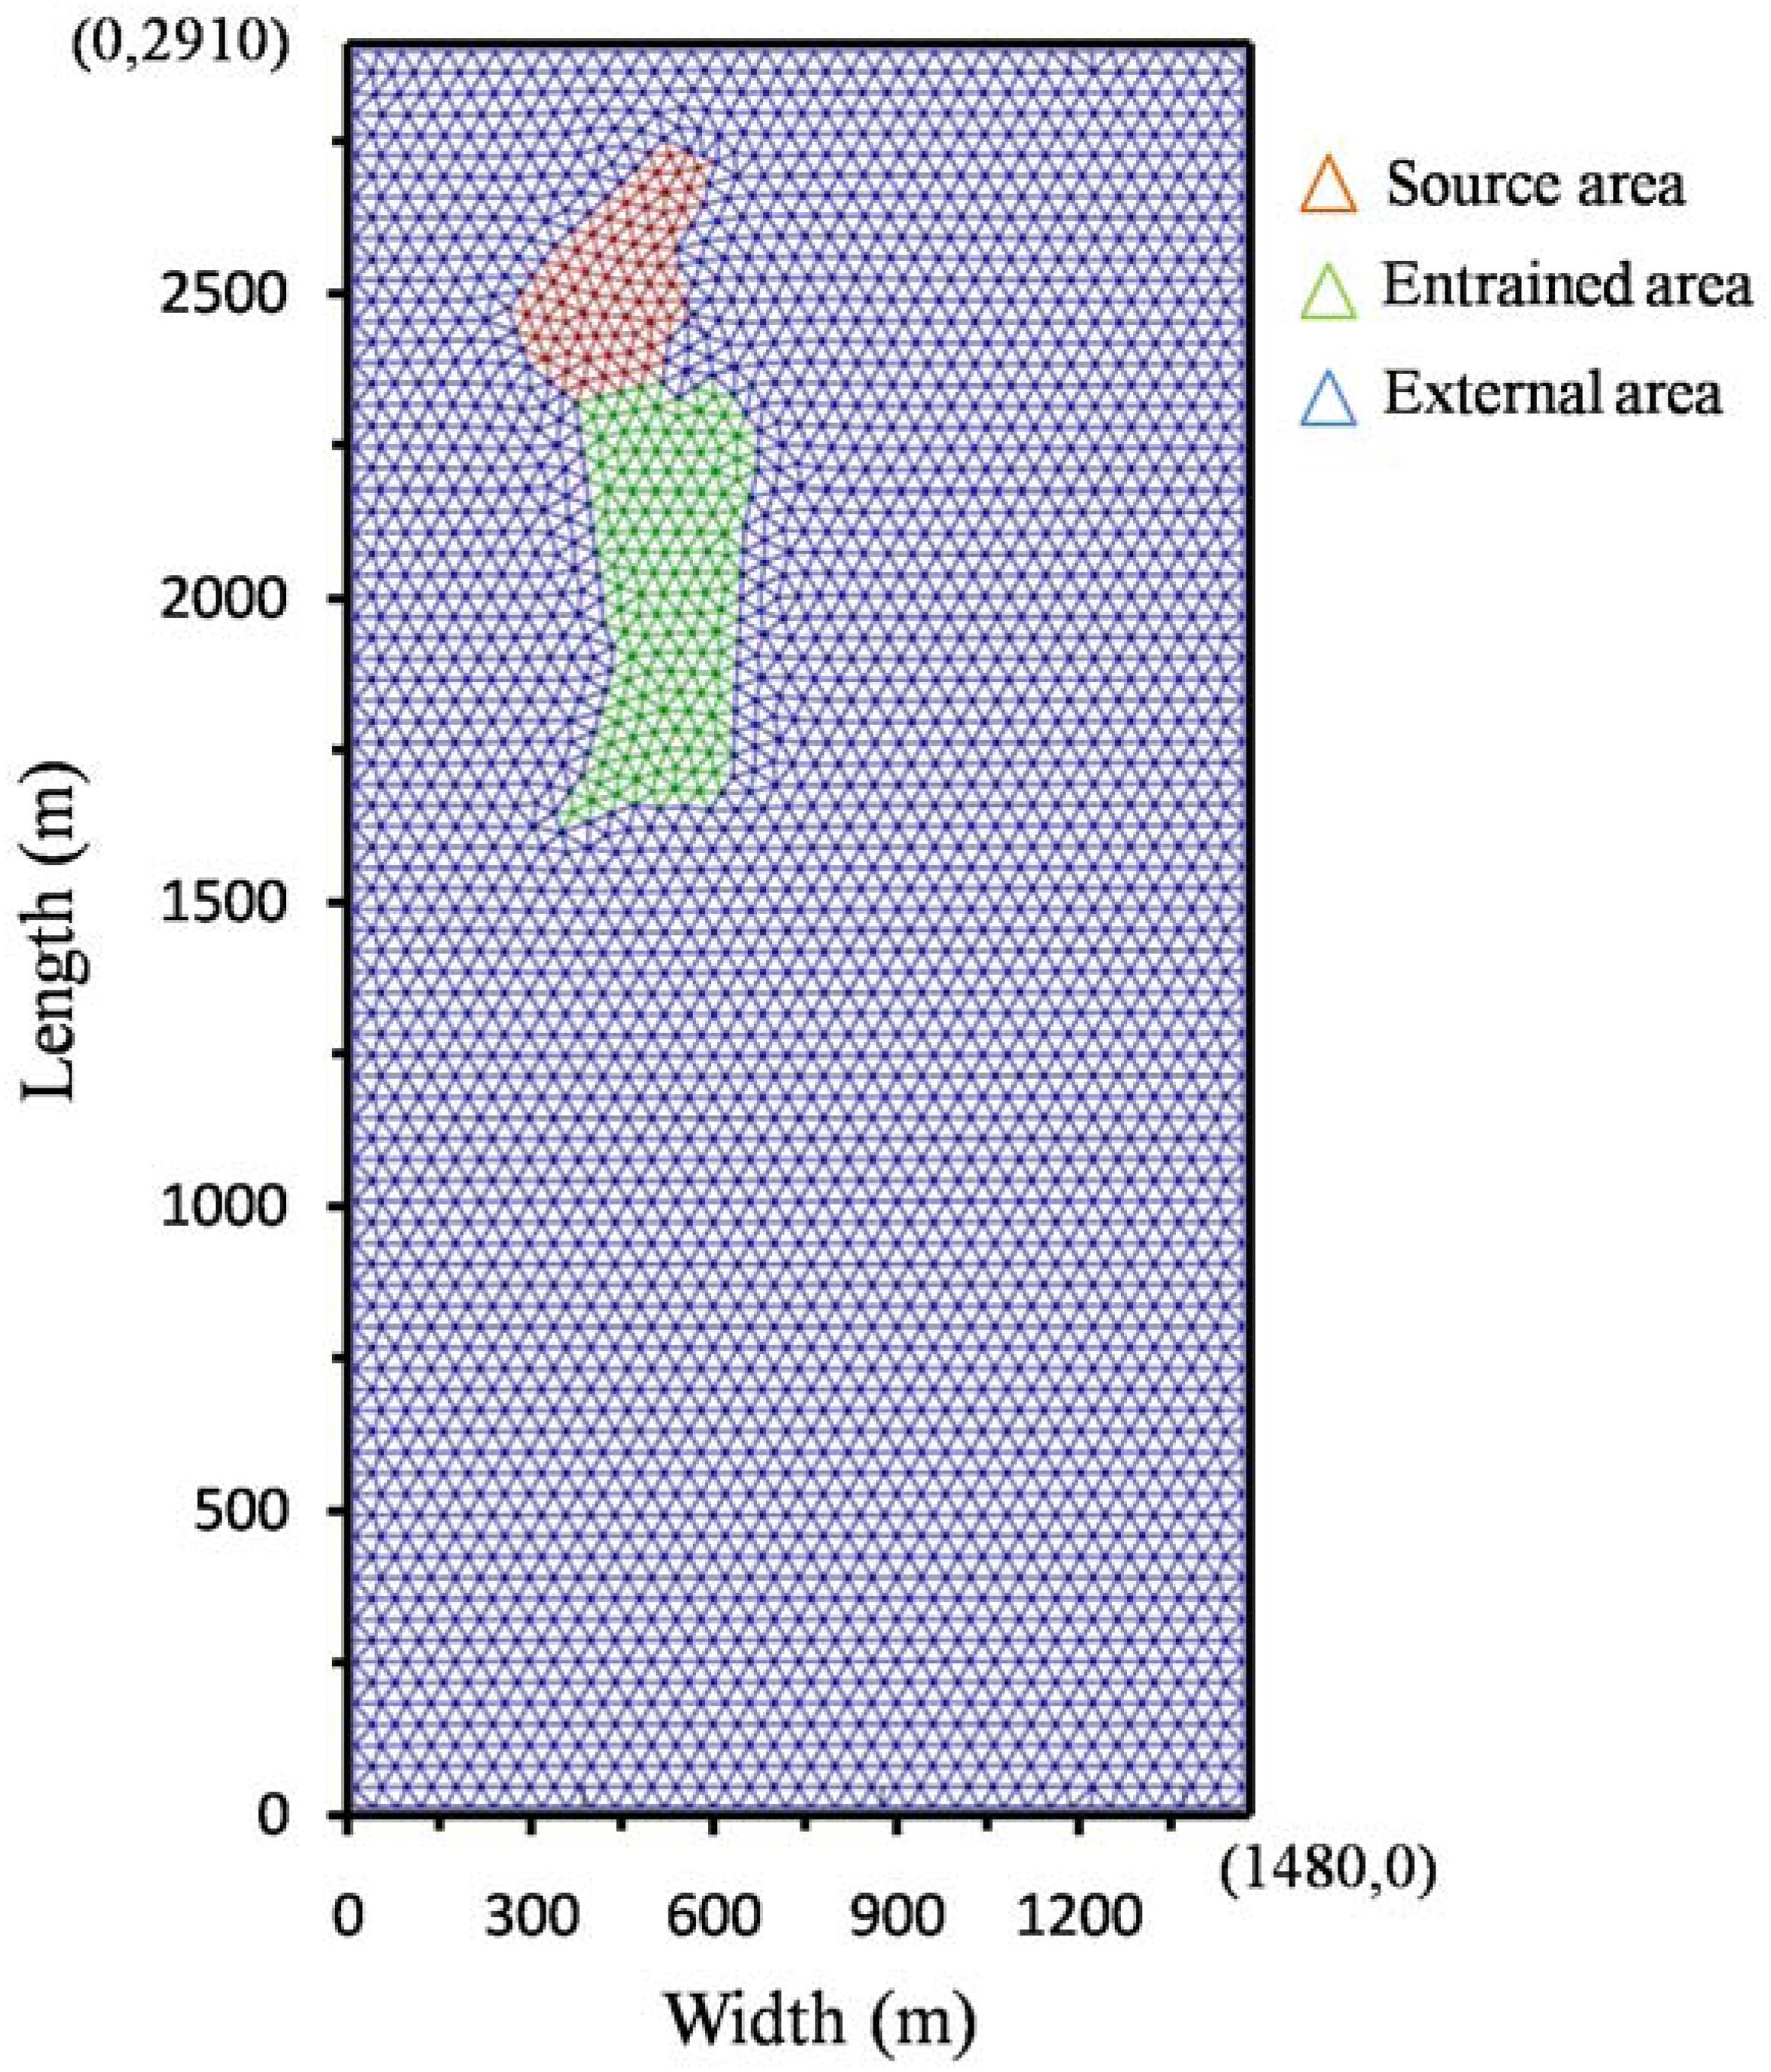
Figure 7. Two-dimensional model of the Xinmo Landslide with three sub areas.
(2) The next step is to build a three-dimensional sliding bed and sliding body model. Taking the sliding bed as an example, two-dimensional triangles in the source area and entrained area are stretched into tri-prisms by two-dimensional linear interpolation based on the coordinates of the surface points after the landslide and using the coordinates of the surface points before the landslide generates the tri-prisms consisting of the outer area. The sliding body could be obtained by the same way. After importing polyhedrons generated in MATLAB into 3DEC according to the syntax rules of 3DEC, three sets of discontinuities mentioned in Section 2 are used to cut the rock mass in the source area with spacing of 20 m. The sliding body volume of about 3.3 × 10⁶ m3 is calculated by adding the volumes of all the tri-prisms in the source area.
(3) In the last step, we use the fill-remove method to generate the entrained colluvium represented by the Voronoi polyhedrons which could be generated through Multi-Parametric Toolbox 3.0 (Herceg et al., 2013) in MATLAB. Only the colluvium above the bedrock was entrained, so a supply-limited condition is applied to construct the 3DEC slope geometry. As shown in Figure 8, a sufficient number of polyhedrons with an average 2.6-meter radius of inscribed sphere are created and placed above the sliding bed of the entrained domain in MATLAB, then translated into 3DEC blocks. Then, those blocks fall into the entrained area under gravity in 3DEC until this domain is filled and static. Finally, blocks outside the domain are removed. Input parameters used in this step are listed in Table 1. The gravity is set perpendicular to the slope surface of the entrained area and a high local damping coefficient is used, aiming to fill the domain quicker and within a shorter computing time. It should be noted that an initial static equilibrium must be satisfied by resetting the gravity vertically before run-out simulating. The inter-block contact friction angle of source mass is set as 51° before its failure and a high local damping coefficient of 0.7 is used to absorb kinetic energy during initial equilibrium of the model. Afterwards, the entrained domain is filled with 7,312 polyhedrons, with a total volume of 3.7 million cubic meters and a porosity of about 0.46.
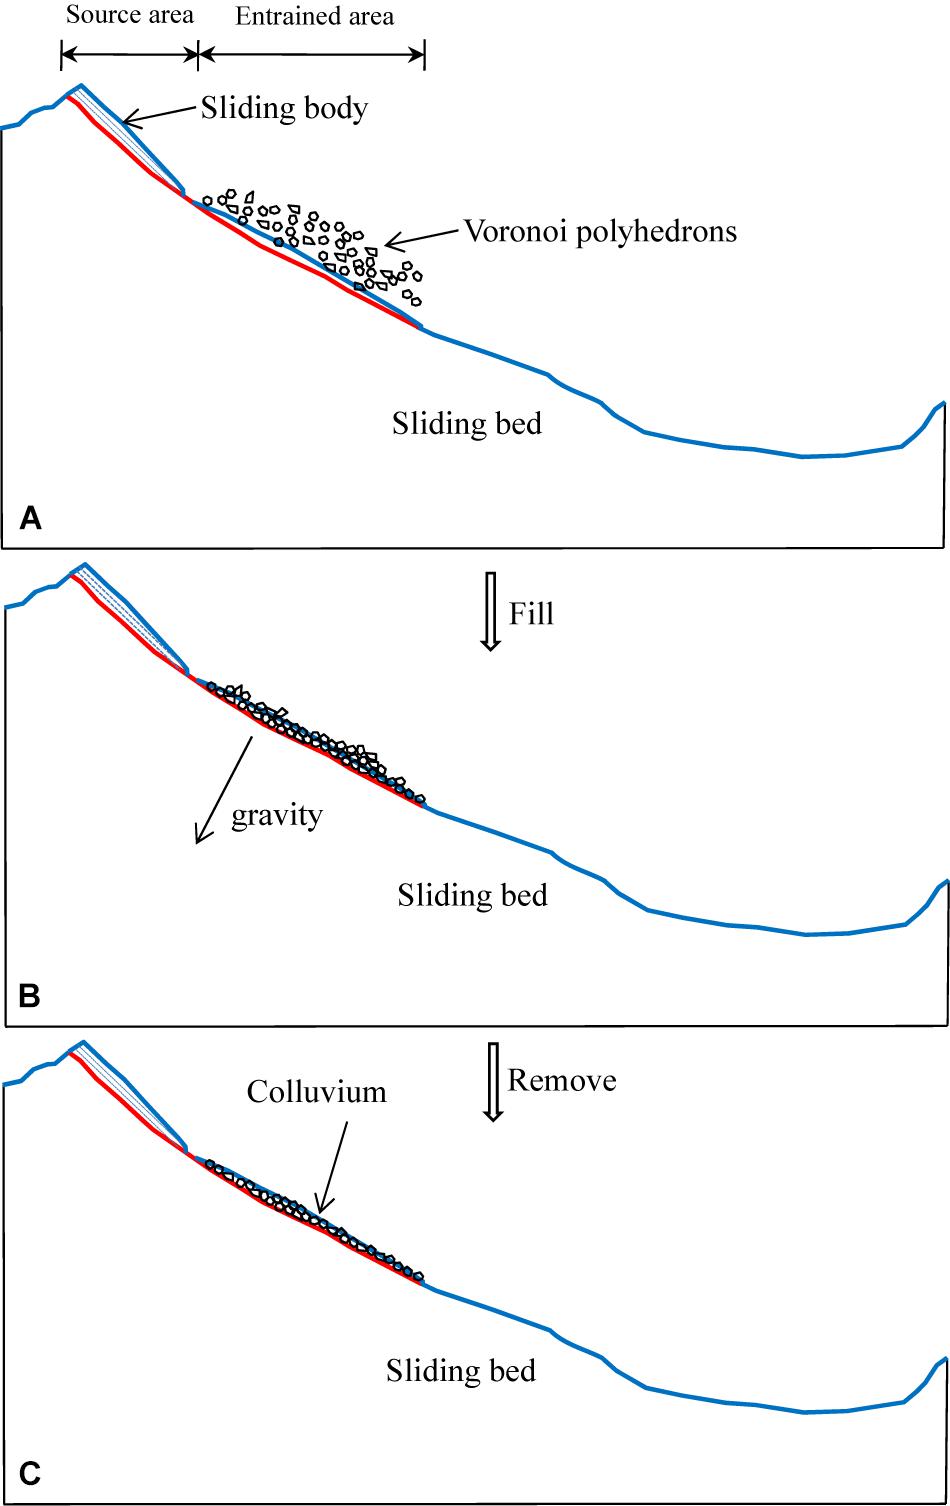
Figure 8. The process of generating colluvium in 3DEC showed in 2D: (A) generate Voronoi polyhedrons enough to fill the entrained area above the slope surface; (B) Voronoi polyhedrons fall into the entrained area under gravity while the sliding bed is fixed; (C) remove blocks above the surface before sliding. The blue lines and red lines represent the slope surface before and after sliding, respectively. The gravity direction is perpendicular to the slope surface of the entrained area.
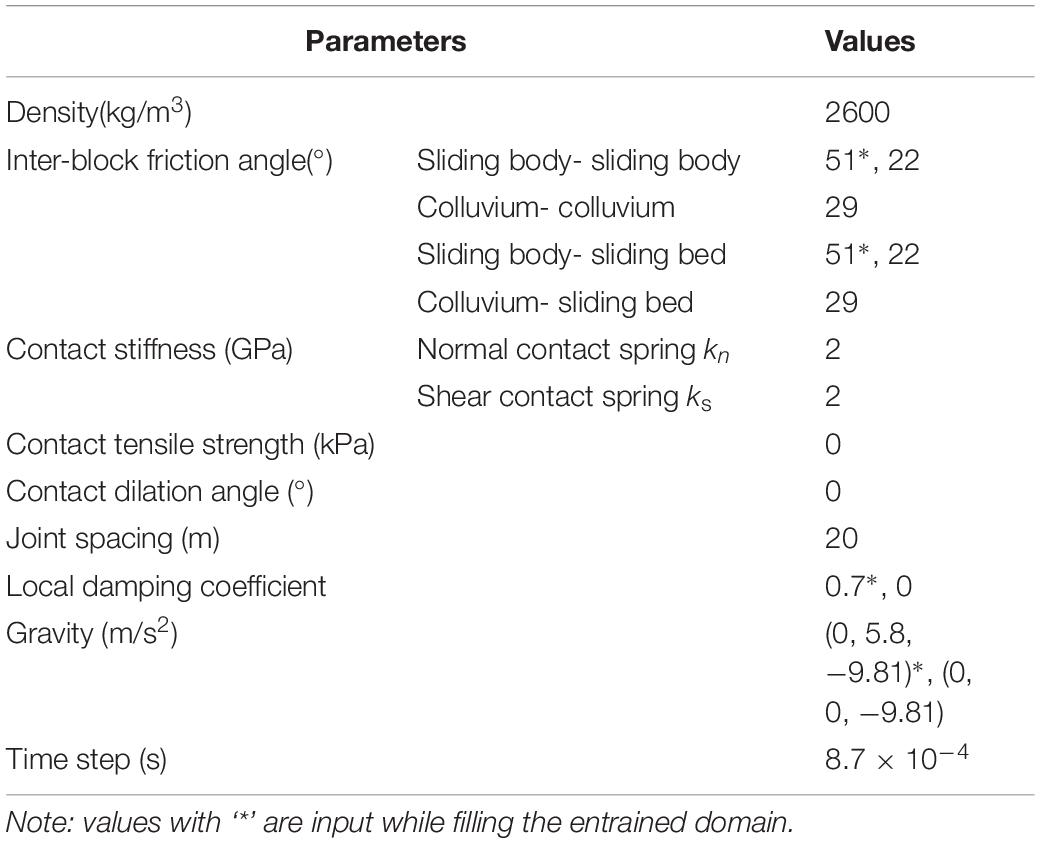
Table 1. Input parameters in 3DEC.
Figure 9 shows the slope geometry of the Xinmo Landslide with a maximum dimension of 2910 × 1480 × 1640 m and a total of 17026 blocks. The failure rock mass in the numerical model consists of two parts, i.e., the rock mass in the source area and the colluvium in the entrained area. Its total volume can be calculated as follows
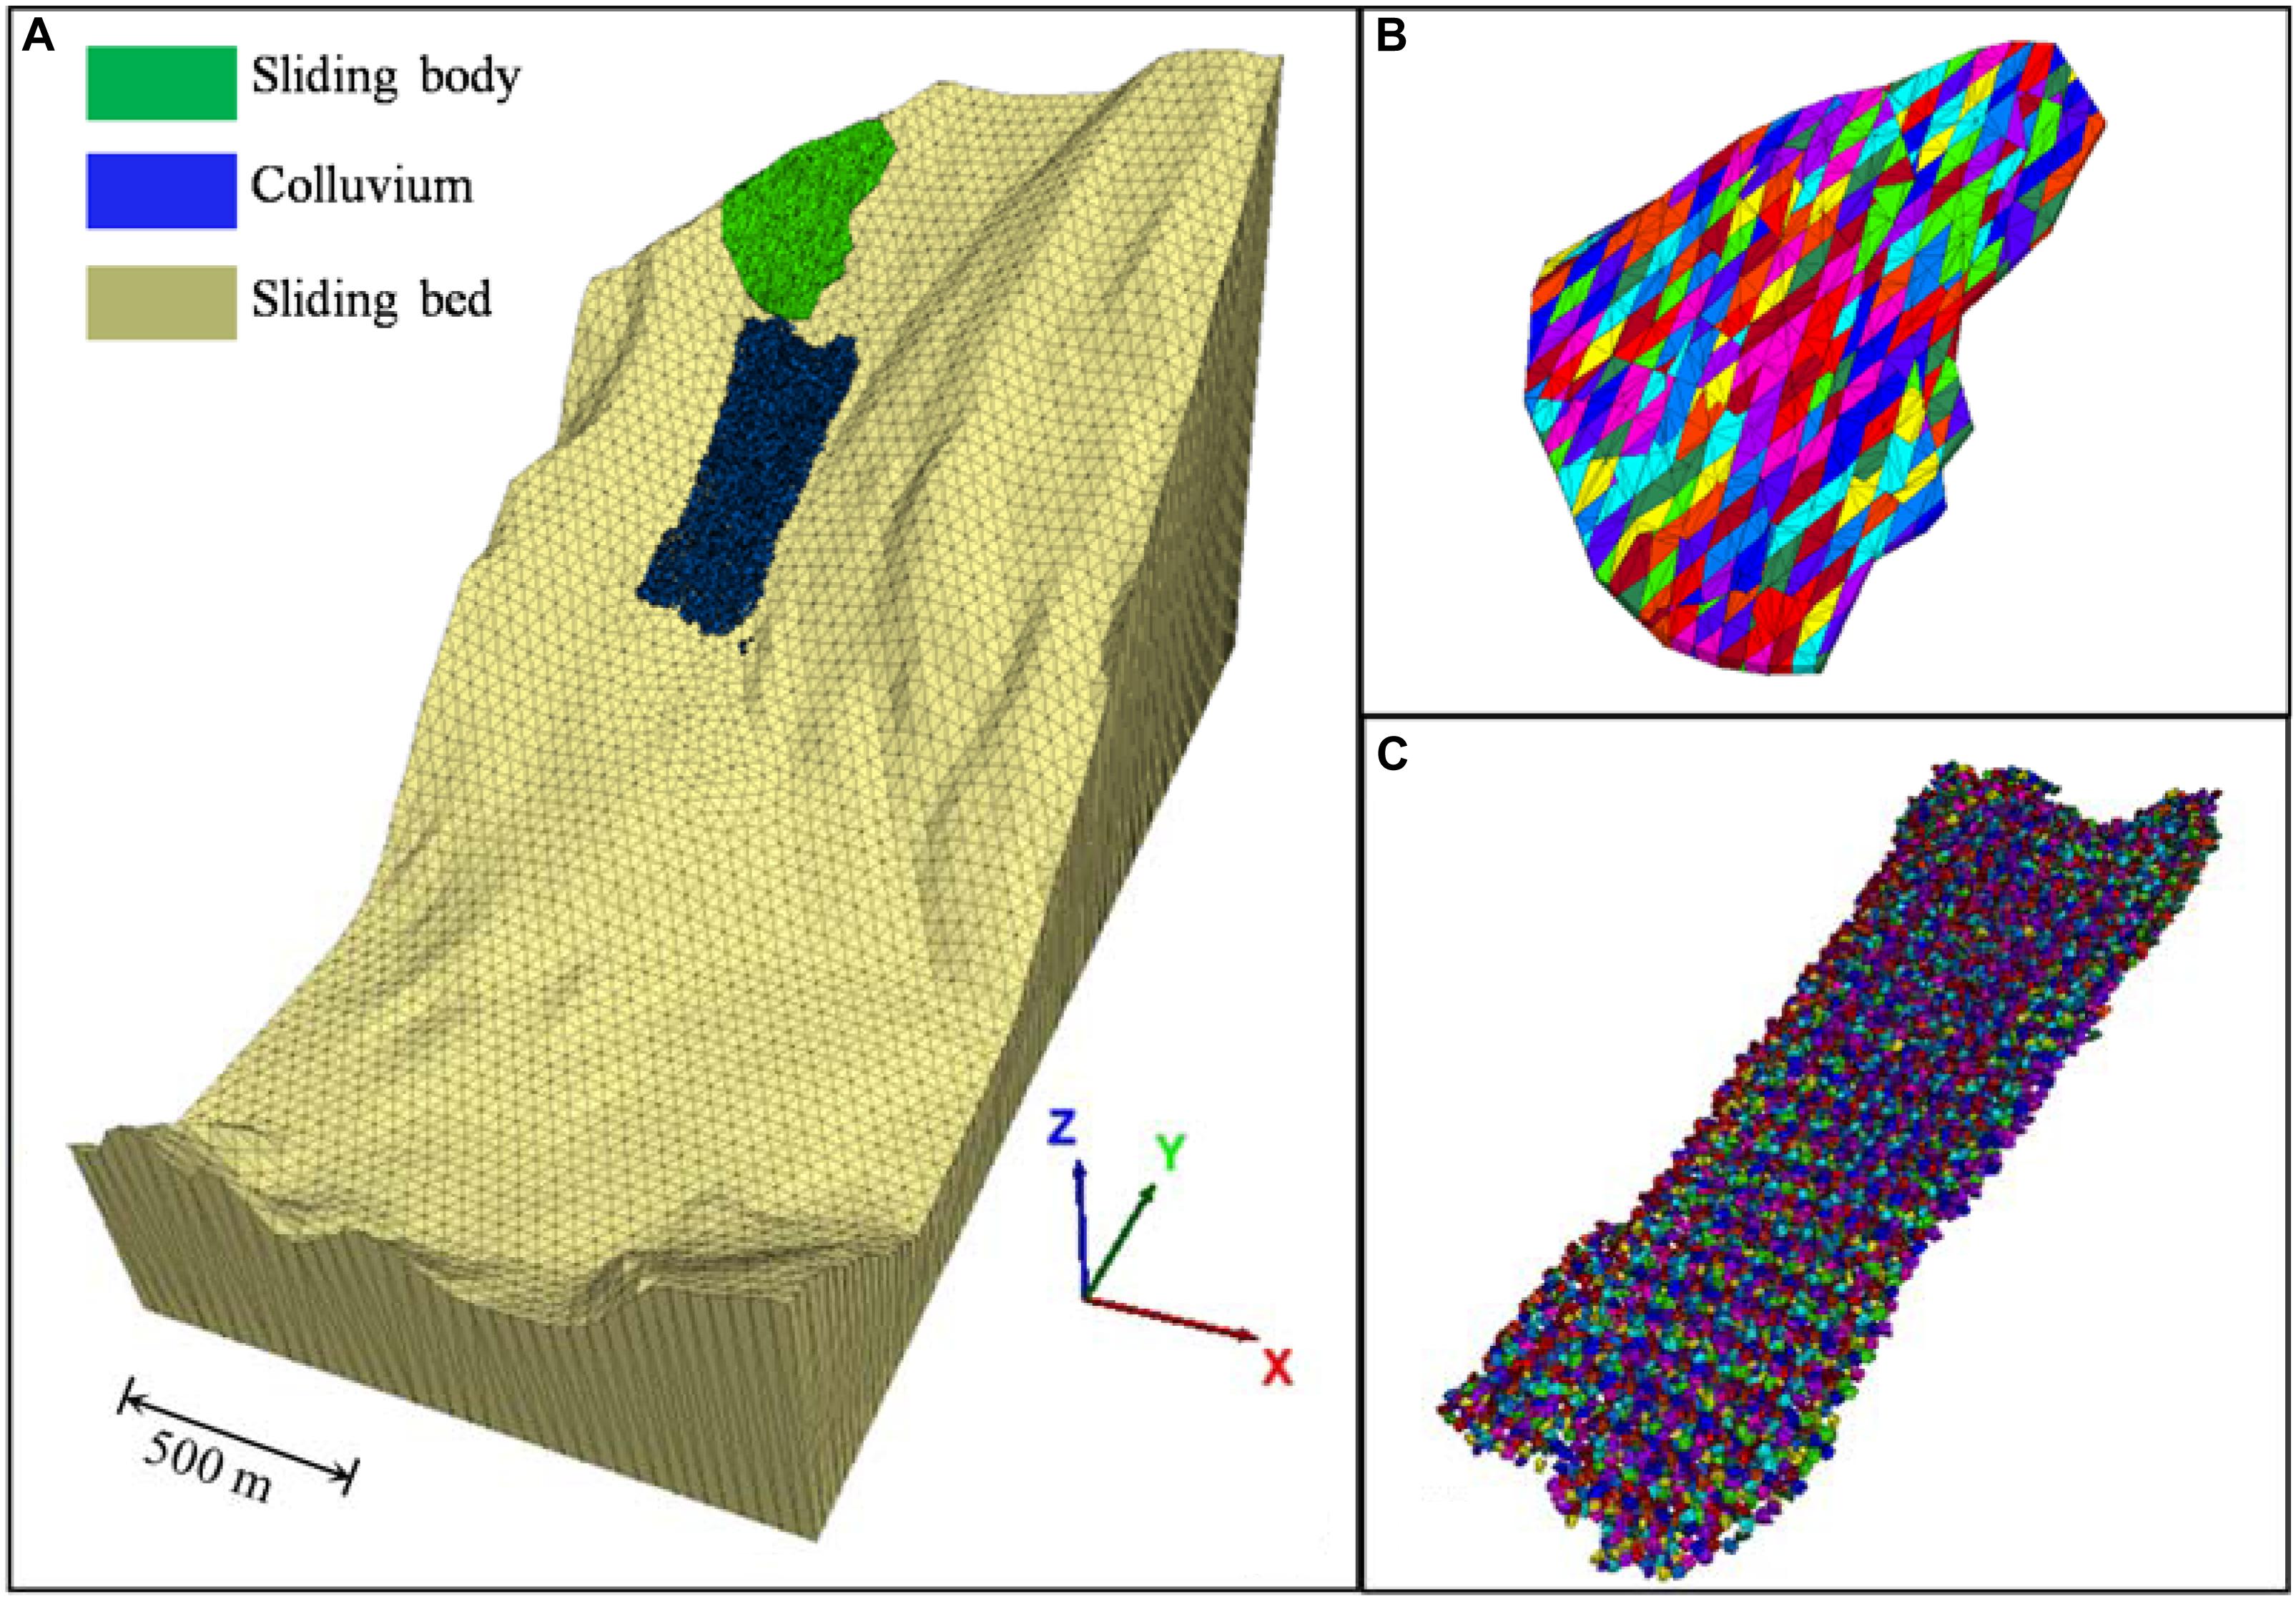
Figure 9. Discrete element model of the Xinmo catastrophic landslide: (A) 3DEC model of the Xinmo Landslide; (B) simulated rock mass in the source area cut by three joint groups with an average space of 20 m and (C) simulated colluvium in entrained area as an assembly of Voronoi polyhedrons.
Vt = VR × (1+FF) + VE (1)
where VR is the volume of the initial rockslide, FF is the fractional amount of volume expansion due to the creation of pore space, and VE is the volume of the entrained material. Considering that the porosity of crushed material ranges from 18 to 35% (Sherard et al., 1963), the total volume of deposition is estimated to be 7.6 × 10⁶ to 8.16 × 10⁶ m3.
Determination of Parameters
In this simulation, all blocks are assumed to be rigid with the same density of 2,600 kg/m3, and the Coulomb-slip joint model (Itasca Consulting Group Inc., 2016) is applied to contacts. Table 1 lists the mechanical parameters of contacts used for numerical analysis. Joints in the source area are assumed to be in the residual state because block deformation were obtained before the slope failure (Dong et al., 2018; Intrieri et al., 2018). Therefore, the cohesion, the dilation angle, and the tensile strength of both contact materials are assumed to be 0.0 kPa, 0°, and 0.0 kPa, respectively. Teufelsbauer et al. (2009) found that the mechanical behavior of rapid granular flow is not sensitive to the contact stiffness. The contact stiffness kn and ks are set to a high value of 2 GPa to prevent excessive block overlap. The values of contact friction angle and damping coefficient have a significant influence on the block movements. The damping coefficient is not a parameter that is explicitly related to any physical mechanism, it is set to 0.0 during the sliding simulation (Li et al., 2012; Wu et al., 2017). The contact friction angle between sliding body and sliding bed is 22° in dynamic evolution which is derived through back analysis based on the landslide geometry. Considering the colluvium was in low water content during this event, a constant contact friction angle, 29°, between colluvium and sliding bed is used. The friction angle of new contacts generated in the subsequent sliding are set to 22°. In the movement simulation, the time step is set as 8.7 × 10⁻⁴ s, and the numerical simulation is carried out in 1.3 × 10⁶ steps. A standard desktop computer (Intel® CoreTM i7 CPU, 2.60 GHz × 6, and 16 GB RAM) has been adopted for the 2-day numerical simulation.
Results
Evolutions of Sliding Mass Position
The movement simulation of the Xinmo Landslide is carried out for 120 s using a discrete element method. Figure 10 shows the variations in position of the sliding mass over time. As shown in Figure 10A, the sliding body impacts the loose accumulation fiercely, and the frontal part of the sliding body climbs over the colluvium to the middle part of the entrained area after an elapsed time of 9 s. During this stage, the volume of the sliding mass increases obviously, owing to bulking. However, the colluvium in the lower part of the entrained area is not yet stable. After 11.2 s (Figure 10B), a few blocks reach the flat ground at the bottom of the Songpinggou Gully and their movement direction slightly deviates to the left along a pre-existing gully at the lower part of the slope. An integral-sliding of the old landslide deposits slide under the shoveling and scraping of the sliding mass can be seen from Figure 10B. Figure 10C (at 35 s) shows that the front of the landslide has been widened obviously after sliding out of the entrained area and reaches the scarp at the toe. From 35 to 52 s, the sliding mass glides to the bottom of the valley with a diffusion angle of about 60°, most of them stop at the slope toe after impacting the valley bottom and form a fan-shaped accumulation. Compare Figure 10E with Figure 10F, the landslide is essentially static except for a little debris moving on the scarp at 60 s. Figure 10F shows the final deposition after an elapsed time of 120 s. The landslide deposits are divided into two main parts, one portion is situated above the scarp and the other accumulates at the toe of the slope on the left bank of the river. The colluvium is entrained to the bottom of the Songpinggou Valley entirely and buried under the sliding mass, while the deposits on the scarps are all composed of the rock mass from the source area. In addition, few deposits cross the river or pile up in the pre-existing gully. The maximum run-out distance, Ls (measured from the rear edge of the source area to the distal edge of the deposits, seen in Figure 10F) in the numerical simulation is 2,450 m, which is close to the field investigation that was reported in Fan X. et al. (2017), 2,418 m. However, the maximum width, Lw, along the river, 1,400 m, is slightly larger than the field measurement value, 1,200 m (Fan X. et al., 2017).
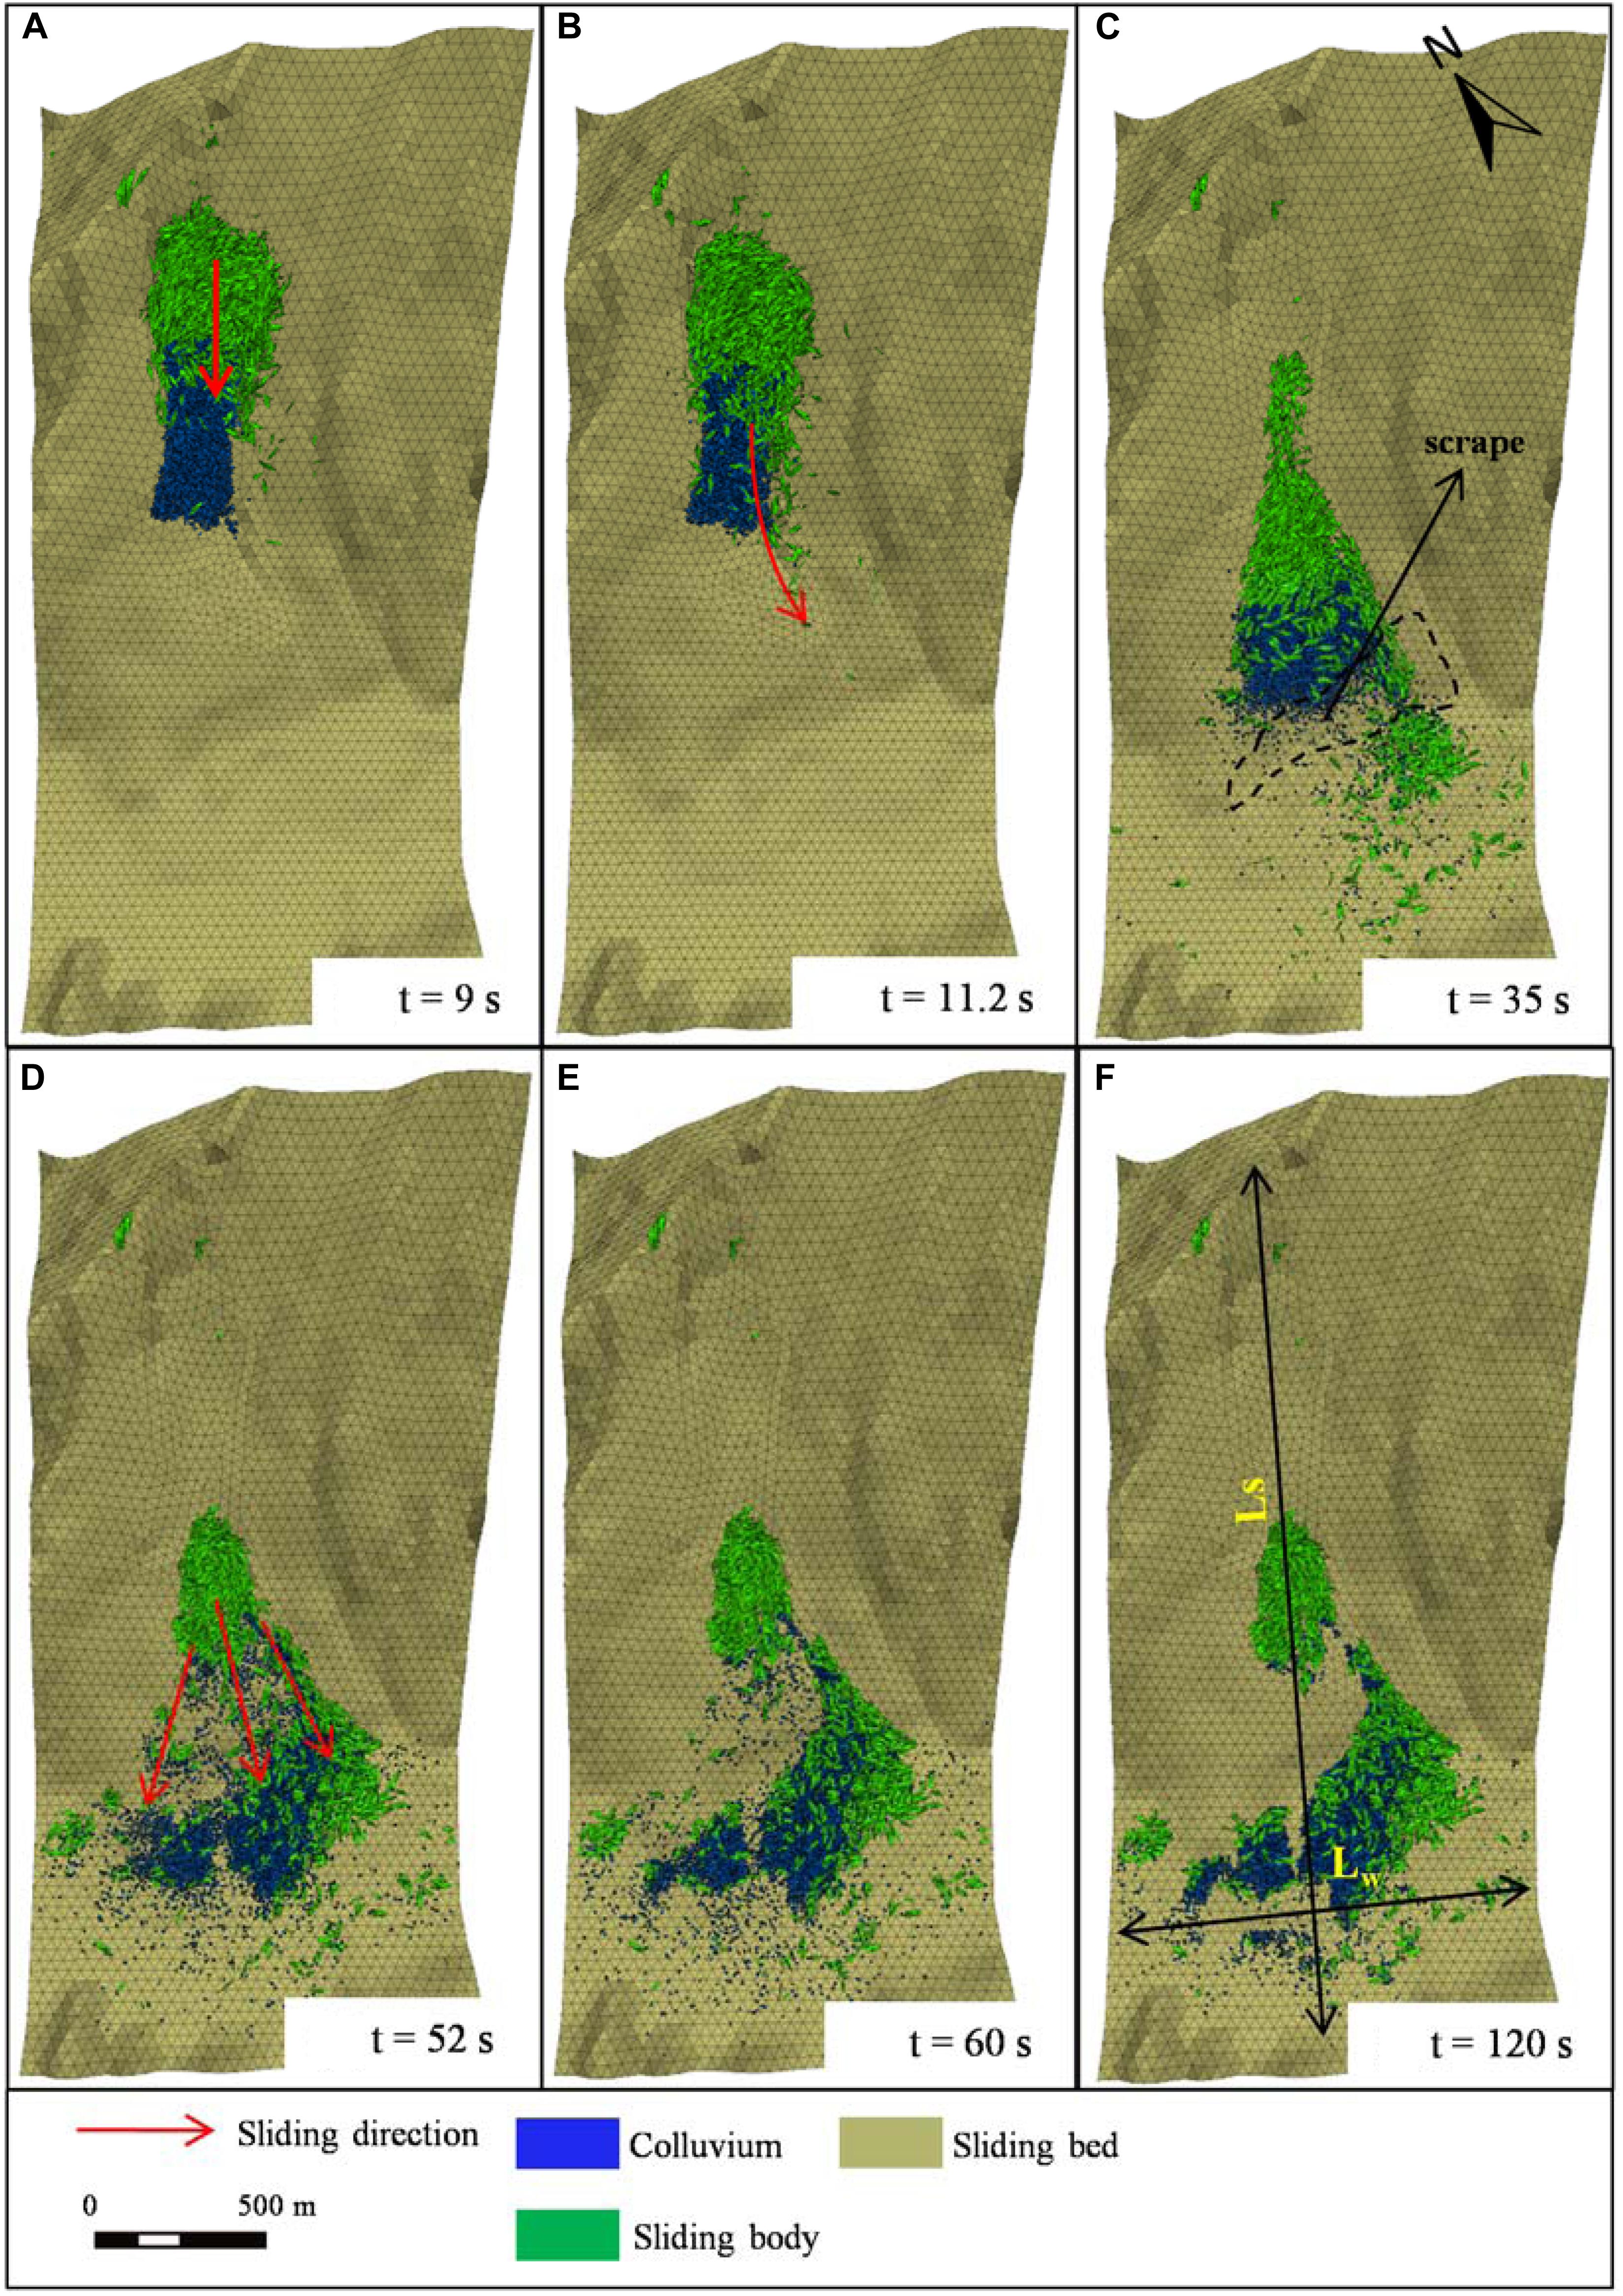
Figure 10. Simulated sliding mass position at different times since the landslide initiation: (A) t = 9 s; (B) t = 11.2 s; (C) t = 35 s; (D) t = 52 s; (E) t = 60 s and (F) t = 120 s. Ls and Lw indicate the maximum length of the landslide along the direction of motion and down the river, respectively.
Figure 11a shows the simulated deposit thickness; the maximum simulated deposit thickness is 55 m, which is larger than the actual thickness, 31 m. The average deposit thickness, 10.8 m, is close to the average value, 10 m, derived from field investigation (Wang et al., 2020). In this study, a uniform contact friction angle, 22°, between the sliding body and the sliding bed assumed is much smaller than the slope of the scraping area, which results in no blocks piling up in the entrained area and a higher deposit thickness than in reality in the area above the scrape. A comparison between simulated and actual deposit thickness along a typical cross section is shown in Figure 11b. The deposit thickness presents an increasing tendency from west to east due to the change of sliding direction (Figure 10B), which is consistent with reality, while a notable higher thickness is shown at the eastern end. The reason for this difference could be that the excessive block size cut by joints with an average space of 20 m would result in an uneven distribution of deposit. More reasonable simulation results could be obtained by using a block size closer to the actual value, but it would require a much longer computational duration.
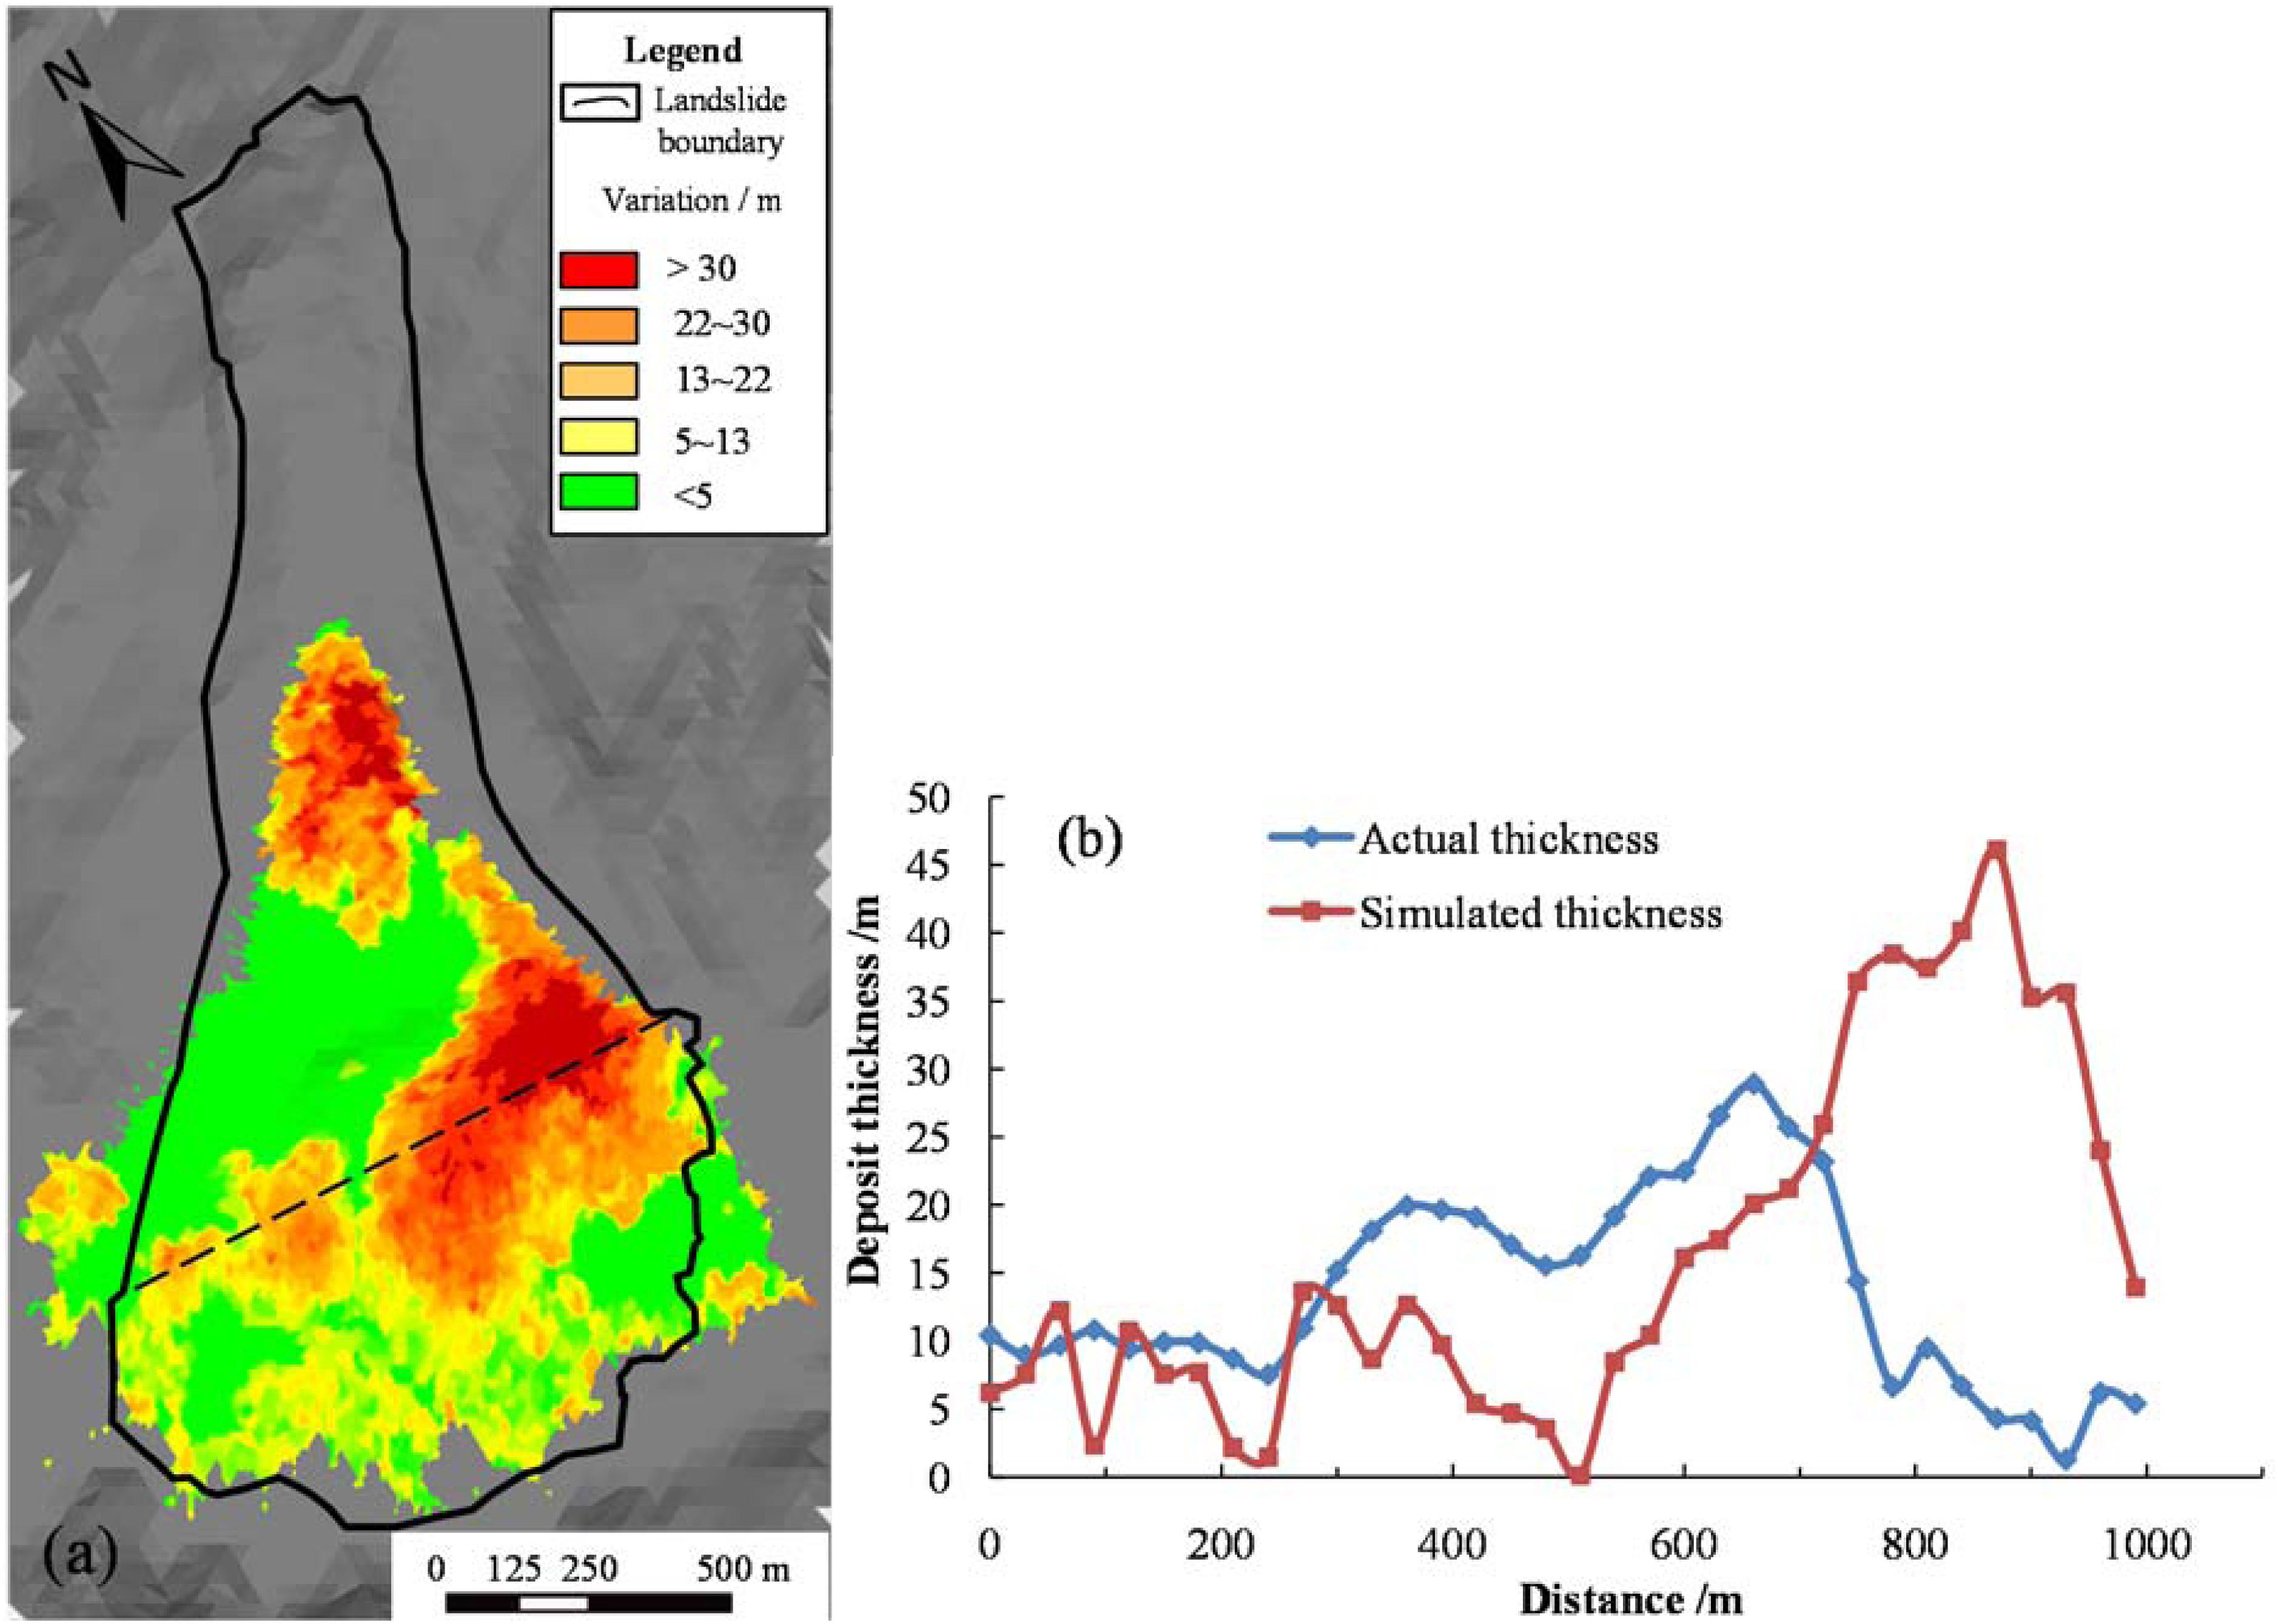
Figure 11. Simulated deposit thickness distribution of the Xinmo Landslide. (a) the plan view and (b) simulated and actual thickness of the Xinmo Landslide deposit along a representative cross section which is shown in (a) as the dash line.
Velocity Variations
The evolution of landslide propagation velocity has been analyzed in terms of the mean velocities of the whole mass, sliding body, and the entrained colluvium, as shown in Figure 12. Each of the velocity-time curves show two distinct peaks, indicating that the sliding body and accumulation have experienced two accelerations and decelerations due to the complex local topography and base erosion. Within 5 s from the instability of the sliding body, the gravitational potential energy of the sliding body and the elastic potential energy stored in contacts are rapidly converted into kinetic energy, and the velocity of the sliding body rapidly reaches its first peak value of 63.7 m/s (at 5.2 s). During the same time, the colluvium in the entrained area is impacted to accelerate. After 5 s, the impact reaction force exceeds the gravity of the sliding body, resulting in the deceleration of the sliding body, and the acceleration of the colluvium decreases (the velocity curve of colluvium changes from concave to convex). After 11.2 s, the velocity of the sliding body increases with little fluctuations for the second time since the general failure of the colluvium (Figure 10B). The second peak velocity, 55.8 m/s, of the sliding body and the second peak velocity, 39.9 m/s, of the colluvium occur at the same time (t = 25.3 s) and then decrease due to the flatter slope gradient. The velocity of the sliding body is always greater than that of the colluvium and pushes them to slide until they reach the same velocity. At 34.4 s, the colluvium slides down from the scarp at the lower slope, and gradually reaches the second peak velocity when they reach the bottom of the Songpinggou Valley. The average velocity of the sliding body also shows a slight decline a few seconds after the second acceleration of the colluvium because a big part of the sliding remains on the scarp (Figure 10A). Subsequently, the velocity of the landslide decreases slightly and the whole landslide motion stops in about 60 s.
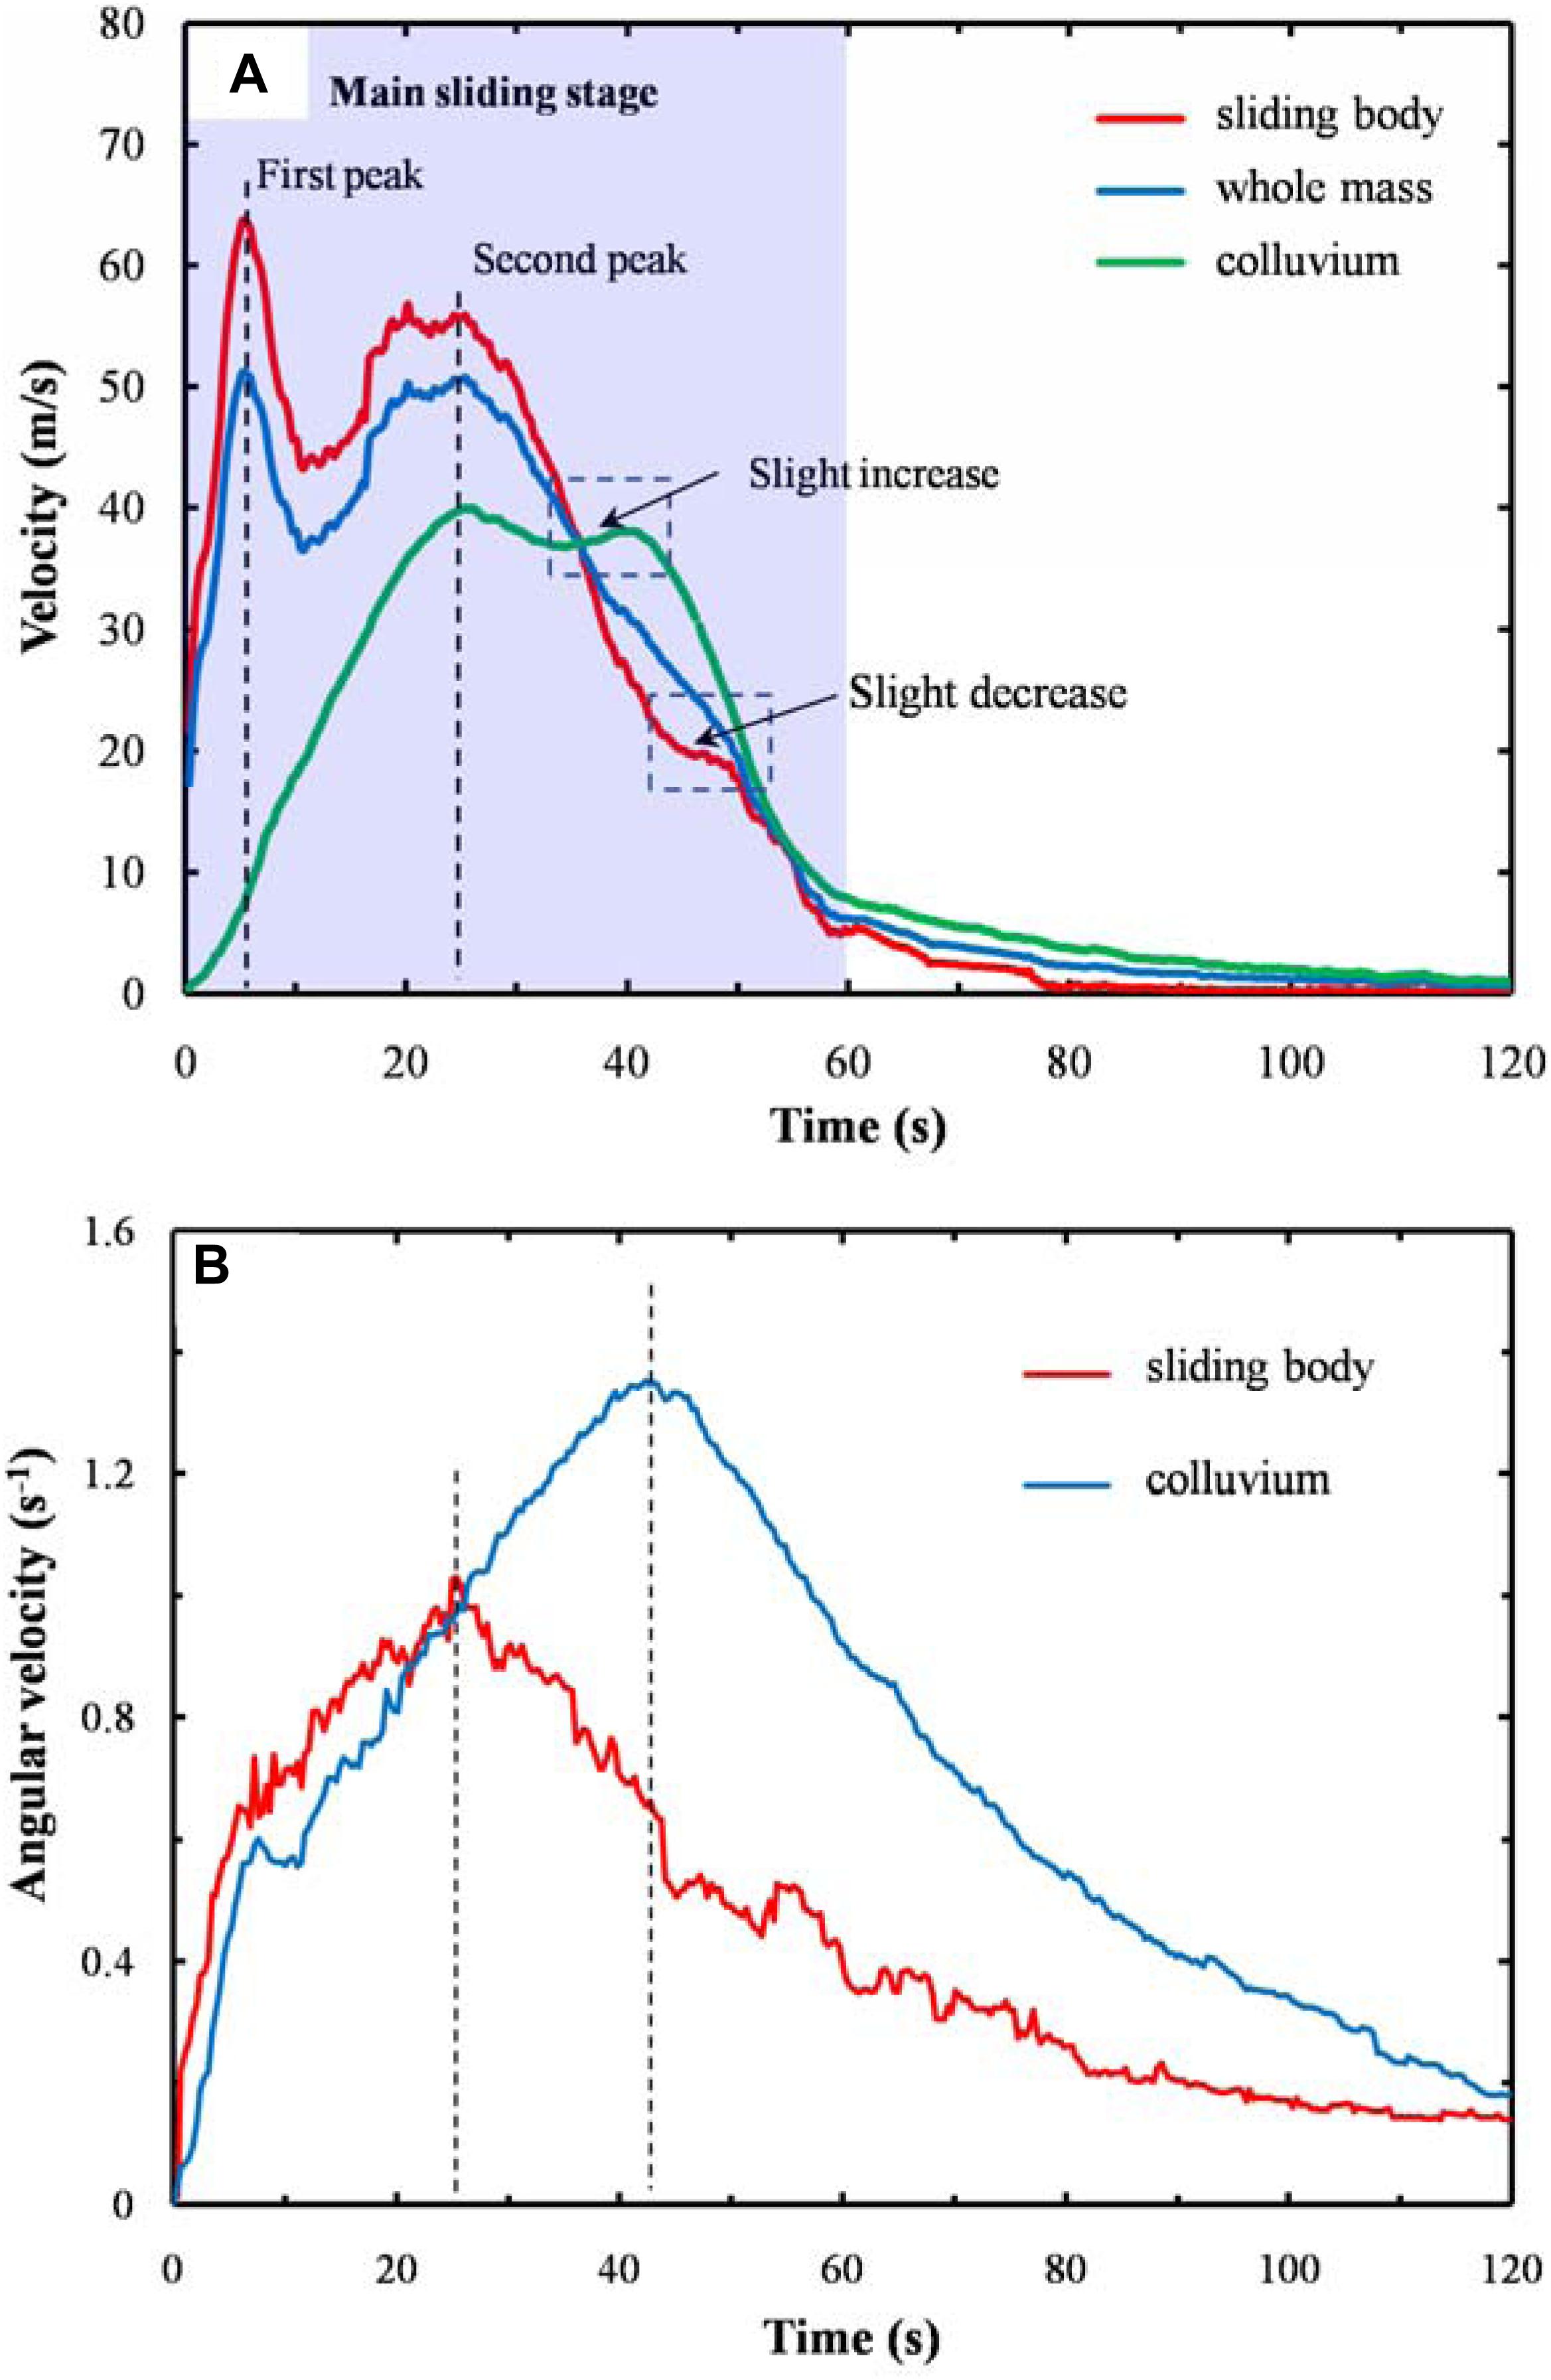
Figure 12. Numerical results of the velocity evolution among the mass movement process: (A) evolutions of average velocity of sliding body, colluvium, and whole mass and (B) evolutions of average angular velocity of sliding body and colluvium. The velocity curves for the sliding body, the colluvium, and the whole body all have two distinct maxima. The angular velocity curves of both the sliding body and the colluvium have only one maximum value and the time at which the angular velocity reaches its maximum is the same as their respective times of reaching the second velocity maximum.
It is more representative to use the overall velocity average curve to describe the whole landslide motion. The tendency of the whole mass average velocity curve is similar to that of the sliding body, and its two peaks (51.1 m/s at 5.2 s and 50.2 m/s at 26.0 s) are both smaller than those of the sliding body. The main sliding time could be estimated about 60 s from the average velocity curve of the whole mass when only a few blocks are in motion. Xu et al. (2017) analyzed the landslide movement according to the seismic signal of the Xinmo Landslide recorded by the Maoxian MXI station and suggested that the 120 s process of the landslide can be divided into three stages. In the first stage (about 40 s), some hanging rocks at the ridge collapsed and impacted the lower part of the source area, leading to the propagation of pre-existing cracks and the failure of the sliding body (Hu et al., 2018). The second stage, i.e., the main sliding, lasted 60 s from failure to stacking. Finally, some small-scale collapses occurred in the last 20 s until the event calmed down. In our study, only the main sliding was simulated, the time duration of the numerical simulation results correlates well with the measured data.
Figure 12B shows the evolutions of the average angular velocity of the sliding body and colluvium. There is some difference between the velocity curve and angular velocity, as the angular velocity curve has only one peak. However, the time when the angular velocity reaches the peak is equal to the time when the velocity reaches the second peak. After the beginning of the landslide, the angular acceleration of the sliding body and colluvium are close, but the colluvium is accelerated for a longer time and finally exceeds the sliding body. The change of angular velocity is not as sharp as that of velocity, and it still keeps a high value after the main sliding stage. When block motion changes from sliding to rolling, the friction energy consumption decreases and the block moves further. According to V = ω × R, the radius and peak angular velocity of the colluvium are about 2.6 m and 1.34 s, respectively, so the velocity of the pure rolling block is about 3.5 m/s and is far less than the actual peak velocity of 50.2 m/s. Therefore, sliding is the fundamental motion in this simulation.
Entrainment of the Colluvium
The amplified landslide volume caused by the substrate erosion is a typical feature of the Xinmo Landslide. Although many researchers considered the entrainment effect in numerical simulations of the Xinmo Landslide, the entrainment process was rarely analyzed (Chen and Wu, 2018; Hu et al., 2019; Huang et al., 2019; Liu et al., 2019). In order to understand the simulated erosion process, the failure and migration of the colluvium are stated here.
A typical profile A-A’ is used to show the results aiming to observe the phenomenon clearly. The impact and entrainment process of the landslide is shown in Figure 13. At t = 1.7 s, the front of the sliding body plow into the colluvium and the failed colluvium generate an oblique upward velocity. It could also be seen that there is an obvious failure surface (the red dash) with an inclination angle (θ ≈ 28°) between failed and stable colluvium (Figure 13A). With the increase in the landslide displacement, the sliding mass becomes more broken and part of the fragments climb to the upside of the colluvium. At the front of the sliding mass, several blocks can be seen to be splashed and mixed with the sliding mass under the heavy impact. As the failure surface propagates towards the front of the accumulation, more and more colluvium is failed by the pushing of the sliding body, and the rear of the colluvium is compressed and thickened (Figure 13B). The phenomena, frontal plowing, mass spray, failure surface, and thickened substrate, observed in the DEM simulation, are very similar to the experimental ones (Dufresne, 2012; Lu et al., 2016). At t = 26 s, Figure 13C shows that the rear part of the sliding body becomes thinner and most of them are still located at the rear of the colluvium. Although the whole colluvium has already failed and slide as a whole with the sliding body, the back and upper sliding bodies still have a faster speed than the colluvium. This indicates that the entrainment process is not finished, and it will still last a few seconds to reach the same velocity as the sliding body after the failure of the whole colluvium.
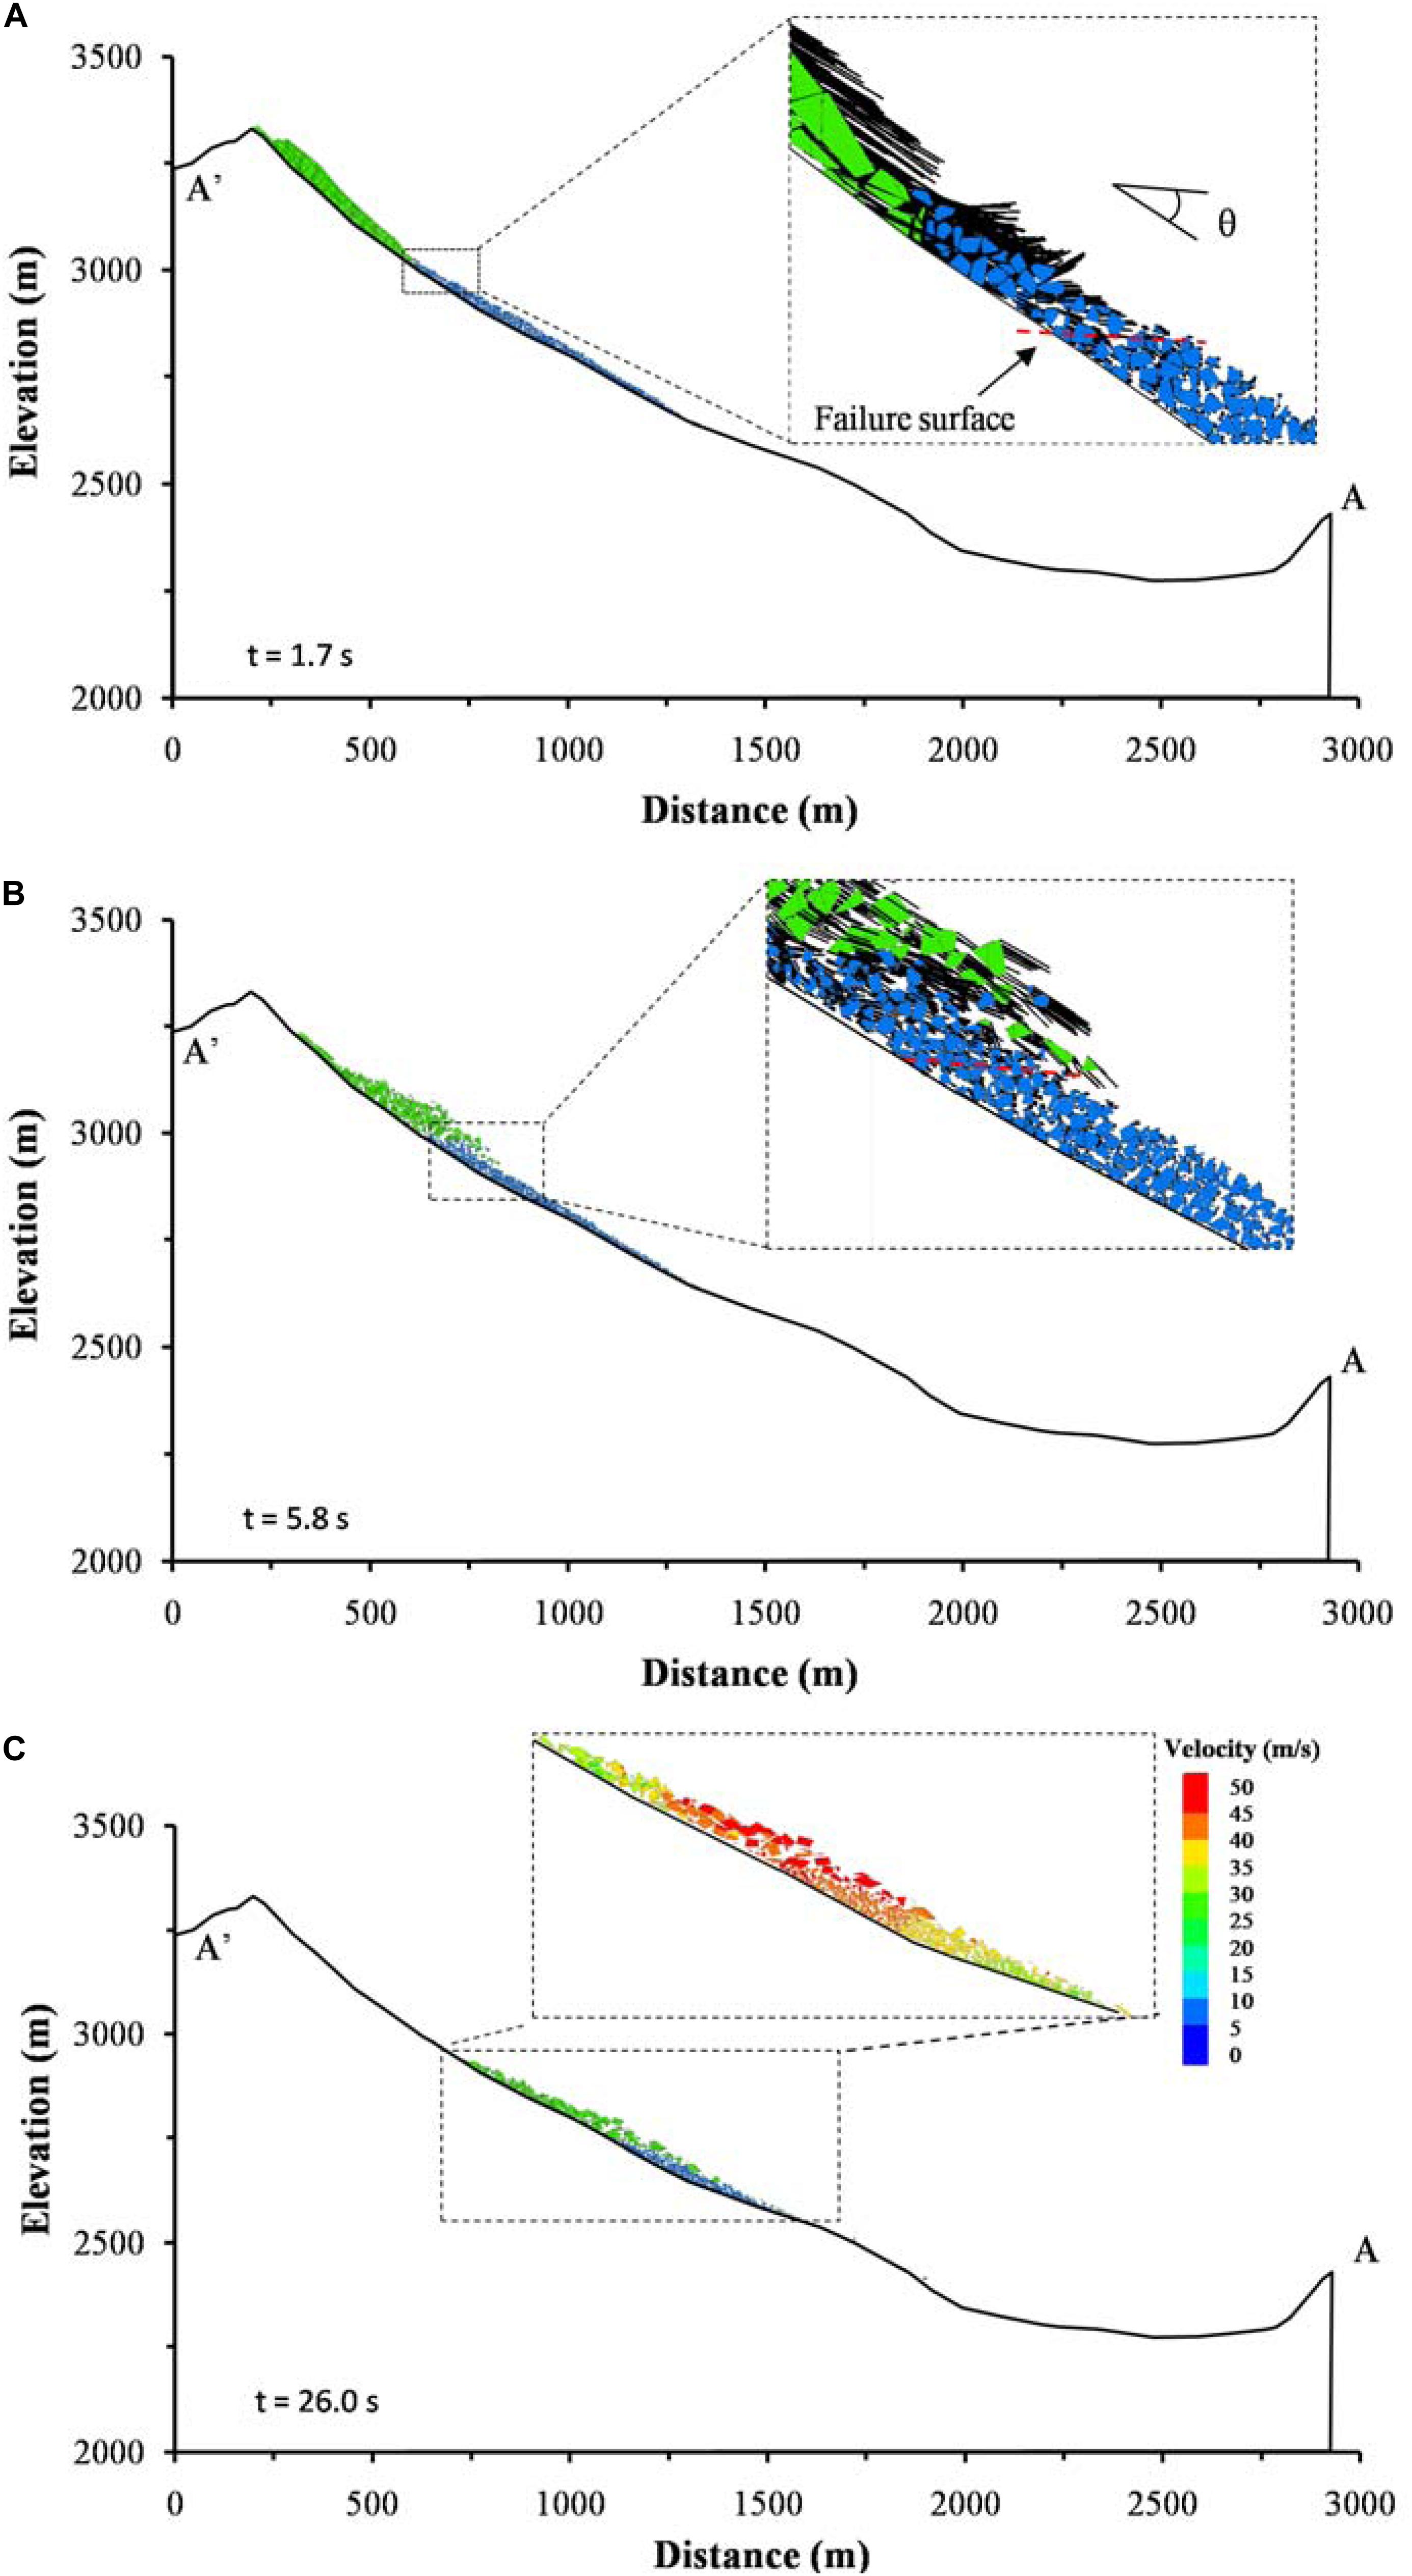
Figure 13. Entrainment process at different times: (A) frontal plowing and substrate failure; (B) thickened substrate under compression; and (C) completely displaced colluvium indicated by the moving leading edge with a velocity more than 15 m/s. An interface (red dash line) between failed and static colluvium with an inclination angle (θ≈ 28°) with respect to the base of the substrate under the plowing of the sliding mass can be seen at the beginning of the entrainment process.
Discussion
In our study, the simulated movement distance, deposition pattern, and main sliding time of the Xinmo Landslide are in conformity with the field investigation and actual time based on landslide seismic signal analysis. In addition, some typical phenomena of substrate entrainment, including frontal plowing, mass spray, shear zones in substrate, thickened substrate, and basal abrasion, are observed in our simulation as found in the physical experiments of Dufresne (2012). The features of substrate entrainment in natural landslides should serve as constrains with numerical simulations. However, few documented entrainment processes or deeply buried substrate materials in landslide sediments limit insight into the natural phenomena. The agreement of the simulation results with those features of the phenomena observed in the laboratory during substrate entrainment can justify our simulation results to a certain extent, which in turn deepen the understanding of the complex physical phenomena.
Frontal erosion or plowing and basal abrasion are the two main forms of substrate failure (Hungr and Evans, 2004; Barbolini et al., 2005; Sovilla et al., 2006; Lu et al., 2016), both of which could be seen in our simulation (Figure 13C). At present, most entrainment models based on continuum mechanics simplify that the failure of the substrate material is caused by the shear force acting on the base surface (McDougall and Hungr, 2005; Luna et al., 2012; Ouyang et al., 2015; Li et al., 2019). In our simulation, the front of the sliding body pushing the accumulation seems to be a significant factor leading to the failure of the colluvium, especially at the initiation of entrainment. In addition, the failure surface is always located in the front of the bulldozer, rather than parallel to the bottom of the sliding body (Figures 13A,B). The angle of about 28° between the failure surface and slope approximately equals to 30.5° (45°-29°/2), which indicates that the colluvium experiences a shear failure due to passive earth pressure.
According to the deformed base shape, we could divide the force acting on the base parallel to the direction of landslide movement into two parts: the thrust acting on the trailing edge and the shear acting on the upper surface of the sliding body (Figure 14). In order to find out the effect of thrust and shear force, we use the Fish language built in 3DEC to calculate the values of the two during the process of base entrainment. As the rear of the colluvium becomes flat (Figure 13C), the action position of thrust and shear force is not obvious, only the thrust and shear force from the beginning of the landslide to 17 s are calculated. Figure 15 shows the calculation results. At the beginning of the entrainment process, the colluvium is impacted by the sliding body and the shear is zero. With the sliding body moving over to the surface of the colluvium, the shear begins to increase gradually, but the thrust is the main reason causing failure. For dry substrate materials, Barbolini et al. (2005) and Sovilla et al. (2006) also proposed that the predominant erosion mechanism observed in the experiments is plow, i.e., thrust, and the contribution to the erosion of shear is negligible. After the failure of the whole colluvium, the magnitude of thrust experiences a rapid decline but is still slightly larger than that of shear.
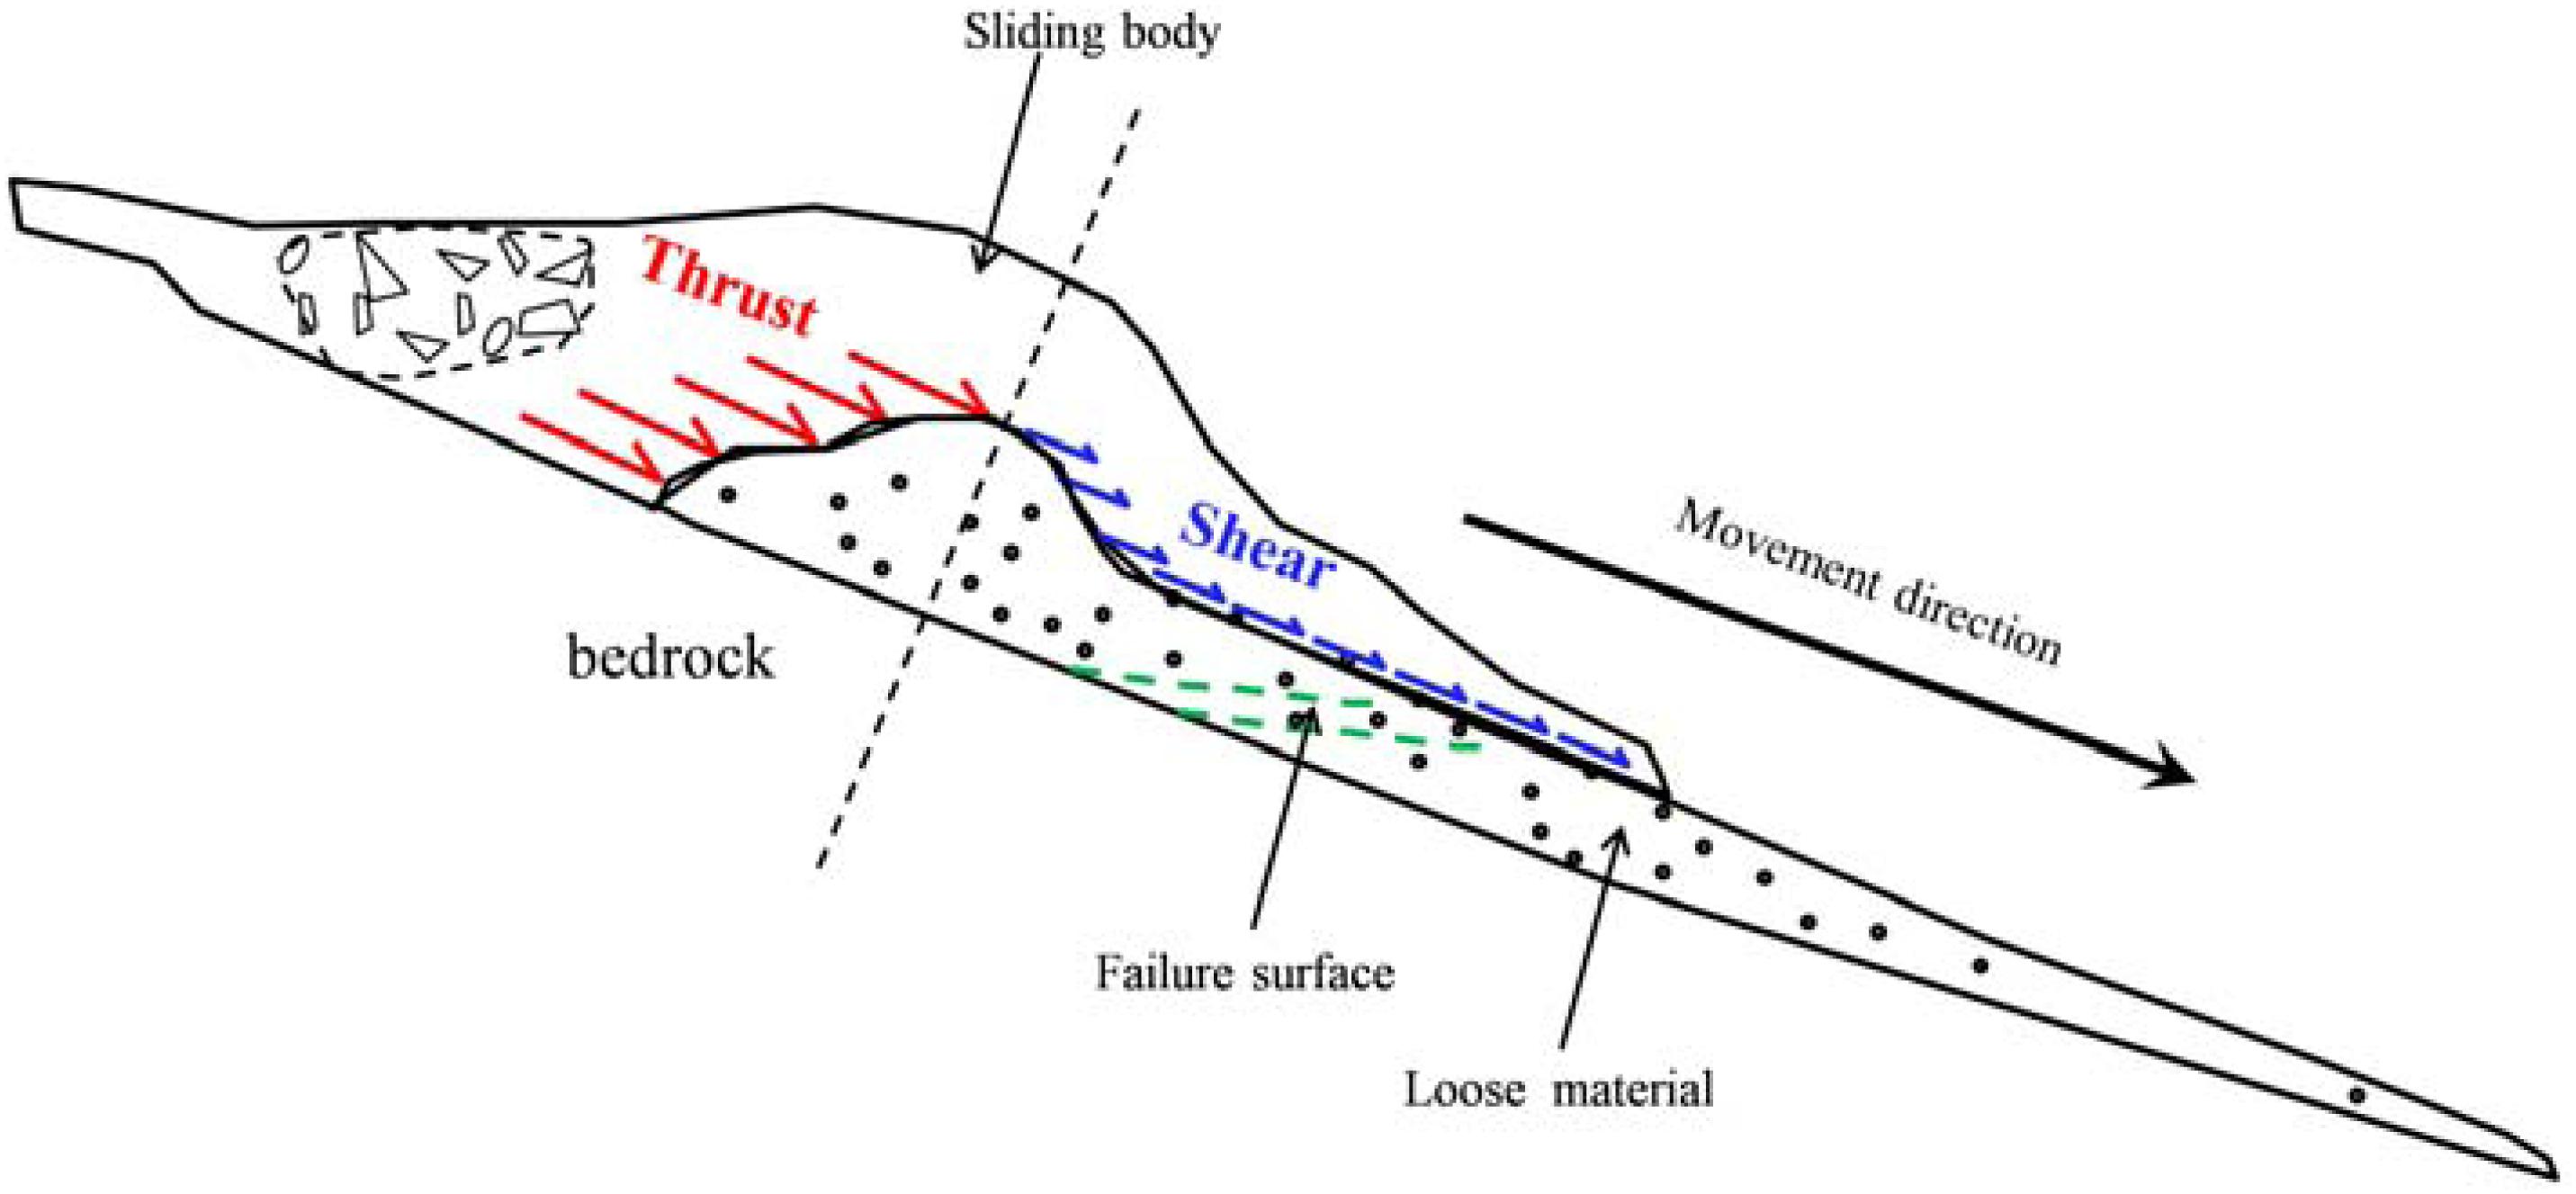
Figure 14. Sketch diagram of the thrust and shear force acting on loose material alone sliding direction in a supply limited condition. The sliding body applying the thrust and shear force is divided into two parts, separated by a plane which passes through the ridge line of deformed path materials and is perpendicular to the movement direction.
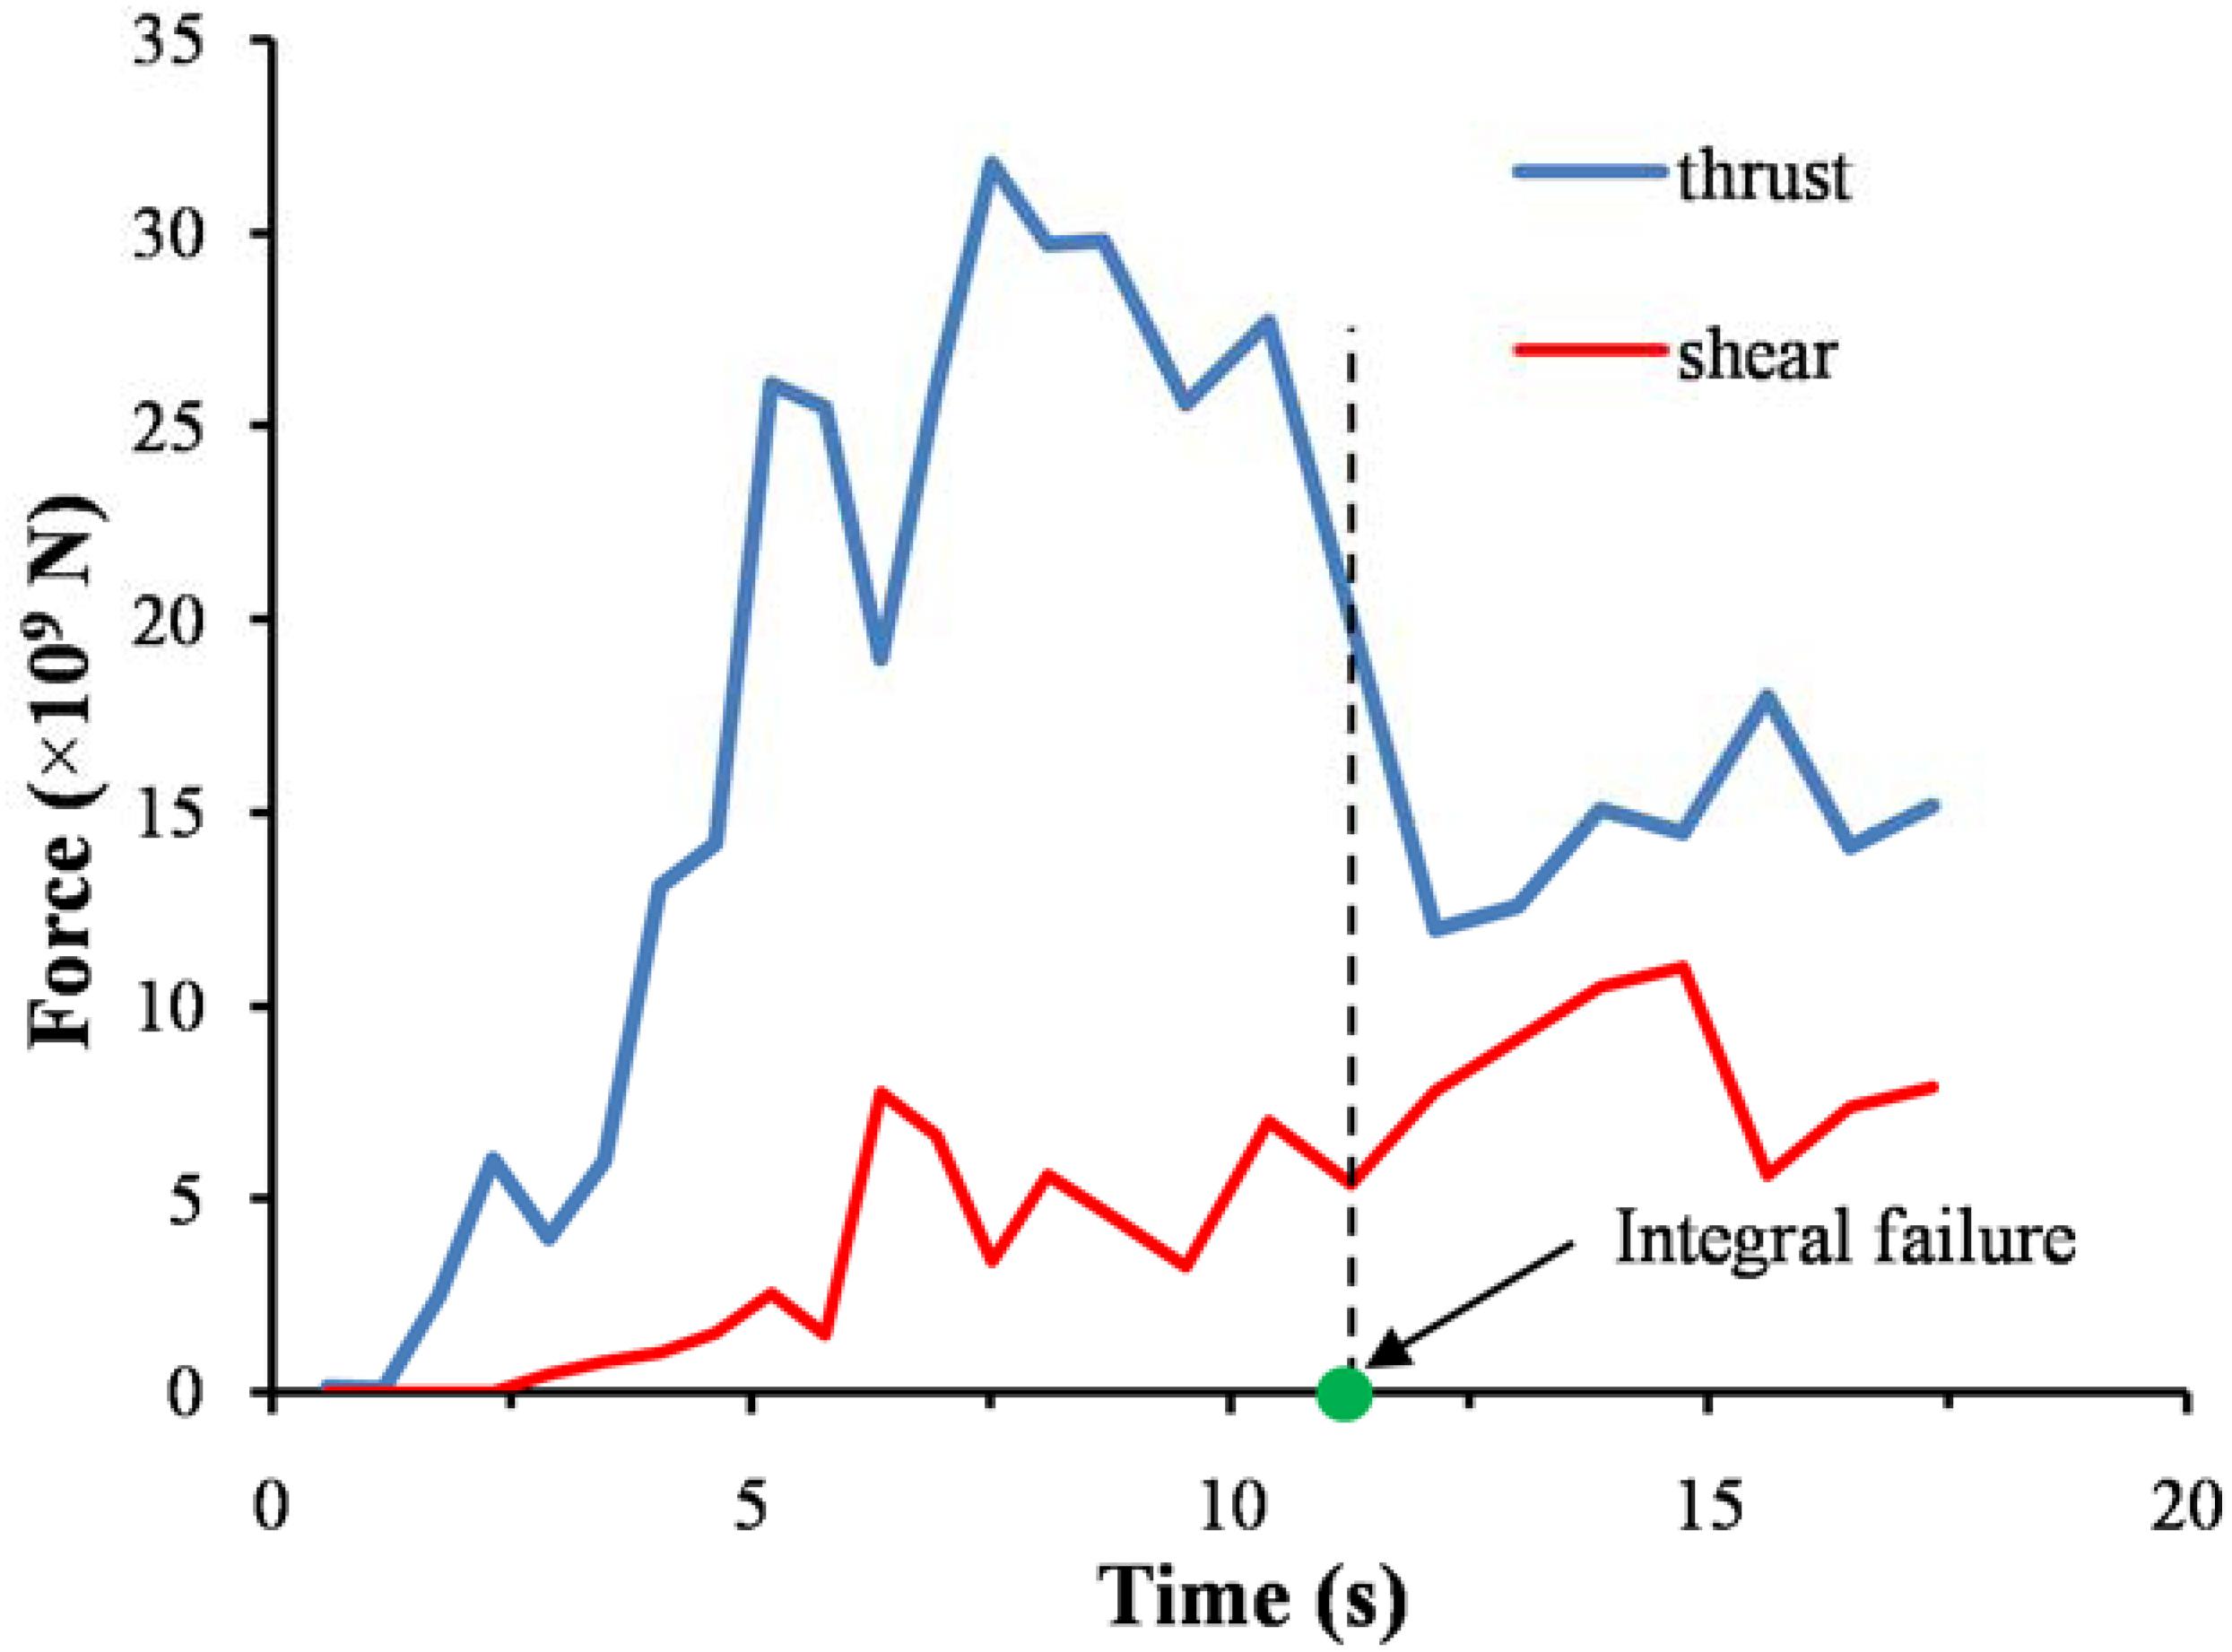
Figure 15. Evolution of thrust and shear force during the entrainment process. The magnitude of the thrust decreases abruptly at the time of integral failure of the substrate but remains higher than the magnitude of shear.
Detailed investigation of the morphology and internal structures of rock avalanche deposits could provide conditions for the exploration of the rapid motion of debris and constraints with the reliability of the numerical model. The colluvium in the front of the deposit simulated here also supports the plowing process (Figure 10F), but it is difficult to distinguish the new deposits from the path materials in this study because they are the products of the same kind of rock fragmentation. This phenomenon was observed in a similar landslide, the 2009 Jiweishan rock avalanche in Chongqing, China, wherein loose soil on the transport path was bulldozed to the very front and pushed passively by the rock debris, rather than remaining at the bottom and reducing frictional resistance between the debris and the ground through the deposit investigation and numerical simulation by Zhang et al. (2019).
To understand the role of entrainment of colluvium on landslide mobility, a simulation with no entrainment was conducted and its final deposit is shown in Figure 16. Here, the apparent friction coefficient (Φa), which is defined as slope of the line connecting the highest point (Ph) of the source mass and the most distal point (Pd) of the deposit, is used as a parameter to quantify the mobility of the rock avalanche. The equivalent friction coefficient (Φe) is equal to the height difference divided by the horizontal distance difference between the center of gravity of the source mass (Cs) and deposit (Cd), which can represent the consumption of potential energy in the mass due to friction (Heim, 1932). The equivalent friction coefficient could be obtained easily using Fish code to derive the center of mass of the failing mass and the deposit in 3DEC. Table 2 shows the kinematic parameters of simulation results for different substrate conditions. The higher Φe under the erodible bed condition indicates that entrainment of path materials is an energy-consuming process and reduced the mobility. The similar Φa in both conditions is the result of opposite hill blocking.
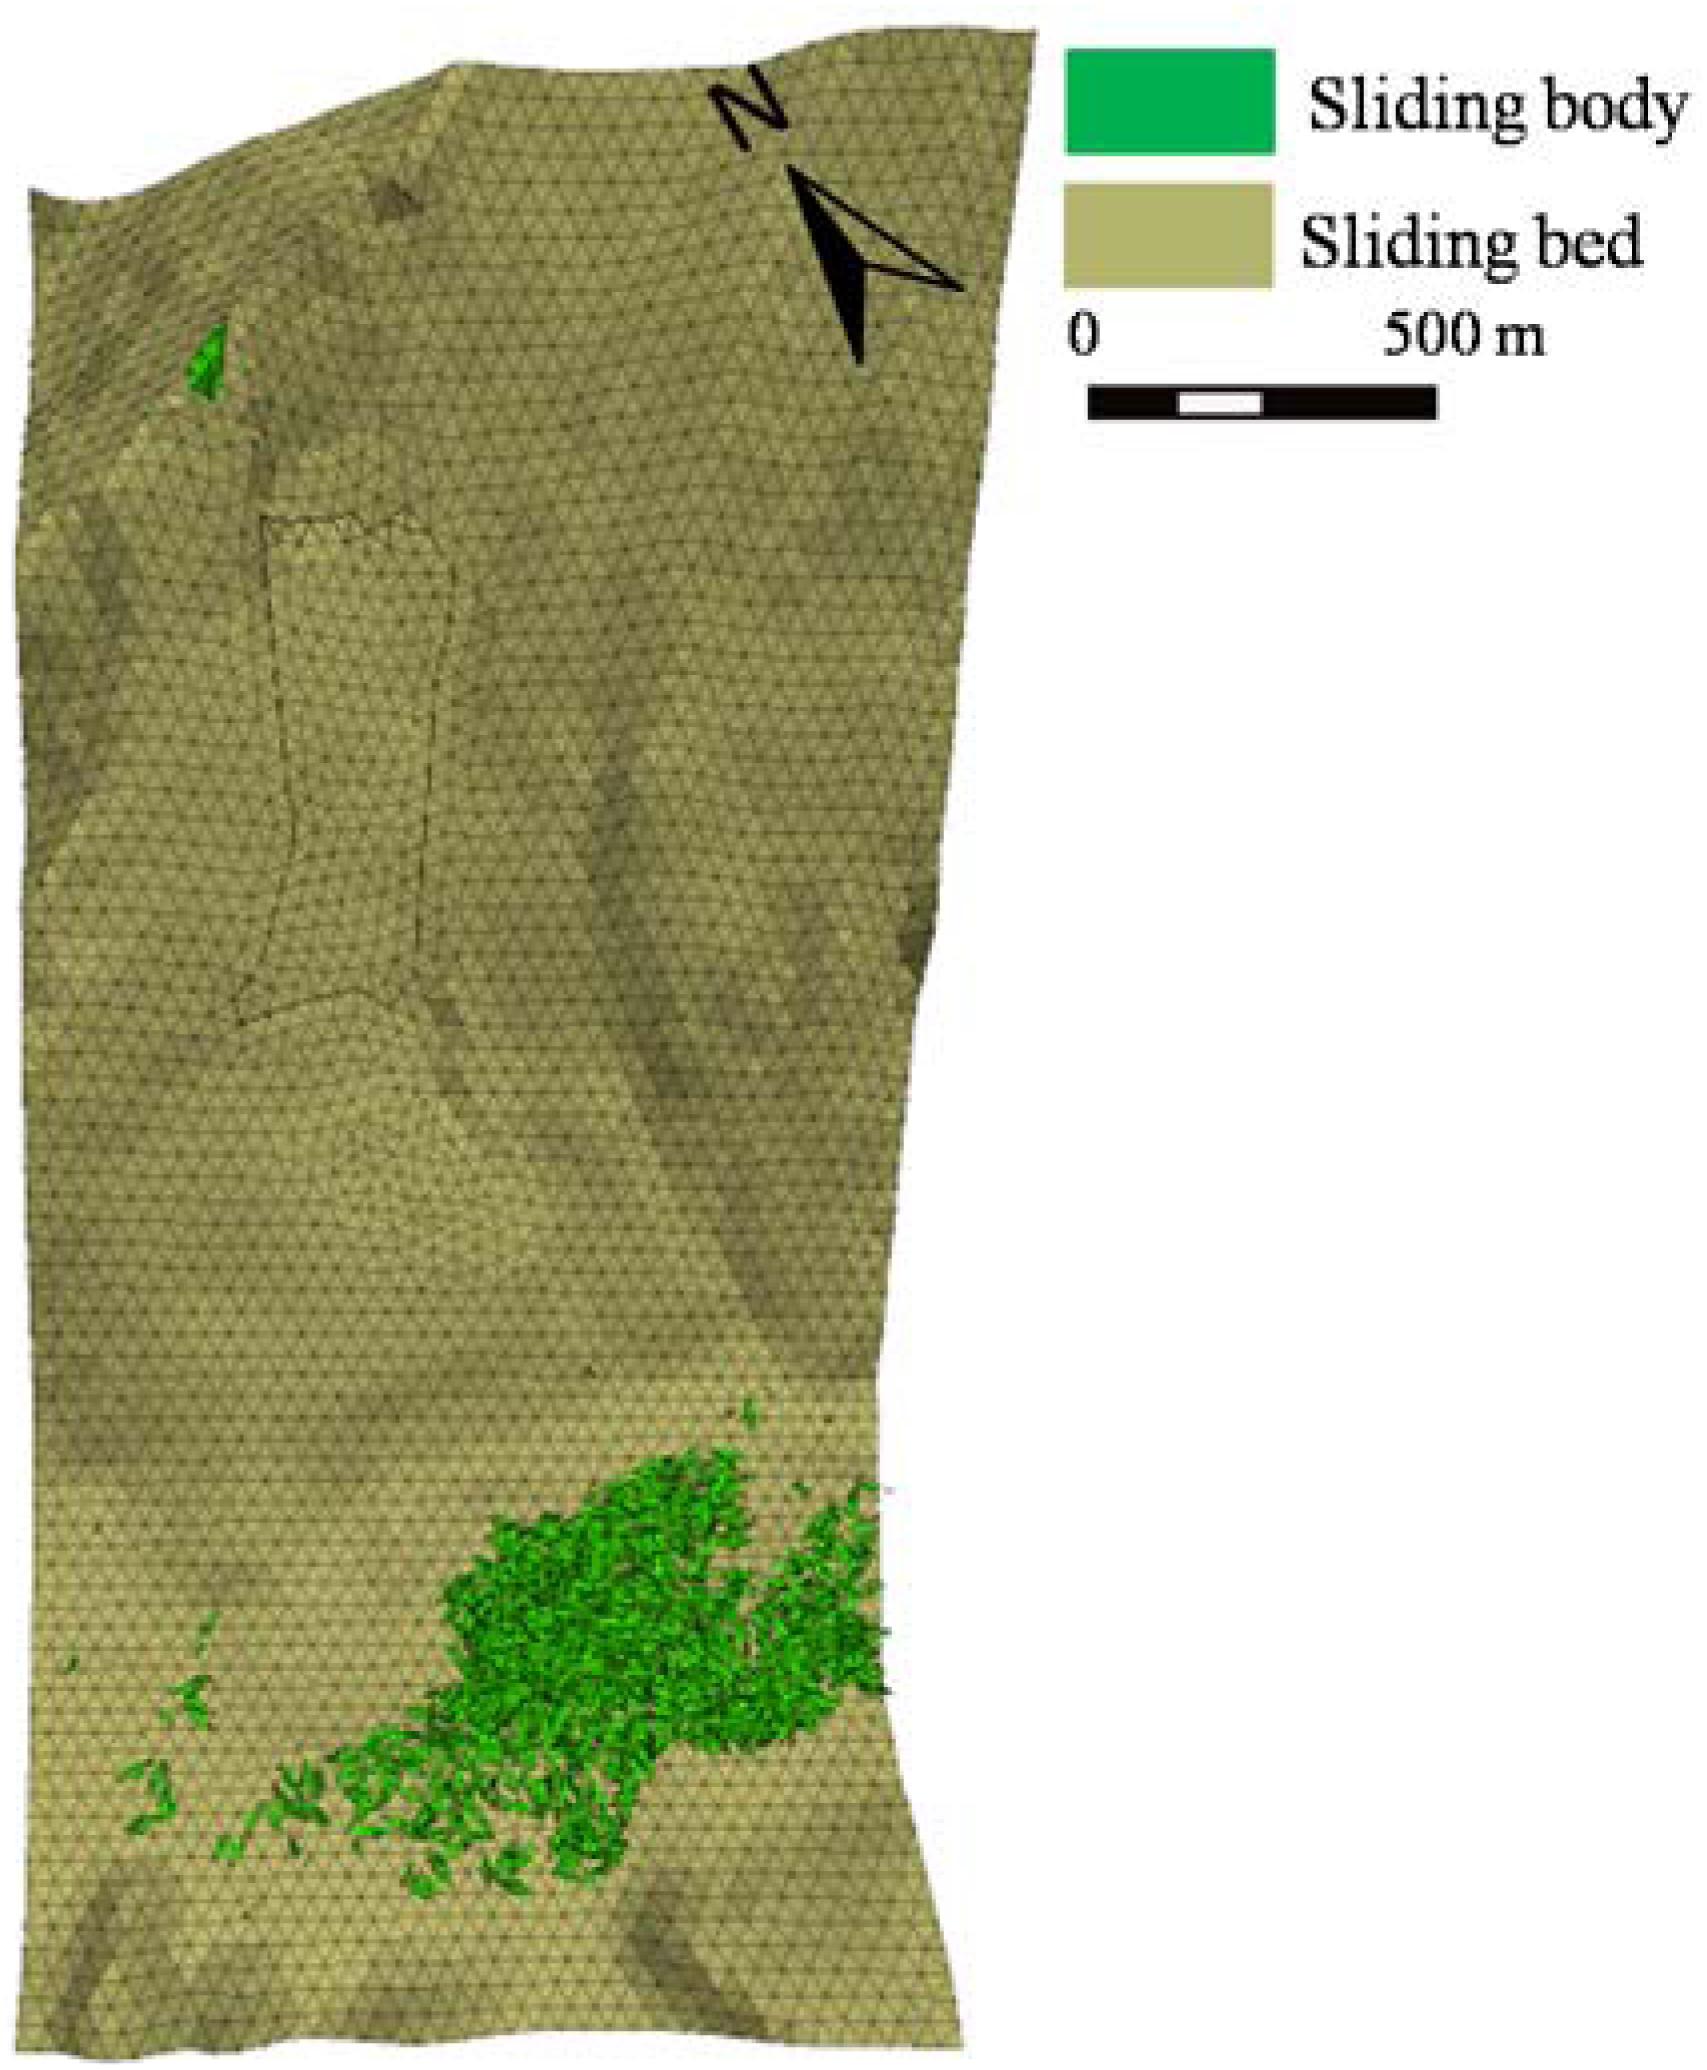
Figure 16. Simulated deposit of the Xinmo Landslide in rigid bed condition. Part of the blocks sliding out of the model range is not shown.
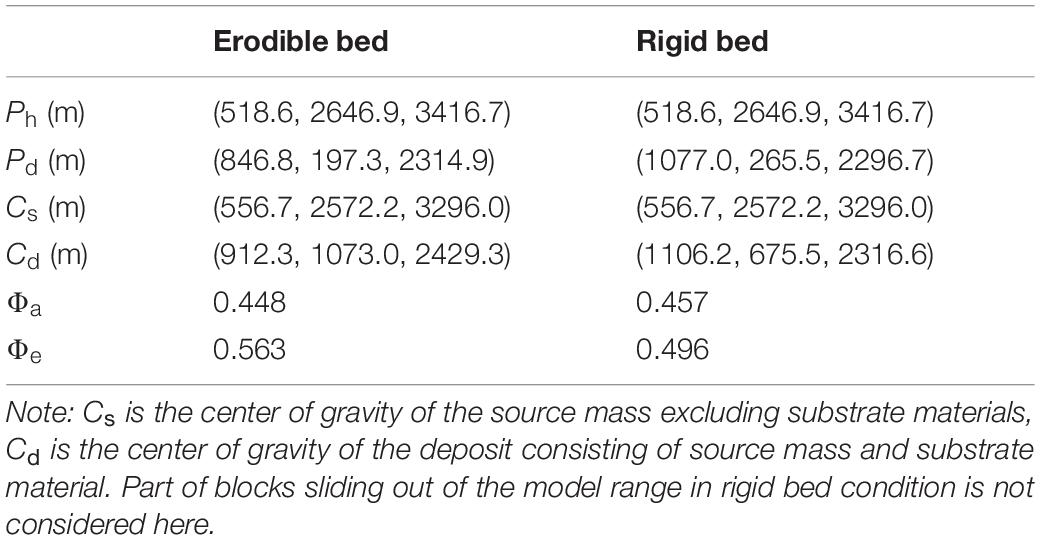
Table 2. Kinematic parameters of simulation results in different substrate conditions.
Mangeney et al. (2010) found that the mobility of granular collapse increases on erodible slopes when the inclination angle exceeds a critical angle,θc≈θr/2 (θris the response angle of substrate material). In this study, a contact friction angle of 29° was achieved, which is close to inclination angle of the slope and place in which the colluvium in critical stable is used, but the mobility of the landslide was reduced contrary to their experimental results. A significant decrease of average velocity at the initiation of entrainment could be seen in Figure 8A as a result of momentum transfer to accelerate stationary bed material by frontal plowing (Iverson and Ouyang, 2015). In Mangeney’s experiments, there seem to be no difference between frontal velocities at the beginning of the slump between rigid and erodible path conditions which is dominated by a pressure gradient instead of plowing, yet a steady frontal flow on erodible bed occurred after a deceleration phase increased the runout distance. We infer that plowing at onset of entrainment inhibits flowing, but a promotion of mobility is caused by basal abrasion. In our simulation, plowing is the dominant entrainment mechanism compared to basal abrasion, according to a previous discussion. The reverse responses of mobility to path entrainment may be related to different initial geometries of flowing mass and substrate. In addition, it should be noted that the friction coefficient between sliding mass and sliding bed, 22°, used in both simulations, which derived from back analysis of traveling distance in erodible substrate condition, is smaller than that of colluvium, a critical value maintaining its static on the slope. Plowing of the static colluvium of a higher strength is hence another explanation of the reduced mobility. Nevertheless, those parameters installed here may be reasonable according to the friction weakening with increasing sliding velocity that probably explains the unexpectedly long runout of giant landslides (Lucas et al., 2014). Moreover, the predicted potential landslide impacting areas in the same region using the friction coefficient obtained from back analysis of landslides that already occurred could be overestimated when entrainment of path material is not included.
The LS-RAPID landslide dynamics computer software based on the liquefied model proposed by Sassa et al. (2010) has successfully analyzed the long run-out landslides with characteristics of substrate liquefaction and mass amplification induced by earthquakes or rainfall. Wang et al. (2020) conducted the simulation of the Xinmo Landslide using different dynamic models and their results suggested that the liquefied model is not suitable for the Xinmo rock avalanche because there is no liquefaction condition according to the field investigation. In our study, pore pressure is not taken into account and a constant friction angle is used considering the low water content of the colluvium in the path, even if there was a long time of rainfall before the slope failure (Li et al., 2012). For different base material types, there will be different dominant failure modes, so the appropriate numerical method and entrainment model should be chosen cautiously when entrainment of substrate is included.
Conclusion
Taking the June 24, 2017 Xinmo Landslide in Maoxian County, Sichuan Province as an example, the displacement, velocity, and entrainment process of the landslide are investigated using a 3D Distinct Element Code (3DEC) program. Several conclusions can be summarized as follows:
(1) Topography has a great influence on the movement direction of landslide. A pre-existing gully at the lower part of the slope changes the main sliding direction, resulting in the thickness of the deposit being higher in the East and lower in the West.
(2) The landslide undergoes two decelerations: the first one is due to impacting the colluvium, and the second one is affected by the terrain. The average velocity of the landslide reaches the first peak value of 51.1 m/s at 5.2 s and the second peak of 50.2 m/s at 26 s. It lasts about 120 s from the overall instability of the landslide to the ceasing of the movement and the main sliding stage lasts for 60 s, which coincides with the time deduced from the seismic signal of the landslide.
(3) The entrainment process could be divided into two stages. In the first stage, the predominant erosion mechanism is plow and the contribution of the basal abrasion is negligible. In the second stage, the magnitude of thrust experiences a rapid decline but is still slightly larger than that of shear after the failure of the whole colluvium. The colluvium is always in the front and the lower part of the sliding body, which was pushed to the bottom of Songpinggou Gully by the sliding body. Entrainment of dry material on the slope leads to more friction energy consumption, although total potential increases and reduces the mobility of mass movement.
In the DEM model, the loose colluvium is represented by rigid Voronoi blocks stacked under gravity and its failure and displacement under entrainment with overlying sliding mass is determined by the Coulomb-slip contact model. This work shows good capability of simulating entrainment of dry materials in a supply limited condition using a discreet element method, wherein both frontal plowing and basal abrasion of substrate are simulated. However, frontal plowing was not included in most entrainment models using the continuum approaches due to the simplification of the physical process. Our study highlights the significance of plowing relative to the basal abrasion under conditions of limited path material supply and future explorations of improved entrainment models incorporating the plowing characteristics are needed.
Data Availability Statement
The raw data supporting the conclusions of this article will be made available by the authors, without undue reservation, to any qualified researcher.
Author Contributions
J-wZ did the conceptualization, review, and editing. QC did the methodology, collected the resources, and prepared the original draft. QC and GF did the validation. GF and J-wZ did the investigation and funding acquisition. All authors have read and agreed to the published version of the manuscript.
Funding
This research was funded by the National Key R&D Program of China (2017YFC1501102), the National Natural Science Foundation of China (41977229 and 41907247), and the Sichuan Youth Science and Technology Innovation Research Team Project (2020JDTD0006).
Conflict of Interest
The authors declare that the research was conducted in the absence of any commercial or financial relationships that could be constructed as a potential conflict of interest.
Acknowledgments
Critical comments by the reviewers greatly improved the initial manuscript.
References
Aaron, J., and McDougall, S. (2019). Rock avalanche mobility: the role of path material. Eng. Geol. 257:105126. doi: 10.1016/j.enggeo.2019.05.003
Barbolini, M., Biancardi, A., Cappabianca, F., Natale, L., and Pagliardi, M. (2005). Laboratory study of erosion processes in snow avalanches. Cold Reg. Sci. Technol. 43, 1–9. doi: 10.1016/j.coldregions.2005.01.007
Chen, K. T., and Wu, J. H. (2018). Simulating the failure process of the Xinmo landslide using discontinuous deformation analysis. Eng. Geol. 239, 269–281. doi: 10.1016/j.enggeo.2018.04.002
Cuomo, S., Pastor, M., Capobianco, V., and Cascini, L. (2016). Modelling the space–time evolution of bed entrainment for flow-like landslides. Eng. Geol. 212, 10–20. doi: 10.1016/j.enggeo.2016.07.011
Dai, K., Xu, Q., Li, Z., Tomás, R., Fan, X., Dong, X., et al. (2019). Post-disaster assessment of 2017 catastrophic Xinmo landslide (China) by spaceborne SAR interferometry. Landslides 16, 1189–1199. doi: 10.1007/s10346-019-01152-4
Dong, J., Zhang, L., Li, M. H., Yu, Y. H., Liao, M. S., Gong, J. Y., et al. (2018). Measuring precursory movements of the recent Xinmo landslide in Mao County, China with Sentinel-1 and ALOS-2 PALSAR-2 datasets. Landslides 15, 135–144. doi: 10.1007/s10346-017-0914-8
Dufresne, A. (2012). Granular flow experiments on the interaction with stationary run-out path materials and comparison to rock avalanche events. Earth Surface Proces. Landf. 37, 1527–1541. doi: 10.1002/esp.3296
Fan, J. R., Zhang, X. Y., Su, F. H., Ge, Y. G., Tatolli, P., Yang, Z. Y., et al. (2017). Geometrical feature analysis and disaster assessment of the Xinmo landslide based on remote sensing data. J. Mount. Sci. 14, 1677–1688. doi: 10.1007/s11629-017-4633-3
Fan, X., Xu, Q., Scaringi, G., Dai, L., Li, W., Dong, X., et al. (2017). Failure mechanism and kinematics of the deadly June 24th 2017 Xinmo landslide, Maoxian, Sichuan, China. Landslides 14, 2129–2146. doi: 10.1007/s10346-017-0907-7
Friedmann, S. J., Taberlet, N., and Losert, W. (2006). Rock-avalanche dynamics: insights from granular physics experiments. Int. J. Earth Sci. 95, 911–919. doi: 10.1007/s00531-006-0067-9
Hart, R., Cundall, P. A., and Lemos, J. (1988). Formulation of a three-dimensional distinct element model—Part II. Mechanical calculations for motion and interaction of a system composed of many polyhedral blocks. Int. J. Rock Mech. Min. Sci. Geomech. Abstracts 25, 117–125. doi: 10.1016/0148-9062(88)92294-2
Herceg, M., Kvasnica, M., Jones, C. N., and Morari, M. (2013). “Multi-parametric toolbox 3.0,” in Proceeding of 2013 European Control Conference, Zurich: IEEE Press, 502–510.
Hu, K., Wu, C., Tang, J., Pasuto, A., Li, Y., and Yan, S. (2018). New understandings of the June 24th 2017 Xinmo Landslide. Maoxian, Sichuan, China. Landslides 15, 2465–2474. doi: 10.1007/s10346-018-1073-2
Hu, Y. X., Chen, M. L., and Zhou, J. W. (2019). Numerical simulation of the entrainment effect during mass movement in high-speed debris avalanches. Arab. J. Geosci. 12:14.
Hu, Y. X., Yu, Z. Y., and Zhou, J. W. (2020). Numerical simulation of landslide-generated waves during the 11 October 2018 Baige landslide at the Jinsha River. Landslides 17, 2317–2328. doi: 10.1007/s10346-020-01382-x
Huang, D., Li, Y. Q., Song, Y. X., Song, Y. X., Xu, Q., and Pei, X. J. (2019). Insights into the catastrophic Xinmo rock avalanche in Maoxian county, China: combined effects of historical earthquakes and landslide amplification. Eng. Geol. 258:105158. doi: 10.1016/j.enggeo.2019.105158
Hungr, O., and Evans, S. G. (2004). Entrainment of debris in rock avalanches: an analysis of a long run-out mechanism. Geol. Soc. Am. Bull. 116, 1240–1252. doi: 10.1130/b25362.1
Intrieri, E., Raspini, F., Fumagalli, A., Lu, P., Conte, S. D., Farina, P., et al. (2018). The Maoxian landslide as seen from space: detecting precursors of failure with Sentinel-1 data. Landslides 15, 123–133. doi: 10.1007/s10346-017-0915-7
Iverson, R. M., and Ouyang, C. (2015). Entrainment of bed material by Earth-surface mass flows: review and reformulation of depth-integrated theory. Rev. Geophys. 53, 27–58. doi: 10.1002/2013RG000447
Iverson, R. M., Reid, M. E., Logan, M., and Lahusen, P. (2011). Positive feedback and momentum growth during debris-flow entrainment of wet bed sediment. Nat. Geosci. 4, 116–121. doi: 10.1038/ngeo1040
Li, P., Shen, W., Hou, X., and Li, T. (2019). Numerical simulation of the propagation process of a rapid flow-like landslide considering bed entrainment: a case study. Eng. Geol. 263:105287. doi: 10.1016/j.enggeo.2019.105287
Li, W. C., Li, H. J., Dai, F. C., and Lee, L. M. (2012). Discrete element modeling of a rainfall-induced flowslide. Eng. Geol. 149, 22–34. doi: 10.1016/j.enggeo.2012.08.006
Liu, W., Wang, D., Zhou, J., and He, S. (2019). Simulating the Xinmo landslide runout considering entrainment effect. Environ. Earth Sci. 78:585.
Lu, P. Y., Yang, X. G., Xu, F. G., Hou, T. X., and Zhou, J. W. (2016). An analysis of the entrainment effect of dry debris avalanches on loose bed materials. SpringerPlus 5:1621.
Lucas, A., Mangeney, A., and Ampuero, J. (2014). Frictional velocity-weakening in landslides on Earth and on other planetary bodies. Nat. Commun. 5:3417. doi: 10.1038/ncomms4417
Luna, B. Q., Remaître, A., Van Asch, T. W. J., Malet, J. P., and van Westen, C. J. (2012). Analysis of debris flow behavior with a one dimensional run-out model incorporating entrainment. Eng. Geol. 128, 63–75. doi: 10.1016/j.enggeo.2011.04.007
Mangeney, A., Roche, O., Hungr, O., Mangold, N., Faccanoni, G., and Lucas, A. (2010). Erosion and mobility in granular collapse over sloping beds. J. Geophys. Res. 115:F03040. doi: 10.1029/2009JF001462
McDougall, S., and Hungr, O. (2005). Dynamic modelling of entrainment in rapid landslides. Can. Geotech. J. 42, 1437–1448. doi: 10.1139/t05-064
Ouyang, C., He, S., and Tang, C. (2015). Numerical analysis of dynamics of debris flow over erodible beds in Wenchuan earthquake-induced area. Eng. Geol. 194, 62–72. doi: 10.1016/j.enggeo.2014.07.012
Ouyang, C., Zhou, K., Xu, Q., Yin, J., Peng, D., Wang, D., et al. (2017). Dynamic analysis and numerical modeling of the 2015 catastrophic landslide of the construction waste landfill at Guangming, Shenzhen, China. Landslides 14, 705–718. doi: 10.1007/s10346-016-0764-9
Persson, P. O., and Strang, G. (2004). A simple mesh generator in MATLAB. SIAM Rev. 46, 329–345. doi: 10.1137/s0036144503429121
Pirulli, M. (2009). The Thurwieser rock avalanche (Italian Alps): description and dynamic analysis. Eng. Geol. 109, 80–92. doi: 10.1016/j.enggeo.2008.10.007
Sassa, K., Nagai, O., Solidum, R., Yamazaki, Y., and Ohta, H. (2010). An integrated model simulating the initiation and motion of earthquake and rain induced rapid landslides and its application to the 2006 Leyte landslide. Landslides 7, 219–236. doi: 10.1007/s10346-010-0230-z
Sherard, J. L., Woodward, R. J., and Gizienski, S. (1963). Earth and Earth-Rock Dams: Engineering Problems of Design and Construction. New York, NY: John Wiley & Sons Inc, 722.
Sovilla, B., Burlando, P., and Bartelt, P. (2006). Field experiments and numerical modeling of mass entrainment in snow avalanches. J. Geophys. Res. 111:F0300.
Teufelsbauer, H., Wang, Y., Chiou, M. C., and Wu, W. (2009). Flow–obstacle interaction in rapid granular avalanches: DEM simulation and comparison with experiment. Granul. Matter 11, 209–220. doi: 10.1007/s10035-009-0142-6
Wang, G., Huang, R., Chigira, M., Wu, X., and Lourenço, S. D. N. (2013). Landslide amplification by liquefaction of runout-path material after the 2008 Wenchuan (M 8⋅0) Earthquake. China. Earth Surface Process. Landf. 38, 265–274. doi: 10.1002/esp.3277
Wang, W., Yin, Y., Yang, L., Zhang, N., and Wei, Y. (2020). Investigation and dynamic analysis of the catastrophic rockslide avalanche at Xinmo, Maoxian, after the Wenchuan Ms 8.0 earthquake. Bull. Eng. Geol. Environ. 79, 495–512. doi: 10.1007/s10064-019-01557-4
Wu, J. H., Lin, W. K., and Hu, H. T. (2017). Assessing the impacts of a large slope failure using 3DEC: the Chiu-fen-erh-shan residual slope. Comput. Geotech. 88, 32–45. doi: 10.1016/j.compgeo.2017.03.002
Xu, Q., Li, W., Dong, X., Xiao, X., Fan, X., and Pei, X. (2017). The Xinmocun landslide on June 24, 2017 in Maoxian, Sichuan: characteristics and failure mechanism. Chin. J. Rock Mech. Eng. 36, 2612–2628.
Yin, Y. P., Wang, F. W., and Sun, P. (2009). Landslide hazards triggered by the 2008 Wenchuan earthquake. Sichuan, China. Landslides 6, 139–152. doi: 10.1007/s10346-009-0148-5
Zhang, M., Wu, L., Zhang, J., and Li, L. (2019). The 2009 Jiweishan rock avalanche, Wulong, China: deposit characteristics and implications for its fragmentation. Landslides 16, 893–906. doi: 10.1007/s10346-019-01142-6
Zhou, J. W., Cui, P., and Hao, M. H. (2016). Comprehensive analyses of the initiationand entrainment processes of the 2000 Yigong catastrophic landslide in Tibet, China. Landslides 13, 39–54. doi: 10.1007/s10346-014-0553-2
Keywords: landslide, mass movement, entrainment, dynamic analysis, discreet element method
Citation: Chen Q, Fan G and Zhou J-w (2020) Numerical Simulation of the 2017 Xinmo Catastrophic Landslide Considering Entrainment Effect. Front. Earth Sci. 8:537800. doi: 10.3389/feart.2020.537800
Received: 03 March 2020; Accepted: 13 August 2020;
Published: 14 October 2020.
Edited by:
Reginald Leonhard Hermanns, Geological Survey of Norway, NorwayReviewed by:
Jordan Balfour Aaron, ETH Zürich, SwitzerlandMarco Neri, National Institute of Geophysics and Volcanology, Section of Catania, Italy
Copyright © 2020 Chen, Fan and Zhou. This is an open-access article distributed under the terms of the Creative Commons Attribution License (CC BY). The use, distribution or reproduction in other forums is permitted, provided the original author(s) and the copyright owner(s) are credited and that the original publication in this journal is cited, in accordance with accepted academic practice. No use, distribution or reproduction is permitted which does not comply with these terms.
*Correspondence: Jia-wen Zhou, and6aG91QHNjdS5lZHUuY24=