
95% of researchers rate our articles as excellent or good
Learn more about the work of our research integrity team to safeguard the quality of each article we publish.
Find out more
ORIGINAL RESEARCH article
Front. Earth Sci. , 03 December 2020
Sec. Cryospheric Sciences
Volume 8 - 2020 | https://doi.org/10.3389/feart.2020.530997
This article is part of the Research Topic Observational Assessments of Glacier Mass Changes at Regional and Global Level View all 12 articles
 Lidia Ferri1*
 Inés Dussaillant2,3Laura Zalazar1Mariano H. Masiokas1
 Lucas Ruiz1
 Pierre Pitte1Hernán Gargantini1
 Mariano Castro1
 Etienne Berthier2
 Ricardo Villalba1
Based on the recently released National Glacier Inventory (NGI), we analyzed the characteristics and the mass balance rates of ice masses in the Argentinean Central Andes (ca. 30°–37° S). The NGI provides unprecedented information on area, number and distribution of different ice masses, including debris-covered glaciers and rock glaciers. In the Central Andes, a number of 8,076 ice masses were identified covering a total area of 1767 km2. For the period 2000–2018, a general lowering of the ice surface was observed with a region-wide mass balance rate of −0.18 ± 0.19 m w.e. yr−1. Clear differences depending on the debris coverage of the different ice masses were identified, with mass balance rates ranging from −0.36 ± 0.19 m w.e. yr−1 for partly debris-covered glaciers to −0.02 ± 0.19 m w.e. yr−1 for rock glaciers. Considering different sub-periods, the region-wide mass balance rate was slightly positive (+0.12 ± 0.23 m w. e. yr−1) from 2000 to 2009 and negative (−0.21 ± 0.30 m w.e. yr−1) from 2009 to 2018. A comparison with the Randolph Glacier Inventory (RGI version 6.0) indicates that the NGI provides more detailed information regarding different type of ice masses whereas region-wide mass balance rates show limited sensitivity to the choice of the inventory. The inclusion of rock glaciers and “debris-covered ice with rock glacier” in the NGI causes mass balance rates to be slightly less negative than when using the RGI. Since the Central Andes are experiencing an unprecedented decade-long drought, our study provides crucial information to estimate current and future hydrological contribution of the different type of ice masses to river discharge in the arid subtropical Andes.
Comprehensive and detailed glacier inventories provide important reference datasets for assessing the current status and estimating the recent and future glacier changes (Paul et al., 2013; Vaughan et al., 2013). In recent decades, with the development of satellite remote sensing techniques, more precise and standardized glacier outlines have been produced from optical satellite imagery, permitting the mapping of glaciers at a regional scale with high accuracy (Nagai et al., 2016; Meier et al., 2018; Mölg et al., 2018). Argentina is the second country in the Southern Andes with the largest glacierized area (WGMS, 2020). Previous inventories for the Argentinean Andes were mostly local (Pitte et al., 2010; WGMS, 2012; Masiokas et al., 2015; Falaschi et al., 2016). The recent National Glacier Inventory of Argentina (hereafter NGI), conducted by IANIGLA-CONICET in accordance with the National Law 26,639 for glacier protection in Argentina, provides a comprehensive dataset and detailed outlines of all Argentinean ice masses (Zalazar et al., 2020). The NGI, developed following international standards (UNESCO-IASH, 1970; Raup et al., 2007; Kargel, 2014), identified 16,078 ice masses covering a total area of 5,769 km2 in the Andes of Argentina. Until the publication of the NGI (Zalazar et al., 2020), the Randolph Glacier Inventory (RGI; Pfeffer et al., 2014) was the only glacier inventory considering the entire Argentinean Andes; still, some debris-covered glaciers and rock glaciers were not classified as this was not part of the RGI objectives.
In the Central Andes of Chile and Argentina ice masses play an important hydrological role providing meltwater during the dry season (austral summer) and during droughts periods (Gascoin et al., 2011; Ayala et al., 2016; Rivera et al., 2017). Since 2010 this region has experienced an unprecedented drought (commonly known as the “mega-drought”) that has severely affected the water supply at both sides of the Andes (Rivera et al., 2017; Garreaud et al., 2019; Masiokas et al., 2019). Regional glacier melt contributed to mitigate the negative impacts of this unprecedented long dry period (Dussaillant et al., 2019).
As observed elsewhere in the Andes, most glaciers in the Central Andes of Chile and Argentina, have experienced a generalized retreating pattern during the last decades (Masiokas et al., 2009; Barcaza et al., 2017). For example, in the Aconcagua river basin (Chile), the total glacier area reduction was ca. 20% between 1955 and 2003 (Bown et al., 2008). Similarly, Malmros et al. (2016), detected a ca. 30% glacier reduction between 1955 and 2013/14 in the Central Andes of Chile and Argentina. Continuous measurements at the Echaurren Norte glacier in Chile provide the longest (>30 years) record of glacier variations including a complete in-situ mass balance time series (Masiokas et al., 2016; Farías-Barahona et al., 2019). The Echaurren Norte glacier experienced a significant downwasting from 1955 to 2015, with a total cumulative glacier-wide mass balance of −40.64 m w.e. (Farías-Barahona et al., 2019). The cumulative glaciological mass balance for the Piloto Este glacier during 1979–2003 amounted −10.5 m w.e. (Leiva et al., 2007). Besides these two mass balance series, in-situ observations of glacier mass balance still remain scarce for the region, with most of the records starting after 2010 (Kinnard et al., 2018; Pitte et al., 2018). More recently, geodetic mass balance observations have been used to estimate changes in glacier volumes over large glaciated regions (Falaschi et al., 2018b; Braun et al., 2019; Burger et al., 2019; Dussaillant et al., 2019). Two recent Andes-wide geodetic mass balance assessments identified continuous mass loss along the entire Andes after the year 2000, showing a marked latitudinal pattern of glacier mass change rates (Braun et al., 2019; Dussaillant et al., 2019). In this study, we combine the glacier elevation change rates obtained by Dussaillant et al. (2019) with the recently released NGI to calculate the mass balance of all the ice masses of the Central Andes of Argentina over the 2000–2018 period, and the 2 decades within, 2000–2009 and 2009–2018 sub-periods.
The goals of the present study are three-fold: 1) Analyze the main characteristics of the different ice masses identified in the NGI of the Central Andes of Argentina, focusing especially on the presence of debris coverage and rock glaciers, and compare these results with those provided by the RGI version 6.0 for the same region; 2) revise the geodetic mass balance estimates from Dussaillant et al. (2019) using the improved NGI; and 3) compare the mass balance rates of the different NGI ice masses in relation to their percentage of debris coverage.
Following Lliboutry (1998), the Argentinean NGI was divided into five glaciological regions. The Central Andes of Argentina are located between ca. 30°S and 37°S and can be characterized by a semi-arid climate with precipitation largely concentrated during the austral winter season. Precipitation events are associated with passing fronts embedded in the mid-latitude Westerly flow and enhanced by the orographic effect of the Andes Mountains (Garreaud et al., 2009; Viale et al., 2019). Overall environmental conditions in this region can be considered as transitional between those in the Desert Andes to the north, and the northern Patagonian Andes to the south. Surging glaciers have been detected in the Central Andes (Pitte et al., 2016; Falaschi et al., 2018a) as well as glaciers on both extinct (e.g., Tupungato, 6,635 m a.s.l) and extremely active volcanoes (e.g., Peteroa, 4,113 m a.s.l).
According to Sagredo and Lowell (2012), ice masses in the Central Andes of Chile and Argentina can be climatically arranged in two latitudinal-distributed groups. A first northern group located around 30°–31°S with precipitation (∼300 mm/yr) evenly distributed throughout the year (slightly higher during the winter months) and with the coldest mean annual temperatures reported for the Andes (ca. −4.5°C). In the second group of glaciers, located between ca. 32° and 37°S, precipitation is concentrated during the austral winter months (∼700 mm/yr) and mean annual temperatures are around 0°C (Sagredo and Lowell, 2012). The snowline along the Andes decreases from ∼5,000 to ∼3,200 m a.s.l. from north to south (Nogami, 1972). South of 35°S, the mean elevation of the Cordillera decreases with latitude, and the glacier area is comparatively smaller than further north (Zalazar et al., 2020).
A total of seven large hydrological basins were delimited in the Central Andes of Argentina. From north to south they are: the San Juan, Mendoza, Tunuyán, Diamante, Atuel, Llancanelo and Colorado rivers basins (Figure 1). The San Juan basin is the northernmost catchment (30–32°S) with one of the highest summits in the region, the Cerro Mercedario (6,770 m a.s.l). Further south, the Mendoza river basin (32–33°S), contain the highest peak of the Americas, the Cerro Aconcagua (6,961 m a.s.l.). The two better studied surging glaciers in Argentina, the Horcones Inferior and Grande del Nevado glaciers, are also located in this basin (Pitte et al., 2016). The Tunuyán river basin (33–34°S), contains the San Jose volcano (6,070 m a.s.l.) and, together with the Mendoza basin, contain the two of the most important irrigated “oases” and the largest population centers east of the Central Andes in Argentina. The Diamante river basin (around 34°S) contains the Maipo volcano (5,318 m a.s.l.) and a large high elevation lagoon at its base. Further south, in the Atuel river basin (34–35°S), historical documents indicate that the Humo glacier retreated approximately 3.2 km between 1914 and 1947 (Cobos and Boninsegna, 1983), showing one of the largest glacial retreats documented during the first half of the 20th century in the region. The headwaters of the Llancanelo basin (35°S) are situated along a small mountain range to the east of the main Cordillera. In the Colorado river basin (34–37°S), the mass balance of the Azufre glacier has been monitored since 2017 using the glaciological method (Pitte et al., 2018). South of 35°S in the Colorado river basin the presence of ice masses is mostly associated with volcanoes such as the Tromen (4,114 m a.s.l.) and the Domuyo (4,702 m a.s.l.).
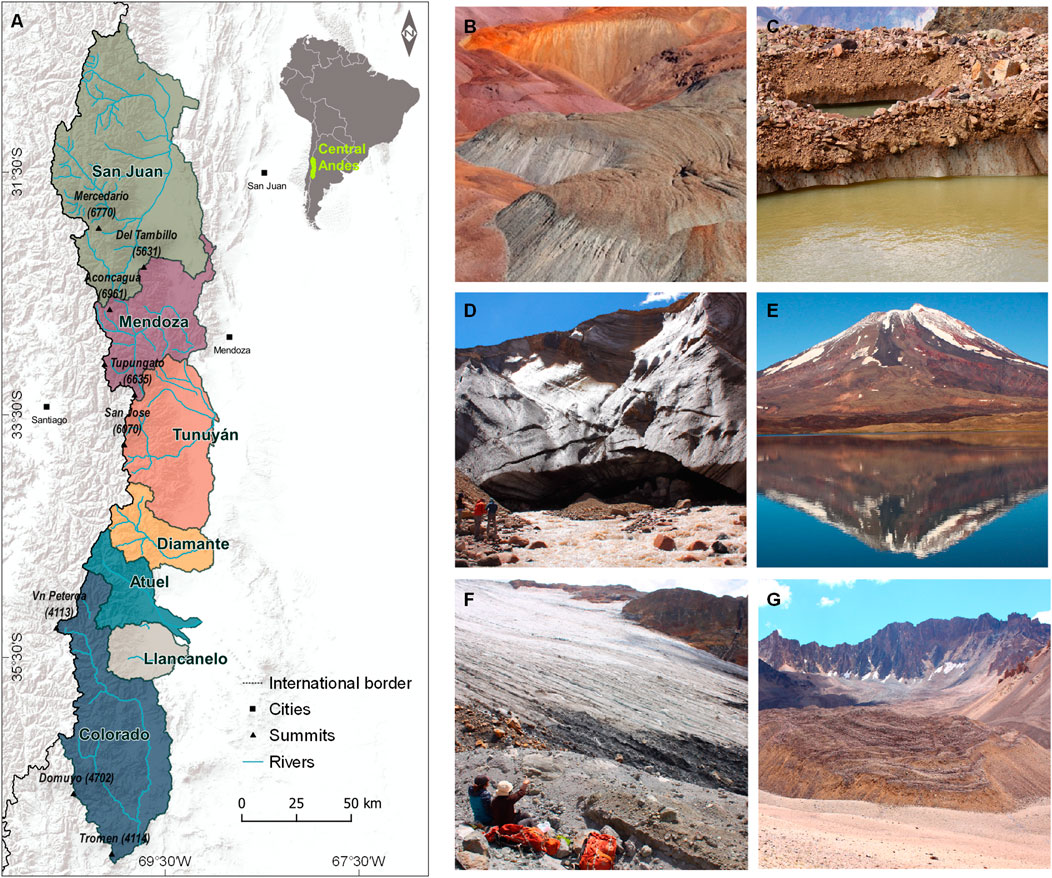
FIGURE 1. (A) Map of the main river basins in the Central Andes of Argentina. (B–G) Some examples of the ice masses that can be found in this region (B) The Calingasta rock glacier, San Juan basin. (C) Thermokarst in a debris-covered glacier, Mendoza basin. (D) Proglacial stream and ice front of the Tunuyán glacier, the largest glacier in the Central Andes of Argentina. Note the debris cover at the glacier surface, Tunuyán basin. (E) Clean ice glaciers and perennial snowfields in the Maipo volcano area, Diamante basin. (F) The Azufre glacier, Colorado basin. Since 2010 the glacier is partially covered by a thin layer of ash due to the eruption of the neighboring Peteroa volcano. (G) Debris-covered ice with rock glacier, Llancanelo basin. (Photos: M. Castro, IANIGLA).
The NGI of Argentina targeted different ice masses that represent strategic water reserves according to the National Law 26,639 (Zalazar et al., 2020) and includes: glaciers (both clean ice and debris-covered ice), glacierets or perennial snowfields and rock glaciers (active and inactive). Following international guidelines, the minimum area for an ice mass to be included in the NGI was 0.01 km2 (Paul et al., 2009; RGI Consortium, 2017b). In the Central Andes of Argentina, the NGI was based on medium spatial resolution satellite images such as ASTER (28 scenes), ALOS-AVNIR (20 scenes) and LANDSAT 5 (1 scene) acquired between 2007 and 2011. A supervised classification was applied to the selected images to detect and delineate clean ice and perennial snowfields. Debris-covered ice and rock glaciers were delimited by visual interpretation and manual digitization. High resolution images were also used to improve the delineations (e.g. ALOS-PRISM, CBERS-HRC and Google Earth). The classification and morphological parameters of each ice mass are included into a database with a total of 38 attributes following international guidelines (UNESCO-IASH, 1970; Rau et al., 2005). The NGI includes an additional category termed “debris-covered ice with rock glacier” that represents a transitional phase where debris-covered ice gradually transforms into rock glaciers with no clear boundary between these surfaces (Zalazar et al., 2020). Additional fields were added to classify rock glaciers considering their origin, activity, form and structure. To improve the mapping quality and assess the activity of rock glaciers, a total of 598 ice masses where directly surveyed in the field during austral summers from 2012 to 2015. See Zalazar et al. (2020) for more details on materials and methods used in the NGI.
In this study, an additional field was included in the dataset to account for the percentage of debris-cover. This classification ranges from 0% for debris free glaciers, 10–50% for partly debris-covered ice (Figure 2A), 50–90% for mostly debris-covered ice and >90% for completely debris-covered ice. The same classification was used for “debris-covered ice with rock glacier” category (Figures 2B,C). Rock glaciers are considered as an independent category, completely covered by debris with no visible ice on the surface (Figure 2D).
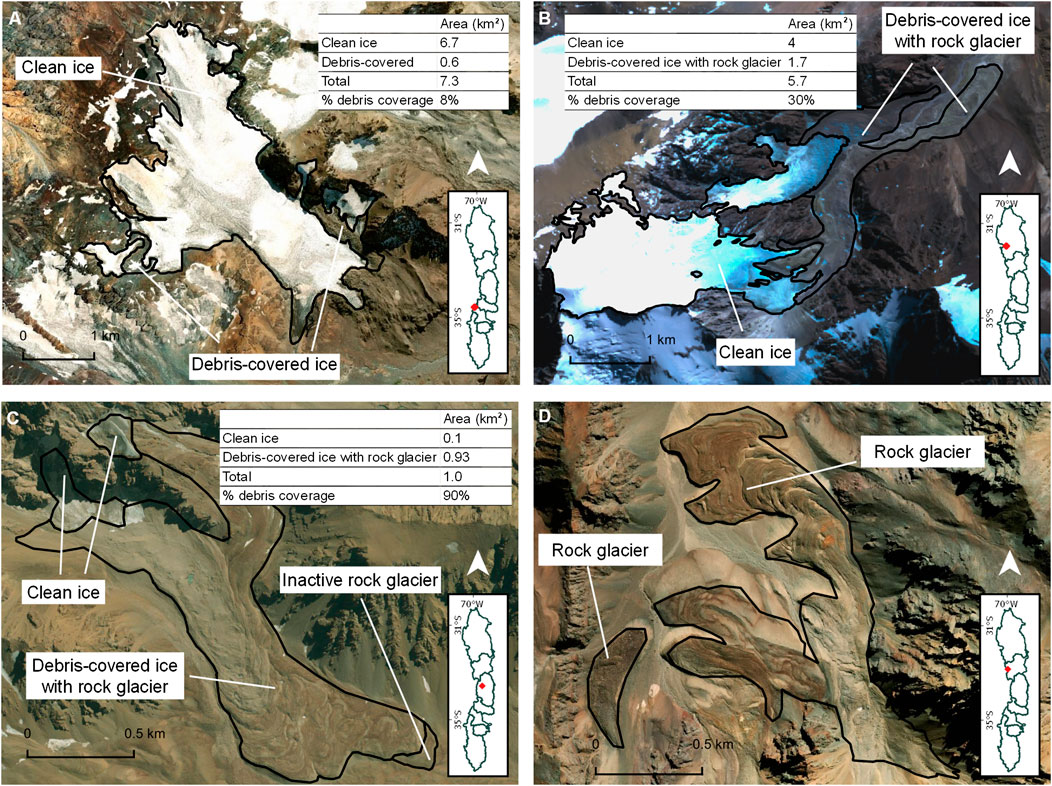
FIGURE 2. Examples of ice masses showing the wide range of debris coverage that can be found in the study area. (A) Partly debris-covered glacier (8%) in the Atuel basin. (B) Partly debris-covered ice with rock glacier (30% debris coverage) in the San Juan basin. (C) Completely debris-covered ice with rock glacier (90% debris) in the Tunuyán basin. (D) Rock glacier (considered 100% covered by debris) in the Mendoza basin.fx.
The RGI data were obtained from the GLIMS’s website https://www.glims.org/. We used the RGI version 6.0 (hereafter RGI) to compare with the NGI outlines. According to the RGI documentation, the glacier outlines for the Central Andes were created from Landsat seven ETM + imagery acquired between 2000 and 2003. Version 6.0 includes some upgrades such as images of better quality to reduce the presence of seasonal snow. However, the ice cover for this region may still be overestimated (RGI Consortium, 2017). It is also important to note that rock glaciers are not explicitly included in this dataset as the main focus of the RGI is to provide a near global picture of glaciers for large-scale assessments.
Ice mass changes for the periods 2000–2018, 2000–2009 and 2009–2018, were calculated using the “ASTER monitoring of Ice towards eXtinction” geodetic method (hereafter the ASTERIX method, Dussaillant et al., 2019), for both the NGI and the RGI inventories. Individual glacier mass balance rates reported here for the RGI are the same as those reported by Dussaillant et al. (2019). Results for the NGI inventory were calculated from the original ASTERIX elevation change grids using the newer outlines. The ASTERIX method calculates surface elevation changes using times series of digital elevation models (DEMs) obtained from Advanced Spaceborne Thermal Emission and Reflection Radiometer (ASTER) stereo images (Wang and Kääb, 2015; Berthier et al., 2016). This methodology has been validated in different glaciated regions of the world with different climatic contexts and glacier types (Brun et al., 2017; Berthier et al., 2018; Menounos et al., 2019) including the Andes (Dussaillant et al., 2018). ASTERIX elevation changes rates in the Central Andes were derived from a mean for 26 DEMs, with 92% of the total glacierized area covered with valid elevation change measurements. Mass balance rates were estimated for every individual ice mass using the local hypsometric approach (McNabb et al., 2019) over 100 m elevation bands. Data gaps in the elevation change grids were filled on an individual ice mass basis using the mean rate of elevation change of the corresponding elevation bin. Elevation change outliers were also excluded and replaced by the mean elevation change of every bin. The glacier-wide volume change rate was calculated as the sum of the mean elevation changes multiplied by the area of each elevation band. The corresponding mass balance rates were computed assuming a volume to mass conversion factor of 850 ± 60 kg m−3 (Huss, 2013). Uncertainty on the glacier mass balance is calculated as a random error derived from three independent sources: the uncertainties in the rate of elevation change, the volume-to-mass-conversion factor and the glacierized area (Rolstad et al., 2009; Fischer et al., 2015). For larger regions (e.g., basin-wide or region-wide), the mass balance rates were calculated as the area weighted sum of all ice masses contained in the basin/region. The few ice masses with no valid elevation change rates, and thus presenting no mass balance rate estimate (5% of glacier covering only 1% of the total glacier surface), were assumed to respond with the regional mean mass balance rate. As in Dussaillant et al. (2019), the regional uncertainty was calculated as the quadratic sum of the regional random and triangulation uncertainty, both calculated considering all glaciers as one ice body. For more details in the methodology and uncertainty assessment of the ASTERIX elevation change grids used here we refer the reader to Dussaillant et al. (2019).
The NGI in the Central Andes of Argentina includes a total of 8,076 ice masses covering 1767 km2 (Figure 3). This is the largest number of ice masses per region in the Argentinean Andes, and the second largest area covered by glaciers after the Southern Patagonia Andes (Zalazar et al., 2020). In terms of numbers, the most abundant type of ice masses are rock glaciers (68%). This region constitutes one of the places where rock glaciers are most abundant worldwide (Brenning, 2005; Blöthe et al., 2019). The majority (86%) of these rock glaciers were classified as active and 14% as inactive. The second most abundant category are perennial snowfields (20%) followed by glaciers (includes mountain and valley type glaciers) with a 12%. In terms of area, however, glaciers occupy 65% of the total, followed by rock glaciers (31%) and perennial snowfields (4%).
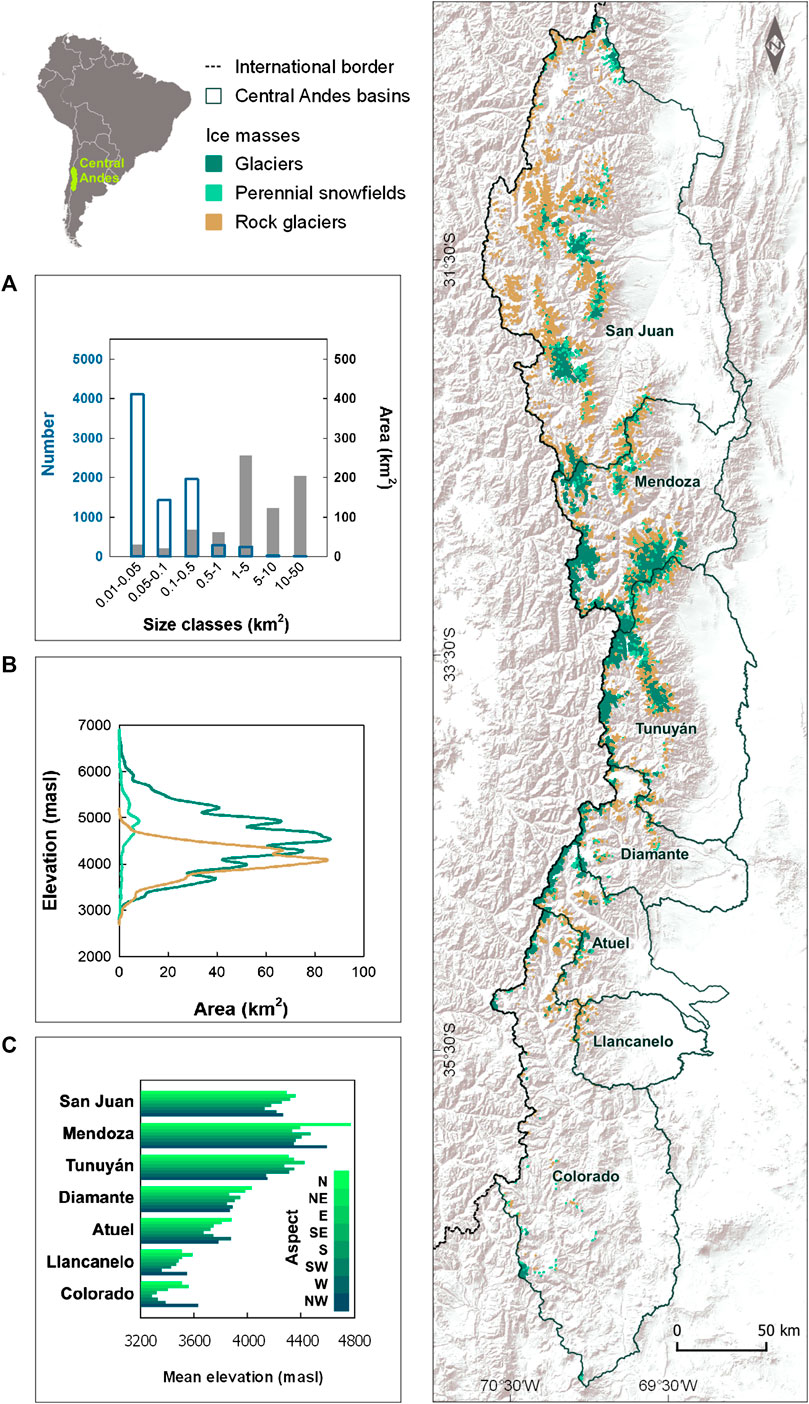
FIGURE 3. Inventory of ice masses in the Central Andes of Argentina. (A) Distribution and number of ice masses according to their size. (B) Hypsometry of the different types of ice masses. (C) Mean elevation and aspect of the ice masses in the different river basins.
Most of the ice masses presented in this region are smaller than 1 km2 (96%), half of them with areas between 0.01 and 0.05 km2. The number of ice masses decreases markedly as size increases; only 14 ice masses cover 16% of the total inventoried area (Figure 3A). The largest ice masses correspond to valley glaciers that in some cases can reach areas of 10–60 km2, lengths of 10–18 km, and a vertical gradient of up to 2,500 m. Most of the tongues of the valley glaciers are debris-covered, or “debris-covered with rock glacier.” The largest rock glaciers in Argentina were identified in this region, reaching in some cases over 2 km2. The ice masses in the study region range between 2,600–2,800 and 6,700–6,800 m a.s.l., but the largest amount of ice is concentrated around 4,500 m a.s.l (Figure 3B). This wide altitudinal range is related to the high elevation of the Andes at these latitudes. The region hosts the highest ice bodies in the Americas (6,700–6,800 m a.s.l.), i.e. the hanging glaciers on the south face of Cerro Aconcagua. Some perennial snowfields and the accumulation areas of valley glaciers also reach high altitudes. In general, the northernmost basins (San Juan, Mendoza and Tunuyán) contain the highest glaciers and rock glaciers (Figure 3C). The ice masses with the lowest elevations (2,600–2,800 m a.s.l.) correspond to inactive rock glaciers and some perennial snowfields. These low elevations are recorded at the southernmost part of the region, where the Andes gradually decrease in elevation but receive larger amounts of precipitation. The San Juan, Mendoza and Tunuyán river basins also contain the largest ice masses and the greatest concentration of rock glaciers in this region. Similar to other Andean regions, ice masses are usually more frequent on the south and south-east facing slopes, where snow persistence is favored by the lower insolation compared to those facing to the north. The ice masses mean elevation in relation to the aspect indicates that northeast and northwest oriented ice masses show the highest elevations, while those on the southern and southeastern slopes reach the lowest altitudes (Figure 3C).
Debris-covered ice is an important characteristic of this region: 59% of the total inventoried area presents some degree of debris coverage (Figure 4; Table 1). Only 10% of the inventoried area corresponds to clean ice or perennial snowfields with no debris coverage. The remaining 31% corresponds to rock glaciers. It is interesting to note that the most common type of ice mass and the percentage of debris coverage also change with latitude (Table 1; Figure 4). The percentage of area covered by debris and by rock glaciers show a generalized decrease from north to south, with the exception of Llancanelo basin. The highest percentage of rock glaciers (53%) occurs at the northernmost San Juan basin (between ca. 30° and 32°S). Further south in the Mendoza, Tunuyán and Diamante basins (ca. 32°–34°), debris-covered ice and rock glaciers are still dominant, but the percentages of clean ice glaciers (including glaciers and perennial snowfields) increases in comparison with the northern San Juan basin. From the Atuel basin to the south (ca. 34°-35°S), the proportions of clean ice glaciers and snowfields increase markedly. This is also true for the southernmost Colorado basin (34°–37°S) which limits with the northern Patagonian Andes. Located in a drier environment east of the Colorado basin, the Llancanelo basin does not fit this regional pattern (Figure 1). The lowest elevation and the lowest humidity from the west that reaches this basin result in a much larger proportion of rock glaciers and “debris-covered ice with rock glacier” category, which represents the 98% of the total inventoried area. This basin presents characteristics more similar to those recorded in the northern part of the study area, where rock glaciers are also predominant.
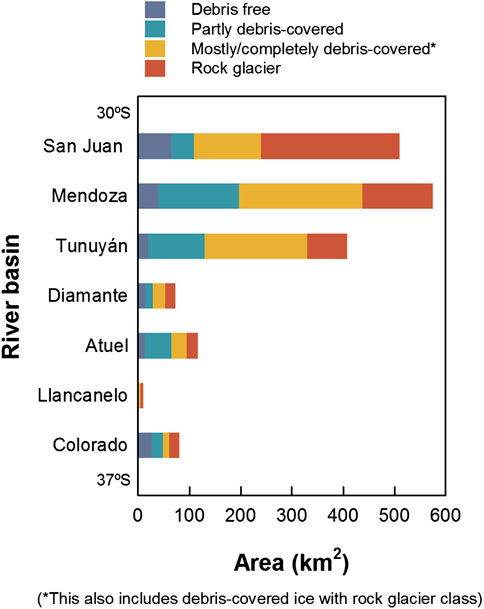
FIGURE 4. Different debris coverage in glaciers and rock glaciers in the Central Andes basins of Argentina. “Debris-covered ice with rock glacier” corresponds to the new category included in the NGI of Argentina.
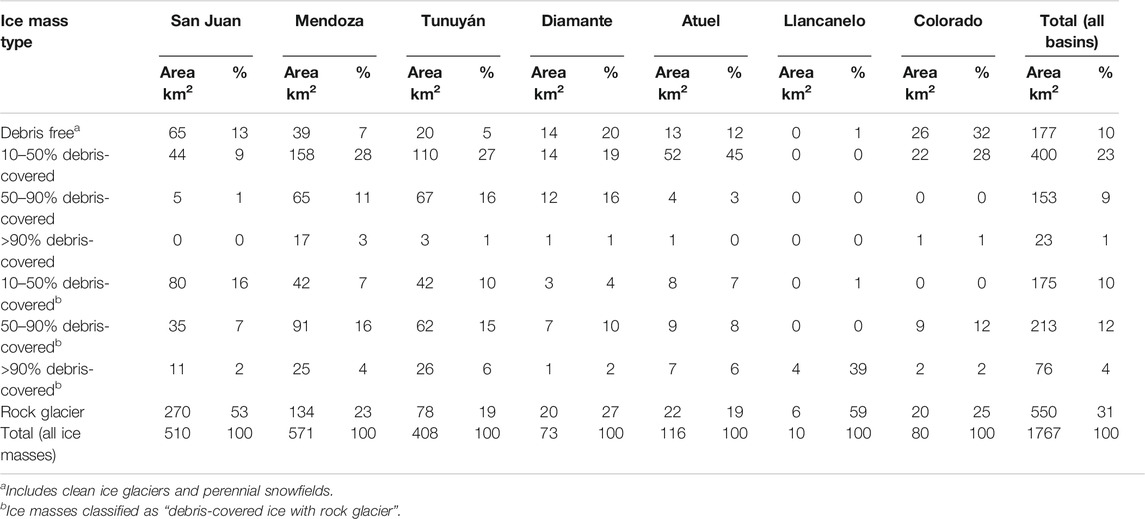
TABLE 1. Glacier area for different types and debris coverage in the main river basins of the Central Andes of Argentina. Percentages refer to total glacier area (all types) in each basin.
Based on the ASTERIX methodology and the NGI dataset we found a thinning trend of the ice surface in the Central Andes during the period 2000–2018, with a regional mean mass balance rate of −0.18 ± 0.19 m w.e. yr−1. From all ice masses, partly debris-covered glaciers and clean ice glaciers exhibited the most negative mass balance rates (−0.36 ± 0.19 and −0.31 ± 0.19 m w.e. yr−1, respectively). Contrarily, mostly debris-covered glaciers, completely debris-covered and rock glaciers, underwent considerably lower mass losses and slightly negative or stable mass balances rates (−0.12 ± 0.18, −0.07 ± 0.19 and −0.02 ± 0.19 m w.e. yr−1, respectively; Figure 5A). The strongest negative mass balance rates of −0.56 ± 0.20 m w.e. yr−1 resulted in the Colorado basin. In contrast, the less negative mass balance rates of −0.08 ± 0.18 m w.e. yr−1 were registered in the San Juan river basin. This suggest a general latitudinal pattern with a southern increase in ice mass loss, mirroring the increase of clean ice surface. The Llancanelo basin is the only exception to this latitudinal pattern, probably a consequence of the predominance of debris-covered glaciers and rock glaciers at this location (Figure 5B).
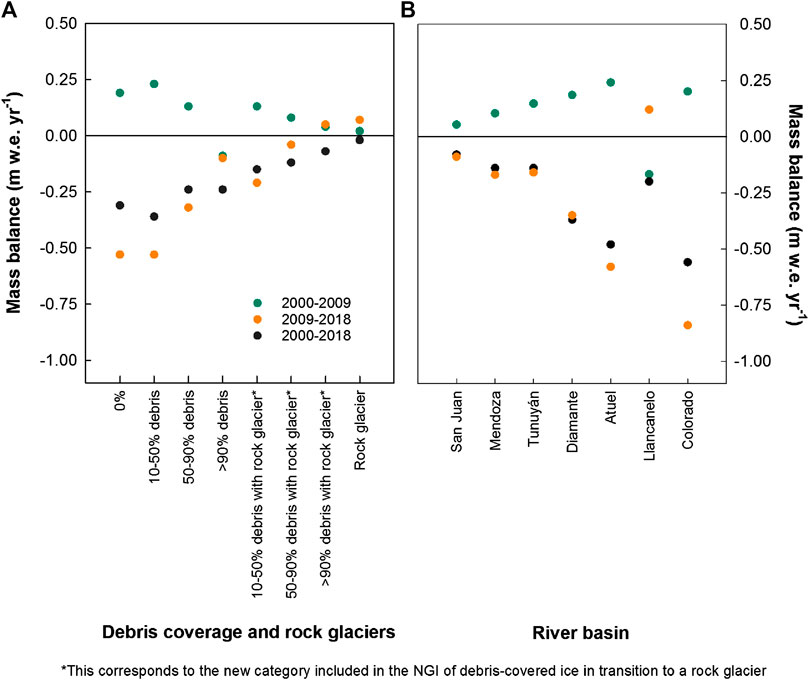
FIGURE 5. (A) Mass balance rates for different ice masses based on the percentage of debris coverage for the period 2000–2018 and for the sub-periods 2000–2009 and 2009–2018. (B) Mass balance rates averaged for the main river basins in the study area.
An evident inter-decadal shift in mass balance rates was recorded for the region (Figure 5). During the 2000–2009 decade, regional mass balance rates were slightly positive, reaching +0.12 ± 0.23 m w.e. yr−1. Positive mass balance rates are consistent for all basins except for Llancanelo (−0.17 ± 0.25 m w. e. yr−1, Figure 5B). Similarly, almost all the independent ice mass types experienced positive mass balance rates during this period, except for the completely debris-covered glaciers, registering a close to zero mass balance rate of −0.09 ± 0.22 m w.e. yr−1 (Figure 5A).
A notable change in this pattern was observed for the 2009–2018 decade, with all ice masses shifting towards more negative mass balance rates (Figure 5), and a mean regional mass loss of −0.21 ± 0.30 m w.e. yr−1. Clean ice glaciers and partly debris-covered glaciers experienced the largest mass losses, amounting to −0.53 ± 0.26 and −0.53 ± 0.21 m w.e. yr−1 respectively. Conversely, completely debris-covered with rock glaciers and rock glaciers showed slightly positive mass balance rates of +0.05 ± 0.22 and +0.07 ± 0.21 m w.e. yr−1, respectively. During this period nearly all basins in the Argentinean Central Andes showed consistent negative glacier mass balance rates, again with the exception of the Llancanelo basin, presenting positive rates of +0.12 ± 0.26 m w.e. yr−1 (Figure 5B). Examples of the changes in elevation maps for the long period 2000–2018 and the two sub-periods can be observed in Figure 6 for three different glacier subsets located in different basins. A clear trend from positive to negative changes in elevation rates between decades can be readily observed for the three subsets.
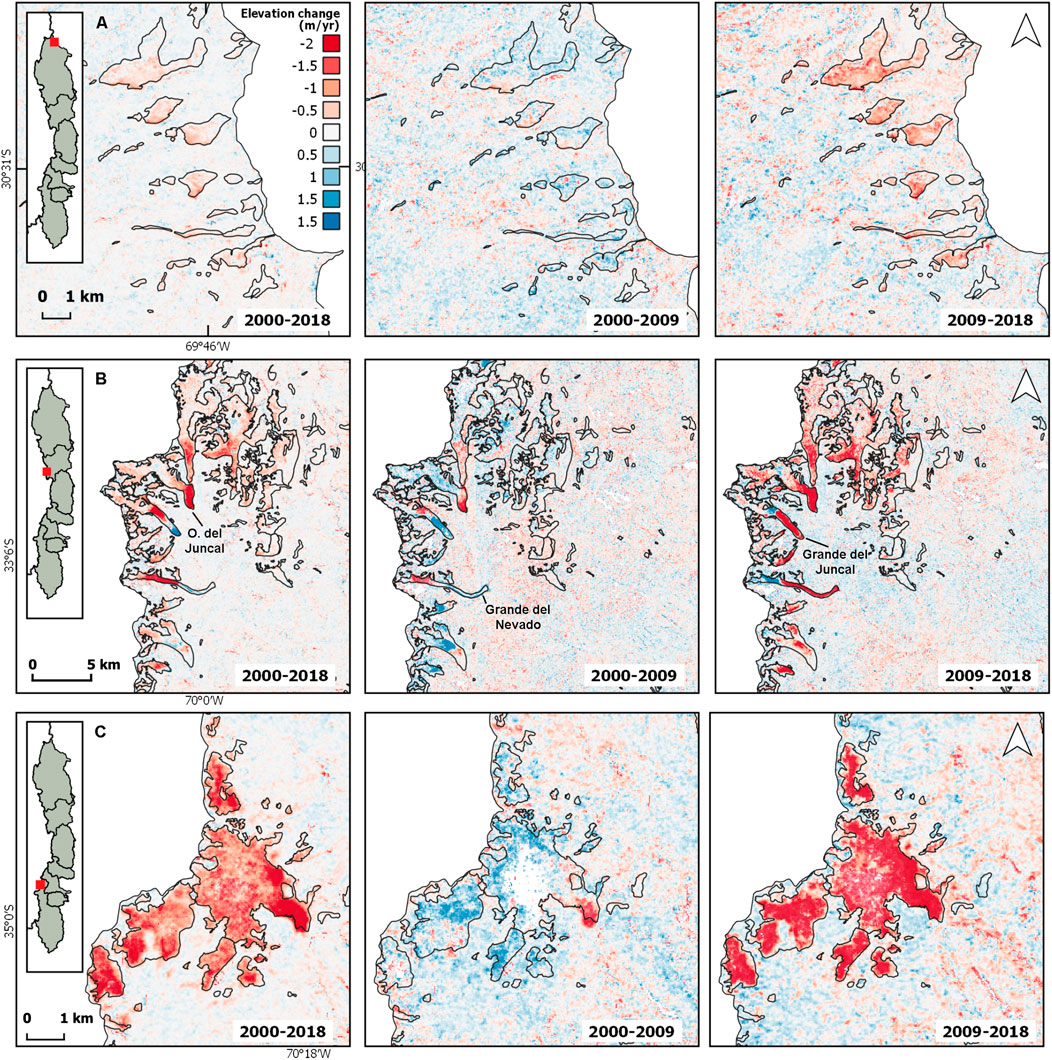
FIGURE 6. Examples of elevation changes in different areas of the Central Andes for different sub-periods. NGI glacier outlines are shown in black lines. (A) Small mountain glaciers and perennial snowfields in San Juan basin. (B) Large valley glaciers in Mendoza basin, some of them classify as surging glaciers. (C) Mountain and valley glaciers in Atuel basin.
The mass balances of some prominent glaciers in the Central Andes of Argentina are shown in Table 2. The list includes some of the ice masses with the largest overall lowering rates in the region as the Azufre, Peñón and Grande del Nevado glaciers. During the complete period 2000–2018, the Azufre and Peñón glaciers lost −1.5 ± 0.15 and −1.4 ± 0.13 m w.e. yr−1, respectively (Table 2). The Grande del Nevado glacier, a well-documented surging glacier (Helbling, 1935; Pitte et al., 2016), also experienced a strong negative mass balance. Its last surging event was registered during 2006-2007, concurrent with the decade (2000–2009) of positive mass balances across the Central Andes. Afterwards, a general down-wasting was observed during the 2009–2018 period (−0.97 ± 0.16 m w.e. yr−1), related to a quiescent phase of this glacier (Pitte et al., 2016). The mass balance rates for the surging glaciers in this region during the period 2000–2018 was −0.30 ± 0.19 m w.e. yr−1. This mean value is more negative but not statistically different than the mean recorded for the non-surging glaciers (−0.17 ± 0.19 m w. e. yr−1) over the same period in this region. Elevation changes for several of the surging glaciers listed in Table 2 are depicted in Figure 6B.
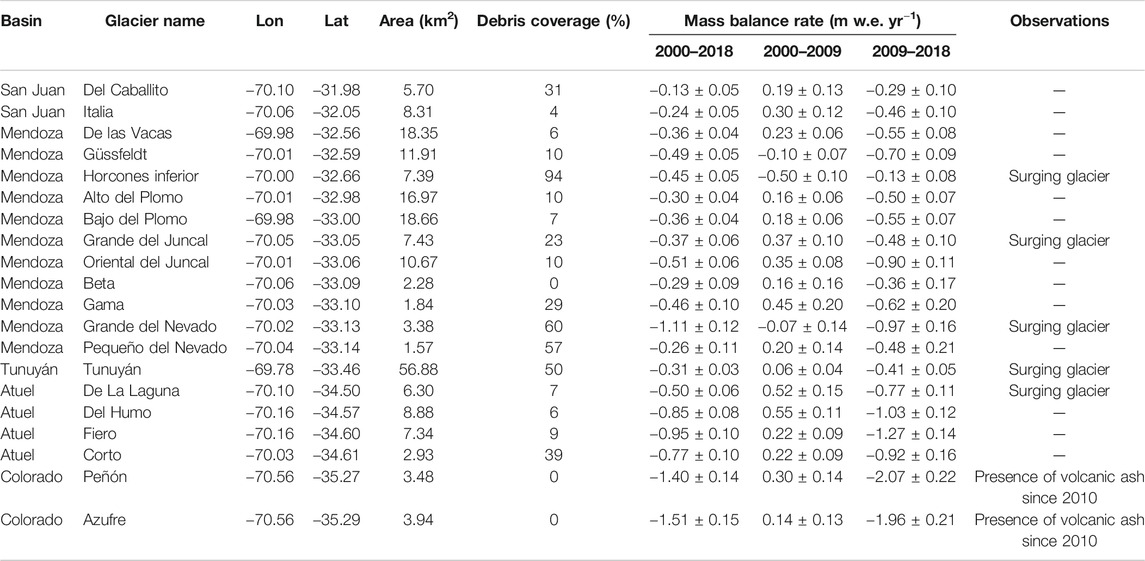
TABLE 2. Mass balance rates calculated for particular ice masses with different percentages of debris coverage.
In the Central Andes of Argentina, the RGI version 6.0 contains 1,135 glaciers covering a total area of 1,085 km2. In total, 6,941 more ice masses and 682 km2 of inventoried area were identified in the NGI (Figure 7A). For example, in the San Juan river basin alone, the NGI recorded 3,810 ice masses (i.e., 47% of the total number of units in the entire region), almost three times more units than those represented in the RGI (Figure 7B). As for the glacierized area, the RGI seems to have overestimated the glacier surface in some particular locations probably due to the use of scenes with presence of seasonal snow and the inclusion of some outcrops and avalanche contributing areas. Most of the glacier areas that were not included in the RGI correspond mostly to rock glaciers (69% of the area). The remaining 31% of the areal discrepancies between the NGI and the RGI corresponds to the lower tongues of valley glaciers, mainly the category “debris-covered ice with rock glacier,” and some mountain glaciers and perennial snowfields. Comparing the inventoried areas for each basin, the larger differences occur in the San Juan and Mendoza basins, where rock glaciers are more frequent (Figure 7B). Further south, debris-covered ice and rock glaciers are less extensive and the differences between the inventoried areas in the RGI and NGI are smaller. As mentioned above, 98% of the area inventoried in the Llancanelo basin corresponds to rock glaciers and “debris-covered ice with rock glacier” category, and the RGI does not include ice masses in this basin.
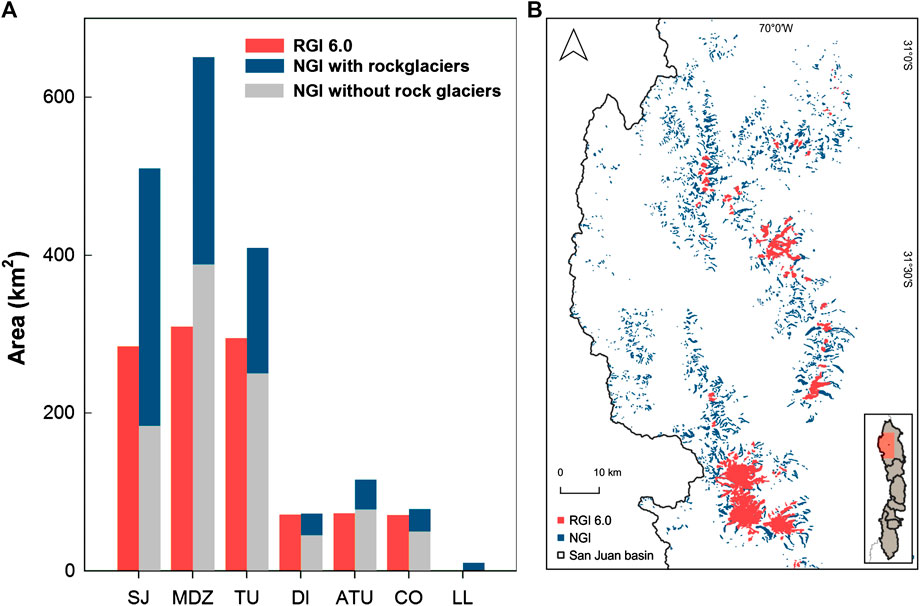
FIGURE 7. (A) Comparison of results from the RGI version 6.0 and NGI for the main river basins in the study area: San Juan (SJ), Mendoza (MDZ), Tunuyán (TU), Diamante (DI), Atuel (ATU), Colorado (CO) and Llancanelo (LL). (B) Example from the San Juan river basin showing the differences in glacier outlines between the RGI and the NGI.
Despite the differences in area and number of ice masses recorded in the RGI and NGI datasets, the geodetic mass balances calculated for both inventories are in good agreement (Figure 8 and Table 2). The regional mass balance rate for the period 2000–2018 for the RGI (−0.26 ± 0.16 m w.e. yr−1) is only slightly more negative than the regional mass balance obtained with the NGI (−0.18 ± 0.19 m w.e. yr−1). Similarly as reported for the NGI a moderate positive regional mass balance rate is observed for the RGI (+0.16 ± 0.23 m w.e. yr−1) during the 2000–2009 decade, with a marked shift towards more negative mass balance rates for the next decade 2009–2018 (−0.35 ± 0.21 m w.e. yr−1).
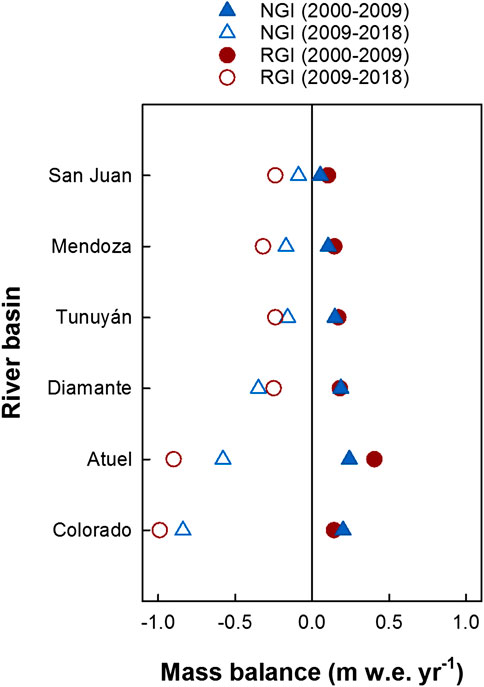
FIGURE 8. Different mass balance rates in the Central Andes ice masses based on the NGI and RGI version 6.0 inventories.
Since glaciers in the RGI are not classified by ice mass type (i.e., debris coverage, rock glaciers, etc.) it is not possible to compare the changes in ice surface elevations using these parameters. At the watershed level, mass losses in the RGI show a general agreement with those recorded in the NGI (Figure 8), with an increase in thinning rates from north to south, and with the southernmost basins showing the most negative mass balance rates. Differently to the NGI inventory, the most negative mass balance rates over the period 2000–2018 correspond to the Atuel basin with −0.70 ± 0.19 m w.e. yr−1. Inter-decadal mass balance rates for both inventories are presented in Figure 8. As expected, the main discrepancies between estimates occur in the basins where the differences in the total inventoried areas are larger. In the San Juan and Mendoza basins, where inventoried area in the NGI is more than two times larger than in the RGI, most of the differences correspond to the rock glacier and “debris-covered ice with rock glacier” category (Table 3).
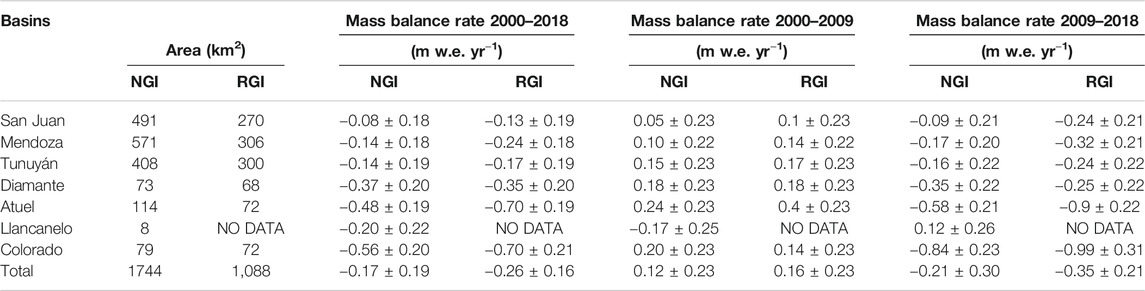
TABLE 3. Mass balance rates calculated for the main river basins using the RGI version 6.0 and NGI datasets and different time periods.
In the Argentinean Central Andes, the NGI confirms the presence of a high number of ice masses with a significant percentage of debris coverage (59% of the total inventoried area). The NGI also includes a new category for complex ice masses that represents a transition between debris-covered ice and rock glaciers (Zalazar et al., 2020). Although other studies identifying these complex forms are available (Janke et al., 2015; Monnier and Kinnard, 2015), the discussion on the delineation and classification of these interesting yet complex ice masses is still poorly documented and more detailed investigations are required. Nonetheless, the inclusion of different types of ice masses in the NGI allows for new analyses and studies that consider their particular characteristics and can facilitate our understanding of how they have reacted and may probably react to the ongoing climate changes.
In the Central Andes of Argentina the different types of ice masses experienced dissimilar mass balance rates that are largely dependent on their degree of debris coverage. Partly debris-covered ice underwent the most significant downwasting in all basins, followed by clean ice glaciers and perennial snowfields. This behavior is consistent with that observed by Fyffe et al. (2019) over glaciers in the Italian Alps, where debris-covered glaciers showed the highest melt rates compared to clean and dirty-ice glaciers. El Peñón and Azufre glaciers recorded the greatest mass losses of the studied region, (Table 2). Both glaciers are located in the vicinity of the active Peteroa volcano crater (4,133 m a.s.l.), which has emitted fine particulates throughout the surrounding area in repeated occasions since 2010 (Haller and Risso, 2011; Aguilera et al., 2015). The thin layer of ash from this volcano has probably decreased the albedo of the ice surfaces, favoring the pronounced ablation recorded in these glaciers.
For glacier complexes in transition from debris-covered ice to rock glacier and rock glaciers, changes in volume were minor or stable over the study periods. Both categories are assumed to have a thicker debris layer that protect ice from ablation. Three different complex ice masses are shown in Figure 9. In their upper parts, they present clean ice evolving into debris-covered ice and rock glaciers (where characteristic features as furrows and ridges are visible on the lowermost reaches). From inspection of satellite images, they look similar to others debris-covered ice masses where debris increases in thickness toward their snouts (Rounce et al., 2018). For these particular cases, little or no change was observed in mass balance rates at their fronts during the period 2000–2018 (Figures 9A–C). However, we observe that the highest thinning rates (up to −2 m/year) were concentrated in areas with a thin layer of supraglacial till or dirty ice. This thinning can be observed in the three examples, although it is more remarkable in the glacier located at the Tunuyán basin (Figure 9A). This behavior is similar to that previously observed over ice masses in the Tien Shan, were most of the surface lowering also occurred in the transitional zone or “ice-debris complexes” (Bolch et al., 2019). This last study also evidences more stable mass balance rates in areas with thick debris coverage in transition to rock glaciers.
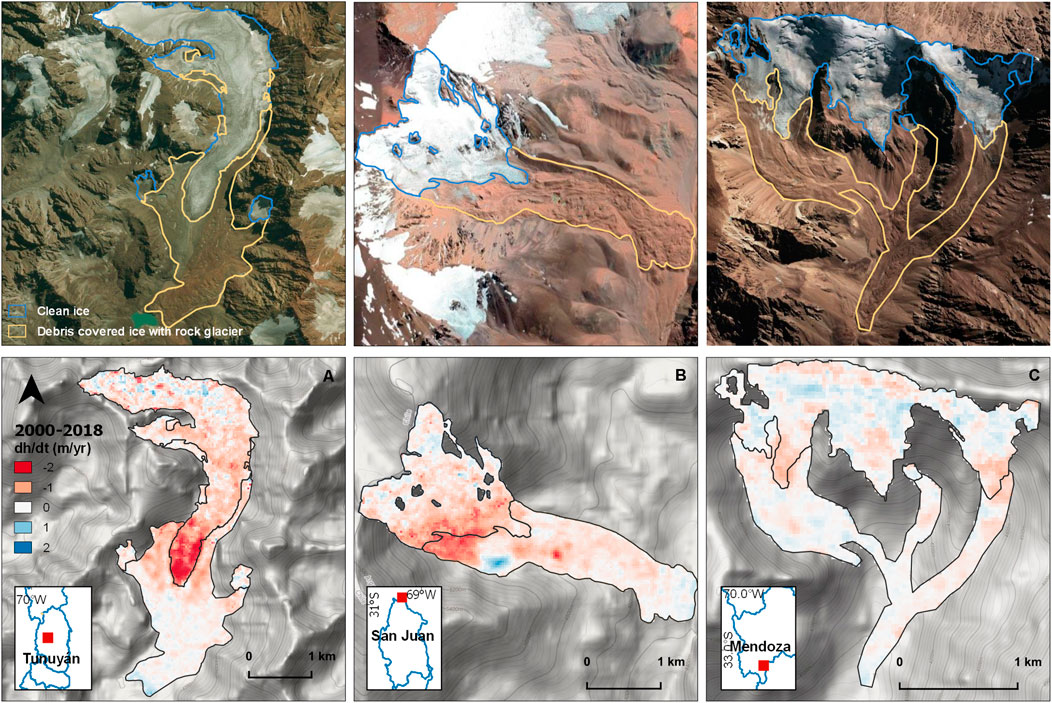
FIGURE 9. Different examples of “debris-covered ice with rock glacier” category (upper row) in (A) Tunuyán, (B) San Juan and (C) Mendoza basins and the corresponding rate of elevation changes from 2000 to 2018 (lower row).
Our results show a clear temporal difference in mass balance rates over the last 2 decades. During the first decade of the 21st century (2000–2009) most of the ice masses showed relatively stable and even positive mass balance rates markedly changing to overall negative mass balance rates after 2009. The direct mass balance measurements at the Echaurren Norte glacier in Central Chile are consistent with this regional pattern, showing almost balanced conditions during the first decade of the 21st century and consistently negative balances after 2009 (Masiokas et al., 2016; Farías-Barahona et al., 2019; WGMS, 2020). Other glaciers in the region showed minor re-advances and increased surging activity during the wetter and colder first decade of the 21st century (Masiokas et al., 2009; Pitte et al., 2016; Falaschi et al., 2018a). The marked increase in ice mass loss that occurred afterwards has been related to the decrease in snow accumulation over the Andes, a phenomenon that started around 2010 as is still affecting the ice masses and water resources in this semiarid region (Garreaud et al., 2017; Rivera et al., 2017; Masiokas et al., 2019).
All ice masses play an important role in Central Andes hydrology, contributing to streamflow especially during the driest years (Schaffer et al., 2019). According to our results, the ice masses that most contributed to the runoff of the main rivers of the Central Andes during the period 2009–2018 were clean ice glaciers (−0.53 ± 0.26 m w.e. yr−1) and partly debris-covered glaciers (−0.53 ± 0.21 m w.e. yr−1). Conversely, most of the “debris-covered ice with rock glacier” and rock glaciers, underwent an almost zero mass balance rate (+0.05 ± 0.22 and +0.07 ± 0.21 m w.e. yr−1) during the same period. Rock glaciers constitute an important long-term water reservoir in semiarid regions, with a large buffer capacity (Halla et al., 2020). Given their inherent characteristics, rock glaciers and completely debris-covered glaciers appear to be climatically more resilient than clean ice glaciers, suggesting that their importance as water storages will increase as climate warming continues in the Central Andes (Jones et al., 2018; Jones et al., 2019). This aspect is particularly important for the Central Andes of Argentina, because of the great variety and abundance of rock glaciers. Studies quantifying the role of the different ice masses are increasing rapidly, however, direct quantitative estimations of ice content and hydrological contribution of rock glaciers are still scarce in this region. Given the persistent drought conditions in the Central Andes, further research is clearly and urgently needed on this issue (Schaffer et al., 2019).
Understanding the correlation between debris coverage and mass balance changes is still a topic of active research and discussion. Indeed, Brun et al. (2019) did not observe systematic differences between clean ice glaciers and debris-covered glaciers in terms of glacier mass balances rates over High Mountain Asia glaciers. However, they suggest that the influence of debris-cover on glacier mass balances should be tested on a large number of glaciers and in different regions of the world. Our study represents a first attempt to address this issue in the Central Andes of Argentina, providing evidence for a discernible reduction in ice mass loss with increasing percentages of debris coverage in the different ice masses.
Our study detected notable differences in the number of ice masses and the total area covered by the NGI and the RGI version 6.0. However, the differences in mass balance rates over the period 2000–2018 between the two products are negligible (i.e., −0.08 m w.e. yr−1, which is within our uncertainty level). Nonetheless, a tendency towards comparatively more negative mass balance rates could be discerned in the RGI estimates. This pattern appears to be related to the fact that the RGI includes mostly clean ice glaciers, which represent one of the categories with the highest surface lowering over the period 2000–2018. As mentioned above, most of non-mapped units in the RGI correspond to the rock glaciers and “debris-covered ice with rock glacier” categories, which are the ones with the lowest thinning rates in the region. The different acquisition dates of the satellite imagery used to create the inventories may also account for the differences observed between the RGI and the NGI. The RGI used satellite imagery acquired between 2000 and 2003, prior to the acquisition of the images used in the NGI (images from 2007 to 2011). Despite these differences, it should also be noted that for basins with similar inventoried areas, the differences in mass balance between the NGI and RGI are minimal. The absence of successive inventories for this region hamper to account for area changes in the mass balance rate estimation. We estimate the area change impact on mass balance using a 0.5% annual area change rate estimated for the Andes (Vaughan et al., 2013). The corresponding sensitivity to mass balance rates was smaller than 0.01 m w.e. yr−1, a value far below our uncertainty estimates. Therefore, we assume that area changes are negligible for regional assessment of glacier mass balance in this region during the studied period. Nevertheless, successive inventories of ice masses in this region are needed to improve these first rough estimations and better account for areal changes in the mass balance changes in this region.
The Central Andes of Argentina host a vast number and diversity of glaciers, rock glaciers and perennial snowfields. The results discussed above are largely based on the recently published National Glacier Inventory of Argentina (NGI), which identified 8,076 ice masses covering 1767 km2 in this region. More than half (59%) of the inventoried area presents some degree of debris coverage and the region also records an abundant number and variety of rock glaciers (68% of the total number).
A general surface lowering of the ice masses was observed during the period 2000–2018 (mass balance rate: −0.18 ± 0.19 m w.e. yr−1). From 2000 to 2009 the mean regional mass balance rates were +0.12 ± 0.23 m w.e. yr−1, switching to negative rates (−0.21 ± 0.30 m w.e. yr−1) during the next decade 2009–2018. In general, the ice masses that experienced the most negative mass balance rates from 2000 to 2018 were partly debris-covered glaciers (−0.36 ± 0.19 m w.e. yr−1) and clean ice glaciers (−0.31 ± 0.19 m w.e. yr−1). On the other hand, completely debris-covered glaciers and rock glaciers showed almost zero mass balance rates (−0.07 ± 0.19 and −0.02 ± 0.19 m w.e. yr−1, respectively). The basins with the most negative mass balance rates are those located further south in the Central Andes, which is consistent with the lowest percentage of debris-covered ice and/or rock glaciers. Despite these findings, there is still a need for studies that quantify the ice content of rock glaciers and their hydrological contribution to streamflows.
Compared to global inventories such as the RGI, the NGI provides more detailed information regarding different type of ice masses (“debris-covered ice with rock glacier” and rock glaciers). Due to the inclusion of these ice masses in the NGI, the mass balance rates were slightly less negative than when using the RGI. In view of these findings, the ongoing updating activities of the NGI will allow the analysis of the temporal changes in the ice surface and also the evolution of the different types of debris-covered glaciers in this region in response to the recent climate changes.
More frequent long-term droughts such as the current mega-drought are predicted for the future in the Central Andes of Argentina and Chile. Understanding the climatic response of all the different ice masses and quantify their hydrological contributions to streamflows will be crucial for determining the availability of water reserves for the populations adjacent to the Central Andes.
The complete NGI is available at http://www.glaciaresargentinos.gob.ar and at the GLIMS website (http://www.glims.org/maps/glims). The ASTERIX elevation change maps for the Andes are available in the PANGAEA repository (https://doi.org/10.1594/PANGAEA.903618). Individual glacier mass balance rates for the RGI glaciers in region 17 (Southern Andes) were published in the WGMS database (Dussaillant et al., 2019). The new mass balance estimates for the NGI ice masses in the Central Andes of Argentina are available upon request from the corresponding author, and will also be published in the WGMS database.
LF designed the study and led the writing of the paper. LF, LZ and MC generated the glacier inventory for the Central Andes and also participated in the fieldtrips. ID performed all the mass balance calculations. All authors contributed with the manuscript revision, and read and approved the final submitted version.
The authors declare that the research was conducted in the absence of any commercial or financial relationships that could be construed as a potential conflict of interest.
The reviewer FG-C declared a past co-authorship with several of the authors ID and EB to the handling editor.
This study was conducted within the framework of the National Glacier Inventory of Argentina (NGI) and was supported by CONICET and the National Ministry of Environment and Sustainable Development. We would like to thank Argentina’s National Commission of Space Activities (CONAE), Global Land Ice Measurements from Space (GLIMS) and the Japan International Cooperation Agency (JICA) for providing some of the satellite images used to develop the NGI. This research was partially funded by project PICT-2018-03211. Etienne Berthier acknowledges support from the French Space Agency (CNES) through the TOSCA and ISIS programs. We thank Rachel Smedley for English proofreading of a preliminary version of the paper.
Aguilera, F., Benavente, O., Gutiérrez, F., Romero, J., Saltori, O., González, R., et al. (2015). Eruptive activity of planchón-Peteroa volcano for period 2010-2011, southern andean volcanic zone, Chile. Andgeo 43, 20–46. doi:10.5027/andgeoV43n1-a02
Anderson, R. S., Anderson, L. S., Armstrong, W. H., Rossi, M. W., and Crump, S. E. (2018). Glaciation of alpine valleys: the glacier-debris-covered glacier-rock glacier continuum. Geomorphology 311, 127–142. doi:10.1016/j.geomorph.2018.03.015.
Ayala, A., Pellicciotti, F., MacDonell, S., McPhee, J., Vivero, S., Campos, C., et al. (2016). Modelling the hydrological response of debris-free and debris-covered glaciers to present climatic conditions in the semiarid andes of central chile. Hydrol. Process. 30, 4036–4058. doi:10.1002/hyp.10971
Barcaza, G., Nussbaumer, S. U., Tapia, G., Valdés, J., García, J.-L., Videla, Y., et al. (2017). Glacier inventory and recent glacier variations in the andes of chile, south america. Ann. Glaciol. 58, 166–180. doi:10.1017/aog.2017.28
Berthier, E., Cabot, V., Vincent, C., and Six, D. (2016). Decadal region-wide and glacier-wide mass balances derived from multi-temporal ASTER satellite digital elevation models. validation over the mont-blanc area. Front. Earth Sci. 4, 63. doi:10.3389/feart.2016.00063.
Berthier, E., Larsen, C., Durkin, W. J., Willis, M. J., and Pritchard, M. E. (2018). Brief communication: unabated wastage of the Juneau and Stikine icefields (southeast Alaska) in the early 21st century. Cryosphere 12, 1523–1530. doi:10.5194/tc-12-1523-2018.
Blöthe, J. H., Rosenwinkel, S., Höser, T., and Korup, O. (2019). Rock-glacier dams in high asia. Earth Surf. Process. Landforms 44, 808–824. doi:10.1002/esp.4532.
Bolch, T., Rohrbach, N., Kutuzov, S., Robson, B. A., and Osmonov, A. (2019). Occurrence, evolution and ice content of ice-debris complexes in the Ak-Shiirak, Central Tien Shan revealed by geophysical and remotely-sensed investigations. Earth Surf. Process. Landforms 44, 129–143. doi:10.1002/esp.4487.
Bown, F., Rivera, A., and Acuña, C. (2008). Recent glacier variations at the aconcagua basin, central chilean andes. Ann. Glaciol. 48, 43–48. doi:10.3189/172756408784700572.
Braun, M. H., Malz, P., Sommer, C., Farías-Barahona, D., Sauter, T., Casassa, G., et al. (2019). Constraining glacier elevation and mass changes in South America. Nat. Clim. Change 9, 130–136. doi:10.1038/s41558-018-0375-7.
Brenning, A. (2005). Geomorphological, hydrological and climatic significance of rock glaciers in the andes of central chile (33–35°S). Permafr. Periglac. Process. 16, 231–240. doi:10.1002/ppp.528.
Brun, F., Berthier, E., Wagnon, P., Kääb, A., and Treichler, D. (2017). A spatially resolved estimate of high mountain asia glacier mass balances from 2000 to 2016. Nat. Geosci. 10, 668–673. doi:10.1038/ngeo2999.
Brun, F., Wagnon, P., Berthier, E., Jomelli, V., Maharjan, S. B., Shrestha, F., et al. (2019). Heterogeneous influence of glacier morphology on the mass balance variability in high mountain asia. J. Geophys. Res. Earth Surf. 124, 1331–1345. doi:10.1029/2018JF004838
Burger, F., Ayala, A., Farias, D., Shaw, T. E., MacDonell, S., Brock, B., et al. (2019). Interannual variability in glacier contribution to runoff from a high-elevation Andean catchment: understanding the role of debris cover in glacier hydrology. Hydrol. Process. 33, 214–229. doi:10.1002/hyp.13354
Cobos, D., and Boninsegna, J. (1983). “Fluctuations of some glaciers in the upper atuel river basin, mendoza, argentina,,” in Quaternary of south america and antarctic peninsula glacier fluctuations—andes centrales. Editor J. Rabassa (Rotterdam, The Netherlands: A. A. Balkema), 61–82.
Dussaillant, I., Berthier, E., and Brun, F. (2018). Geodetic mass balance of the northern patagonian icefield from 2000 to 2012 using two independent methods. Front. Earth Sci. 6, 8. doi:10.3389/feart.2018.00008.
Dussaillant, I., Berthier, E., Brun, F., Masiokas, M., Hugonnet, R., Favier, V., et al. (2019). Two decades of glacier mass loss along the Andes. Nat. Geosci. 12, 802–808. doi:10.1038/s41561-019-0432-5.
Falaschi, D., Bolch, T., Lenzano, M. G., Tadono, T., Lo Vecchio, A., and Lenzano, L. (2018a). New evidence of glacier surges in the central andes of argentina and chile. Prog. Phys. Geogr.: Earth Environ. 42, 792–825. doi:10.1177/0309133318803014.
Falaschi, D., Lenzano, M. G., Tadono, T., Vich, A. I., and Lenzano, E. (2018b). Balance de masa geodésico 2000–2011 de los glaciares de la cuenca del río Atuel. Mendoza, Argentina: Andes Centrales de Mendoza.
Falaschi, D., Masiokas, M., Tadono, T., and Couvreux, F. (2016). ALOS-derived glacier and rock glacier inventory of the volcán domuyo region (∼36°S), southernmost central andes, argentina. Z. Geomorphol. 60 (14), 195–208. doi:10.1127/zfg/2016/0319
Farías-Barahona, D., Vivero, S., Casassa, G., Schaefer, M., Burger, F., Seehaus, T., et al. (2019). Geodetic mass balances and area changes of echaurren norte glacier (central andes, chile) between 1955 and 2015. Rem. Sens. 11, 260. doi:10.3390/rs11030260
Fischer, M., Huss, M., and Hoelzle, M. (2015). Surface elevation and mass changes of all swiss glaciers 1980–2010. Cryosphere 9, 525–540. doi:10.5194/tc-9-525-2015.
Fyffe, C. L., Brock, B. W., Kirkbride, M. P., Mair, D. W. F., Arnold, N. S., Smiraglia, C., et al. (2019). Do debris-covered glaciers demonstrate distinctive hydrological behaviour compared to clean glaciers? J. Hydrol. 570, 584–597. doi:10.1016/j.jhydrol.2018.12.069
Garreaud, R. D., Alvarez-Garreton, C., Barichivich, J., Boisier, J. P., Christie, D., Galleguillos, M., et al. (2017). The 2010–2015 megadrought in central chile: impacts on regional hydroclimate and vegetation. Hydrol. Earth Syst. Sci. 21, 6307–6327. doi:10.5194/hess-21-6307-2017
Garreaud, R. D., Boisier, J. P., Rondanelli, R., Montecinos, A., Sepúlveda, H. H., and Veloso‐Aguila, D. (2019). The central chile mega drought (2010–2018): a climate dynamics perspective. Int. J. Climatol. 40, 421. doi:10.1002/joc.6219.
Garreaud, R. D., Vuille, M., Compagnucci, R., and Marengo, J. (2009). Present-day south american climate. Palaeogeogr. Palaeoclimatol. Palaeoecol. 281, 180–195. doi:10.1016/j.palaeo.2007.10.032.
Gascoin, S., Kinnard, C., Ponce, R., Lhermitte, S., MacDonell, S., and Rabatel, A. (2011). Glacier contribution to streamflow in two headwaters of the huasco river, dry Andes of Chile. Cryosphere 5, 1099–1113. doi:10.5194/tc-5-1099-2011.
Halla, C., Blöthe, J. H., Tapia Baldis, C., Trombotto, D., Hilbich, C., Hauck, C., et al. (2020). Ice content and interannual water storage changes of an active rock glacier in the dry Andes of Argentina. The Cryosphere Discuss. doi:10.5194/tc-2020-29.
Haller, M. J., and Risso, C. (2011). La erupcion del volcán Peteroa (35°15′S, 70°18′o) del 4 de septiembre de 2010. Rev. Asoc. Geol. Argent. 68, 295–305.
Huss, M. (2013). Density assumptions for converting geodetic glacier volume change to mass change. Cryosphere 7, 877–887. doi:10.5194/tc-7-877-2013.
Janke, J. R., Bellisario, A. C., and Ferrando, F. A. (2015). Classification of debris-covered glaciers and rock glaciers in the andes of central chile. Geomorphology 241, 98–121. doi:10.1016/j.geomorph.2015.03.034.
Jones, D. B., Harrison, S., Anderson, K., and Betts, R. A. (2018). Mountain rock glaciers contain globally significant water stores. Sci. Rep. 8, 2834. doi:10.1038/s41598-018-21244-w.
Jones, D. B., Harrison, S., Anderson, K., and Whalley, W. B. (2019). Rock glaciers and mountain hydrology: a review. Earth Sci. Rev. 193, 66–90. doi:10.1016/j.earscirev.2019.04.001.
Kinnard, C., MacDonell, S., Petlicki, M., Mendoza Martinez, C., Abermann, J., and Urrutia, R. (2018). “Mass balance and meteorological conditions at universidad glacier, Central Chile,” in andean hydrology. Editors D. A. Rivera, A. Godoy-Faundez, and M. Lillo-Saavedra (Boca Raton, FL: CRC Press), 102–123.
Leiva, J. C., Cabrera, G. A., and Lenzano, L. E. (2007). 20 years of mass balances on the piloto glacier, las cuevas river basin, mendoza, argentina. Global Planet. Change 59 (1–4), 10–16. doi:10.1016/j.gloplacha.2006.11.018.
Lliboutry, L. (1998). “Glaciers of chile and argentina,” in Satellite image atlas of glaciers of the world. glacier Inventory—Andes. Editors R. S. Williams, and J. G. Ferrigno (Denver, CO: South America USGS).
Malmros, J. K., Mernild, S. H., Wilson, R., Yde, J. C., and Fensholt, R. (2016). Glacier area changes in the central chilean and argentinean Andes 1955–2013/14. J. Glaciol. 62, 391–401. doi:10.1017/jog.2016.43.
Masiokas, M. H., Christie, D. A., Le Quesne, C., Pitte, P., Ruiz, L., Villalba, R., et al. (2016). Reconstructing the annual mass balance of the echaurren norte glacier (central andes, 33.5° S) using local and regional hydroclimatic data. Cryosphere 10, 927–940. doi:10.5194/tc-10-927-2016
Masiokas, M. H., Cara, L., Villalba, R., Pitte, P., Luckman, B. H., Toum, E., et al. (2019). Streamflow variations across the Andes (18°–55°S) during the instrumental era. Sci. Rep. 9. doi:10.1038/s41598-019-53981-x
Masiokas, M. H., Delgado, S., Pitte, P., Berthier, E., Villalba, R., Skvarca, P., et al. (2015). Inventory and recent changes of small glaciers on the northeast margin of the southern patagonia Icefield, argentina. J. Glaciol. 61, 511–523. doi:10.3189/2015jog14j094
Masiokas, M. H., Rivera, A., Espizua, L. E., Villalba, R., Delgado, S., and Aravena, J. C. (2009). Glacier fluctuations in extratropical south america during the past 1000 years. Palaeogeogr. Palaeoclimatol. Palaeoecol. 281, 242–268. doi:10.1016/j.palaeo.2009.08.006.
McNabb, R., Nuth, C., Kääb, A., and Girod, L. (2019). Sensitivity of glacier volume change estimation to DEM void interpolation. Cryosphere 13, 895–910. doi:10.5194/tc-13-895-2019.
Meier, W. J.-H., Grießinger, J., Hochreuther, P., and Braun, M. H. (2018). An updated multi-temporal glacier inventory for the patagonian Andes with changes between the little ice age and 2016. Front. Earth Sci. 6, 62. doi:10.3389/feart.2018.00062.
Menounos, B., Hugonnet, R., Shean, D., Gardner, A., Howat, I., Berthier, E., et al. (2019). Heterogeneous changes in western north American glaciers linked to decadal variability in zonal wind strength. Geophys. Res. Lett. 46, 200–209. doi:10.1029/2018GL080942
Mölg, N., Bolch, T., Rastner, P., Strozzi, T., and Paul, F. (2018). A consistent glacier inventory for karakoram and Pamir derived from Landsat data: distribution of debris cover and mapping challenges. Earth Syst. Sci. Data 10, 1807–1827. doi:10.5194/essd-10-1807-2018.
Monnier, S., and Kinnard, C. (2015). Reconsidering the glacier to rock glacier transformation problem: new insights from the central andes of chile. Geomorphology 238, 47–55. doi:10.1016/j.geomorph.2015.02.025.
Nagai, H., Fujita, K., Sakai, A., Nuimura, T., and Tadono, T. (2016). Comparison of multiple glacier inventories with a new inventory derived from high-resolution ALOS imagery in the bhutan himalaya. Cryosphere 10, 65–85. doi:10.5194/tc-10-65-2016.
Nogami, M. (1972). The snow line and climate during the last glacial period in the andes mountains. Daiyonki Kenkyu 11, 71–80. doi:10.4116/jaqua.11.71.
Paul, F., Barrand, N. E., Baumann, S., Berthier, E., Bolch, T., Casey, K., et al. (2013). On the accuracy of glacier outlines derived from remote-sensing data. Ann. Glaciol. 54, 171–182. doi:10.3189/2013AoG63A296
Paul, F., Barry, R. G., Cogley, J. G., Frey, H., Haeberli, W., Ohmura, A., et al. (2009). Recommendations for the compilation of glacier inventory data from digital sources. Ann. Glaciol. 50, 119–126. doi:10.3189/172756410790595778
Pfeffer, W. T., Arendt, A. A., Bliss, A., Bolch, T., Cogley, J. G., Gardner, A. S., et al. (2014). The Randolph Glacier Inventory: a globally complete inventory of glaciers. J. Glaciol. 60, 537. doi:10.3189/2014JoG13J176
Pitte, P., Berthier, E., Masiokas, M. H., Cabot, V., Ruiz, L., Ferri Hidalgo, L., et al. (2016). Geometric evolution of the horcones inferior glacier (mount aconcagua, central andes) during the 2002–2006 surge: horcones inferior glacier surge. J. Geophys. Res. Earth Surf. 121, 111–127. doi:10.1002/2015JF003522
Pitte, P., Espizua, L. E., and Ferri Hidalgo, L. (2010). “glacier Inventory in the desert andes of san juan, argentina (29°20′S),” in Glacier inventory (Kolkata, India: CECS), 55.
Pitte, P., Hidalgo, L. F., Ruiz, L., Masiokas, M., Villalba, R., and Berthier, E. (2018). “¿Qué está pasando con los glaciares del complejo volcánico Planchón-Peteroa?,” in Proceedings of the 13 Encuentro del Centro Internacional de Ciencias de la Tierra E-ICES-13, Mendoza, Argentina, December 2018.
Rau, F., Mauz, F., Mogt, S., Singh Khalsa, S. J., and Raup, B. (2005). Illustrated GLIMS glacier classification. Freiburg, Germany: GLIMS regional center “antarctic peninsula”.
Raup, B., Racoviteanu, A., Khalsa, S. J. S., Helm, C., Armstrong, R., and Arnaud, Y. (2007). The GLIMS geospatial glacier database: a new tool for studying glacier change. Global Planet. Change 56, 101–110. doi:10.1016/j.gloplacha.2006.07.018.
RGI Consortium (2017a). Version 6.0: Technical Report. Randolph Glacier inventory (RGI)—a dataset of global glacier outlines. Available at: https://www.glims.org/RGI/00_rgi60_TechnicalNote.pdf (Accessed January, 2020).
RGI Consortium (2017b). Version 6.0: Technical report. Randolph Glacier inventory (RGI) – a dataset of global glacier outlines: global Land ice measurements from Space. Available at: https://doi.org/10.7265/N5-RGI-60 (Accessed January, 2020).
Rivera, J., Penalba, O., Villalba, R., and Araneo, D. (2017). Spatio-temporal patterns of the 2010–2015 extreme hydrological drought across the central andes, argentina. Water 9, 652. doi:10.3390/w9090652.
Rolstad, C., Haug, T., and Denby, B. (2009). Spatially integrated geodetic glacier mass balance and its uncertainty based on geostatistical analysis: application to the western svartisen ice cap, norway. J. Glaciol. 55, 666–680. doi:10.3189/002214309789470950.
Rounce, D. R., King, O., McCarthy, M., Shean, D. E., and Salerno, F. (2018). Quantifying debris thickness of debris‐covered glaciers in the everest region of Nepal through inversion of a subdebris melt model. J. Geophys. Res. Earth Surf. 123, 1094–1115. doi:10.1029/2017JF004395.
Sagredo, E. A., and Lowell, T. V. (2012). Climatology of Andean glaciers: a framework to understand glacier response to climate change. Global Planet. Change 86-87 (87), 101–109. doi:10.1016/j.gloplacha.2012.02.010.
Schaffer, N., MacDonell, S., Réveillet, M., Yáñez, E., and Valois, R. (2019). Rock glaciers as a water resource in a changing climate in the semiarid chilean andes. Reg. Environ. Change 19, 1263. doi:10.1007/s10113-018-01459-3.
Vaughan, D. G., Comiso, J. C., Allison, I., Carrasco, J., Kaser, G., Kwok, R., et al. (2013). Climate change 2013: the physical science basis. Contribution of working group I to the fifth assessment report of the intergovernmental panel on climate, Cambridge, UK: Cambridge University Press, Vol. 66.
Viale, M., Bianchi, E., Cara, L., Ruiz, L. E., Villalba, R., Pitte, P., et al. (2019). Contrasting climates at both sides of the Andes in Argentina and Chile. Front. Environ. Sci. 7, 69. doi:10.3389/fenvs.2019.00069
Wang, D., and Kääb, A. (2015). Modeling glacier elevation change from DEM time series. Rem. Sens. 7, 10117–10142. doi:10.3390/rs70810117.
WGMS (2020). Global glacier change bulletin No. 3 (2016–2017). Editors M. Zemp, I. Gärtner-Roer, S. U. Nussbaumer, J. Bannwart, P. Rastner, F. Paulet al. (Zurich, Switzerland: ISC(WDS)/IUGG(IACS)/UNEP/UNESCO/WMO, World Glacier Monitoring Service), 274.
WGMS (2012). Fluctuations of glaciers 2005–2010, Editors M. Zemp, H. Frey, I. Gärtner-Roer, S. U. Nussbaumer, M. Hoelzleet al. (Zurich, Switzerland: ICSU(WDS)/IUGG(IACS)/UNEP/UNESCO/WMO, World Glacier Monitoring Service).
Keywords: glacier inventory, Central Andes, debris-covered glaciers, rock glaciers, mass loss
Citation: Ferri L, Dussaillant I, Zalazar L, Masiokas MH, Ruiz L, Pitte P, Gargantini H, Castro M, Berthier E and Villalba R (2020) Ice Mass Loss in the Central Andes of Argentina Between 2000 and 2018 Derived From a New Glacier Inventory and Satellite Stereo-Imagery. Front. Earth Sci. 8:530997. doi: 10.3389/feart.2020.530997
Received: 30 January 2020; Accepted: 09 November 2020;
Published: 03 December 2020.
Edited by:
Matthias Holger Braun, University of Erlangen Nuremberg, GermanyReviewed by:
Fabien Gillet-Chaulet, UMR5001 Institut des Géosciences de l’Environnement (IGE), FranceCopyright © 2020 Ferri, Dussaillant, Zalazar, Masiokas, Ruiz, Pitte, Gargantini, Castro, Berthier and Villalba. This is an open-access article distributed under the terms of the Creative Commons Attribution License (CC BY). The use, distribution or reproduction in other forums is permitted, provided the original author(s) and the copyright owner(s) are credited and that the original publication in this journal is cited, in accordance with accepted academic practice. No use, distribution or reproduction is permitted which does not comply with these terms.
*Correspondence: Lidia Ferri, bGZlcnJpQG1lbmRvemEtY29uaWNldC5nb2IuYXI=
Disclaimer: All claims expressed in this article are solely those of the authors and do not necessarily represent those of their affiliated organizations, or those of the publisher, the editors and the reviewers. Any product that may be evaluated in this article or claim that may be made by its manufacturer is not guaranteed or endorsed by the publisher.
Research integrity at Frontiers
Learn more about the work of our research integrity team to safeguard the quality of each article we publish.