 Zhongping Shen
 Jun Shi
 Jianguo Tan2,3
- 1Shanghai Ecological Forecasting and Remote Sensing Center, Shanghai Meteorological Bureau, Shanghai, China
- 2Key Laboratory of Cities’ Mitigation and Adaptation to Climate Change in Shanghai, China Meteorological Administration, Shanghai, China
- 3Shanghai Climate Center, Shanghai Meteorological Bureau, Shanghai, China
Based on the monthly air temperature data from 11 national meteorological stations of Shanghai, the construction land areas derived from the Landsat Thematic Mapper (TM) data and population density data, the migration of urban warming centers in different decades since 1980s and their possible causes were analyzed, and the temporal and spatial variation characters of urban heat island (UHI) were investigated. The location of warming centers migrated from Baoshan to Pudong and then moved toward Songjiang and Nanhui. The shifting of the location of the warming center mainly depends on the growth of metropolitan construction land area and population density. The intensity of UHI displayed three stages successively: slow growth stage (1961–1986) with a growth rate of 0.13°C/10a, rapid growth (1987–2204) stage with a growth rate of 0.60°C/10a, and obvious deceleration stage (2005–2017) with a decline rate 0.43°C/10a. In the past 57 years, the intensity of UHI in the nighttime was 0.4°C greater than that of the daytime. With the accelerating process of urbanization, the UHI in Shanghai gradually expanded from the urban areas to the surrounding suburbs and even began to expand radially toward the southwest of the rural regions in the 21st century. The results can provide references for urban heatwave prediction and mitigation of the UHI effect in Shanghai.
Introduction
Since the 1960s, especially after reform and opening-up in 1978, the environment and climate in many parts of China have undergone significant change with the rapid urbanization and the intensification of human activities. Urbanization has changed the weather and climate events in and around cities (Baik et al., 2001; Liang et al., 2011; Bahi et al., 2016; Founda and Santamouris, 2017; Rizvia et al., 2019). Studies show that urbanization contributes to more than one-third of the increase of intensity of extreme heat events in the urban agglomeration of the Yangtze River Delta, which was comparable to the contribution of greenhouse gases during 1971–2013 (Yang et al., 2017). Urban development also has a serious impact on the urban thermal environment (Bailing and Brazell, 1988; Shi et al., 2011; Chen Y. et al., 2019). Urban heat island (UHI) is the main and the most typical impact of urbanization on urban climate (Su et al., 2005). With the development of urbanization, the natural vegetation coverage is greatly reduced, and the construction land area is enlarged, which changes the surface albedo, roughness, and overall heat capacity (Quattrochi et al., 2000; Miao et al., 2020). Over east China, UHI effects contributed 24.2% to regional average warming trends, and the strongest effect of urbanization on annual mean surface air temperature trends occurred over the metropolis and large city stations, with corresponding contributions of about 44% and 35% to total warming, respectively (Yang et al., 2011). In addition, the rapid increase of the urban population leads to a large amount of anthropologic heat release, which caused a significant rise in high temperature in the urban center and a strong UHI (Chen et al., 2016; Chen B. et al., 2019). While there are potential benefits from such heating in energy saving for buildings in cold seasons for northern countries like Canada (Ewing and Rong, 2008), UHI has a profound impact on urban comfort, residents’ health, urban air quality, and energy consumption (Quattrochi et al., 2000; Stone and Norman, 2006).
The UHI effect has obvious annual, seasonal, and diurnal variations (Rizvi et al., 2019). Unusual seasonal variation patterns of UHI intensity were reported in different cities. For China’s capital city Beijing, the strongest UHI intensity generally occurs in winter, and the weakest UHI intensity occurs in spring (Yan-Ling and Shang-Yin, 2003; Yang et al., 2013). For Birmingham from the United Kingdom, the largest urban-rural difference is in autumn while the weakest difference is in winter (Unwin, 1980). For Fairbanks from the United States, the strongest UHI intensity is in winter and the smallest UHI is in autumn (Magee et al., 1999). On a diurnal variation basis, the UHI intensity is strongest at night (Unwin, 1980; Yang et al., 2013), and may disappear during the day or the city may be cooler than the rural environs (Arnfiled, 2003). Urban expansion plays a dominant role in UHI formation. Previous researches have shown that the rapidly expanding urban area is closely related to UHI effect (Adebayo, 1987; Nasrallah et al., 1990; Lemonsu et al., 2015; Wang et al., 2016; Feng et al., 2018). The migration direction of the heat island center in Hohhot was consistent with the shift of urban gravity center, indicating that urban expansion had spatial coherence with the diffusion trend of UHI (Magee et al., 1999). The UHI intensity in Beijing increased along with the urban sprawl continuously in the early stage, but it might stable or even descend under a certain condition (Cui et al., 2015). The spatial variation of the UHI region in Hangzhou was almost consistent with the expansion trend of the construction area in 1989–2010, and the area of heat island increased with the expansion of urban area (Li and Xu, 2014).
Shanghai is the most developed megacity in China, located in a subtropical climate zone. Since 1990, Shanghai has experienced substantial economic growth during the process of shaping a globalizing metropolis with an excellent investment environment and international competition (Li et al., 2009). In recent decades, urbanization in Shanghai has developed rapidly, and the UHI effect is prominent. The annual UHI occurrence frequency was 87.8%, and the monthly mean UHI intensity was larger than 0.8°C based on the temperature observations of six Davis automatic stations in urban and suburban areas (Deng et al., 2001). The increasing rate of UHI intensity was 0.21°C/10a from 1959 to 2005 (Cui et al., 2007). Based on temperature observation data of 59 automatic weather stations from 2006 to 2013, the study indicated that there were three heat island centers in Shanghai, that is, in addition to the main heat island center in the urban area, there were also two sub-heat island centers in the northern part of Minhang and the southern part of Songjiang (Shen et al., 2017). However, few studies have researched the migration process of warming centers and the spatial characteristics of heat island expansion in Shanghai as well as its causes.
In this paper, based on the climate observation data, satellite data, and social statistic data, the migration of warming centers in Shanghai and its relationship with two urbanization factors (the construction land area and population density) was analyzed as a typical case in China. Furthermore, we analyzed the annual and seasonal variation characteristics of the UHI intensity since the 1960s, and the spatial characteristics of UHI expansion process, which can provide a reference for the improvement of urban thermal environment and urban constructions in Shanghai.
Data and Methods
Data
The monthly average temperature data of 11 national meteorological stations in Shanghai from 1961 to 2017 were applied in this paper. These data were provided by Shanghai Climate Center of Shanghai Meteorological Bureau and data quality control and homogeneity assessment were employed (Ren et al., 2015). According to the population density, the distance to the urban area, and the development degree, we classified the whole Shanghai region into urban, suburban, and rural areas. The meteorological station in urban area is Xujiahui; the meteorological stations in the suburban area includes Pudong, Minhang, Jiading, and Baoshan; and the meteorological stations in the rural area includes Fengxian, Songjiang, Jinshan, Qingpu, Nanhui, and Chongming. The elevation difference of 11 stations was very small (with the highest elevation 6.0 m and the lowest elevation 3.8 m), therefore the vertical correction of temperature can be ignored. The population density in each district was calculated by population and administrative area which were downloaded from the official website of Shanghai Municipal Statistical Bureau1. We also utilized the satellite Landsat Thematic Mapper (TM) data to obtain the construction land areas in each district of Shanghai in 1980, 1995, 2005, and 2015. These data were provided by Shanghai Ecological Forecasting and Remote Sensing Center of Shanghai Meteorological Bureau. Figure 1 shows the geographical distribution of the 11 national meteorological stations and the corresponding population density in 2005. The distribution of population gradually reduces from urban to rural region, which is almost consistent with the process of urbanization.
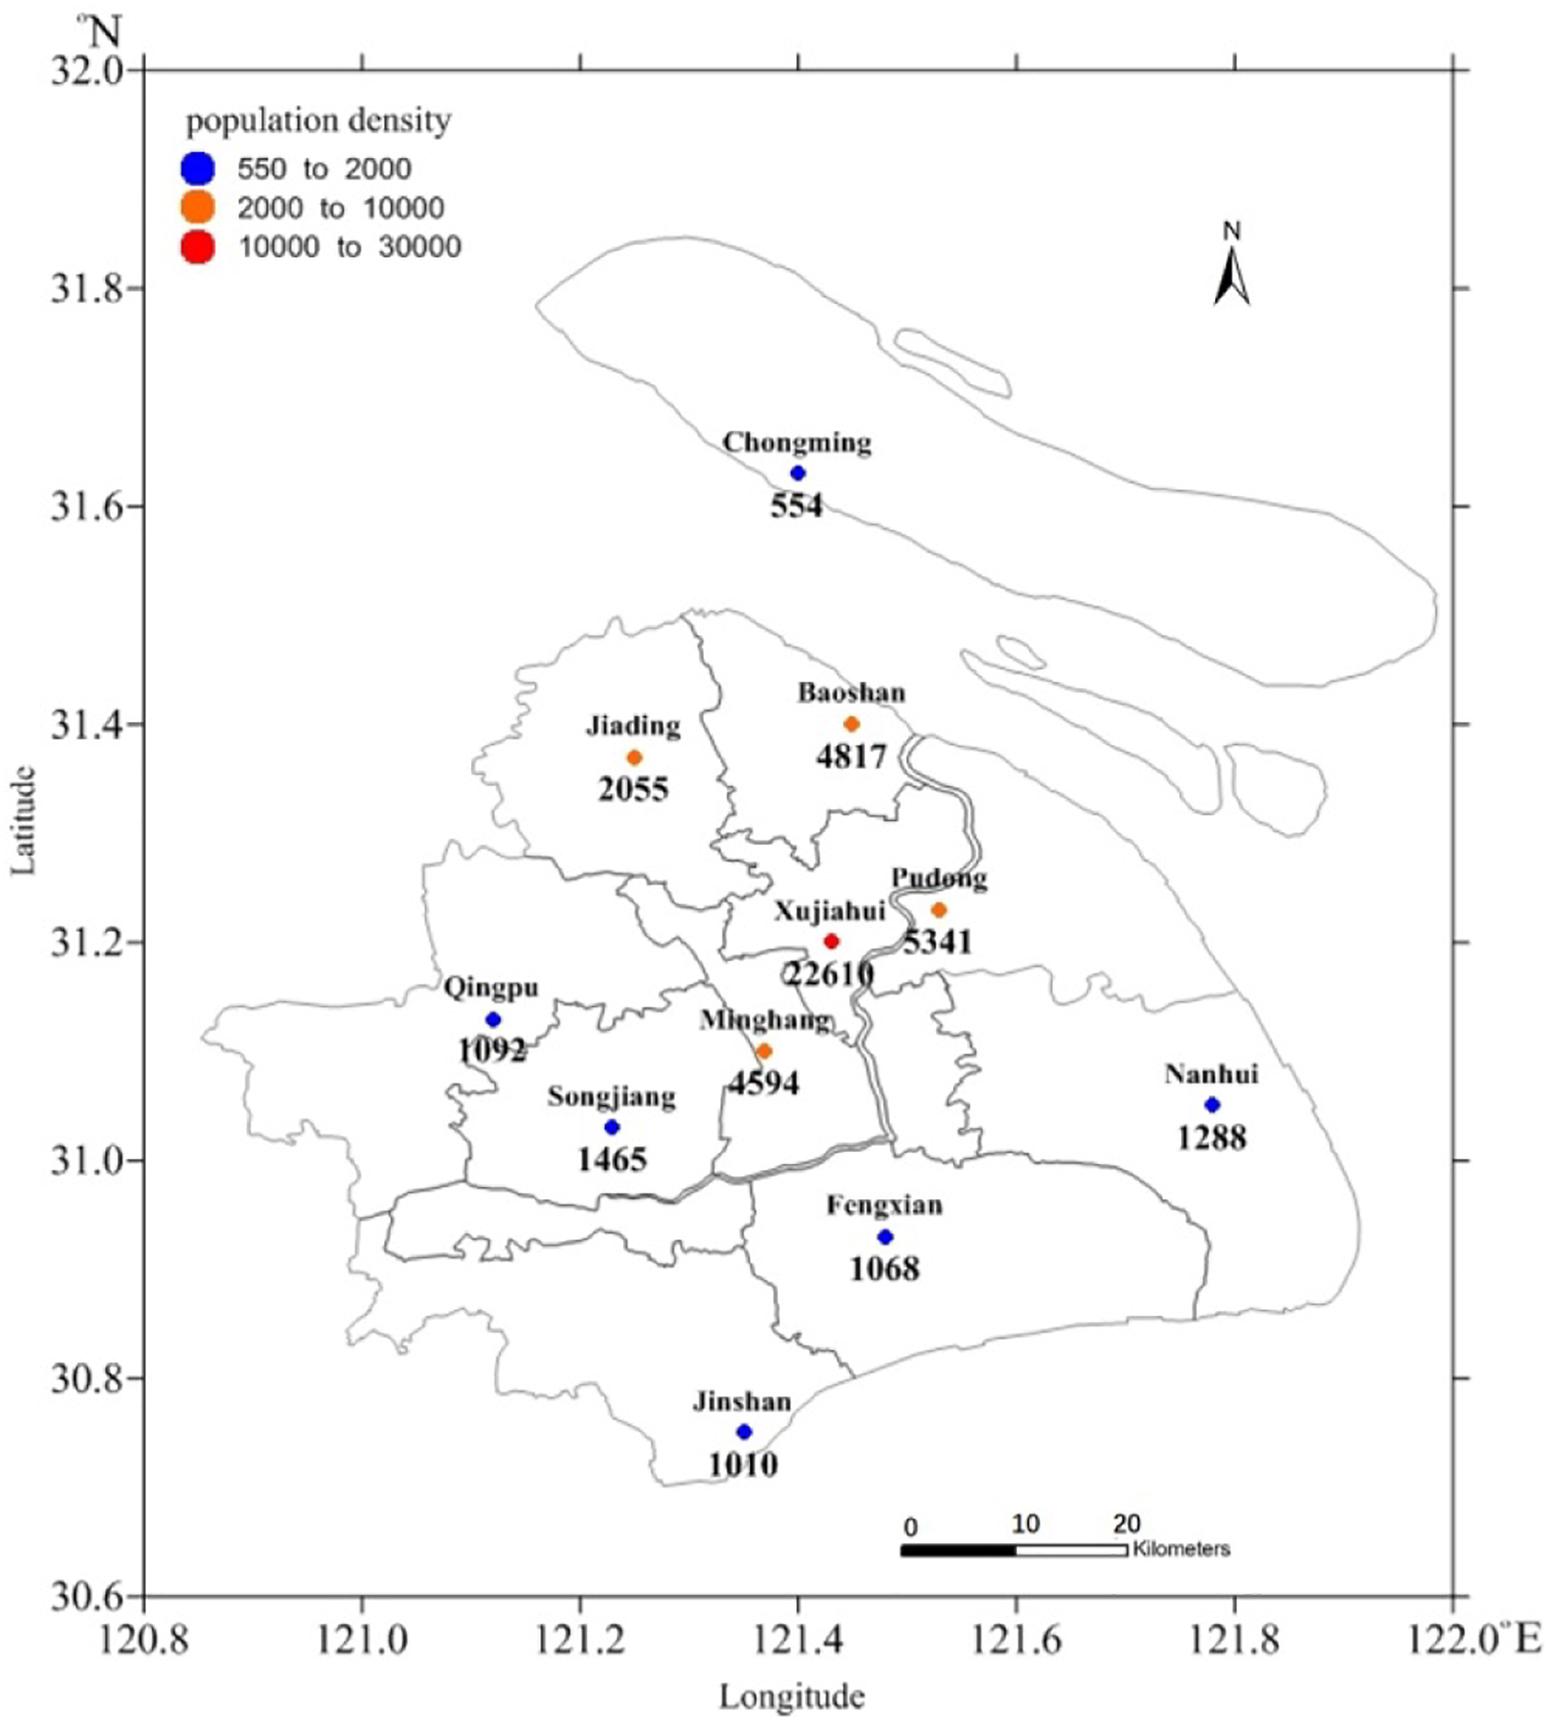
Figure 1. Distribution of 11 meteorological stations in Shanghai and the population density in each district in 2005 (unit: persons per square kilometers).
Method
The UHI intensity was usually defined as the difference in mean temperature between the urban and rural stations, here it is calculated by the following equation:
where UHII is the urban heat island intensity, TU is observed the annual/seasonal mean temperature of the respective urban station, and TR is the annual/seasonal mean temperature of the respective rural station.
The Xujiahui station was established in 1873 and had data records of 147 years. The other 10 meteorological stations were established in 1961. With the development of urbanization, Xujiahui station was now located in the Xujiahui commercial circle and was a typical urban meteorological station. Based on the data of total road area, population density, energy consumption, and cultivated land area during 1961–2017, it is found that Shanghai had experienced a period of rapid urbanization after 1983. Therefore, the urbanization process of Shanghai was divided into two stages: the slow growth period (1961–1983) and the rapid growth period (1984–2017). In order to identify the representative rural station, the heating rates of all national meteorological stations in Shanghai were calculated in the above two urbanization stages. Table 1 showed the increasing rate of annual mean temperature at 11 national meteorological stations in Shanghai during two different periods of urbanization. It can be seen that except Xujiahui station, the annual mean temperatures of the other 10 meteorological stations in Shanghai displayed a decreasing trend in the slow growth period of urbanization. It is also the only station with a rising temperature rate in the slow growth period and a high heating rate in the rapid growth period. Both Fengxian station and Chongming station showed the highest cooling rate of −0.12°C/10a, but only Fengxian station had the lowest increasing rate of temperature in the rapid growth period. Therefore, Fengxian station can be identified as a representative rural station.
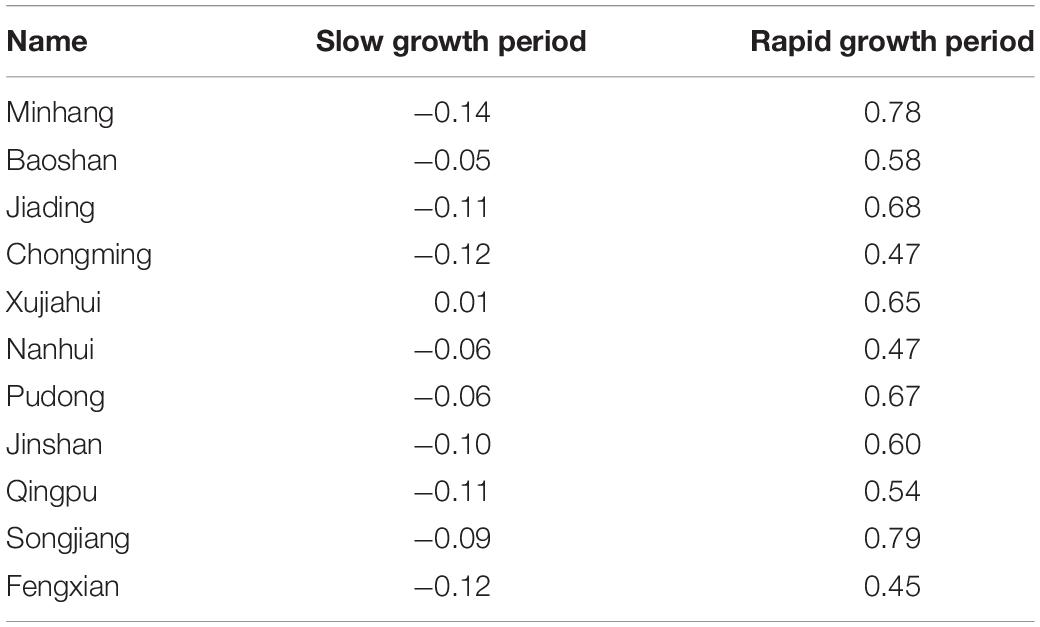
Table 1. The increasing rate of annual mean temperature in different urbanization stages at 11 national meteorological stations in Shanghai (unit: °C/10a).
Results
Interannual Variations of Temperature in Different Regions in Shanghai
We defined the stations with the greatest heating rate in a given period as the warming centers. Figure 2 shows the annual mean temperature in urban areas, suburban, and the rural areas of Shanghai since records began. The temperature observation at Xujiahui Station in Shanghai started in 1873, and the temperature observation at the other 10 stations began around 1960. During 1960–1978, the cooling rates in urban, suburban, and rural regions were −0.10°C/10a, −0.15°C/10a, and −0.14°C/10a, respectively, and all passed the significance level of 0.05. It means that the difference in mean temperatures in the three regions (urban, suburban, and rural areas) was very small, and they all showed a consistent trend. Therefore, the air temperature at Xujiahui station represents the air temperature in the whole of Shanghai before the reform and opening-up in 1978. After 1978, the temperature in urban areas became significantly higher than that of suburban and rural areas. But there was still little difference between suburban and rural areas until the 1990s. With the rapid urbanization in suburban areas after the 1990s, the temperature difference between the suburb and the rural areas began to increase.
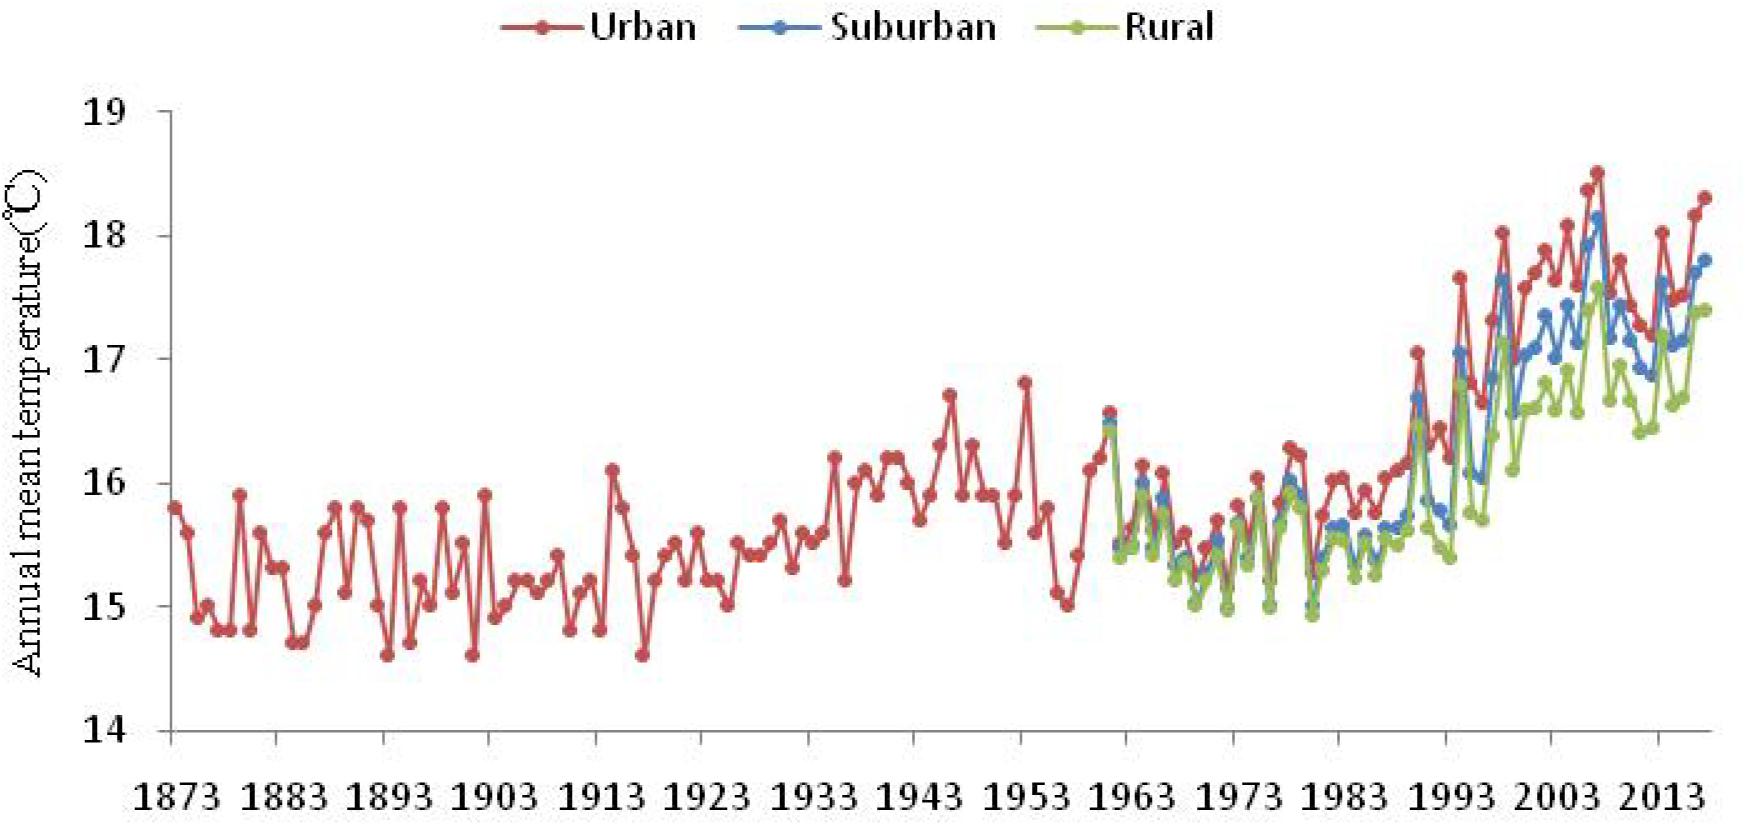
Figure 2. Annual mean temperature of the urban, suburban, and rural areas since records began.
Interdecadal Variations in the Locations of the Urban Warming Center
The temperature of 11 stations in Shanghai all showed a downward trend in the 1960s, and the cooling rates were between −0.82°C/10a (Xujiahui) and −1.17°C/10a (Songjiang). Figure 3 shows the location and changing rate of the warming center in each decade from 1971 to 2017. In the 1970s, the temperature of 11 stations in Shanghai had generally increased. The most considerable heating rate occurred in the urban area, which was 0.36°C/10a. In the 1980s, the heating rate was accelerated, especially in Baoshan, with a maximum heating rate of 0.94°C/10a. In the early 1990s, the government decided to develop the Pudong district. Rapid urbanization had led to a rapid increase in temperature in Pudong, and the heating rate was as high as 1.74°C/10a. In the first 10 years of this century, accompanied by the construction of Songjiang New Town, Songjiang became the warming center with a maximum heating rate of 0.74°C/10a. From 2011 to 2017, Shanghai vigorously developed the outer suburbs. With the construction of the Free Trade Zone and the Disneyland, Nanhui had become another new warming center, with a heating rate of 2.00°C/10a.
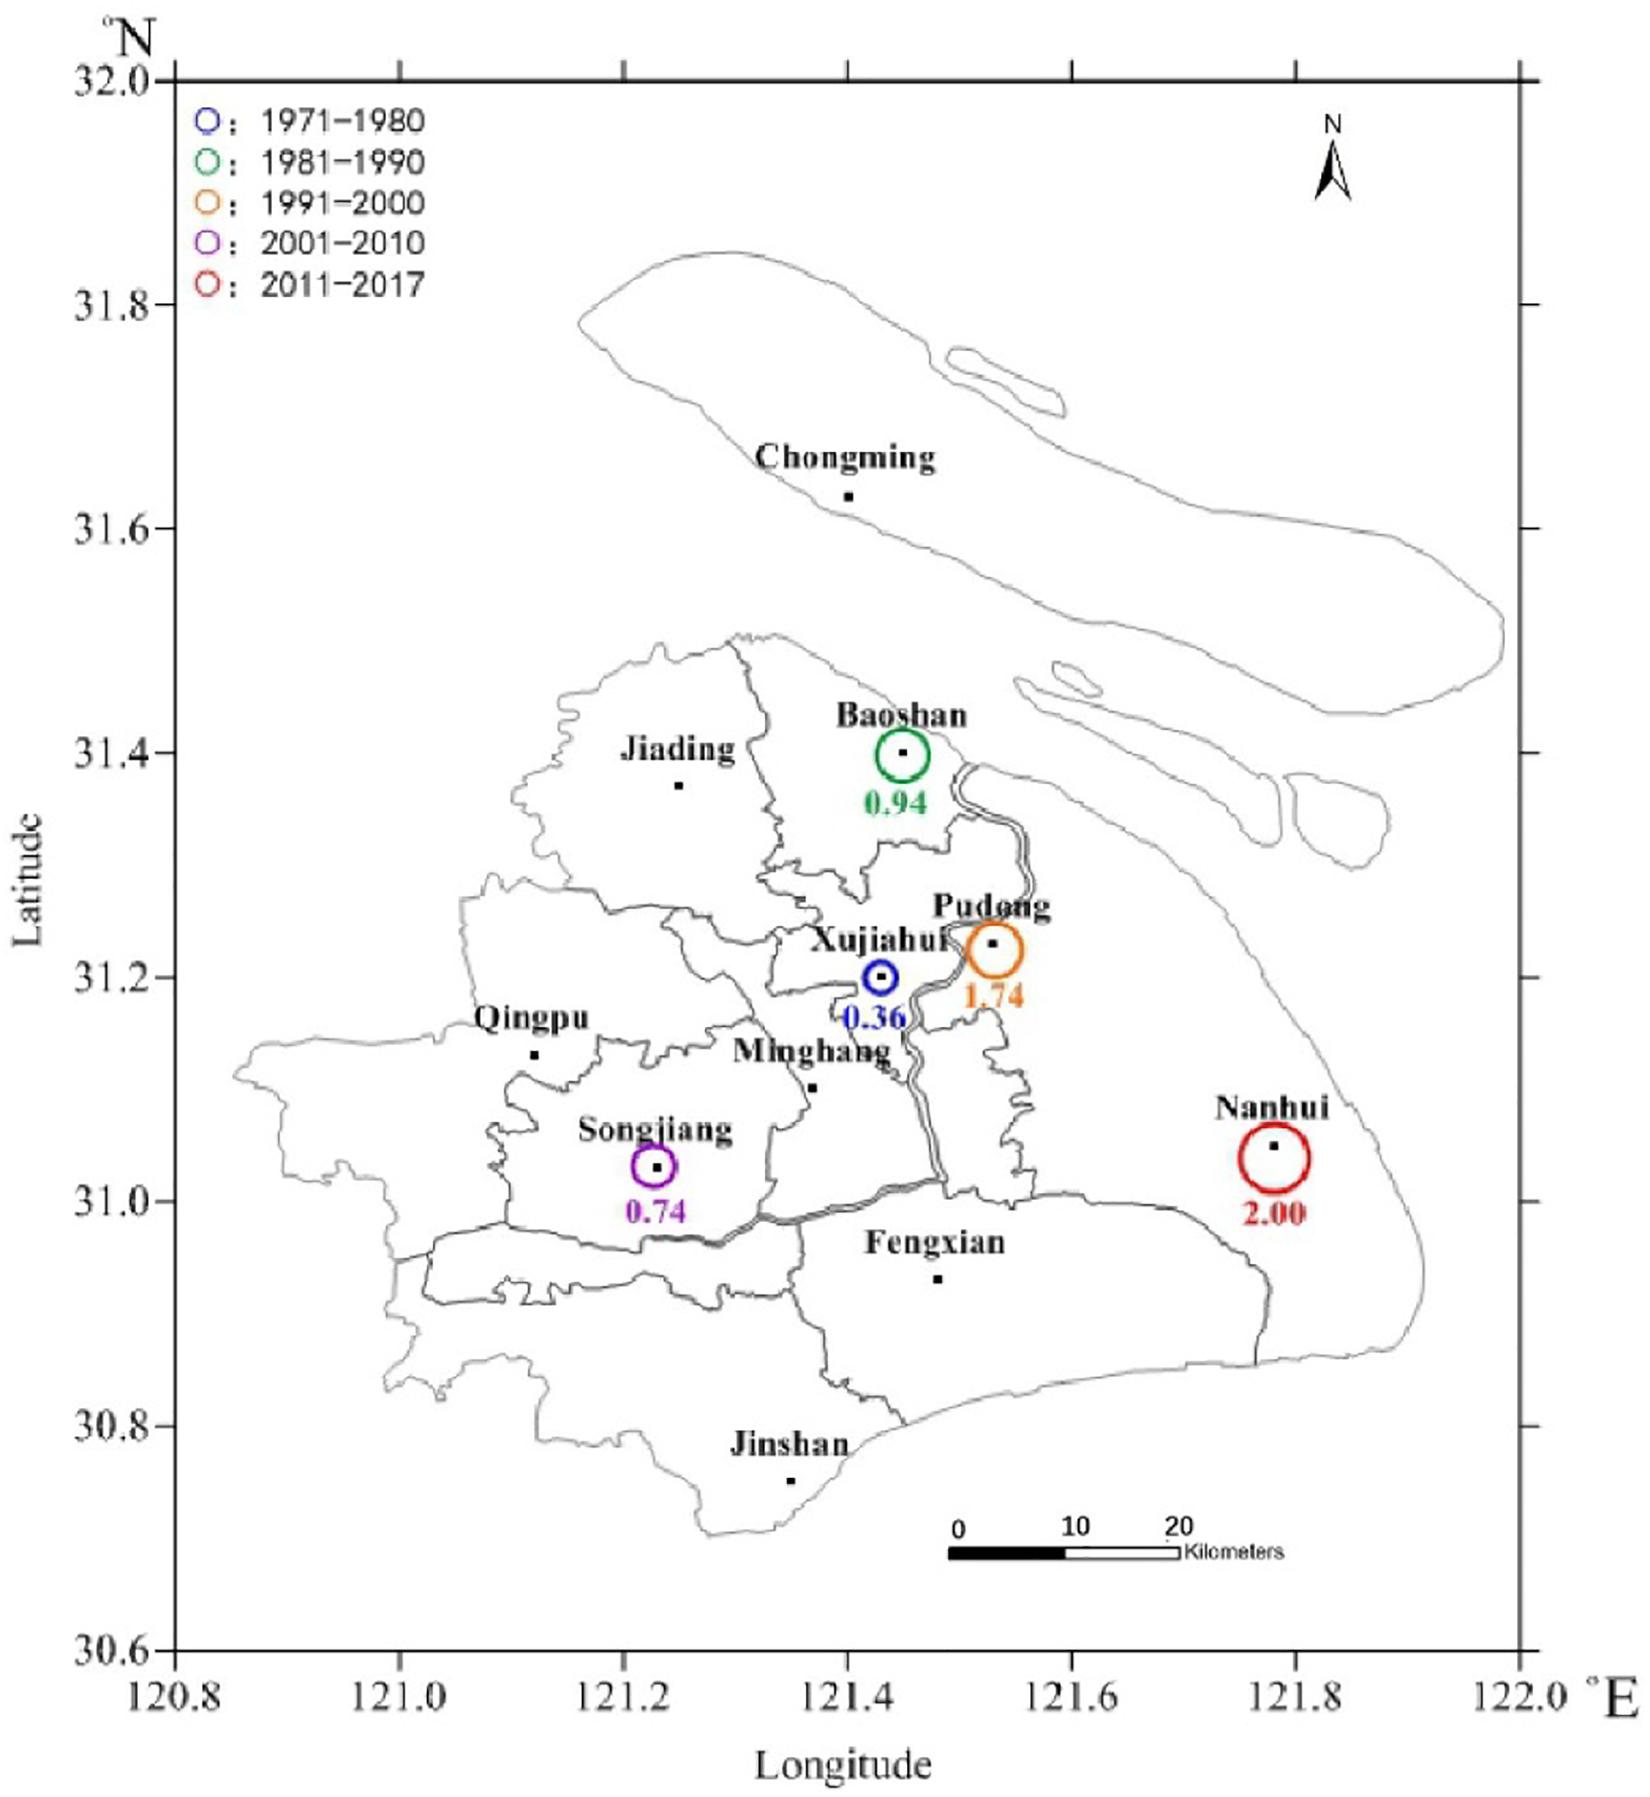
Figure 3. Locations and rates of the warming centers in Shanghai from 1971 to 2017 (unit: °C/10a).
Causes of the Migration of Warming Centers
Since the 1980s, the pace of urbanization in Shanghai has accelerated. The expansion of urban land caused the surface to absorb more heat, and largely prevented the way of heat dissipation through water vapor transpiration. Eventually, the regional surface temperature and air temperature rise. Besides, the urbanization process can also cause the temperature rising by greenhouse gas emissions and anthropogenic heat release. The urbanization contribution rates should be calculated to illustrate the warming effect caused by urbanization. The urbanization contribution rates is defined as follows (Zhou and Ren, 2005):
where CW is the urbanization contribution rate to temperature increasing, HRW is the heating rate of the warming center, and HRR is the heating rate of the respective rural station (Fengxian station).
Table 2 shows the maximum heating rates, the urbanization contribution rates, the maximum growth rates of the construction area, and population density in each decade compared to the previous decade. It is found that the migration of warming centers was closely related to the growth of construction land area and population density. The warming center in each decade was exactly located in the district where the construction land area and population density increased fastest. In the 1990s, the construction land area and the population density of Pudong increases by 66.7% and 128.5%, respectively, compared with the 1980s. Thus, Pudong becomes a center of urban warming with a maximum heating rate of 0.67°C/10a, 38.5% of which was caused by urbanization. After 10 years of development, the construction land area of Songjiang increased by 106.6%, and the population density increased by 146.8% compared with those in the 1990s. Also, Songjiang became a new warming center with a maximum heating rate of 0.50°C/10a in the 2000s, with the urbanization contribution rates of 68.2%. Since 2011, relying on the industrial upgrading and the construction of Nanhui New City and Disneyland, the construction land area of Nanhui increased by 86.3%, and the population density increased by 36.4%. Thus Nanhui became another new warming center with a maximum heating rate of 2.0°C/10a, 15.0% of which was caused by urbanization. It can be seen that the location of the warming center mainly depends on the growth of metropolitan construction land area and population density.
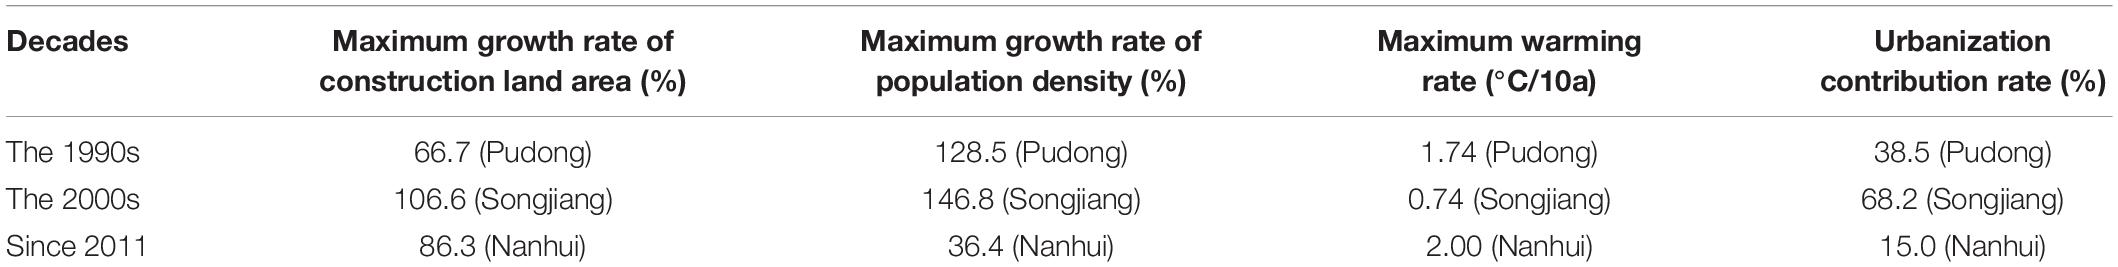
Table 2. The maximum heating rate, urbanization contribution rate, the maximum growth rates of the construction area and population density in each decade.
Interannual Variation in Urban Heat Island Intensity
Figure 4A shows the variation of the annual mean UHI intensity in Shanghai from 1961 to 2017. It can be seen that since the 1960s, the intensity of UHI in Shanghai had shown three distinct stages successively: slow growth period (1961–1986), rapid growth period (1987–2004), and obvious deceleration period (2005–2017). During the slow growth period, the intensity of UHI increased slowly, with a growth rate of 0.13°C/10a. From 1987 to 2004, it rose rapidly with a growth rate of 0.60°C/10a and reached a peak (1.5°C) in 2004. Since 2005, the intensity of UHI decreased significantly, and the decline rate of UHI intensity was 0.43°C/10a.
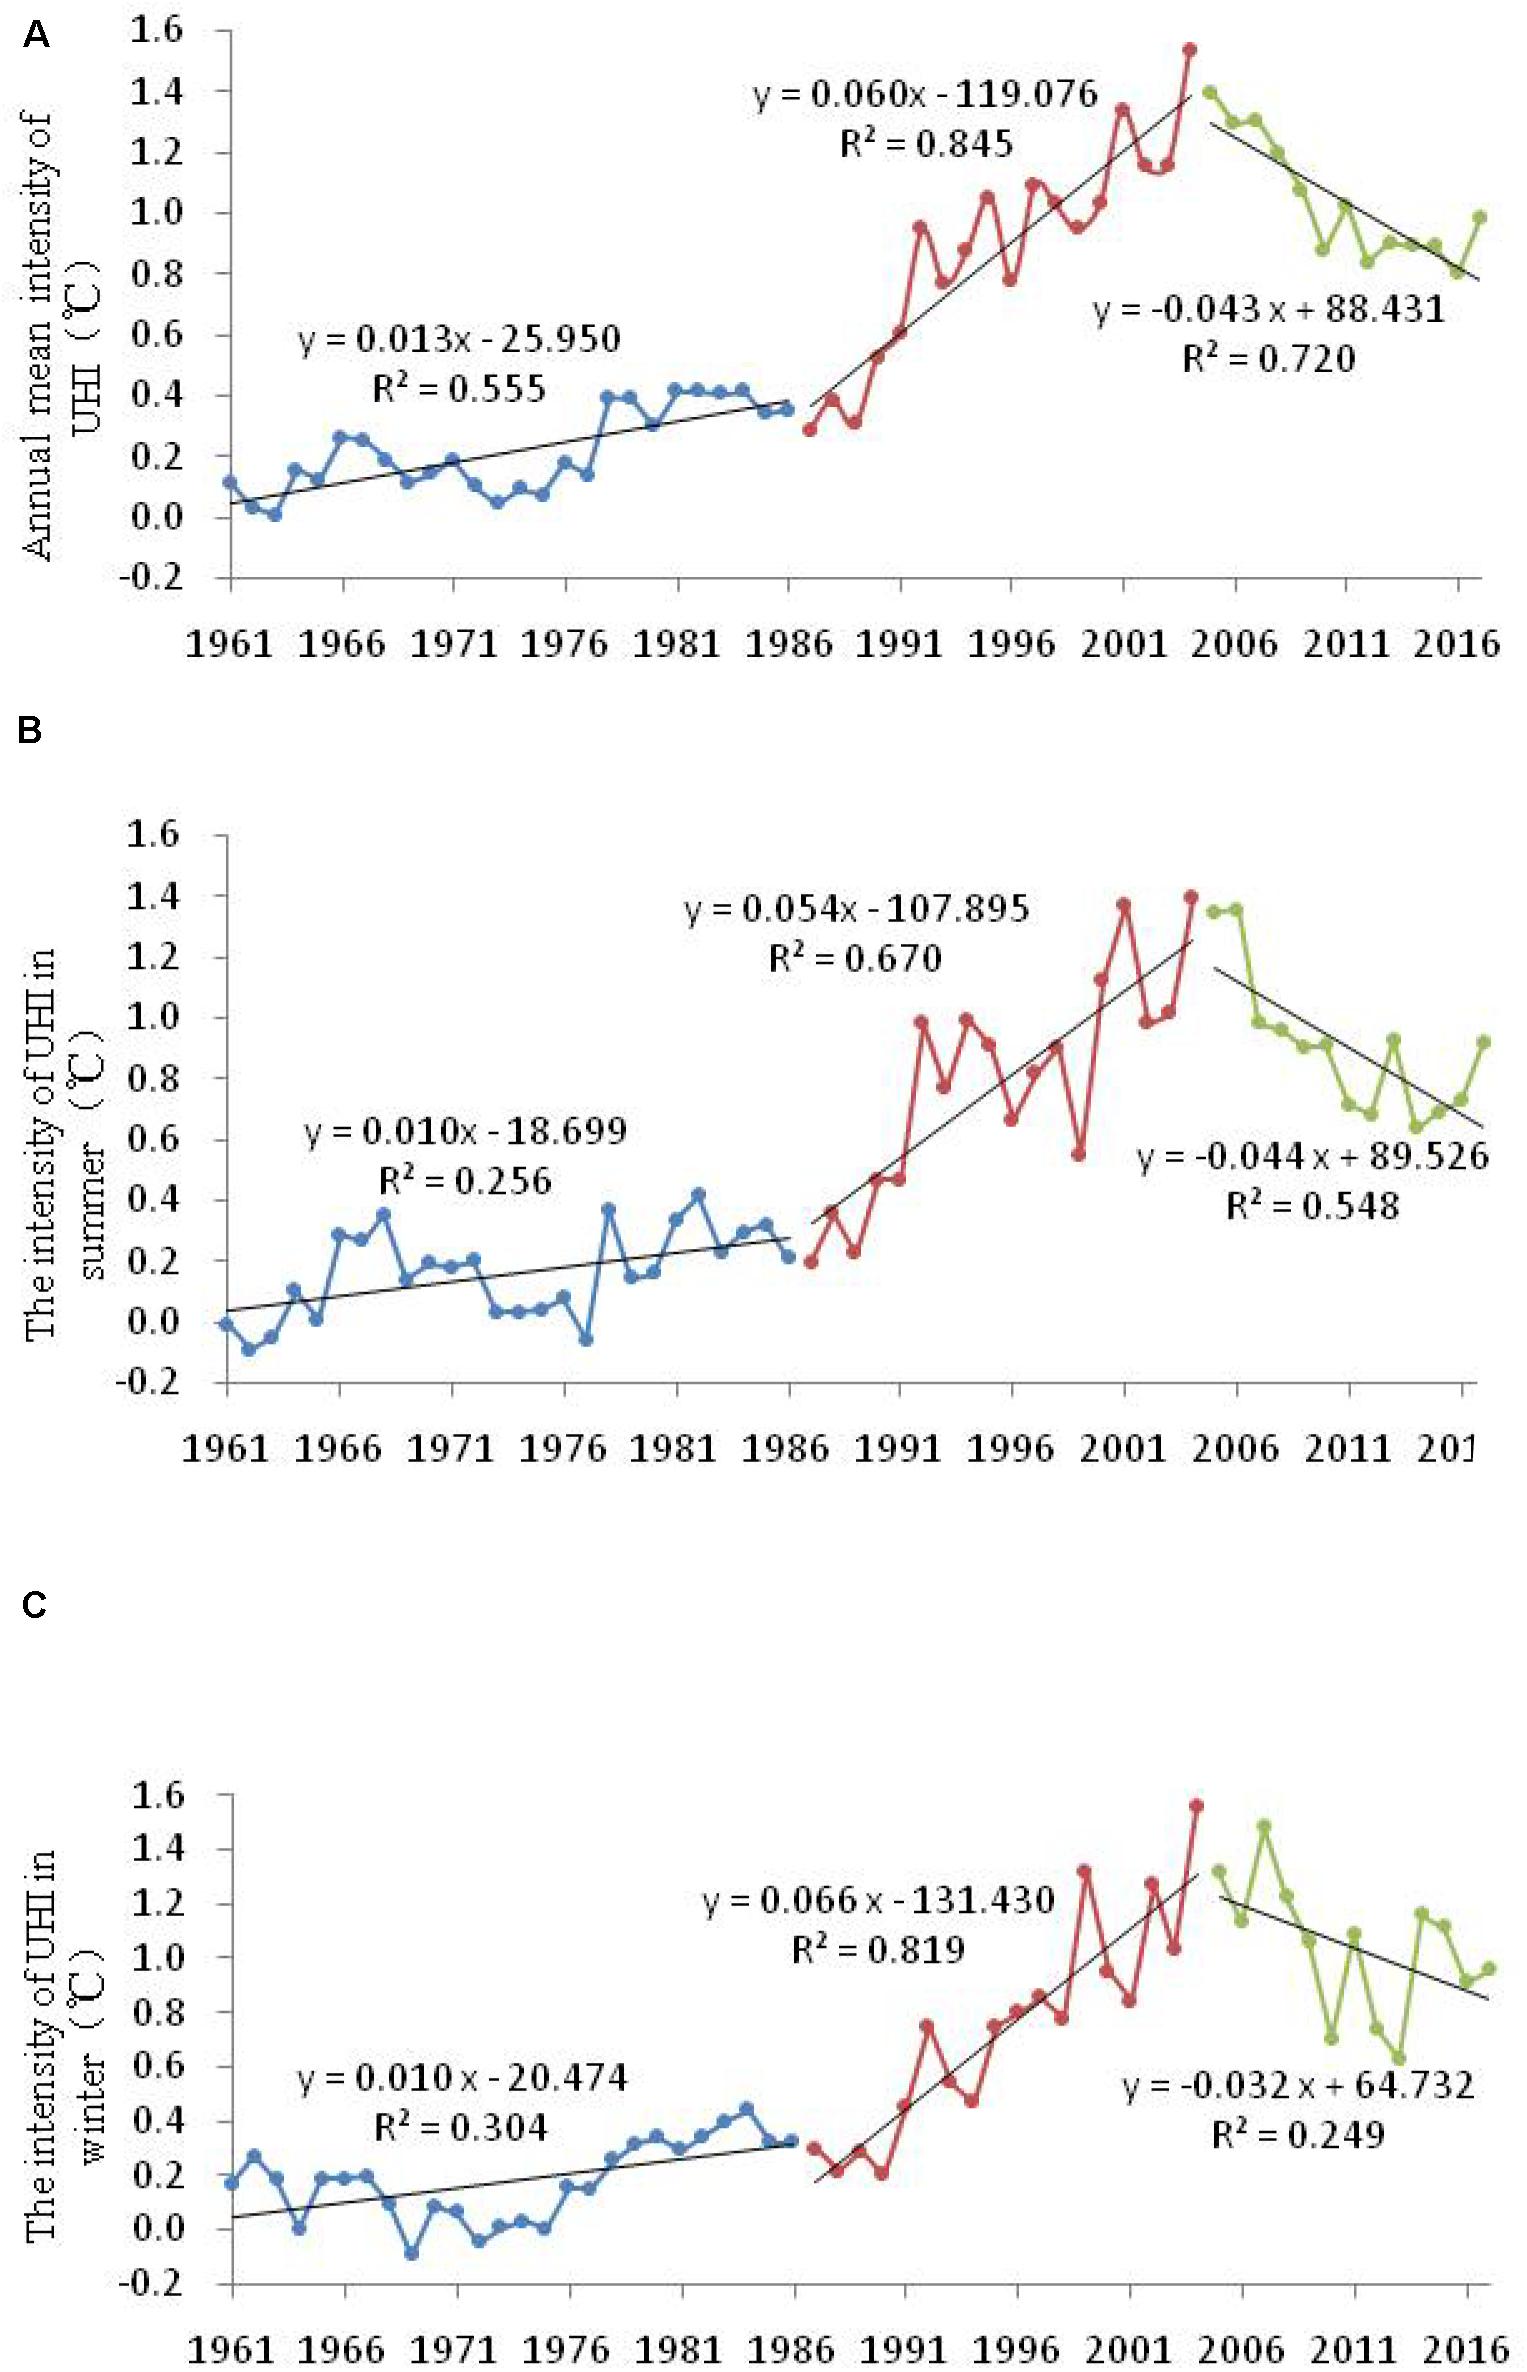
Figure 4. The annual (A), summer (B), and winter (C) UHI intensities in Shanghai from 1961 to 2017.
Figures 4B,C shows the annual variation of the UHI intensity in summer and winter from 1961 to 2017. It can be seen that the variation trends of UHI in summer and winter were similar to that of the annual UHI intensity, and both reached a peak in 2004. During the rapid growth period, the growth rate of UHI was faster in winter than that in summer, which was 0.66°C/10a and 0.54°C/10a, respectively. However, in the obvious slowdown period, the decline rate of UHI was slower in winter than that in summer, which was 0.32°C/10a and 0.44°C/10a, respectively.
Table 3 shows the UHI intensities for the four seasons during different periods. The annual mean UHI intensity is 0.61°C. During the slow growth period and the rapid growth period, the largest UHI intensity both occurred in autumn, which was 0.28°C and 1.07°C, respectively; and the intensity of UHI in spring ranked the second with 0.25°C and 0.89°C, respectively. In the obvious deceleration period, the UHI intensity in spring, summer, and winter was all greater than those in the period of rapid growth. However, in autumn, the UHI intensity decreased, and the largest UHI intensity occurred in spring, which was 1.23°C, the second-largest occurred in autumn, which was 0.97°C. In the past 57 years, the UHI intensity in autumn and spring was relatively strong, with the intensity of 0.69°C and 0.67°C, respectively, while the UHI intensity of winter and summer was relatively weak, with the intensity of 0.55°C and 0.53°C, respectively.
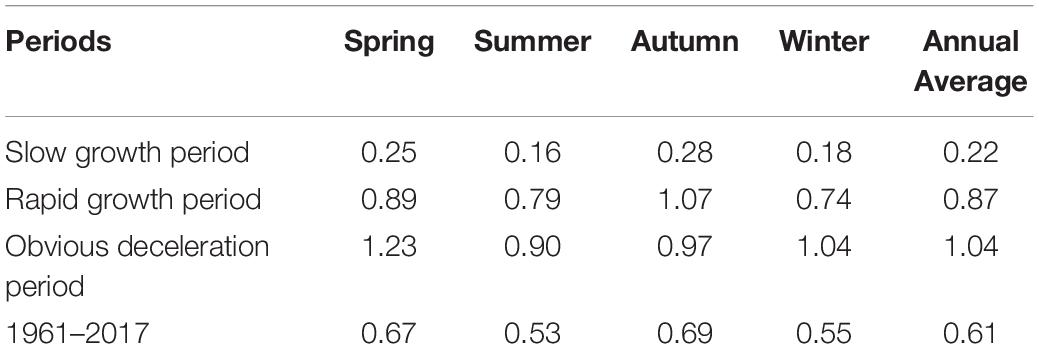
Table 3. The UHI intensity in spring, summer, autumn, and winter during different periods (unit: °C).
The seasonal variation of UHI intensity was related to weather and climate conditions (Montavez et al., 2000; Unger et al., 2001; Kim and Baik, 2002). Shanghai has the least amount of clouds and the lowest wind speed in autumn, which is conducive to the formation of heat islands. However, in summer, there is more unstable weather. After precipitation, the soil moisture in rural areas is close to saturation, and the difference in heat capacity between urban and rural areas is reduced, which is not conducive to the formation of heat islands (Deng et al., 2001).
The daily maximum temperature generally appears in the afternoon, while the daily minimum temperature appears at night. Therefore, the difference of the mean daily maximum temperature between Xujiahui and Fengxian stations was defined as the daytime heat island intensity, and the difference of the mean daily minimum temperature between these two stations was defined as the nighttime heat island intensity in this paper.
Figure 5 shows the daytime and nighttime heat island intensity in Shanghai from 1961 to 2017. Overall, both trends of the annual variations were the same as those of the annual mean heat island intensity in Figure 4A, and they all displayed a pattern of “slow growth – rapid growth – obvious deceleration.” The difference is that the growth rate and decline rate of the night heat island intensity in the rising and falling period were higher than those of the daytime heat island intensity, which indicated that the night heat island had more significant impacts on the UHI intensity in Shanghai. In the past 57 years, the average UHI intensity in nighttime was 0.40°C higher than that in the daytime. The most considerable night heat island intensity was 2.64°C, which appeared in 2004, while the most considerable daytime heat island intensity was 1.49°C, which appeared in 2001.
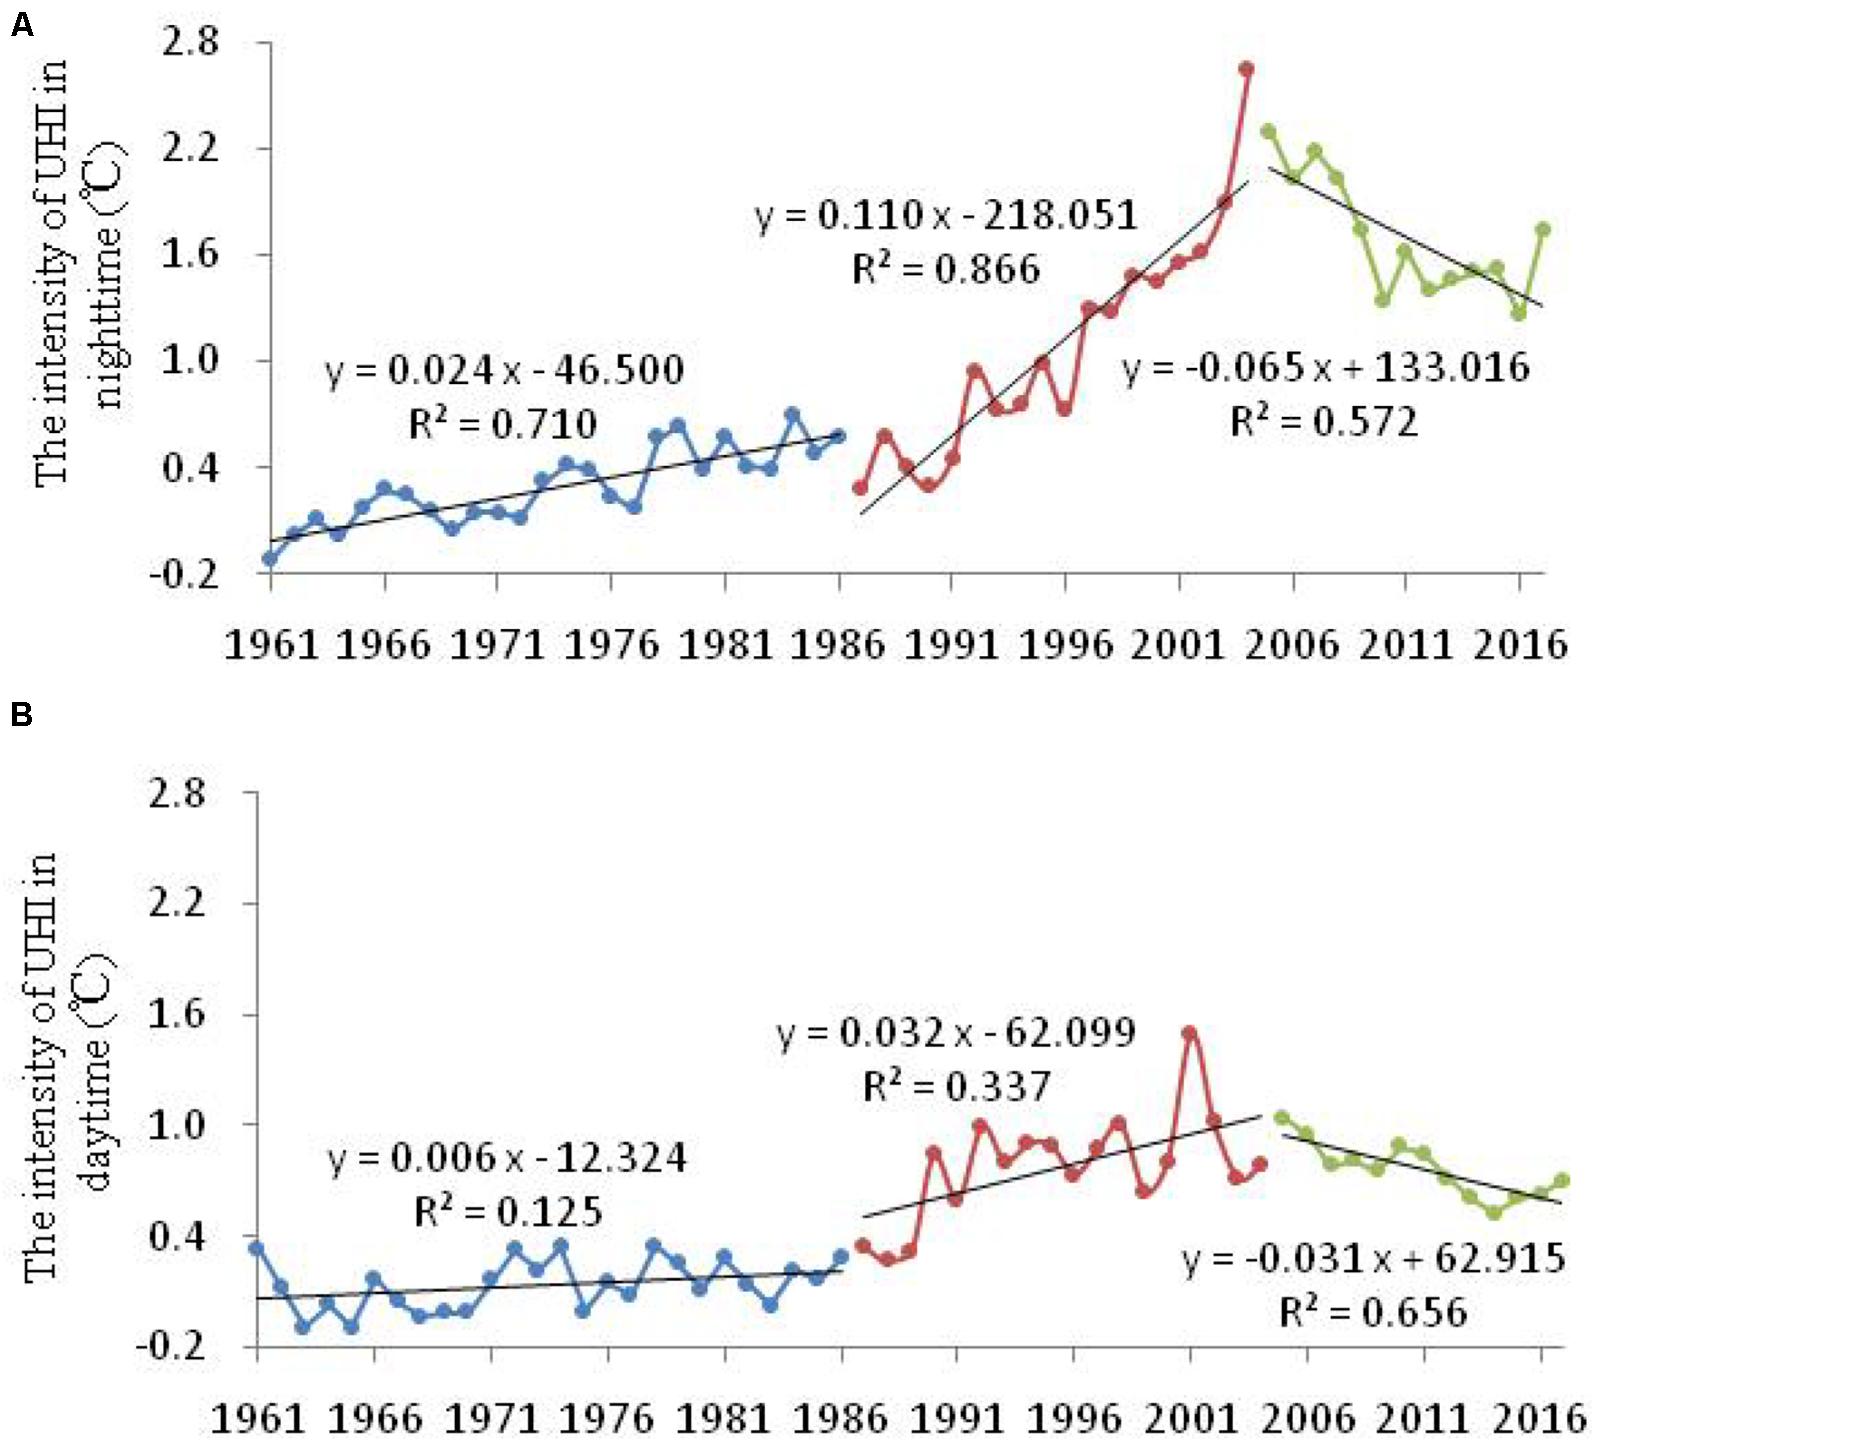
Figure 5. The annual mean UHI intensity in nighttime (A) and daytime (B) in Shanghai from 1961 to 2017.
Spatial Expansion of Urban Heat Islands
To display the spatial expansion of UHI clearly, the distribution of different levels of UHI intensity from the 1960s to the present is discussed in this section. Figures 6A,B show the distribution of different levels of UHI intensity from the 1960s to 1990s and from the 2000s to the present, respectively. It can be seen from Figure 6A that from the 1960s to the 1990s, the strength of the heat island in Shanghai continued to increase and the heat island area gradually expanded from the central urban to the surrounding area. Between the 1960s and 1980s, the 0.1°C heat island line migrated from urban areas to Baoshan, Jiading, Minhang, and Pudong successively. In the 1990s, the heat island range and its intensity developed rapidly. The 0.1°C heat island line extended to the majority of Qingpu, northern Songjiang, and northeastern Fengxian, while the urban and suburban areas were located within the 0.3°C heat island line. Since the beginning of this century, the heat island area of Shanghai had gradually expanded to the southwest (Figure 6B). By the first decade of this century, it extended to almost the entire Shanghai area except for Chongming Island, Nanhui, and Fengxian. However, since 2011, the UHI intensity weakened, and the heat island area also reduced correspondingly. The region with heat island intensity larger than 0.5°C had generally retreated. In general, the heat island developed from the urban to the surrounding suburbs before the 21st century and then began to expand toward the southwest since the 2000s.
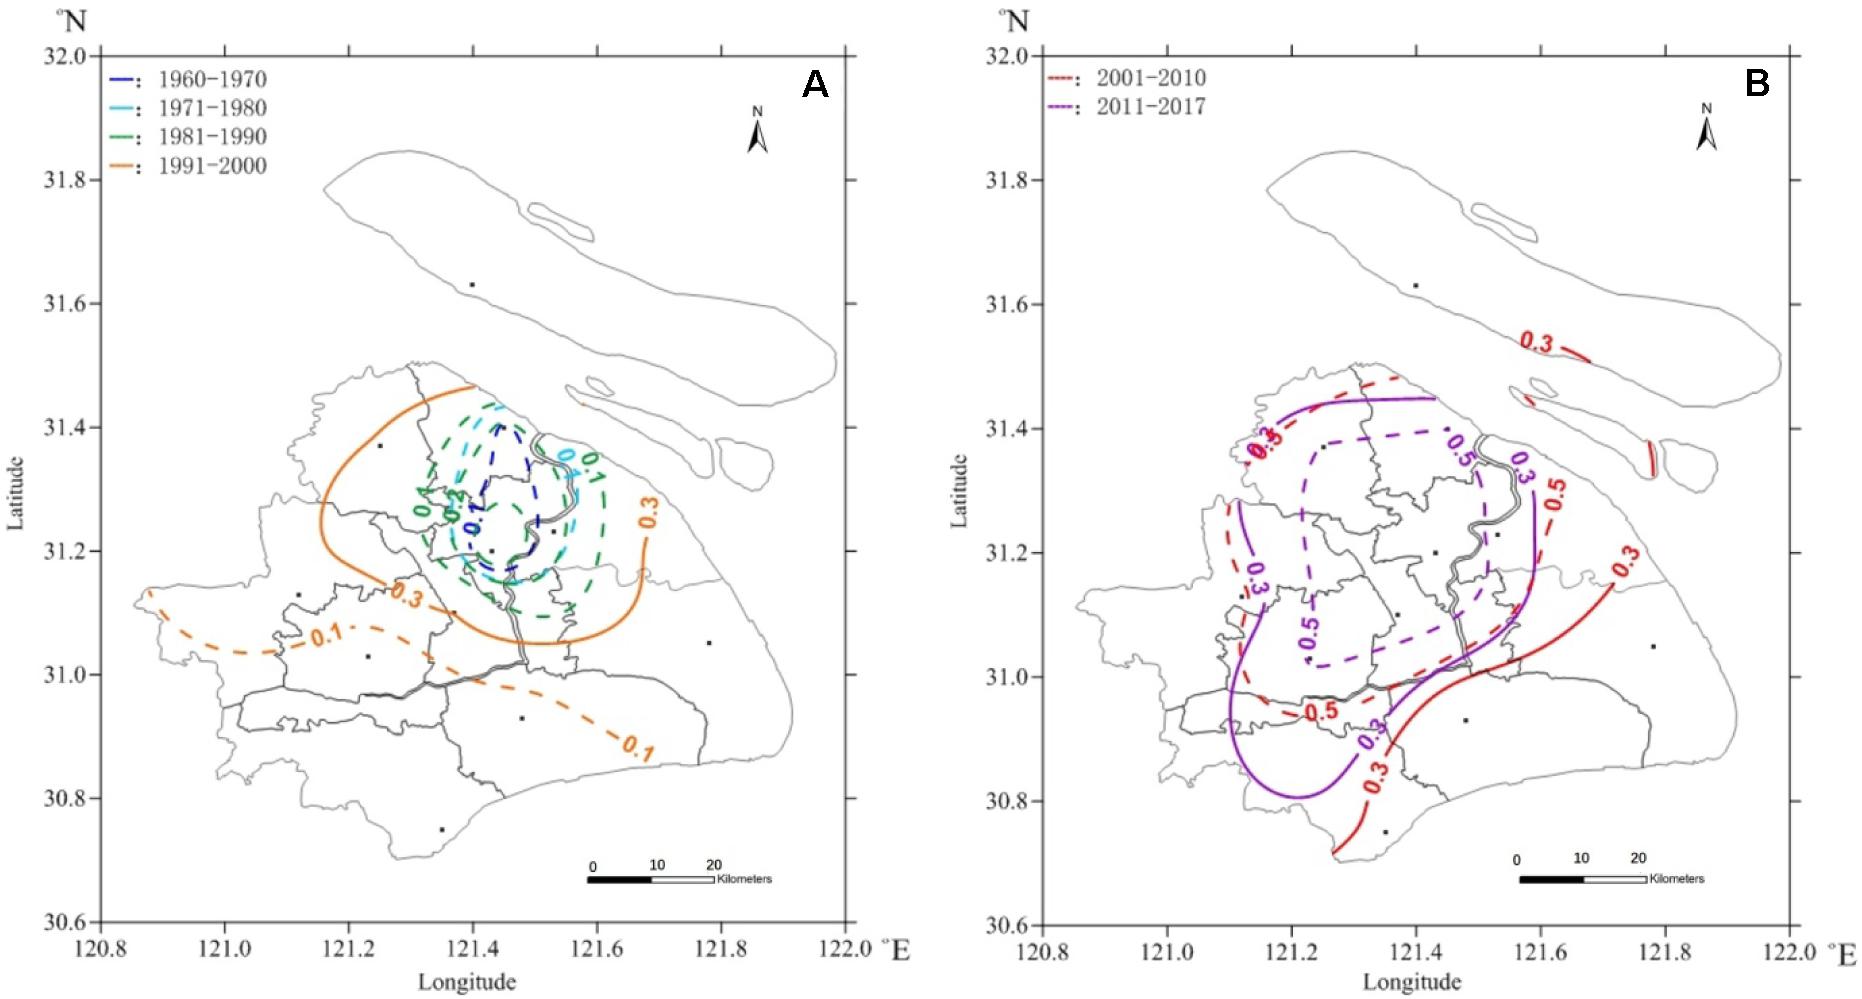
Figure 6. The distribution of different levels of heat islands intensity (unit: °C) from the 1960s to 1990s (A) and from 2000s to the present (B).
Discussion
It is estimated that 55% of the global population lives in urban areas in 2018, and this percentage will reach 68% by 2050 [United Nations, Department of Economic and Social Affairs, Population Division (UN-DESA), 2019]. Owing to increasing population densities and impervious surface areas, heat island effects increasingly dominate urban environments (Guo et al., 2020). Before the 21st century, the UHI of Shanghai expanded to the surrounding suburbs in circles and then began to expand radially toward the southwest. This result is consistent with the previous study (Shen et al., 2017), who concluded that the Shanghai heat island extended from the urban to the surroundings and the southwest based on the automatic meteorological station data. It is worth to mention that this paper is based on the historical data of the national meteorological stations with a longer time scale, which reveals the expansion of the decadal variations in warming centers and heat island in Shanghai in more details.
After the 1980s, Shanghai’s warming center experienced a transition from the urban to Baoshan, Pudong, Songjiang, and Nanhui (Figure 3). Through the statistical analysis of the increase of construction land area and population density in the warming center, it is found that the warming centers in all decades are located in the areas with the fastest development of construction land area and population density for decades. This shows that urbanization has the most direct and important impact on the location of the warming center. Changes in land use/land cover (LULC) and population shifts resulted in significant variation in the spatiotemporal patterns of the UHIs due to the loss of water bodies and vegetated surfaces (Zhang et al., 2013). The annual average heat island intensity in Shanghai decreased significantly at the rate of 0.43°C/10a after 2005 (Figure 4A), which is consistent with the result of Zhou et al. (2008). They discovered the weakening phenomenon of Shanghai heat island intensity after 2004 based on remote sensing dynamic monitoring and GIS multi-element spatial analysis technology. The rapid outward expansion of the extent of the developed area has led to considerable changes in the surface energy balance and heat flux, in particular increasing the sensible heat flux due to the loss of water bodies and vegetated surfaces, and thus, the LST difference between the city proper and the urban fringe is less than before (Zhang et al., 2013). Meanwhile, in responding to the overall arrangement of industries, well-developed satellite towns emerged around the central urban area, and great efforts were made to improve the overall thermal environment in the central urban area, including removing the residences to the satellite towns and rebuild the water bodies and green space in the inner part of the central urban area (Li et al., 2009).
It was found that recently the increasing green space can partly help to mitigate the UHI effect in the central urban area (Ge et al., 2005). The mitigation of the UHI effect after 2005 is associated with the construction of large parks or the expansion of urban green space. Figure 7 shows the mean annual NDVI during 2001–2005 and 2011–2015 based on the SPOT VGT–NDVI data (Cui and Shi, 2010). During these two periods, the areas with higher NDVI (NDVI > 0.40) and lower NDVI (NDVI ≤ 0.20) have both decreased, but the area with middle NDVI (0.21 ≤ NDVI ≤ 0.40) has increased significantly in Shanghai. During 2001–2005 and 2011–2015, the area of higher mean annual NDVI accounted for 63.8% and 53.5% of the total area, respectively, and the area of lower mean annual NDVI accounted for 8.3% and 5.8%, respectively. The area of middle mean annual NDVI accounted for 27.9% and 40.7% of the total area, respectively, during 2001–2005 and 2011–2015. During 2001–2005, the urban areas are mainly with lower NDVI. However, the area of middle NDVI in the urban areas increased obviously during 2011–2015. Figure 8 presents the annual change of NDVI in the urban areas of Shanghai. It indicates that NDVI has increased significantly. The mean annual NDVI has increased at a rate of 0.06/10a from 2001 to 2018, with the highest mean annual NDVI of 0.26 in 2017 and the lowest mean annual NDVI of 0.16 in 2001. The increased green space may result in a decrease of UHI during 2005–2017.
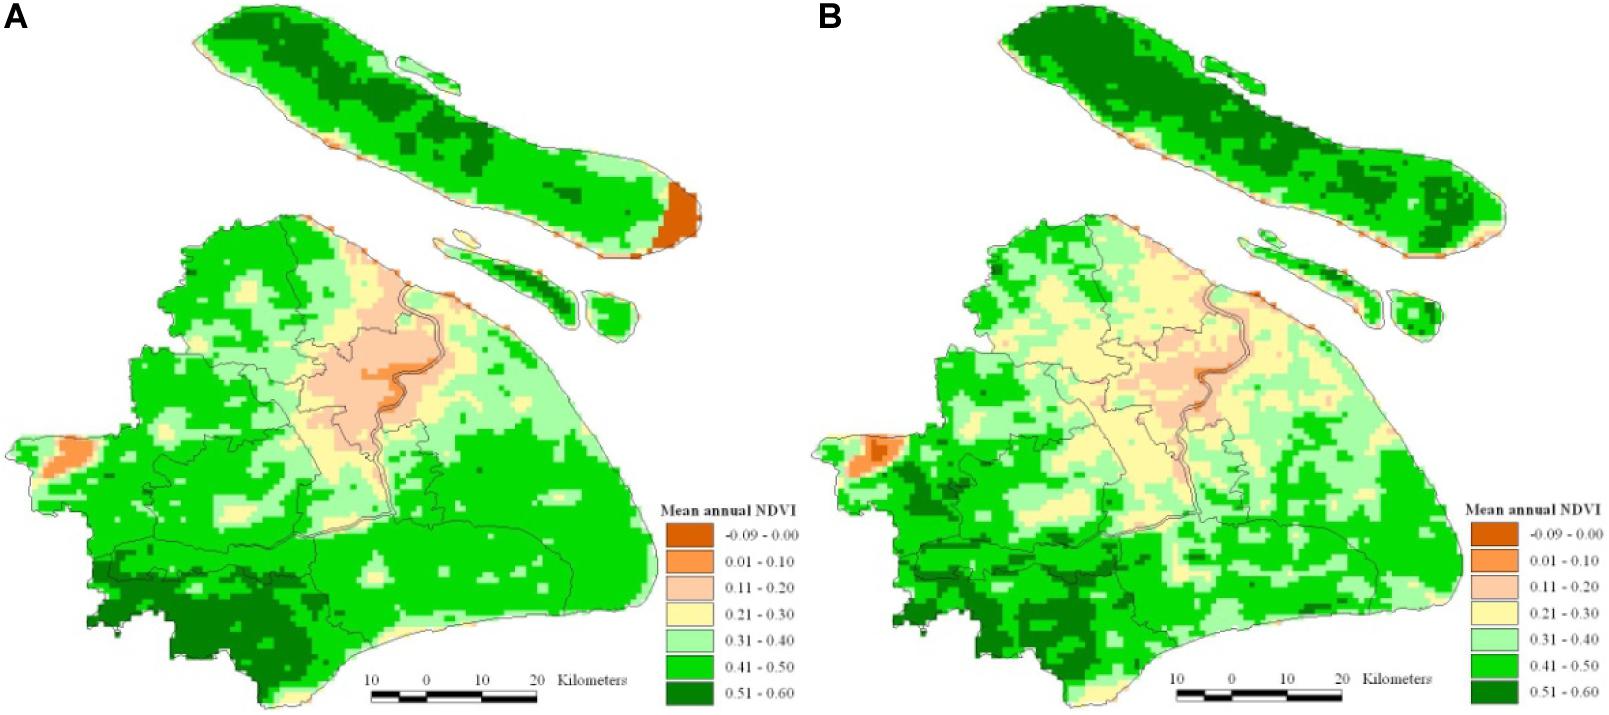
Figure 7. Mean annual NDVI in Shanghai during 2001–2005 (A) and during 2011–2015 (B).
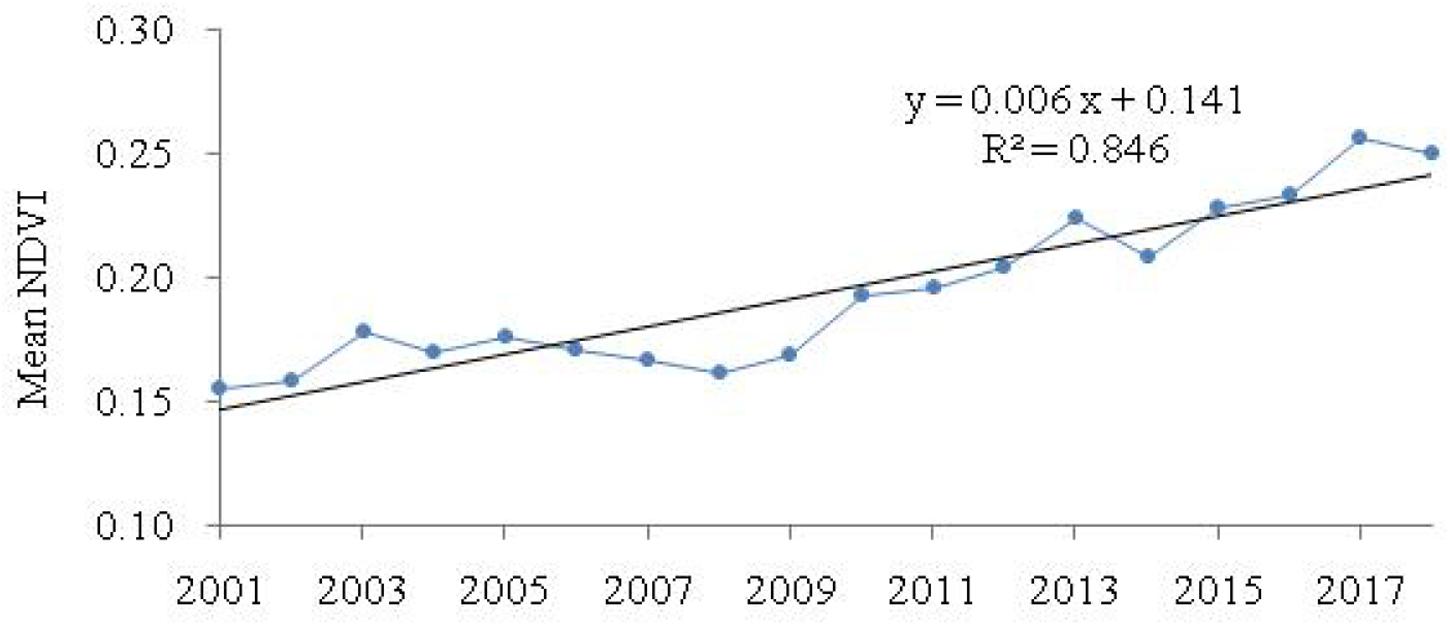
Figure 8. The annual change of NDVI in the urban areas of Shanghai.
The regional development and construction not only change the state of the underlying surface but also cause the influx of a large number of people and more artificial heat, eventually leading to the increase of urban temperatures. The influences of human migration on urban climate are complex, which are often intertwined with local background climate, weather conditions, city size, and the characteristics and pattern of human migration (Huang and Lu, 2017). In addition to the urban construction land area and population density, the influence of grassland, forest, and water areas, and other factors on temperature should also be considered, and the relationships between the heating rates and these impact factors should be further explored. The relevant models are also needed to provide scientific guidance for mitigating the UHI effect. In the near future, we will use the method of information flow (Liang, 2014; Xiao et al., 2020) and reconstruction of driving forces (Zhang et al., 2017) to analyse thecauses of the temporal and spatial variation characters of UHI.
Conclusion
Due to global warming and regional urbanization, temperature changes in Shanghai present significant regional characteristics. Before the reform and opening up in 1978, the temperature in the urban, suburban, and rural areas showed a consistent trend. After 1978, the temperature in urban areas became significantly higher than that of suburban and rural areas. But there was still little difference between suburban and rural areas until the 1990s. With the rapid urbanization in suburban areas after the 1990s, the temperature difference between the suburb and the rural areas began to increase.
Since the 1980s, the warming center in Shanghai experienced a process of change from Baoshan to Pudong, Songjiang, and Nanhui, with a heating rate of 0.94°C/10a, 1.74°C/10a, 0.74°C/10a, and 2.00°C/10a, respectively. The shifting of the location of the warming center mainly depends on the growth of metropolitan construction land area and population density. The evolution of the urban warming center was closely related to the increase in construction land area and population density. The warming centers in all decades were located in the areas with the fastest growth of construction land and population density.
From 1961 to 2017, the intensity of UHI in Shanghai showed three stages successively: slow growth stage (1961–1986) with the growth rate of 0.13°C/10a, rapid growth (1987–2204) stage with the growth rate of 0.60°C/10a, and obvious deceleration stage (2005–2017) with the decline rate 0.43°C/10a. The annual mean UHI intensity is 0.61°C. In spring and autumn, the range of UHI intensity was stronger, while it was weaker in winter and summer. The intensity of UHI in the nighttime was 0.4°C greater than that of the daytime. The heat island area extended from the urban area to the surrounding suburbs and the southwestern rural area, but after 2011, the range of heat island showed a decreasing trend.
Data Availability Statement
The original contributions presented in the study are included in the article/supplementary material, further inquiries can be directed to the corresponding authors.
Author Contributions
ZS: conceptualization, software, investigation, and resources. ZS and HY: methodology. ZS and JS: validation, formal analysis, and data curation. ZS, JS, JT, and HY: writing – original draft preparation and writing – review and editing. All authors contributed to the article and approved the submitted version.
Funding
The authors give thanks for funding provided by the National Key R&D Program of China (No. 2018YFC1507002), the National Natural Science Foundation of China (Nos. 41775019 and 41571044), the Science and Technology Commission of Shanghai Municipality, China (No. 20232410100), and the research project of Shanghai Meteorological Bureau (YJ201804).
Conflict of Interest
The authors declare that the research was conducted in the absence of any commercial or financial relationships that could be construed as a potential conflict of interest.
Footnotes
References
Adebayo, Y. R. (1987). A note on the effects of urbanization on temperature in Ibadan. Int. J. Climatol. 7, 185–192. doi: 10.1002/joc.3370070209
Arnfiled, A. J. (2003). Two decades of urban climate research: a review of turbulence, exchanges of energy and water, and the urban heat island. Int. J. Climatol. 23, 1–26. doi: 10.1002/joc.859
Bahi, H., Rhinane, H., Bensalmia, A., Fehrenbach, U., and Scherer, D. (2016). Effects of urbanization and seasonal cycle on the surface urban heat island patterns in the coastal growing cities: a case study of casablanca, Morocco. Rem. Sens. 8:829. doi: 10.3390/rs8100829
Baik, J. J., Kim, Y. H., and Chun, H. Y. (2001). Dry and moist convection forced by an urban heat island. J. Appl. Meteor. 411, 1462–1475. doi: 10.1175/1520-0450(2001)040<1462:damcfb>2.0.co;2
Bailing, R. C., and Brazell, S. W. (1988). High-resolution surface temperature patterns in a complex urban terrain. Photogramm. Eng. Remote 54, 1289–1293. doi: 10.4236/jgis.2014.66055
Chen, B., Dong, L., Liu, X., Shi, G. Y., Nakajima, T., and Chen, L. (2016). Exploring the global climatic effect of anthropogenic heat release: a global climate model study. Int. J. Climatol. 36, 4790–4796. doi: 10.1002/joc.4669
Chen, B., Wu, C., Liu, X., Chen, L., Wu, J., Yang, H., et al. (2019). Seasonal climatic effects and feedbacks of anthropogenic heat release due to global energy consumption with CAM5. Clim. Dynam. 52, 6377–6390. doi: 10.1007/s00382-018-4528-1
Chen, Y., Zhang, N., and Zhu, Y. (2019). High- Resolution simulations of the urban thermal climate in Suzhou city. China. Atmos. 10:118. doi: 10.3390/atmos10030118
Cui, L., and Shi, J. (2010). Temporal and spatial response of vegetation NDVI to temperature and precipitation in eastern China. J. Geogr. Sci. 20, 163–176. doi: 10.1007/s11442-010-0163-4
Cui, Y. P., Liu, J. Y., and Qin, Y. C. (2015). The impact of urban sprawl on heat island intensity in Beijing. J. Ecol. 34, 3485–3493.
Deng, L. T., Shu, J., and Li, C. Y. (2001). Character analysis of Shanghai urban heat island. J. Tropical Meteor. 17, 273–280.
Ewing, R., and Rong, F. (2008). The impact of urban form on US residential energy use. Hous. Policy Debate 19, 1030–1036.
Feng, Y., Zhen, J. H., Dong, Q., and Tao, Y. (2018). Study on the heat island effect of urban spatial expansion in Hohhot. J. Inner. Mongolia Agri. Unit 39, 45–51.
Founda, D., and Santamouris, M. (2017). Synergies between urban heat island and heat waves in Athens (Greece), during an extremely hot summer(2012). Sci. Rep. 7:10973. doi: 10.1038/s41598-017-11407-11406
Ge, W.-Q., Zhou, H.-M., and Tu, D.-J. (2005). The surveying on thermal influence area of Shanghai urban greenbelt. Remote Sens Technol. Appl. 20, 496–500.
Guo, A., Yang, J. X. X., Xia, J., Jin, C., and Li, X. (2020). Influences of urban spatial form on urban heat island effects at the community level in China. Sustain. Cities Soc. 53:101972. doi: 10.1016/j.scs.2019.101972
Huang, Q., and Lu, Y. (2017). Effects of short-term massive human migration during the Chinese New Year on the urban heat island effect in Shanghai. Climatic Environ. Res. 22, 708–716. doi: 10.3878/j.issn.1006-9585.2017.17041
Kim, Y. H., and Baik, J. J. (2002). Maximum urban heat island intensity in Seoul. J. Appl Meteor. 41, 651–659. doi: 10.1175/1520-0450(2002)041<0651:muhiii>2.0.co;2
Lemonsu, A., Viguié, V., Daniel, M., and Masson, V. (2015). Vulnerability to heat waves: Impact of urban expansion scenarios on urban heat island and heat stress in Paris (France). Urban Climate 14, 586–605. doi: 10.1016/j.uclim.2015.10.007
Li, J., Wang, X., Wang, X., Ma, W., and Zhang, H. (2009). Remote sensing evaluation of urban heat island and its spatial pattern of the Shanghai metropolitan area. China. Ecol. Complex. 6, 413–420. doi: 10.1016/j.ecocom.2009.02.002
Li, L., and Xu, H. Q. (2014). Urban expansion and thermal environment changes in hangzhou city of east China. Remote Sens. Technol. Appl. 29, 264–272.
Liang, P., Ding, Y., and He, J. (2011). Study of relationship between urbanization speed and change of spatial distribution of rainfall over Shanghai. J. Trop. Meteor. 27, 475–483.
Liang, X. S. (2014). Unraveling the cause-effect relation between time series. Phys. Rev. E 90:052150. doi: 10.1103/PhysRevE.90.052150
Magee, N., Curtis, J., and Wendler, G. (1999). The urban heat island effect at Fairbanks. Alaska Theor. Appl. Climatol. 64, 39–47. doi: 10.1007/s007040050109
Miao, L., Li, S., Zhang, F., Chen, T., Shan, Y., and Zhang, Y. (2020). Future drought in the dry lands of Asia under the 1.5 and 2.0°C warming scenarios. Earth’s Future. 8:e2019EF001337. doi: 10.1029/2019EF001337
Montavez, J. P., Rodriguez, A., and Jimenez, J. I. (2000). A study of the urban heat island of Granada. Int. J. Climatol. 20, 899–911. doi: 10.1002/1097-0088(20000630)20:8<899::aid-joc433>3.0.co;2-i
Nasrallah, H. A., Brazel, A. J., and Balling, R. C. (1990). Analysis of the Kuwait city urban heat island. Int. J. Climatol. 10, 401–405. doi: 10.1002/joc.3370100407
Quattrochi, D. A., Luvgall, J. C., Rickman, D. L., Estes, M. G. Jr., and Laymon, C. A. (2000). A decision support information system for urban landscape management using thermal infrared data. Photogramm. Eng. Remote Sens. 66, 1195–1207.
Ren, G., Li, J., Ren, Y., Chu, Z., Zhang, A., Zhou, Y., et al. (2015). An integrated procedure to determine reference station network for evaluating and adjusting urban bias in surface air temperature data. J. Appl. Meteor. Climatol. 54, 1248–1265.
Rizvi, S. H., Alam, K., and Iqbal, M. J. (2019). Spatio-temporal variations in urban heat island and its interaction with heat wave. J. Atmos. Sol. Terr. Phys. 185, 50–57. doi: 10.1016/j.jastp.2019.02.001
Rizvia, S. H., Alam, K., and Iqbal, M. J. (2019). Spatio-temporal variations in urban heat island and its interaction with heat wave. J. Atmos. Sol. Terr. Phys. 185, 50–57.
Shen, Z.-P., Liang, P., and He, J.-H. (2017). Analysis on the climatic characteristics of the fine structure of the urban heat island in Shanghai. Trans. Atmos. Sci. 40, 369–378.
Shi, J., Liang, P., and Wan, Q.-L. (2011). A review of the progress of research on urban climate. J. Trop. Meteor. 27, 942–951.
Stone, B., and Norman, J.-M. (2006). Land use planning and surface heat island formation: a parcel-based radiation flux approach. Atmos. Environ. 40, 3561–3573. doi: 10.1016/j.atmosenv.2006.01.015
Su, W.-Z., Yang, Y.-B., and Yang, G.-S. (2005). Distributional characteristics of urban thermal space and relations with land use/cover of Nanjing. Sci. Geograph. Sni. 25, 697–703.
Unger, J., Sümeghy, Z., and Zoboki, J. (2001). Temperature cross-section features in an urban area. Atmos. Res. 58, 117–127. doi: 10.1016/S0169-8095(01)00087-4
United Nations, Department of Economic and Social Affairs, Population Division (UN-DESA) (2019). World Urbanization Prospects: The 2018 Revision (ST/ESA/SER.A/420). New York, NY: United Nations.
Unwin, D. J. (1980). The synoptic climatology of Birmingham’s heat island. Wea 35, 43–50. doi: 10.1002/j.1477-8696.1980.tb03484.x
Wang, J., Huang, B., Fu, D. J., Atkinson, P. M., and Zhang, X. Z. (2016). Response of urban heat island to future urban expansion over the Beijing-Tianjin-Hebei metropolitan area. Appl. Geogra 70, 26–36. doi: 10.1016/j.apgeog.2016.02.010
Xiao, H., Zhang, F., Miao, L., Liang, X. S., Wu, K., and Liu, R. (2020). Long-term trends in Arctic surface temperature and potential causality over the last 100 years. Climate Dyn. 55, 1443–1456. doi: 10.1007/s00382-020-05330-2
Yang, P., Ren, G.-Y., and Liu, W.-D. (2013). Spatial and temporal characteristics of Beijing urban heat island intensity. J. Theor. Appl. Climatol. 52, 1803–1816. doi: 10.1175/jamc-d-12-0125.1
Yang, X., Hou, Y., and Chen, B. (2011). Observed surface warming induced by urbanization in east China. J. Geophys. Res. 116:D14113.
Yang, X., Ruby Leung, L., Zhao, N., Zhao, C., Qian, Y., Hu, K., et al. (2017). Contribution of urbanization to the increase of extreme heat events in an urban agglomeration in east China. Geophys. Res. Lett. 44, 6940–6950. doi: 10.1002/2017gl074084
Yan-Ling, S., and Shang-Yin, Z. (2003). The study on UHI of Beijing city in recent years. J. Eco Agric. 11, 126–129.
Zhang, F., Yang, P., Fraedrich, K., Zhou, X., Wang, G., and Li, J. (2017). Reconstruction of driving forces from nonstationary time series including stationary regions and application to climate change. Physica A 473, 337–343. doi: 10.1016/j.physa.2016.12.088
Zhang, H., Qi, Z., Ye, X., Cai, Y., Ma, W., and Chen, M. (2013). Analysis of land use/land cover change, population shift, and their effects on spatio temporal patterns of urban heat islands in metropolitan Shanghai, China. Appl. Geograph. 44, 121–133. doi: 10.1016/j.apgeog.2013.07.021
Zhou, H., Gao, Y., Ge, W., and Li, T. (2008). The research on the relationship between the urban expansion and the change of the urban heat island distribution in Shanghai area. Ecol. Environ. 17, 163–168.
Keywords: urban expansion, urbanization, warming center, urban heat island, spatial variation
Citation: Shen Z, Shi J, Tan J and Yang H (2020) The Migration of the Warming Center and Urban Heat Island Effect in Shanghai During Urbanization. Front. Earth Sci. 8:340. doi: 10.3389/feart.2020.00340
Received: 19 April 2020; Accepted: 21 July 2020;
Published: 06 August 2020.
Edited by:
Bin Yu, Government of Canada, CanadaReviewed by:
Xuchao Yang, Zhejiang University, ChinaAlexander Ginzburg, A.M. Obukhov Institute of Atmospheric Physics (RAS), Russia
Copyright © 2020 Shen, Shi, Tan and Yang. This is an open-access article distributed under the terms of the Creative Commons Attribution License (CC BY). The use, distribution or reproduction in other forums is permitted, provided the original author(s) and the copyright owner(s) are credited and that the original publication in this journal is cited, in accordance with accepted academic practice. No use, distribution or reproduction is permitted which does not comply with these terms.
*Correspondence: Zhongping Shen, c2hlbnpob25ncGluZzEyNkAxMjYuY29t; Jun Shi, c2hpakBzb3dlYXRoZXIuY29t