 Vanucia Schumacher
 Alfonso Fernández
 Flavio Justino
 Alcimoni Comin1
95% of researchers rate our articles as excellent or good
Learn more about the work of our research integrity team to safeguard the quality of each article we publish.
Find out more
ORIGINAL RESEARCH article
Front. Earth Sci. , 02 October 2020
Sec. Hydrosphere
Volume 8 - 2020 | https://doi.org/10.3389/feart.2020.00328
This article is part of the Research Topic Connecting Mountain Hydroclimate Through the American Cordilleras View all 19 articles
This study evaluates the skill of the Weather Research and Forecasting (WRF) model to reproduce the variability of precipitation over the Central Andes of Chile and Argentina, a region characterized by complex topography. The simulation corresponds to a dynamical downscaling of ERA-Interim, in the period between 1996 and 2015, performed with two nested grids, at 9 and 3 km horizontal resolution. Precipitation data from 62 rain gauges from Chile and Argentina were used to evaluate the performance of WRF simulations carried out at the annual and warm-cold season analysis. The results of this study indicate that WRF at 9 and 3 km is able to reproduce the main characteristics of seasonal and interannual precipitation variability along the study area. On the windwards slopes of the Andes, however, WRF at 9 km presents a wet bias in relation to observation and WRF at 3 km. Additionally, WRF at 3 km achieves better performance of precipitation as elevation increases, most likely due to the better-resolved topography. To our knowledge, this is the first study that compares performance between nested domains on mountain areas that found a better match between the model and observations, as elevations increased.
Atmospheric conditions in the Central Andes of Chile and Argentina are particularly distinct as a result of the interplay of complex topography and large-scale synoptic systems (Garreaud, 2009). While on the west slope there is a marked seasonality of dry-warm summers and wet-cold orographically intensified winters (Falvey and Garreaud, 2007; Viale and Nuñez, 2011), the eastern side is wetter during summers due to the development of the South America Low Level Jet (SALLJ) which originates in the Brazilian Plateau (Garreaud et al., 2009). This makes this section of the Andes a crucial water reservoir for socio-economic activities in this region (Mark et al., 2015) that need to be monitored to support better adaptation for future challenges associated with global climate warming. However, precise values of precipitation are scarce, as the natural barrier of the Andes makes it difficult to install, maintain, and expand a network of meteorological stations, resulting in the lack of reliable measurements of long-term historical observations.
In recent years, several gridded datasets such as a reanalysis have been used for climate assessment on regional and global scales. However, in most cases these datasets have coarse horizontal resolutions, leading to misinterpretation of dynamical processes of regional and local climate variability—limitations that are higher in complex terrains such as the mountainous region of the Andes (e.g., Ward et al., 2011; Soares et al., 2012).
Regional climate modeling can help overcome the dearth of records and the problem with coarse spatial resolution in the Andes, as dynamical downscaling can support a better understanding of the spatio-temporal patterns that the discrete nature of sparse meteorological networks do not provide. Downscaling approaches are widely used to provide climatic information at fine spatial resolutions. Regional climate models (RCMs) have been applied for dynamical downscaling with an initial and lateral boundary taken from global to regional/local scales. This strategy has frequently been used in mountainous regions in an attempt to reduce scale mismatches—a relevant problem between model output describing large-scale climate and the scale required to characterize regions of complex topography (Mög and Kaser, 2011; Hughes et al., 2017; Ambrizzi et al., 2019).
Increasing availability of regional climate from initiatives such as the COordinated Regional Climate Downscaling EXperiment (CORDEX) have demonstrated the potential of RCMs to support description of synoptic patterns and dynamical processes of climate in the complex Andean terrain, while also providing more detailed projection scenarios (Ambrizzi et al., 2019). Nevertheless, these simulations are still too coarse, about 50 km for South America (Solman and Blázquez, 2019), relative to the intricate Andean climate. To date, higher resolution downscaling in the Andes has been mostly restricted to short periods (e.g., Mourre et al., 2016), with very few recent studies carrying out long-term simulations (Bozkurt et al., 2019).
The aim of this study is to assess the skill of a simulation performed with the Weather Research and Forecasting Model (WRF) at high resolution (9 and 3 km), relative to observations of precipitation along the complex terrain in the Central Andes of Chile and Argentina, over a 20-year period. The WRF model is widely used by the scientific community to dynamically downscale coarse global climate model output. The model has reasonably simulated precipitation patterns and variability in several complex topography regions (Cardoso et al., 2013; Fathalli et al., 2016; Comin et al., 2018). Posada-Marín et al. (2019) demonstrated that the WRF downscaling outperforms ERA-Interim reanalysis in the representation of precipitation, due to a better representation of orographic effects, over the tropical Cauca river valley in Colombia. However, little information is available on the performance of the downscaling method in the Andean mountain region. This paper is organized as follows: section 2 presents the study area, data and methods, Section 3 the results and the discussion of the main findings, and the conclusion are presented in section 4.
The high-Andes of central Chile and Argentina (Figure 1), have a high concentration of glaciers and glacial lakes, which are the main source of water for important rivers that provide fresh water to more than 10 million people in Chile and more than 2 million in Argentina (Malmros et al., 2018). The Andean topography leads to significant differences in precipitation distribution between its eastern and western slopes, for example, in the transition between the tropics and extratropics, annual precipitation and cloud frequency are more pronounced on the western slopes and reduced on the eastern slopes of the Andes (Viale et al., 2019).
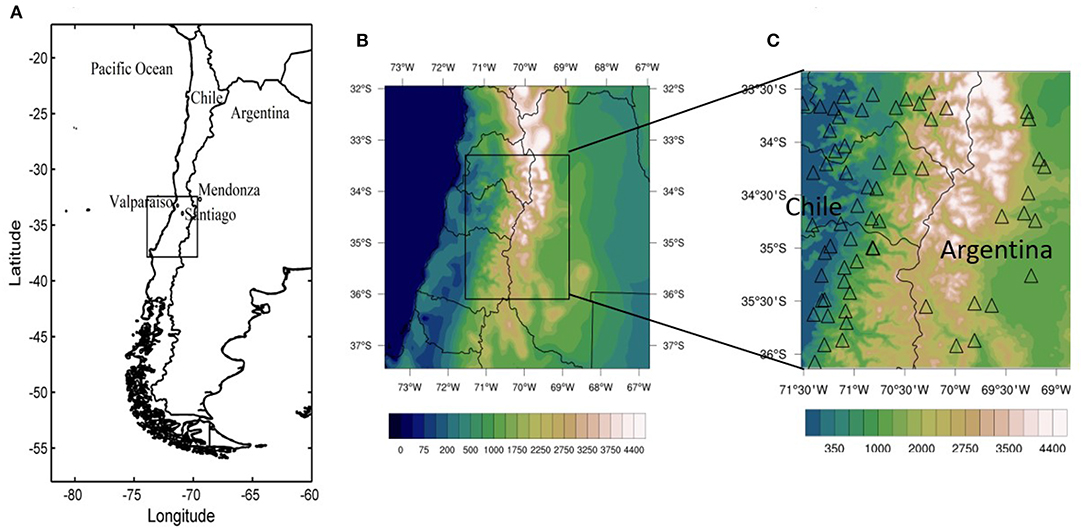
Figure 1. (A) Location of the 9 km WRF model domain within Chile (B) WRF at 9 km (full map) and 3 km (black rectangle), and (C) geographic positions of the weather stations located within the 3 km domain, with the main topographic features.
In the semi-arid Central Andes of Chile, the climate is characterized by wet and cold winters (April-September), with snow accumulation at high elevations. This contrasts with warm and dry summers (October-March) with almost zero precipitation and low relative humidity. This region is also commonly referred to as having a Mediterranean-type climate (32°S–38°S) (Falvey and Garreaud, 2007; Bown et al., 2008; Bravo et al., 2017). These climate features are mainly associated with the northward-southward displacement of high-pressure in the Pacific Ocean, which generally inhibits precipitation during the warm season, but allows the passage of westerlies and the occurrence of frontal precipitation during the cold season (Masiokas et al., 2009). In contrast, the eastern slopes of the Andes (Argentinean side) is wetter during summer, enhanced by warm and humid air transported by a low-level jet (e.g., Garreaud et al., 2009; Espinoza et al., 2015). From a longitudinal profile along the 33°S, the annual average precipitation ranges from 459 mm in Valparaiso (33.02°S, 71.63°W, 41 m) to 356 mm in Santiago (33.45°S, 70.70°W, 520 m) on the Chilean side, and 180 mm in Mendoza (32.89°S, 68.83°W, 769 m) on the Argentinean side (Corripio and Purves, 2005), clearly indicating the effect of topography.
The model used in this study is the WRF model with its Advanced Research WRF dynamical solver (Skamarock et al., 2008) version 3.5.1. The WRF model was setup with two nested grids (Figure 1B), with high regional resolution at 9 km (WRF9km) and 3 km (WRF3km) horizontal grid spacing, using a two-way nesting technique and Mercator projection. Two-way nesting ensures dynamical interaction domains. Both grids are centered in the Central Andes of Chile and Argentina, with the 9-km domain extending 70 x 70 grid points, and 82 x 106 for the higher-resolution 3-km inner nest. Both domains have 28 vertical levels from the surface to 50 hPa. To maximize the development of internal dynamics within the domains, the selection of domain sizes and the number of grid points was dictated by a trade-off between computational constrains and the resolution of the boundary conditions (see next paragraph). The WRF9km domain covers a region of 630 x 630 km, assimilating several points from the initial and boundary conditions, while the size of the WRF3km is 246 x 318 km.
The WRF model run, simulated 20 years, from 1996 to 2015, using initial and lateral boundary conditions taken from the European Center for Medium-Range Weather Forecasts (ECMWF), ERA-Interim reanalysis (ERA-I) (Dee et al., 2011). Lateral forcing was updated every 6 h at 0.75° horizontal resolution and 17 pressure levels. The physical parameterizations used include the WRF Single Moment 6-class (WSM6, Hong et al., 2010). This scheme performed better when compared to the other schemes in the high complex topography of the Andes (Comin et al., 2018). The radiation schemes of Rapid Radiative Transfer Model (RRTM, Mlawer et al., 1997) for longwave and the Dudhia scheme (Dudhia, 1989) for shortwave was used. The MM5 similarity surface layer scheme (Paulson, 1970) and the thermal diffusion scheme was used for land surface. This land surface scheme is a Land Surface Model based on the MM5 5-layer soil temperature model with an energy budget that includes radiation, sensible, and latent heat flux (Huang et al., 2014). The Yonsei University parameterization of the planetary Boundary Layer (Hong et al., 2010). The Kain-Fritsch scheme to atmospheric convection (Kain, 2004) are applied for the outer domain but turned off for the inner domain in order to explicitly resolve precipitation processes.
Daily precipitation data in Central Chile and Argentina were used. The observations were provided by the Direccin General de Aguas (DGA) of Chile (http://snia.dga.cl/) and the Water Resources Agency of Argentina (Subsecretara de Recursos Hdricos (SSRH); http://bdhi.hidricosargentina.gob.ar/). We selected all records within the study domain with at least 90% of non-missing data available. Observations were checked for consistency and continuity, retaining 48 stations for Chile and 14 for Argentina for the period between 1996 to 2015 (Table 1). Figure 1C presents the distribution of precipitation stations.
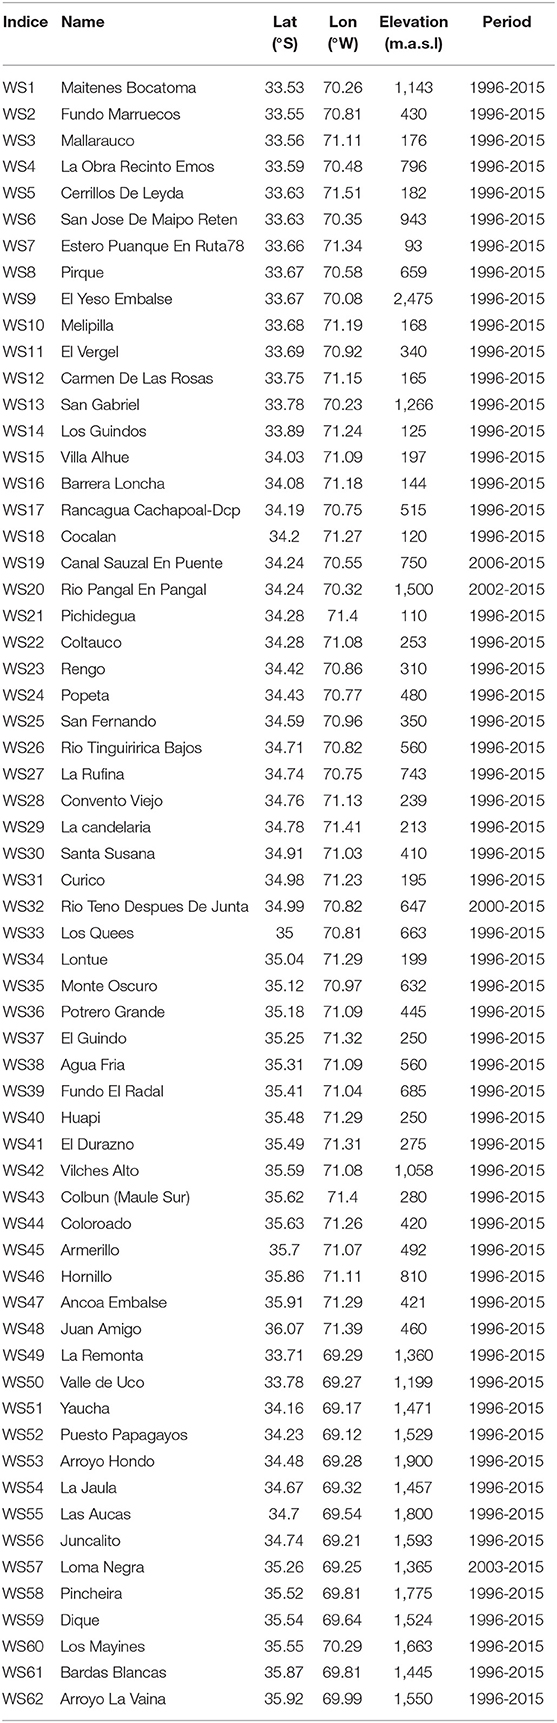
Table 1. Geographical characteristics of the selected weather stations for (WS1-WS47) Chile and (WS48-WS61) Argentina.
In order to quantify WRF's ability to represent annual and seasonal precipitation, under distinct spatial resolutions, statistical metrics were computed, namely the percent bias (PB), the mean absolute error (MAE), the Pearson correlation coefficient (PC) and the Willmott index of Agreement (d). Positive values of PB indicate an overestimation of modeled precipitation in respect to observed values, whereas negative values indicate underestimation. The MAE provides information on the average magnitude of simulation errors, considering both systematic and random errors, where 0 is the perfect match. The PC corresponds to the linear relationship between the model output and observations, where 1 is most desirable. Willmott's index is a standardized measure of the degree of model temporal-prediction error and varies between 0 and 1, where value of 1 indicates a perfect match, and 0 no agreement. A more detailed description of these methods can be found in Wilks (2011). Analyses and comparisons are performed using the nearest grid point of the model to observations. Model daily precipitation is computed from 12 to 12 UTC. In this study, the analysis is developed for the annual period as well as for the warm (October-March) and cold (April-September) seasons.
The observed annual precipitation pattern is marked by a significant latitudinal gradient with high precipitation values (more than 2000 mm/year) concentrated southward of 35°S in the Chilean side. On the other hand, observations in Argentina ranges from 500 to less than 200 mm/year, with maximum values north of 34°S and southernmost of 35°S (Figure 2A). This difference in precipitation magnitude is characteristic of the rain shadow effect in this section of the Andes, determining a west-east contrast between the Chilean and Argentinian sides.
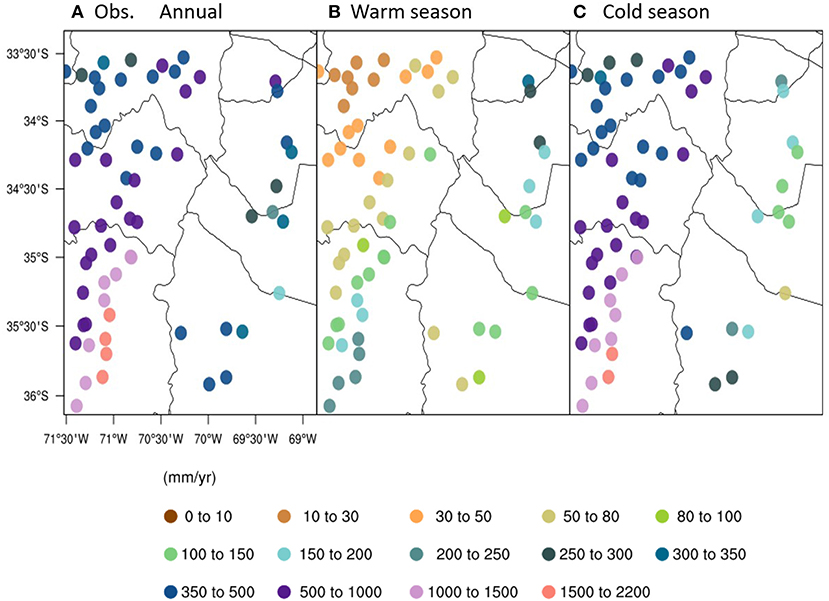
Figure 2. (A–C) Spatial distribution of annual and warm-cold season accumulated precipitation from observations, between 1996 and 2015. The vertical black line represents the border between Chile and Argentina.
The seasonal variability is also dictated by the contrast between the two sides of the Andean mountain range (Figure 2). In the warm season, whereas the amount of precipitation decreases northward of 35°S in Chile, a gradual increase characterizes the Argentinian sector. The occurrence of precipitation is associated with convective activity on both slopes. However, the incursion of warm and moist air from the Amazon basin by the SALLJ favors higher precipitation in the eastern slopes of the Central Andes (Marengo et al., 2004; Castañeda and Ulke, 2015). On the other hand, the incursion of the winter frontal systems leads to a significant increase in precipitation on the Chilean side. In Argentina, higher precipitation is observed to the north of 35°S during the cold season, compared to the mild precipitation values north of this point.
Figure 3 shows topography and precipitation features based on the WRF simulations and ERA-I. The spatial pattern of annual and seasonal precipitation is well-captured by WRF3km as well as the WRF9km. Both simulations are able to capture the latitudinal gradient of precipitation, and the seasonal contrast between warm-cold seasons. Overall, WRF3km and WRF9km present similar patterns, although it is notable that in some regions or particular points, precipitation is overestimated at 9 km with respect to observations and WRF3km, likely due to the model topography in the WRF9km. Modeling studies in steep terrain have shown that by smoothing topographic features results an increase of precipitation in lower resolutions (e.g., Soares et al., 2012). This is clearly noticeable in the spatial pattern shown by ERA-I, precipitation features of which are oversmoothed due to the complete absence of the orographic effect (see Figures 3A–C). However, this reinforces the relevant added value of downscaling with increasing resolution.
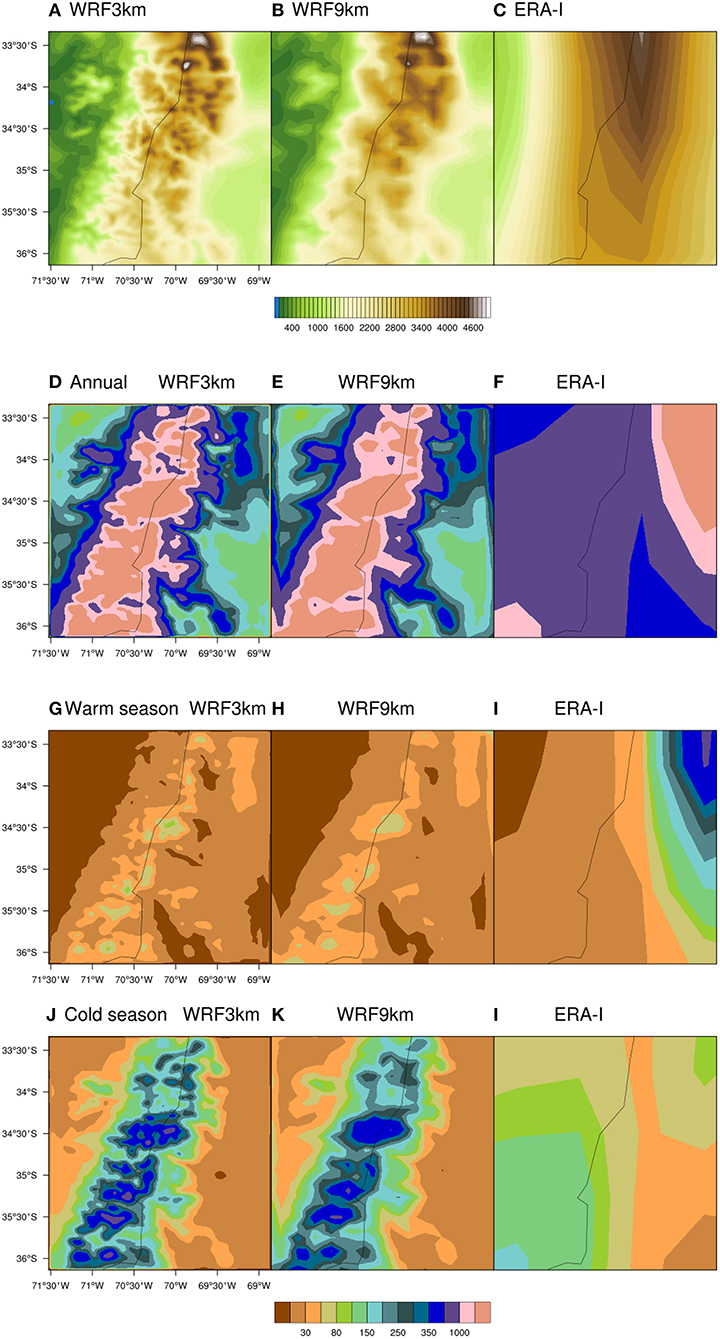
Figure 3. (A–C) Models topographies and spatial distribution of annual and warm-cold season accumulated precipitation (mm), from (D–F) WRF3km, (G–I) WRF9km, and (J–L) ERA-I. The black line represents the border between Chile and Argentina.
To further illustrate differences in the representation of the annual and seasonal precipitation between the WRF, ERA-I and observations, Figures 4–8 shows the metrics used to quantify the reliability of the WRF simulations. For Chile (Figure 4A) the values of PB show that WRF3km tends to underestimate precipitation in relation to observations by up to 50% at annual scale as well as in warm-cold seasons, mostly on the west of windward stations in Chilean side (west of 71°W) (Figure 5). By spatial PB analysis, a wet bias is clearly seen in the nearest locations to windward mountain range, with large bias values to the north of 35°S depicted by both WRF simulations. This wet bias is extended in almost all locations to windward of the Andes by the WRF9km, and also for some stations on the Argentine side, while the WRF9km have larger variability, the majority of stations show negative bias, however, about 33% of stations show positive bias at annual and seasonal scales.
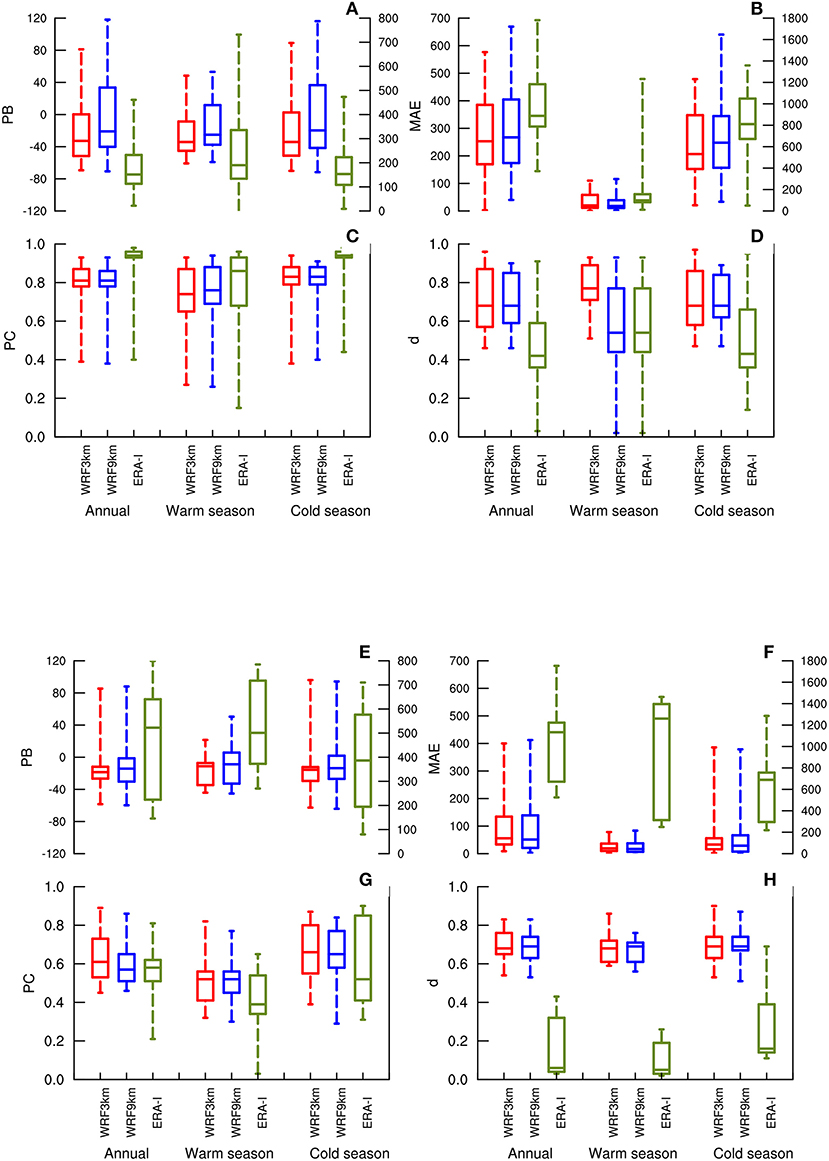
Figure 4. Boxplot of the (A) bias and (B) mean absolute error, (C) coefficient correlation and (D) Willmott Index of Agreement (d) between observations and WRF3km (red), WRF9km (blue) and ERA-I (green) estimations for annual and warm-cold season precipitation. (A–D) relative to Chile and (E–H) for Argentina. Each boxplot shows the first, median, and third quartiles, while the whiskers indicate variability outside the lower and upper quartiles. Y-axis (right axis)is referent to ERA-I values, only for (A,B,E,F).
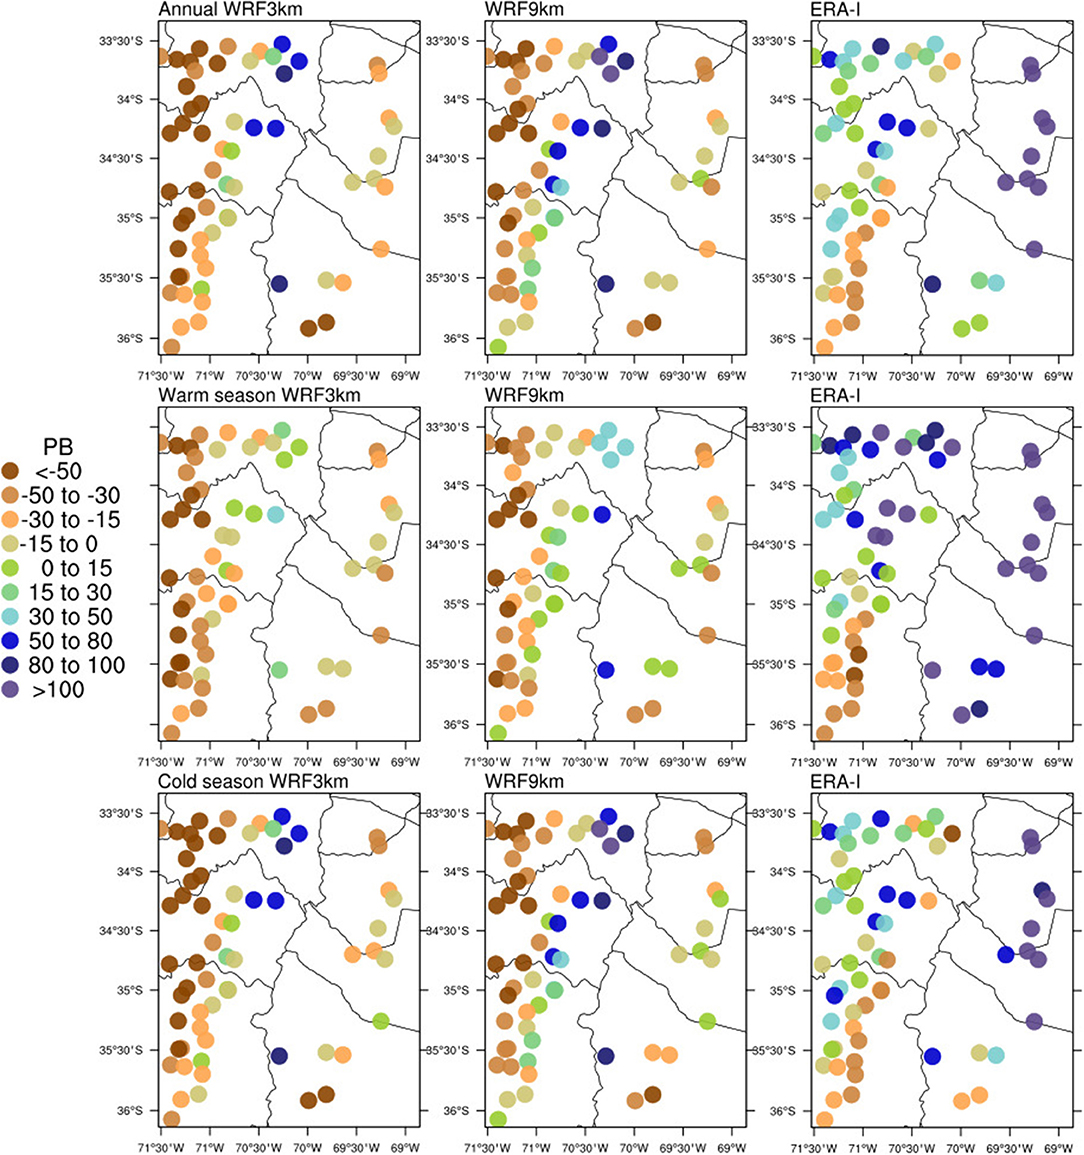
Figure 5. Spatial distribution of percent bias for annual and warm-cold season precipitation.
ERA-I overestimates precipitation at all scales as expected due to its low spatial resolution and smooth topography. Both WRF3km and WRF9km have smaller PB variability during the warm season, most likely associated with lower distribution of precipitation during this period as shown in Figure 3. On the other hand, in Argentina (Figure 4E) the PB distribution shows good performance of both WRF simulations, especially in WRF3km. On the contrary, ERA-I overestimates precipitation in Argentina more than in Chile at annual and seasonal scales (see Figures 4, 5).
Large values of bias (negative or positive) are accompanied by limited performance of the WRF simulations as revealed by the MAE (Figures 4B,F, 6). Higher errors are observed at the annual and cold season periods, while errors are smaller during the warm season and on the Argentina side, associated with lower rainfall variability. Based on PC distribution (Figures 4C,G) higher correlation at the annual duration and cold season in both WRF simulations, above 0.7, contrast with the low correlations computed for Argentina during the warm season, especially to the north of 35°S (Figure 7). Conversely, the spatial distribution of d is well-simulated for the warm season in both Chile and Argentina (Figures 4D,H), especially for WRF3km. Poor performance is shown in almost all locations in western Chile (west of 71°W), especially insofar as annual and cold season are concerned (Figure 8). ERA-I shows a high range for PC although low performance is delivered by d in Chile, while on the Argentine side, low performance is noticed by both PC and d values.
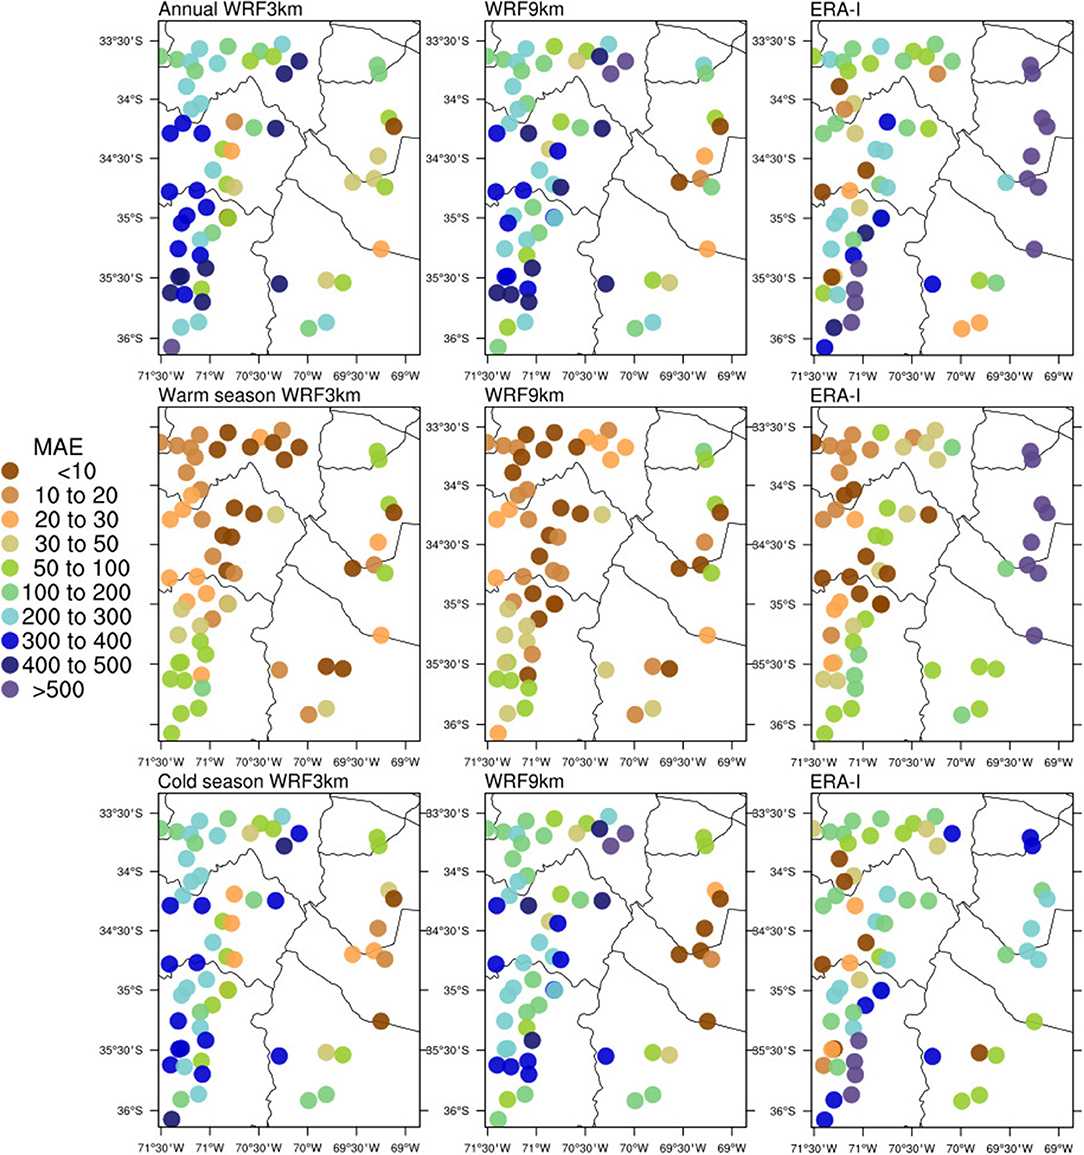
Figure 6. Spatial distribution of mean absolute error for annual and warm-cold season precipitation.
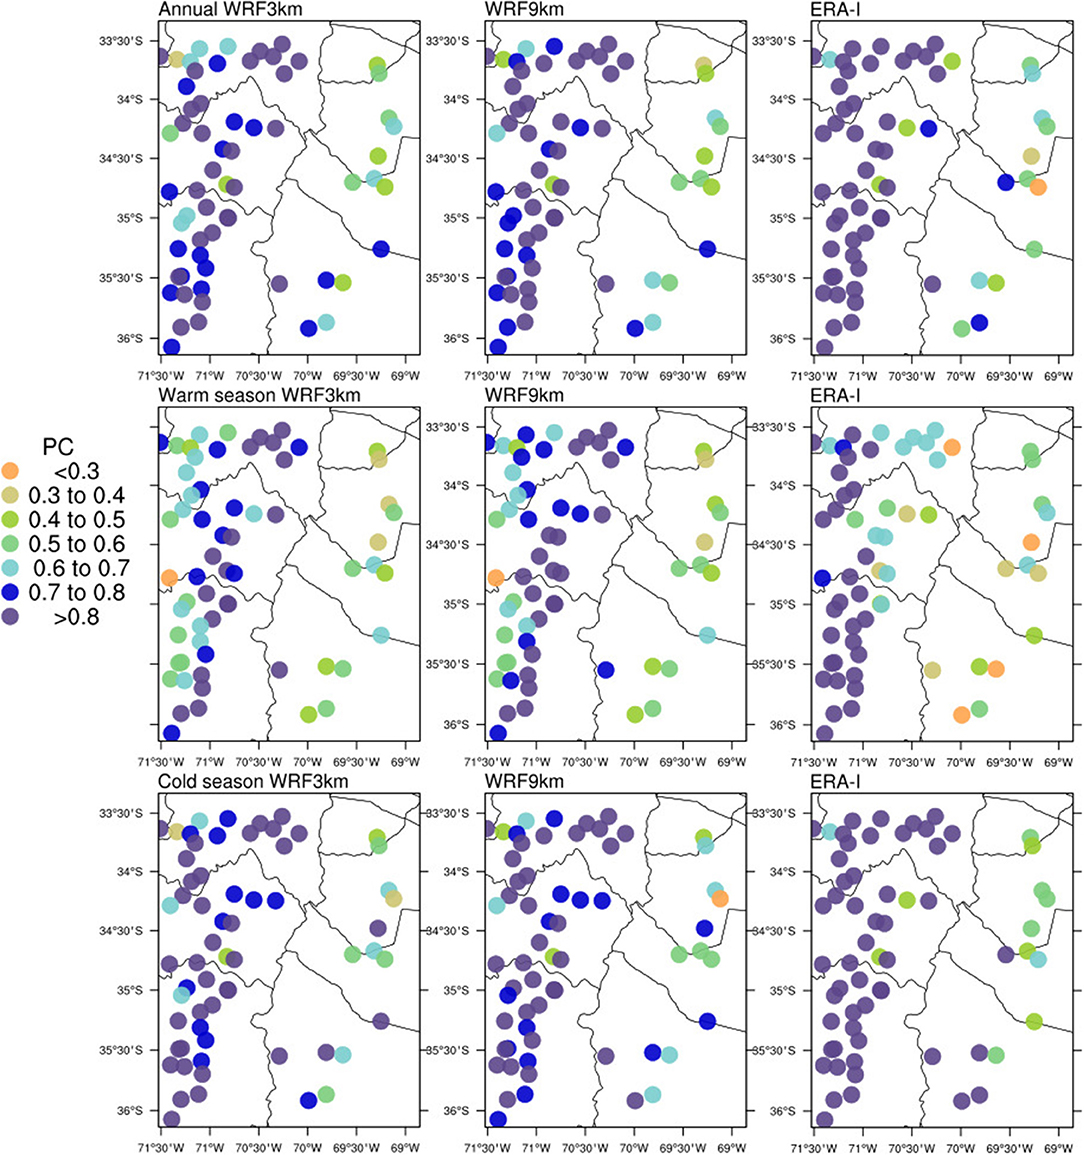
Figure 7. Spatial distribution of coefficient correlation for annual and warm-cold season precipitation.
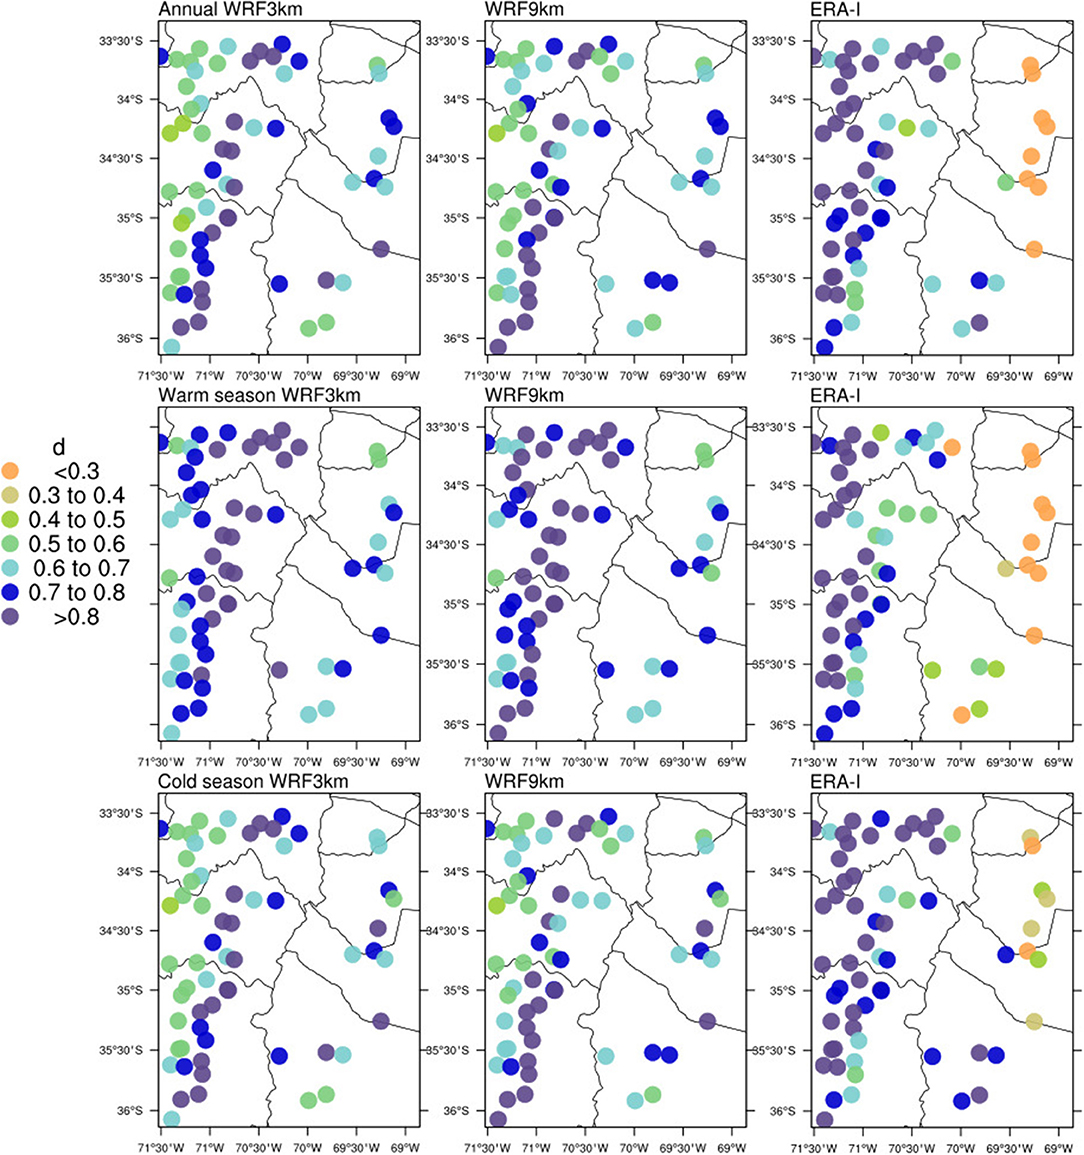
Figure 8. Spatial distribution of Willmott Index of Agreement (d) for annual and warm-cold season precipitation.
In general, both WRF simulations have similar performances and the differences between them are not discrepant. The skill of the WRF3km, and both simulations compared to the ERA-I denotes that the high-resolution terrain features improve precipitation estimates, being able to cancel a positive bias exhibited in the ERA-I as input in downscaling.
The annual cycle of precipitation from observational and the WRF simulations in Chile and Argentina are depicted in Figure 9. On the Chilean side, the seasonal characteristics of precipitation are clearly well-simulated. During the warm months low precipitation dominates, while the maximum values occur during the cold months, especially between May to August. Monthly variability ranges from 300 to 600 mm/month. On the Argentinian side the seasonal variability is not as marked as in Chile. Maximum values of accumulated precipitation occur especially in June, July, and August. Similar behavior is shown by Rivera et al. (2018) for the central region of Argentina from the La Jaula station (34.67°S, 69.32°W). These features in Argentina may likely be related to small scale atmospheric systems that exhibit a sub-seasonal dominant spectrum.
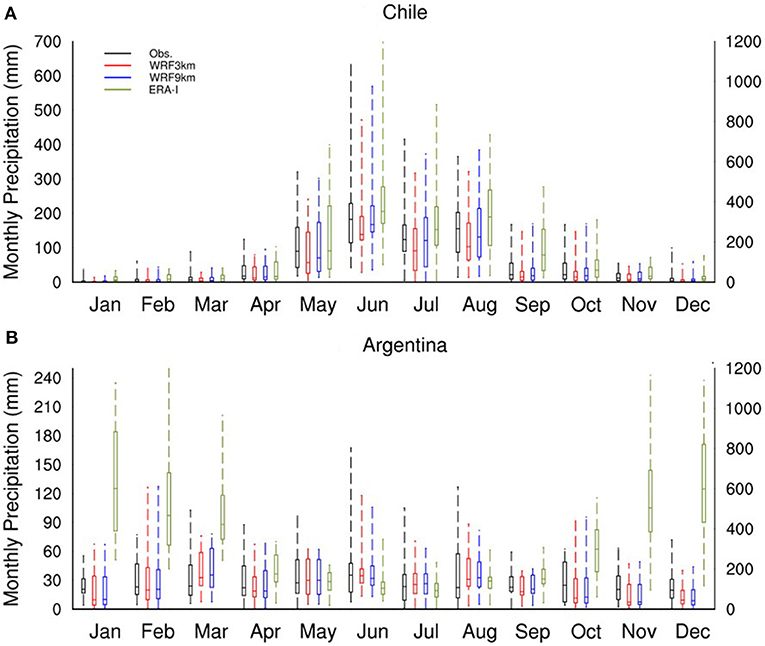
Figure 9. Boxplot of the total monthly precipitation from ensemble of the weather stations in the Chile and Argentina. (A,B) Y-axis (right axis) is referent to ERA-I.
Chilean seasonality of precipitation is properly reproduced in the WRF3km as well as in the WRF9km, although variability of precipitation (interquartile range) during the cold months are slightly overestimated in WRF9km, whereas WRF3km underestimates it in relation to observations, especially during May, July, and August. This is probably associated with the smoothing of topographic features; as noted, WRF9km tends to overestimate precipitation compared to WRF3km, showing a slightly positive bias (see Figure 4). The lower spatial resolution in WRF9km induces the smoothing of the Andes effect, as a consequence this should enhance the weather systems, such as the upper-level trough and incursion of frontal systems increasing the amount of precipitation during the cold season as compared to WRF3km (Barrett et al., 2009). However, the median and maximum values are underestimated in both WRF simulations in almost all months. And this again is due to the fact that both simulations do not reproduce the complex terrain of the Andes in a realistic way because the resolution is not high enough for higher precipitation rates relative to observation (e.g., Cardoso et al., 2013).
Variability of monthly precipitation totals in Argentina is also well-represented by the WRF simulations, with slight underestimation of median values during the warm months in relation to observations. The maximum values of precipitation are generally underestimated by WRF simulations, except for February and October, when they are overestimated. This larger variability of precipitation during transition months may be associated with enhanced convective precipitation favored by the intensification of the low-level jet during the warm season (Marengo et al., 2004), while the smaller variability during cold months can be due to representation of orographic uplift by the WRF simulations, showing a smaller amplitude of precipitation variability on the eastern side of the Andes. It is evident that the topography plays an important role in precipitation distribution leading to better or poorer performance from the WRF simulations according to the representation of the dominant precipitation systems, which are strongly modulated by the height and steepness of the Andes (e.g., Heikkilä et al., 2011; Bozkurt et al., 2019). On the other hand, ERA-I exceeds nearly twice the amount of monthly precipitation compared to WRF simulations on both sides of the Andes. In order to illustrate the performance of the WRF model in representing precipitation extremes, daily precipitation percentile ranges (10th, 25th, 50th, 75th, 90th, 95th, and 99th) were calculated for each station's location and compared statistically with the simulations (Table 2). In general, both WRF simulations show a good agreement in reproducing precipitation extremes according to the percentiles, with PC values above 0.8. It is interesting to note that there is no variation in the statistical performance (PB, PC, and d) from the 10th to 75th percentiles, however, MAE values increase in most cases according to the percentile range.
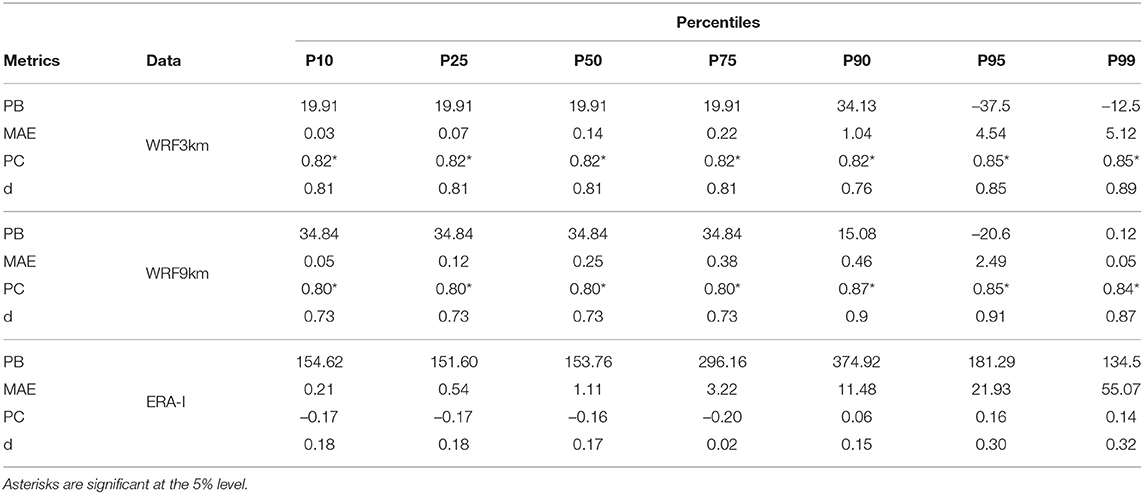
Table 2. Performance of the WRF3km, WRF9km, and ERA-I in relation to percentiles range, 10th, 25th, 50th, 75th, 90th, 95th, and 99th.
Concerning moderating precipitation, (percentiles below the 75th), improvement is noticed in WRF3km relative to WRF9km, especially for lower PB values, from 19.91 to 34.84% respectively. On the other hand, precipitation extremes between the 90th and 99th percentiles show better performance in WRF9km. This improvement is clearly seen from PB and MAE values. Likewise, a reasonable match of the WRF9km relative to observations is shown in relation to the 99th percentile, with 0.12% for PB and 0.05 for MAE. However, the 95th percentile shows a slightly larger disagreement compared to the 90th and 99th percentiles in both WRF simulations. Poor performance is noticeable by ERA-I.
In an attempt to elucidate differences between WRF3km, WRF9km, and ERA-I, Figure 10 shows climatological values of wind speed (m/s) and relative humidity (%) for the surface and different levels of pressure. These results clearly show orographic dependence, for example, the coarse resolution of the ERA-I leads to the complete absence of the Andes, and consequently smooth gradients of these variables, which are important drives for the precipitation field.
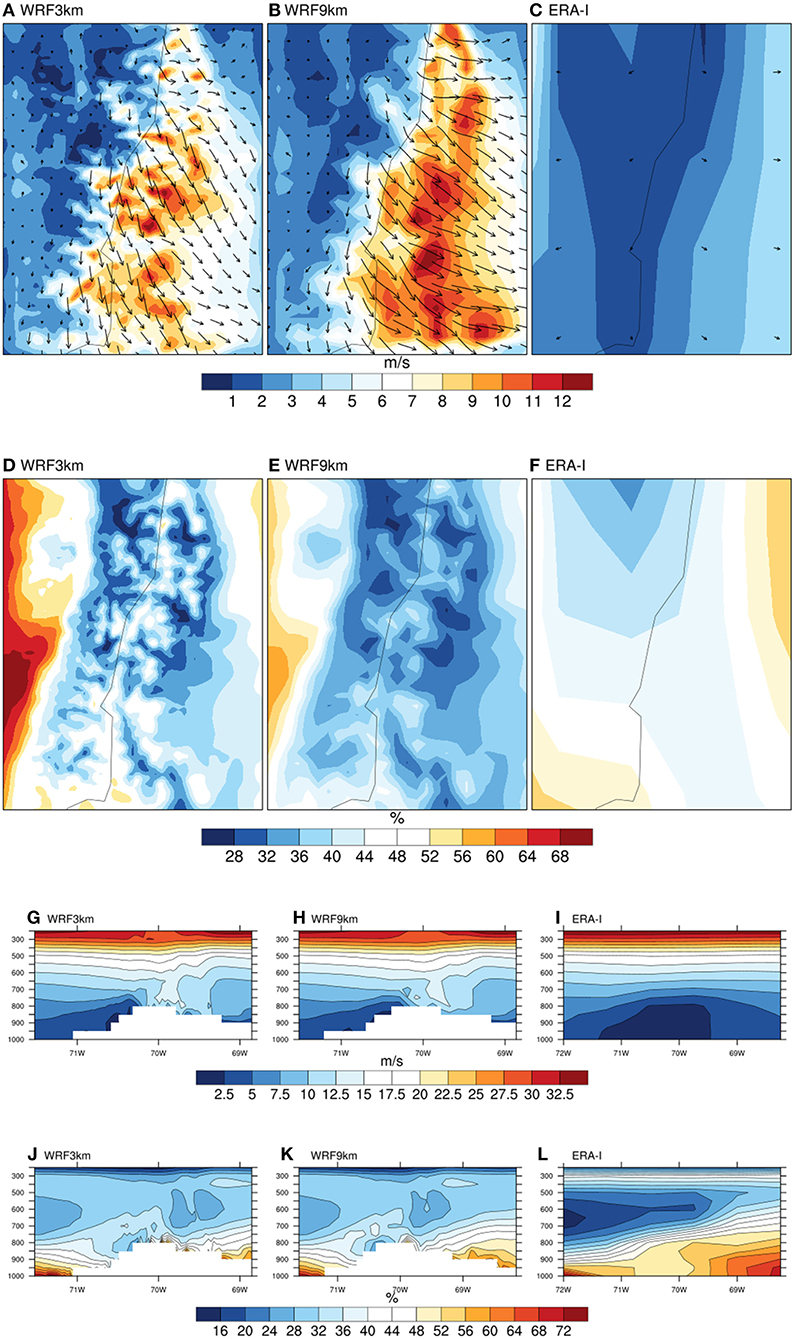
Figure 10. (A–F) Spatial distribution at surface and (G–L) vertical distribution of wind speed (m/s) and relative humidity (%) between 1,000 and 200 hPa.
The poor representation of the Andes by ERA-I induces a large amount of humidity toward the leeward, this implicates overestimated values of precipitation on the Argentine side, as shown by Figure 9. The WRF9km also presents a steeper gradient of wind speed on the leeward of the Andes in comparison to the WRF3km, this is due to topography smoothing and consequently influences moisture transport and precipitation on the Argentine side.
A fundamental aspect to validate regional climate models' output is to verify and understand their performance in a complex terrain. In order to add details to the performance of the WRF simulations relative to elevation, the weather stations were classified into four groups according to altitude: between 0–300 m (19 stations), 300–600 m (14 stations), 600–1,300 m (14 stations), and above 1,300 m (15 stations). The performance of the WRF at 3 and 9 km against observations is shown in Table 3. Based on the PB and MAE values, the best performance is detected in WRF3km. The reduction of errors is systematic according to the increase in altitude at daily and monthly scales. For example, between 0 and 300 m the PB (MAE) values go from –56.27% (26.21) to –1.42% (0.49) following the increase elevation. These results are in line with PC and d values, although higher values are observed between 600 and 1,300 m, and reduced values are noted above 1,300 m.
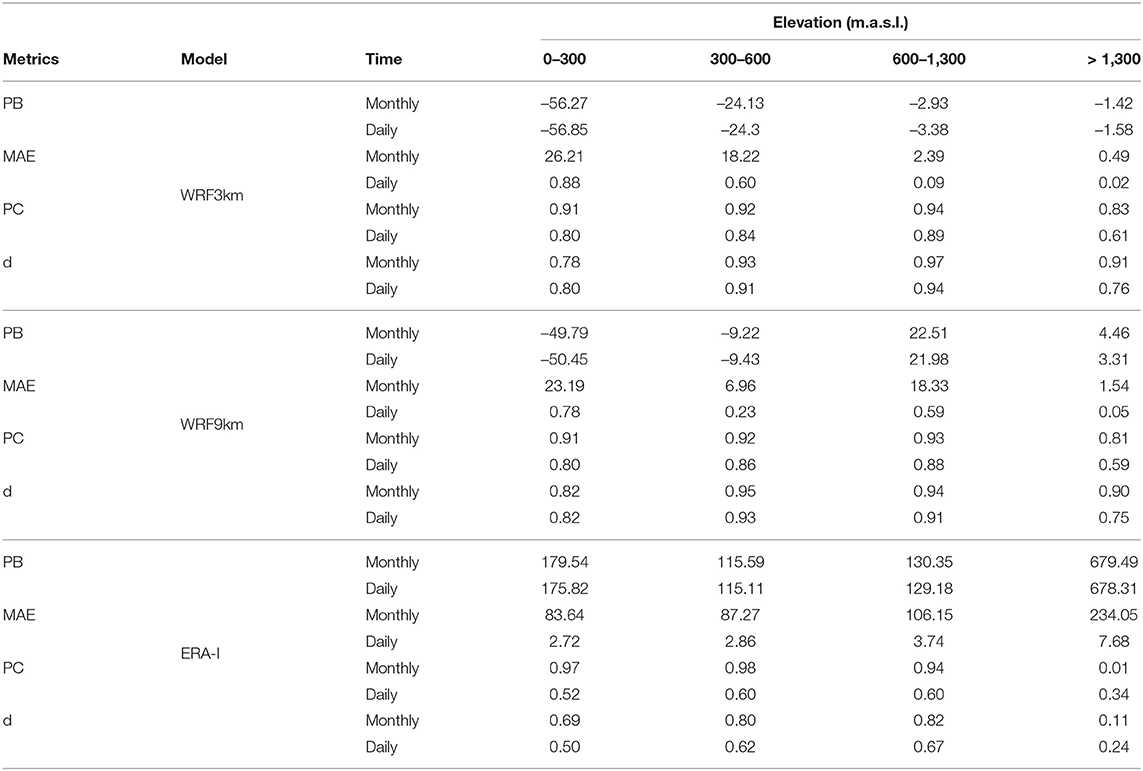
Table 3. Performance of the WRF3km, WRF9km, and ERA-I in different elevation levels.
It is interesting to note that WRF3km shows a persistent negative bias across all altitude ranges. On the other hand, WRF9km shows a dry bias at stations located between 0 and 600 m, whereas a wet bias is shown above 600 m. This may be understood as a limited performance of the WRF model at 9 km between 600 and 1,300 m that is reproduced by the increase of PB and MAE values. It has to be noted that better performance is achieved at stations above 1,300 m, although larger errors are found compared to WRF3km. The ratio of the MAE values between the WRF9km and WRF3km above 1,300 m shows a difference of 250% on a daily scale and 314% at a monthly scale, accompanied by slightly lower values of PC and d in relation to high resolution at 3 km. However, it is important to highlight that despite the opposite sign of the bias above 600 m, in absolute values both simulations present the same trend of reduction of bias toward higher elevations. Moreover, ERA-I increases the error and PB with increasing elevation almost systematically. ERA-I also presents good performance for PC and d values up to 1,300 m altitude. Poor performance is noted above this threshold.
The apparent inverse relationship between bias and elevation on the WRF simulations and the weak performance of ERA-I can be further explored by comparing relative humidity at pressure levels that cover the elevation range between the surface and 3,000 m (see Figure 10). Between 1,000 and 700 hPa, ERA-I is generally more saturated than the WRF simulations on both slopes, and in fact the temporal trend shows that relative humidity in the WRF3km and WRF9km is consistently 66% of ERA-I from 900 to 700 hPa (about 900 to 3,000 m).
Overall, both WRF simulations properly reproduce several characteristics of precipitation along the Central Andes. Although there are some differences among the simulations and observations, good performance is obtained in reproducing the spatial variability of the annual and seasonal precipitation. The WRF simulations biases may result from a variety of sources, such as initial conditions, physical configuration of the model, and terrain complexity, among others. Furthermore, main differences between the two simulations cannot only be explained by statistical errors and it is extremely complex to measure.
Differences discussed previously between WRF simulations can be associated with the cumulus scheme. Chawla et al. (2018) has shown that the cumulus scheme modulates the magnitude of simulated precipitation. Sikder and Hossain (2016) also showed that the finer spatial resolution (3 km) without cumulus parameterization schemes did not result in significant improvements in monsoon precipitation. For instance, the presence of this scheme in the simulation at 9 km could be responsible for the improvement of precipitation extremes in comparison to WRF at 3 km (see Table 3). Argüeso et al. (2011) also demonstrate that physics configuration plays an important role in reproducing precipitation extremes in terms of percentiles, through the representation of convective and non-convective processes of precipitation and feedback between the cumulus and microphysic scheme. Conversely, Zheng et al. (2015) demonstrated that the explicit treatment of convection—no cumulus parameterization—at 3 km can adequately predict convective systems and precipitation, consistent with many results.
In order to illustrate the convective precipitation behavior by the WRF simulation, Figure 11 shows the analysis of convective and large-scale precipitation by the WRF9km. This allowed for demonstrating that convective precipitation is less important (magnitude) than large-scale precipitation. This result implies that, on the Argentine side, convection is almost absent, as demonstrated by simulation at 9 km, while large-scale precipitation is well distributed during the seasonal cycle. Although, on the eastern side of the Andes there are fewer gauges available, and thus can lead to larger uncertainty in convection location captured for the WRF9km (Figure 11B; see Yair et al., 2010), but the impact on the overall evaluation should be minimal. On the other hand, convective precipitation on the Chilean side presents the same behavior as large-scale precipitation, with maximums during winter, but with smaller magnitudes (differences up to 300 mm/month). However, the influence and connection between the parameterizations used may be a fundamental question but falls outside of the objectives of this study.
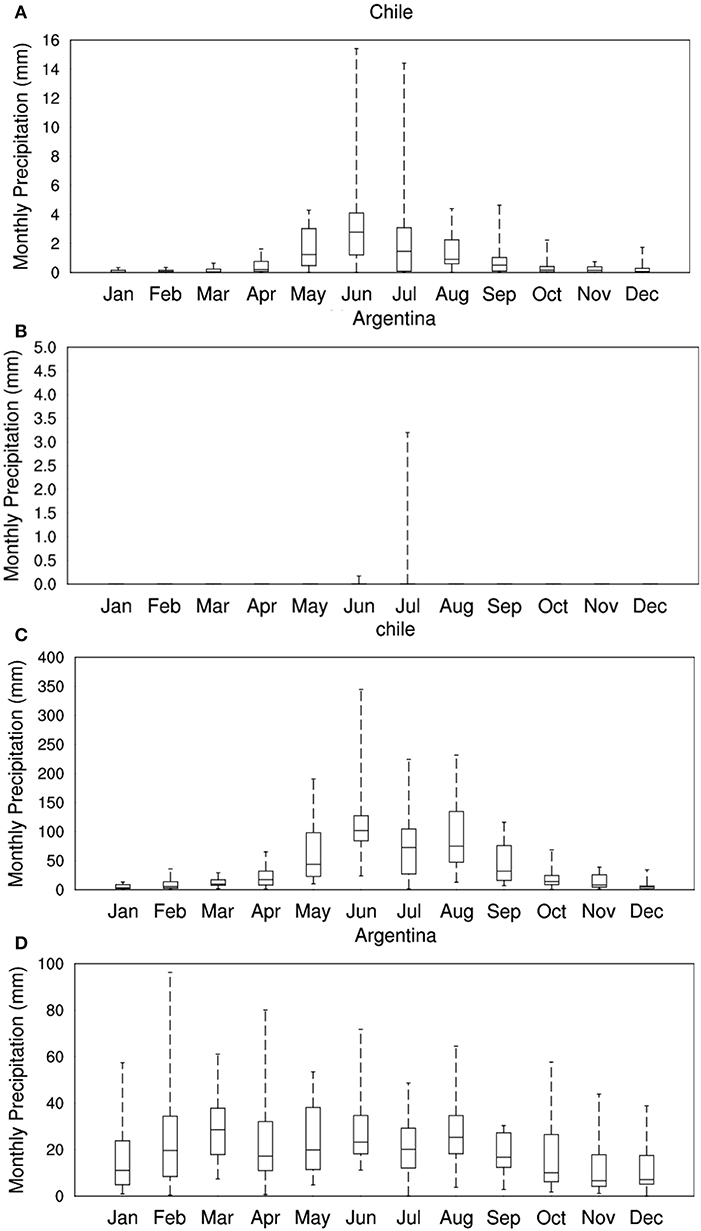
Figure 11. Boxplot of (A,B) convection and (C,D) large-scale precipitation from the WRF9km for (A,C) Chile and (C,D) Argentina.
Our results also show that high resolution leads to a better performance of precipitation field as elevation increases, most likely due to the better resolved orography. WRF simulation at 3 km has shown good accuracy for precipitation at high elevations, clearly associated with better reproduction of the topographic characteristics of the region compared to resolution at 9 km, which tends to smooth the terrain. This effect is even more noticeable in ERA-I, where the absence of orography greatly exceeds the amount of precipitation compared to observations and WRF simulations. In Figure 3 there is a noticeable difference in precipitation, with ERA-I exhibiting significant amounts on the NE quadrant. We assess that the lower ERA-I topography allows more water vapor to cross toward the leeward side. In Figure 10, relative humidity at 800 hPa, about 2,000 m, close to the summit of the ERA-I topography doubles the values from the WRF simulations, which probably determines more precipitation there.
Thus, an improvement in simulation skill seems to correlate with high resolution in the complex terrain of the Central Andes, as evidenced by more satisfactory statistical metrics. Differences between the simulations are pronounced along windward slopes of the mountain range, in which WRF9km presents a wet bias in relation to observation and WRF3km. In that regard, a salient result that seems intriguing is the relatively better performance of WRF9km at elevations below 600 m and the turn to positive bias at higher locations as revealed by the analysis presented in Table 3.
As stated above, studies show that smoother topography in coarse resolution modeling may enhance precipitation (Soares et al., 2012). However, there are very few places in the world featuring the relative extreme elevations of the Andes where this effect can be analyzed in detail and thus literature proposing an explanation for this effect is not abundant. A previous study that compared WRF convection-permitting simulations with and without cumulus parameterizations showed that precipitation was higher in the former case (Wootten et al., 2016). In the present study, WRF9km (with cumulus parameterization) tended to be more positively biased than WRF3km, relative to observations across all elevations. An argument against this explanation is that most convection, when it occurs, is more prevalent on the western side of the Andes (Figure 11).
Another option is that the difference in topographic representation between both domains resulted in orographic enhancement of precipitation in the coarser domain. Figure 12A shows elevation profiles for each domain calculated by averaging all grid boxes pertaining to the same longitude. A remarkable difference can be observed on the windward slope, where the western tip of the WRF3km is lower than WRF9km by about 300 m on average. This difference in elevation results in the WRF9km having a steeper gradient, as demonstrated in the slopes featured in the Figure 12B.
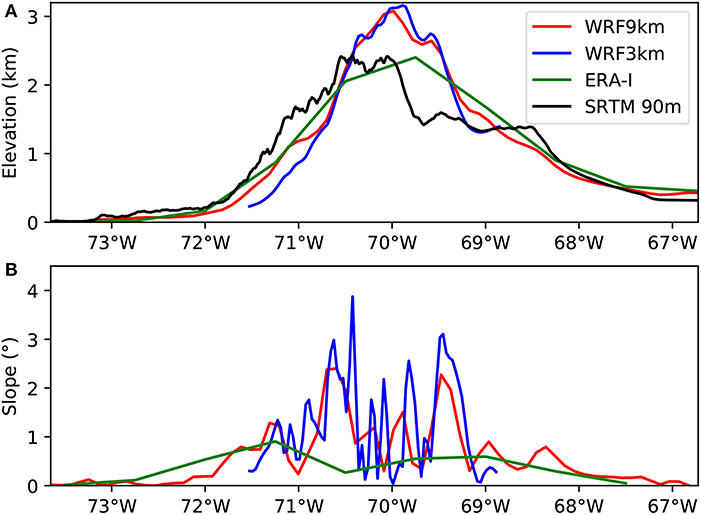
Figure 12. Elevation profiles from the WRF3km and WRF9km, (A) elevation (km) and (B) slope (°).
Theory, observations, and modeling suggest that precipitation enhancement by topography is dependent upon wind speed, slope, and elevation (Roe, 2005). Given that most of the precipitation on the west side of the Andes in this region comes from frontal systems during winter (Falvey and Garreaud, 2007), it is possible that the steeper slope in WRF9km, located just west of the boundary of WRF3km, produced a stronger orographic enhancement which may result in more rainfall in the coarser domain. This is reinforced by the fact that windward winds exhibit higher speeds in WRF9km while wind direction in WRF3km tends to be deflected toward the SSE relative to WRF9km (Figure 10), suggesting that the upslope accent in WRF9km is better developed. Considering that the differences in relative humidity are minimal, compared to the respective differences relative to ERA-I (Figure 10), allows for the inference that the effect of topography on winds makes precipitation more likely. A consequence of the higher precipitation in WRF9km may be a drier lateral forcing for WRF3km, leading to a systematic underestimation in the latter.
The present study contributes to an evaluation of high-resolution precipitation simulations over the Central Andes at 3 and 9 km spatial resolution. A state-of-the-art numerical weather prediction model— WRF—driven by the ERA-Interim reanalysis has been used to downscale precipitation over a 20-year long period (1996-2015). The WRF simulations were compared with observations from 62 Chilean and Argentinian weather stations at the annual and warm-cold season analysis.
To our knowledge, this is the first study comparing performance between nested domains on mountain areas that found an improvement in high elevations, despite the fact that availability of long-term instrumental data is sparse at elevations above 2,000 m (see Table 1). In a previous study that targeted precipitation using the WRF model and observations in the Nahuelbuta Mountains, part of the Chilean coastal range at 38°S with elevations above 1,300 m, Garreaud et al. (2016) found a uniform 50% bias from the surface to the top of the mountains on both slopes.
Our results show a good agreement between the WRF simulations and observations for seasonal and interannual variability. The WRF simulations, both at 3 and 9 km, outperforms ERA-I with improvement of topographic enhancement, leading to the best accuracy of precipitation amount both on the windward and leeward side of the Andes.
The ability of the WRF simulations to capture the seasonal accumulated precipitation is higher in the warm season than in the cold season, as revealed by the relatively lower PB and MAE values. In addition, WRF improvement varies according to precipitation extremes. WRF3km captures the moderate precipitation (lower-percentiles) more realistically than precipitation extremes. On the contrary, WRF9km represents better performance in relation to precipitation extremes, but represents larger errors in moderate precipitation events.
This study provides important results and implications for precipitation in complex terrains, indicating topographic influences. The higher resolution allows for a better representation of precipitation fields as elevation increases, which is more related with representation of regional processes such as wind and humidity intrinsic by the orographic dependence. Additionally, we have shown that both WRF simulations capture precipitation with good accuracy, therefore a resolution of 9 km may be a good option when elevation or complex terrain is not relevant, alleviating operational costs.
The analyses presented in the current study are subject to a few limitations that could be tested in the future and may vary the results: (a) the need to consider a greater number of weather stations to expand the study area and (b) evaluation of different physics parameterization schemes of the WRF model, in order to better understand the differences between the simulations and errors. Finally, this has produced a long term, high resolution dataset that can be a useful tool for understanding the climate in mountainous areas, as well as in extreme events. The results contribute to additional data in the region and can be used for hydrological studies.
Publicly available datasets were analyzed in this study. This data can be found here: http://snia.dga.cl, http://bdhi.hidricosargentina.gob.ar.
VS implemented and conducted numerical climatic simulations (using the WRF model), data analysis, and wrote the manuscript. AF cooperated in planning, data analysis, discussion of results, and writing of the manuscript. FJ cooperated in the planning and discussion of results. AC revised and discussed the results. All authors contributed to the article and approved the submitted version.
This study was supported by Fondecyt 1201429 and National Geographic CP-119R-17.
The authors declare that the research was conducted in the absence of any commercial or financial relationships that could be construed as a potential conflict of interest.
The authors want to thank the Coordination for the Improvement of Higher Education Personnel (CAPES), CNPq project number 306181/2016-9 and FAPEMIG grant PPM-00773-18, and the FONDECYT Projects 11160454 and 1171065 from the Chilean Government.
Ambrizzi, T., Reboita, M. S., da Rocha, R. P., and Llopart, M. (2019). The state of the art and fundamental aspects of regional climate modeling in South America. Ann. N. Y. Acad. Sci. 1436, 98–120. doi: 10.1111/nyas.13932
Argüeso, D., Hidalgo-Muñoz, J. M., Gámiz-Fortis, S. R., Esteban-Parra, M. J., Dudhia, J., and Castro-Díez, Y. (2011). Evaluation of WRF parameterizations for climate studies over southern Spain using a multistep regionalization. J. Clim. 24, 5633–5651. doi: 10.1175/JCLI-D-11-00073.1
Barrett, B. S., Garreaud, R. D., and Falvey, M. (2009). Effect of the Andes Cordillera on precipitation from a midlatitude cold front. Mon. Weather Rev. 137, 3092–3109. doi: 10.1175/2009MWR2881.1
Bown, F., Rivera, A., and Acuña, C. (2008). Recent glacier variations at the Aconcagua basin, Central Chilean Andes. Ann. Glaciol. 48, 43–48. doi: 10.3189/172756408784700572
Bozkurt, D., Rojas, M., Boisier, J. P., Rondanelli, R., Garreaud, R., and Gallardo, L. (2019). Dynamical downscaling over the complex terrain of southwest South America: present climate conditions and added value analysis. Clim. Dyn. 53, 6745–6767. doi: 10.1007/s00382-019-04959-y
Bravo, C., Loriaux, T., Rivera, A., and Brock, B. W. (2017). Assessing glacier melt contribution to streamflow at Universidad Glacier, Central Andes of Chile. Hydrol. Earth Syst. Sci. 21, 3249–3266. doi: 10.5194/hess-21-3249-2017
Cardoso, R. M., Soares, P. M., Miranda, P. M., and Belo-Pereira, M. (2013). WRF high resolution simulation of Iberian mean and extreme precipitation climate. Int. J. Climatol. 33, 2591–2608. doi: 10.1002/joc.3616
Castañeda, M. E., and Ulke, A. G. (2015). Analysis of atmospheric conditions associated to CHACO events of the Low Level Jet East of the Andes and their implications for regional transport. Int. J. Climatol. 35, 4126–4138. doi: 10.1002/joc.4272
Chawla, I., Osuri, K. K., Mujumdar, P. P., and Niyogi, D. (2018). Assessment of the Weather Research and Forecasting (WRF) model for simulation of extreme rainfall events in the upper Ganga Basin. Hydrol. Earth Syst. Sci. 22, 1095–1117. doi: 10.5194/hess-22-1095-2018
Comin, A. N., Schumacher, V., Justino, F., and Fernández, A. (2018). Impact of different microphysical parameterizations on extreme snowfall events in the Southern Andes. Weather Clim. Extremes 21, 65–75. doi: 10.1016/j.wace.2018.07.001
Corripio, J. G., and Purves, R. S. (2005). Surface Energy Balance of High Altitude Glaciers in the Central Andes: the Effect of Snow Penitentes. London: Wiley \& Sons.
Dee, D. P., Uppala, S. M., Simmons, A. J., Berrisford, P., Poli, P., Kobayashi, S., et al. (2011). The ERA-Interim reanalysis: configuration and performance of the data assimilation system. Q. J. R. Meteorol. Soc. 137, 553–597. doi: 10.1002/qj.828
Dudhia, J. (1989). Numerical study of convection observed during the winter monsoon experiment using a mesoscale two-dimensional model. J. Atmos. Sci. 46, 3077–3107.
Espinoza, J. C., Chavez, S., Ronchail, J., Junquas, C., Takahashi, K., and Lavado (2015). Rainfall hotspots over the southern tropical Andes: spatial distribution, rainfall intensity, and relations with large-scale atmospheric circulation. Water Resour. Res. 51, 3459–3475. doi: 10.1002/2015WR017200.A
Falvey, M., and Garreaud, R. (2007). Wintertime precipitation episodes in Central Chile: associated meteorological conditions and orographic influences. J. Hydrometeorol. 8, 171–193. doi: 10.1175/JHM562.1
Fathalli, B., Pohl, B., Castel, T., and Safi, M. J. (2016). Dynamical downscaling of temperature variability over Tunisia: evaluation a 21-year-long simulation performed with the WRF model. J. Climatol. Weather Forecast. 4, 1–8. doi: 10.4172/2332-2594.1000166
Garreaud, R., Falvey, M., and Montecinos, A. (2016). Orographic precipitation in Coastal Southern Chile: mean distribution, temporal variability, and linear contribution. J. Hydrometeorol. 17, 1185–1202. doi: 10.1175/JHM-D-15-0170.1
Garreaud, R. D. (2009). The Andes climate and weather. Adv. Geosci. 22, 3–11. doi: 10.5194/adgeo-22-3-2009
Garreaud, R. D., Vuille, M., Compagnucci, R., and Marengo, J. (2009). Present-day South American climate. Palaeogeogr. Palaeoclimatol. Palaeoecol. 281, 180–195. doi: 10.1016/j.palaeo.2007.10.032
Heikkilä, U., Sandvik, A., and Sorteberg, A. (2011). Dynamical downscaling of ERA-40 in complex terrain using the WRF regional climate model. Clim. Dyn. 37, 1551–1564. doi: 10.1007/s00382-010-0928-6
Hong, S.-Y., Lim, K.-S. S., Lee, Y.-H., Ha, J.-C., Kim, H.-W., Ham, S.-J., et al. (2010). Evaluation of the WRF double-moment 6-class microphysics scheme for precipitating convection. Adv. Meteorol. 2010, 1–10. doi: 10.1155/2010/707253
Huang, M., Huang, B., and Huang, A. H. (2014). Implementation of 5-layer thermal diffusion scheme in weather research and forecasting model with Intel Many Integrated Cores. High Perform. Comput. Remote Sens. IV 9247:924709. doi: 10.1117/12.2069426
Hughes, M., Lundquist, J. D., and Henn, B. (2017). Dynamical downscaling improves upon gridded precipitation products in the Sierra Nevada, California. Clim. Dyn. 55, 111–129. doi: 10.1007/s00382-017-3631-z
Kain, J. S. (2004). The Kain–Fritsch convective parameterization: an update. J. Appl. Meteorol. 43, 170–181. doi: 10.1175/1520-0450(2004)043<0170:TKCPAU>2.0.CO;2
Malmros, J. K., Mernild, S. H., Wilson, R., Tagesson, T., and Fensholt, R. (2018). Snow cover and snow albedo changes in the central Andes of Chile and Argentina from daily MODIS observations (2000–2016). Remote Sens. Environ. 209, 240–252. doi: 10.1016/j.rse.2018.02.072
Marengo, J. A., Soares, W. R., Saulo, C., and Nicolini, M. (2004). Climatology of the low-level jet east of the Andes as derived from the NCEP-NCAR reanalyses: characteristics and temporal variability. J. Clim. 17, 2261–2280. doi: 10.1175/1520-0442(2004)017<2261:COTLJE>2.0.CO;2
Mark, B. G., Baraer, M., Fernandez, A., Immerzeel, W., Moore, R. D., and Weingartner, R. (2015). “Glaciers as water resources,” in The High-Mountain Cryosphere: Environmental Changes and Human Risks, eds C. Huggel, M. Carey, J. J. Clague, and A. Kaab (Cambridge: Cambridge University Press), 184–203.
Masiokas, M. H., Rivera, A., Espizua, L. E., Villalba, R., Delgado, S., and Aravena, J. C. (2009). Glacier fluctuations in extratropical South America during the past 1000years. Palaeogeogr. Palaeoclimatol. Palaeoecol. 281, 242–268. doi: 10.1016/j.palaeo.2009.08.006
Mlawer, E. J., Taubman, J., Brown, P. D., Iacono, M. J., and Clough, S. A. (1997). Radiative transfer for inhomogeneous atmospheres: RRTM, a validated correlatedk model for the longwave. J. Geophys. Res. 102, 16663–16682.
Mög, T., and Kaser, G. (2011). A new approach to resolving climate-cryosphere relations: Downscaling climate dynamics to glacier-scale mass and energy balance without statistical scale linking. J. Geophys. Res. Atmos. 116, 1–13. doi: 10.1029/2011JD015669
Mourre, L., Condom, T., Junquas, C., Lebel, T., Sicart, E. J., Figueroa, R., et al. (2016). Spatio-temporal assessment of WRF, TRMM and in situ precipitation data in a tropical mountain environment (Cordillera Blanca, Peru). Hydrol. Earth Syst. Sci. 20, 125–141. doi: 10.5194/hess-20-125-2016
Paulson, C. A. (1970). The mathematical representation of wind speed and temperature profiles in the unstable atmospheric surface layer. J. Appl. Meteorol. 9, 857–861.
Posada-Marín, J. A., Rendón, A. M., Salazar, J. F., Mejía, J. F., and Villegas, J. C. (2019). WRF downscaling improves ERA-Interim representation of precipitation around a tropical Andean valley during El Niño: implications for GCM-scale simulation of precipitation over complex terrain. Clim. Dyn. 52, 3609–3629. doi: 10.1007/s00382-018-4403-0
Rivera, J. A., Marianetti, G., and Hinrichs, S. (2018). Validation of CHIRPS precipitation dataset along the Central Andes of Argentina. Atmos. Res. 213, 437–449. doi: 10.1016/j.atmosres.2018.06.023
Roe, G. H. (2005). Orographic Precipitation. Annu. Rev. Earth Planet. Sci. 33, 645–671. doi: 10.1146/annurev.earth.33.092203.122541
Sikder, S., and Hossain, F. (2016). Assessment of the weather research and forecasting model generalized parameterization schemes for advancement of precipitation forecasting in monsoon-driven river basins. J. Adv. Model. Earth Syst. 8, 1248–1269. doi: 10.1002/2016MS000689
Skamarock, W. C., Klemp, J. B., Dudhia, J., Gill, D. O., Barker, D. M., Duda, M. G., et al. (2008). A Description of the Advanced Research WRF Version 3. NCAR Tech. Note NCAR TN- 475_STR, 113.
Soares, P. M., Cardoso, R. M., Miranda, P. M., de Medeiros, J., Belo-Pereira, M., and Espirito-Santo, F. (2012). WRF high resolution dynamical downscaling of ERA-Interim for Portugal. Clim. Dyn. 39, 2497–2522. doi: 10.1007/s00382-012-1315-2
Solman, S. A., and Blázquez, J. (2019). Multiscale precipitation variability over South America: analysis of the added value of CORDEX RCM simulations. Clim. Dyn. 53, 1547–1565. doi: 10.1007/s00382-019-04689-1
Viale, M., Bianchi, E., Cara, L., Ruiz, L. E., Villalba, R., Pitte, P., et al. (2019). Contrasting climates at both sides of the Andes in Argentina and Chile. Front. Environ. Sci. 7:69. doi: 10.3389/fenvs.2019.00069
Viale, M., and Nuñez, M. N. (2011). Climatology of winter orographic precipitation over the subtropical Central Andes and associated synoptic and regional characteristics. J. Hydrometeorol. 12, 481–507. doi: 10.1175/2010JHM1284.1
Ward, E., Buytaert, W., Peaver, L., and Wheater, H. (2011). Evaluation of precipitation products over complex mountainous terrain: a water resources perspective. Adv. Water Resour. 34, 1222–1231. doi: 10.1016/j.advwatres.2011.05.007
Wootten, A., Bowden, J. H., Boyles, R., and Terando, A. (2016). The sensitivity of WRF downscaled precipitation in puerto rico to cumulus parameterization and interior grid nudging. J. Appl. Meteorol. Climatol. 55, 2263–2281. doi: 10.1175/JAMC-D-16-0121.1
Yair, Y., Lynn, B., Price, C., Kotroni, V., Lagouvardos, K., Morin, E., et al. (2010). Predicting the potential for lightning activity in Mediterranean storms based on the Weather Research and Forecasting (WRF) model dynamic and microphysical fields. J. Geophys. Res. Atmos. 115, 1–13. doi: 10.1029/2008JD010868
Keywords: WRF model, downscaling, precipitation, spatio-temporal validation, Andes
Citation: Schumacher V, Fernández A, Justino F and Comin A (2020) WRF High Resolution Dynamical Downscaling of Precipitation for the Central Andes of Chile and Argentina. Front. Earth Sci. 8:328. doi: 10.3389/feart.2020.00328
Received: 02 October 2019; Accepted: 15 July 2020;
Published: 02 October 2020.
Edited by:
Frédéric Frappart, UMR5566 Laboratoire d'études en Géophysique et Océanographie Spatiales (LEGOS), FranceReviewed by:
Francina Dominguez, University of Illinois at Urbana-Champaign, United StatesCopyright © 2020 Schumacher, Fernández, Justino and Comin. This is an open-access article distributed under the terms of the Creative Commons Attribution License (CC BY). The use, distribution or reproduction in other forums is permitted, provided the original author(s) and the copyright owner(s) are credited and that the original publication in this journal is cited, in accordance with accepted academic practice. No use, distribution or reproduction is permitted which does not comply with these terms.
*Correspondence: Vanucia Schumacher, dmFudWNpYS1zY2h1bWFjaGVyQGhvdG1haWwuY29t
Disclaimer: All claims expressed in this article are solely those of the authors and do not necessarily represent those of their affiliated organizations, or those of the publisher, the editors and the reviewers. Any product that may be evaluated in this article or claim that may be made by its manufacturer is not guaranteed or endorsed by the publisher.
Research integrity at Frontiers
Learn more about the work of our research integrity team to safeguard the quality of each article we publish.