 Joseph Knafelc
 Scott E. Bryan
 David Gust
 Henrietta E. Cathey
94% of researchers rate our articles as excellent or good
Learn more about the work of our research integrity team to safeguard the quality of each article we publish.
Find out more
ORIGINAL RESEARCH article
Front. Earth Sci., 31 July 2020
Sec. Petrology
Volume 8 - 2020 | https://doi.org/10.3389/feart.2020.00310
This article is part of the Research TopicCrystal Archives of Magmatic ProcessesView all 14 articles
The 2012 Havre eruption evacuated a crystal-poor rhyolite (∼3–7% crystals) producing a volumetrically dominant (∼1.4 km3) pumice raft, as well as seafloor giant pumice (5–8%) and lavas (12–14%) at the vent (∼0.1 km3), both of which have subtly higher phenocryst contents. For crystal-poor rhyolites like the Havre pumice, it can often remain ambiguous as to whether the few phenocrysts present, in this case, plagioclase, orthopyroxene, clinopyroxene, Fe-Ti oxides ± quartz, are: (a) autocrysts crystallizing from the surrounding melt, (b) antecrysts being sourced from mush and the magma plumbing system, or (c) xenocrysts derived from source materials or chamber walls, or (d) possibly a combination of all of the above. In crystal-poor magmas, the few crystals present are strongly relied upon to constrain pre-eruptive conditions such as magmatic temperatures, pressures, water content and fO2. A detailed textural and compositional analysis combined with a range of equilibrium tests and rhyolite-MELTS modeling provide the basis for distinguishing autocrystic vs inherited crystal populations in the Havre eruption. An autocrystic mineral assemblage of andesine plagioclase, enstatite and Fe-Ti oxides constrains the pre-eruptive conditions of the Havre rhyolite magma: magmatic temperatures of 890 ± 27°C, crystallization pressures at 2–4 kbars, oxygen fugacity of NNO + 0.4 and water concentrations (5.6 ± 1.1 wt.%). Inherited phases not in equilibrium with the host melt composition are clinopyroxene, An-rich plagioclase (> An53) and quartz. Rhyolite-MELTs modeling indicates the clinopyroxene and quartz have most likely been sourced from cooler, silicic mush zones in the Havre magmatic system. This study demonstrates that even in crystal-poor rhyolites it cannot be assumed that all crystals are autocrystic and can be used to constrain pre-eruptive magmatic conditions.
Identifying the origins of crystals in magmatic systems is critical to understanding the inner workings of these systems, in particular, magma petrogenesis and pre-eruptive conditions that then place constraints on eruption dynamics. The past 20 years has seen an evolution in understanding of the origin of crystals from the generally held assumption that all phenocrysts were autocrysts nucleated and grown from the erupted magma to being a potentially complex mixture of autocrysts, xenocrysts (e.g., quartz, K-feldspars in basalts, and ancient zircon in granites and rhyolites) and antecrysts that record related, but earlier phases of magmatism (Charlier et al., 2005; Gill et al., 2006; Charlier et al., 2007; Davidson et al., 2007; Hildreth and Wilson, 2007; Jerram and Martin, 2008; Bryan et al., 2008). The recycling of crystals into new magma batches can result from magma recharge events, the mobilization of, and entrainment from, crystal mush zones, remelting of recently formed subsolidus materials, or unmelted remains (restite) of partially melted source materials (e.g., Bachmann and Bergantz, 2004, 2008a,b; Hildreth and Wilson, 2007; Bryan et al., 2008; Deering et al., 2011; Deering and Bachmann, 2010; Huber et al., 2012; Cooper and Kent, 2014; Lubbers et al., 2020). The crystal population or ‘cargo’ (dependent on the mineral suite) can therefore potentially record magmatic conditions (i.e., temperature, fO2, water content, pressure) of contrasting domains of a magma system (e.g., magma storage chambers, conduit or deeper cumulate piles). Autocrysts provide information on the pre-eruptive conditions of the magma chamber, microlites on conduit and ascent conditions, whereas antecrysts can provide valuable information on other domains of prior crystallization in the magmatic system.
For crystal-poor rhyolites, the task of determining the origins of crystal populations is often more difficult as the low crystal content typically yields a limited range in mineralogy that is combined with limited whole-rock/melt chemical variation. The Havre 2012 submarine eruption is typical of such rhyolites – it is crystal-poor (generally < 8%) and has a relatively restricted crystal assemblage of plagioclase, two pyroxenes and Fe-Ti oxides (Carey et al., 2018). This assemblage is consistent with the observed mineralogy in other low- to medium-K rhyolites from the Tonga-Kermadec arc (e.g., Wright et al., 2006; Barker et al., 2013). The state of the Havre magmatic system remains unconstrained because the eruptive history and previous eruption products are poorly known due to its remote and deep-water (900 mbsl) location.
Here we undertake the first petrologic study of the Havre 2012 eruption to critically assess the origins of the crystal cargo of the rhyolite. Phenocryst is used here as a non-genetic term, describing relatively large (0.1-1 cm), conspicuous crystals in igneous rocks (MacKenzie et al., 1982; Neuendorf, 2005). Each phenocrystic phase has the potential to be autocrystic, antecrystic, or xenocrystic, where a single phenocryst can contain domains of contrasting genetic origins (e.g., a xenocrystic or antecrystic core enveloped in an autocrystic rim). We therefore use textural and size information coupled with mineral chemistry to discriminate autocrystic from inherited and recycled (antecrystic or xenocrystic) mineral phases. Chemical equilibrium tests (e.g., Bacon and Hirschmann, 1988; Putirka, 2008; Mollo et al., 2013) are important tools to distinguish autocrysts that can then be used confidently to estimate pre-eruptive magmatic temperatures and pressures of crystallization. Rhyolite-MELTs models (Gualda et al., 2012; Ghiorso and Gualda, 2015) estimate initial conditions (i.e., water concentrations and oxygen fugacity) to confirm the observed petrographic relationships and act as an independent and predictive check of what the autocrystic mineral assemblage is under those magmatic conditions. The results presented here are a first-step in understanding the magmatic plumbing system of the Havre volcano, and provide insight into the processes involved in the generation and pre-eruptive storage conditions of a significant volume of crystal-poor rhyolite in an island arc setting.
The Havre 2012 eruption provides a valuable opportunity to examine the crystal populations of a large volume (∼1.5 km3), crystal-poor rhyolite produced in an island arc-setting. The Havre volcano is located within the Kermadec arc approximately halfway between New Zealand and Tonga. Havre is a ∼1 km high edifice with a summit elevation 900 m below sea level (9.6 MPa), and the volcano is capped by a summit caldera ∼3 km wide with the caldera floor residing at 1520 m below sea level (Wright et al., 2006). Reconnaissance sampling of the summit of Havre volcano revealed the presence of basaltic andesite and dacite-rhyolite lavas that are slightly less evolved than the 2012 Havre rhyolite in composition (Wright et al., 2006). The pre-2012 and dredged samples from Havre (Figure 1) are utilized here as starting compositions in Rhyolite-Melts models to assess the role of crystal fractionation in producing the large volume of crystal-poor rhyolite.
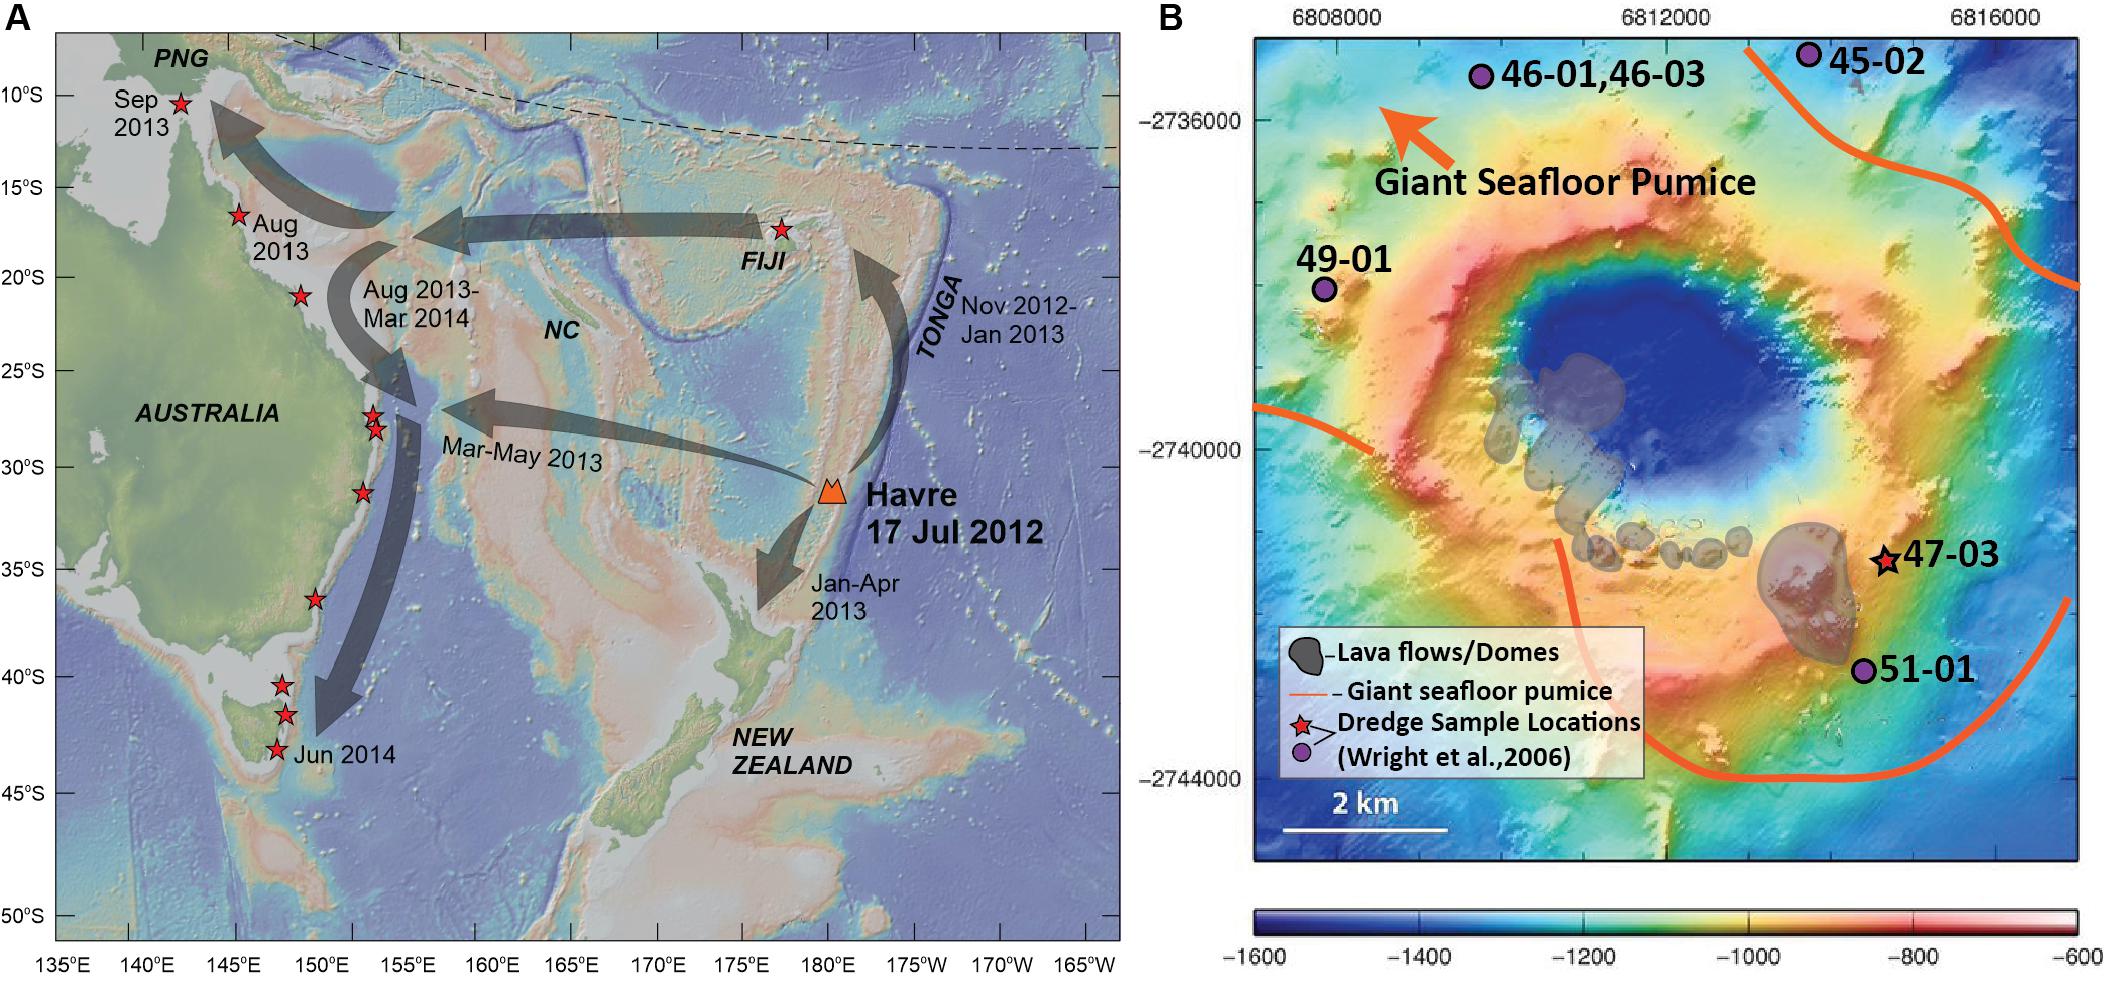
Figure 1. Sampling locations of Havre 2012 eruptive products. (A) Map of southwest Pacific showing source location of Havre volcano with eruption timing, the regional dispersal of the pumice raft (gray arrows) and arrival timing of raft material for Tonga, New Zealand and the Eastern Coast of Australia. Red stars denote locations where stranded pumice raft material has been collected for this study. Basemap is derived from the Global Multi-Resolution Topography synthesis (Ryan et al., 2009) generated by GeoMapApp (http://www.geomapapp.org/). Abbreviations: NC, New Caledonia; PNG, Papua New Guinea. (B) Havre volcano bathymetry map (modified from Carey et al., 2014) showing the locations of summit lava flows and domes produced in the 2012 eruption (Carey et al., 2018), the depositional area of giant seafloor pumice, and location of dredged lava samples which pre-date the Havre 2012 eruption (Wright et al., 2006). Red star marks the location of the dredge sample that is used in this study as a parental composition in Rhyolite-MELTS models. Grid coordinates are based on the World Geodetic System (WGS84).
In July 2012, a new submarine silicic eruption occurred at Havre, and was estimated to have evacuated ∼1.5 km3 DRE of magma, representing the largest known historic submarine silicic eruption (Carey et al., 2014, 2018). Satellite images constrain eruption timing to July 19, 2012 (Carey et al., 2014; Jutzeler et al., 2014). The main raft was visible in MODIS images over the next four months as it dispersed over an area of 550,000 km2 by which time the raft was dispersed in way that it was no longer visible in MODIS images (Jutzeler et al., 2014). Pumice raft material successively arrived along the shores of Tonga, New Zealand and Australia in the following months, where stranded pumice was collected and characterized for this study (Figure 1). In 2015, a more substantial and detailed study of the Havre summit was undertaken (Mapping, Exploration and Sampling at Havre or MESH) using autonomous underwater vehicles (AUV) and remotely operated vehicles (ROV) to collect high-resolution multibeam data and sample seafloor products of the eruption at Havre. The MESH cruise identified new eruptive products from the 2012 eruption including; (1) a series of 14 chemically distinct lava flows/domes fed from a lengthy fissure along the southern caldera rim (cumulative eruptive volume of ∼0.005 km3; see Carey et al., 2018; Ikegami et al., 2018), (2) A layer of giant pumice ranging in size from ∼1 to 9 m in diameter and covering > 35 km2 of the caldera floor (Carey et al., 2018; Manga et al., 2018a; Mitchell et al., 2018); and (3) A thin layer of ash (< 0.1 km3; Carey et al., 2018) that has been divided into four subunits differentiated by contrasting ash morphologies, some of which suggests that part of the Havre magma fragmented without direct water contact (Murch, 2018; Murch et al., 2019). The culmination of the many studies of the Havre eruption over the last five years is that there is a more complex eruptive history to the 2012 eruption rather than simply being entirely effusive or explosive.
To date the majority of studies on the Havre 2012 submarine eruption have focused on the limited volume (< 0.1 km3 or 7% of the total eruptive material) seafloor eruptive products (e.g., Carey et al., 2014, 2018; Manga et al., 2018a, b; Ikegami et al., 2018; Mitchell et al., 2018, 2019; Murch et al., 2019). Studies on the volumetrically dominant pumice raft (∼1.4 km3 or 93% of total eruptive material) has been at a reconnaissance level, examined limited material (e.g., Rotella et al., 2015; Manga et al., 2018b) and focused on raft dispersion (e.g., Jutzeler et al., 2014; Carey et al., 2014; Velasquez et al., 2018). One outcome of the seafloor-focused studies has been the interpretation that the giant seafloor pumice and pumice raft were erupted contemporaneously (Manga et al., 2018a, b) given near identical whole-pumice compositions, similar mineralogy (i.e., plagioclase, orthopyroxene, clinopyroxene and Fe-Ti oxides) and textural features (e.g., banded pumice, tubed pumice and bread crusting). This study takes a more in-depth examination of the volumetrically dominant raft pumice to further characterize the 2012 Havre eruption. The raft, given its erupted volume, provides a much larger sampling of the Havre magma chamber. The raft pumice has been insufficiently documented in previous studies and the results here provide an improved platform for comparison between the buoyant and widely dispersed raft and the near-vent deposits at Havre.
Extensive sampling of pumice raft material has been undertaken of strand deposits of Havre pumice from across the SW Pacific (Figure 1), which has allowed us to capture the full textural and potential compositional diversity of pumiceous material produced in the eruption. Two pieces of the seafloor giant pumice and four samples of different lava flows from the summit of Havre have also been analyzed in this study, and in conjunction with previously published data (Manga et al., 2018a, b; Carey et al., 2018; Ikegami et al., 2018), are used to provide a more comprehensive petrological picture of the 2012 Havre eruption.
Whole-pumice and glass chemistry are used to constrain melt chemistry and identify any potential compositional diversity amongst eruptive products. Due to the overall low crystal contents, whole-pumice and glass chemistry are similar (see also Mitchell et al., 2019). Whole-pumice composition has been determined for 29 pumice raft and two giant seafloor samples (Table 1). Sample preparation initially involved the removal of seawater contamination as outlined in Supplementary Material 1. For XRF analysis an aliquot of the cleaned and powdered sample (ca. 0.5 g) was fused into a glass disk using a commercial lithium metaborate/lithium tetraborate flux (50:50 LiT:LiM, 0.5 wt% LiI) in a platinum crucible using an electric fusion furnace. The resultant disk was analyzed in a Wavelength Dispersive X-ray Fluorescence spectrometer (WD-XRF) under vacuum using a 1kW Rh X-ray tube. The spectrometer was calibrated using the WROXI calibration set utilizing a quasi-Lachance matrix correction. A separate LOI was determined gravimetrically by igniting an aliquot of each sample (ca. 0.1 g) in a high-alumina sintered silica crucible at 1050°C.
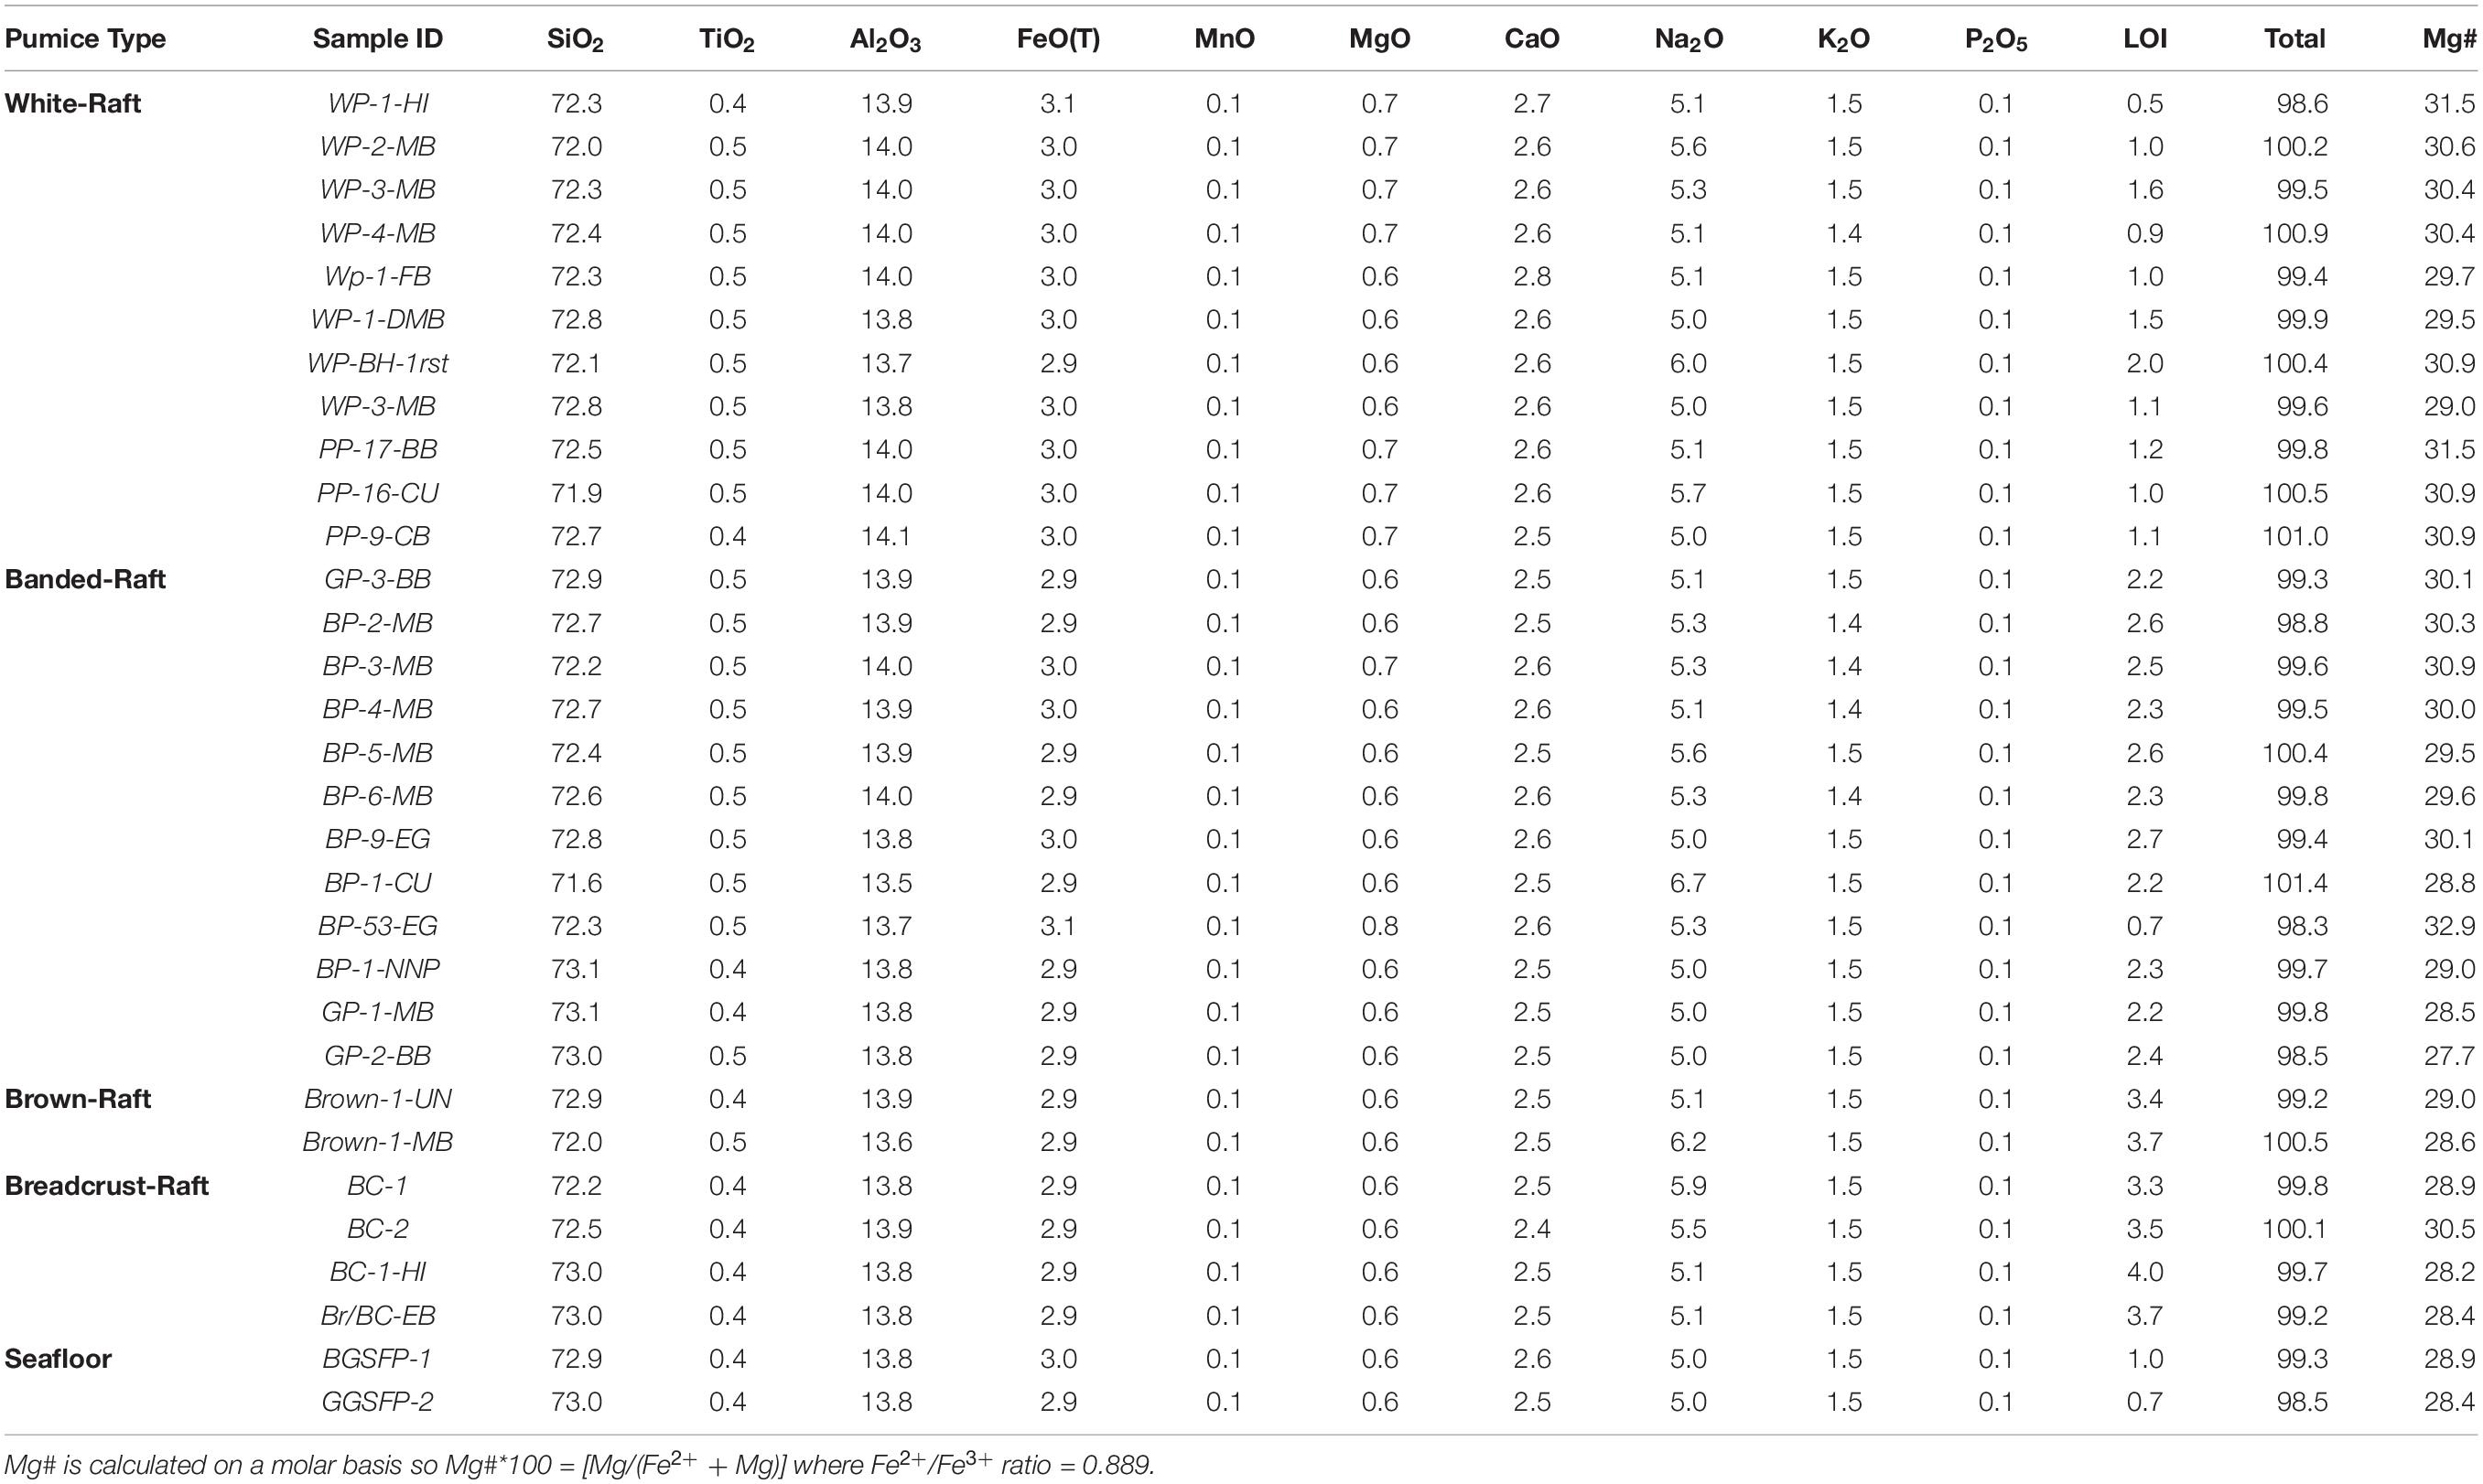
Table 1. Havre 2012 pumice XRF whole-rock chemistry normalized to anhydrous totals.
We have used whole-pumice chemistry to represent melt chemistry prior to eruption in thermobarometry calculations (e.g., glass-orthopyroxene, glass-clinopyroxene, and glass-plagioclase) and corresponding equilibrium tests for each mineral phase. This is for a number of reasons. First, glass data are not available for all pumice textural types and for all samples from which mineral compositions have been determined. However, whole-pumice chemistry is available for all samples with mineral chemical analyses and this permits a more consistent approach for evaluating mineral and magma chemistries. Second, reliable glass analyses are more difficult to obtain in the banded raft and seafloor pumice samples which are densely populated with microlites and nanolites (e.g., Figure 2C). Third, the relatively low-crystal content (3-7%) results in only a very minor shift between glass and whole-rock chemistry. However, glass compositions are distinctly more SiO2-rich and evolved compared to whole-pumice compositions reflecting modification of glass chemistry by microlite and nanolite crystallization (Mitchell et al., 2019). Given microlite crystallization is a syn-eruptive process (Hammer et al., 1999; Cashman and Blundy, 2000; Toramaru et al., 2008; Mollo and Hammer, 2017), the glass chemistry is no longer reflective of the pre-eruptive melt chemistry which is the focus here.
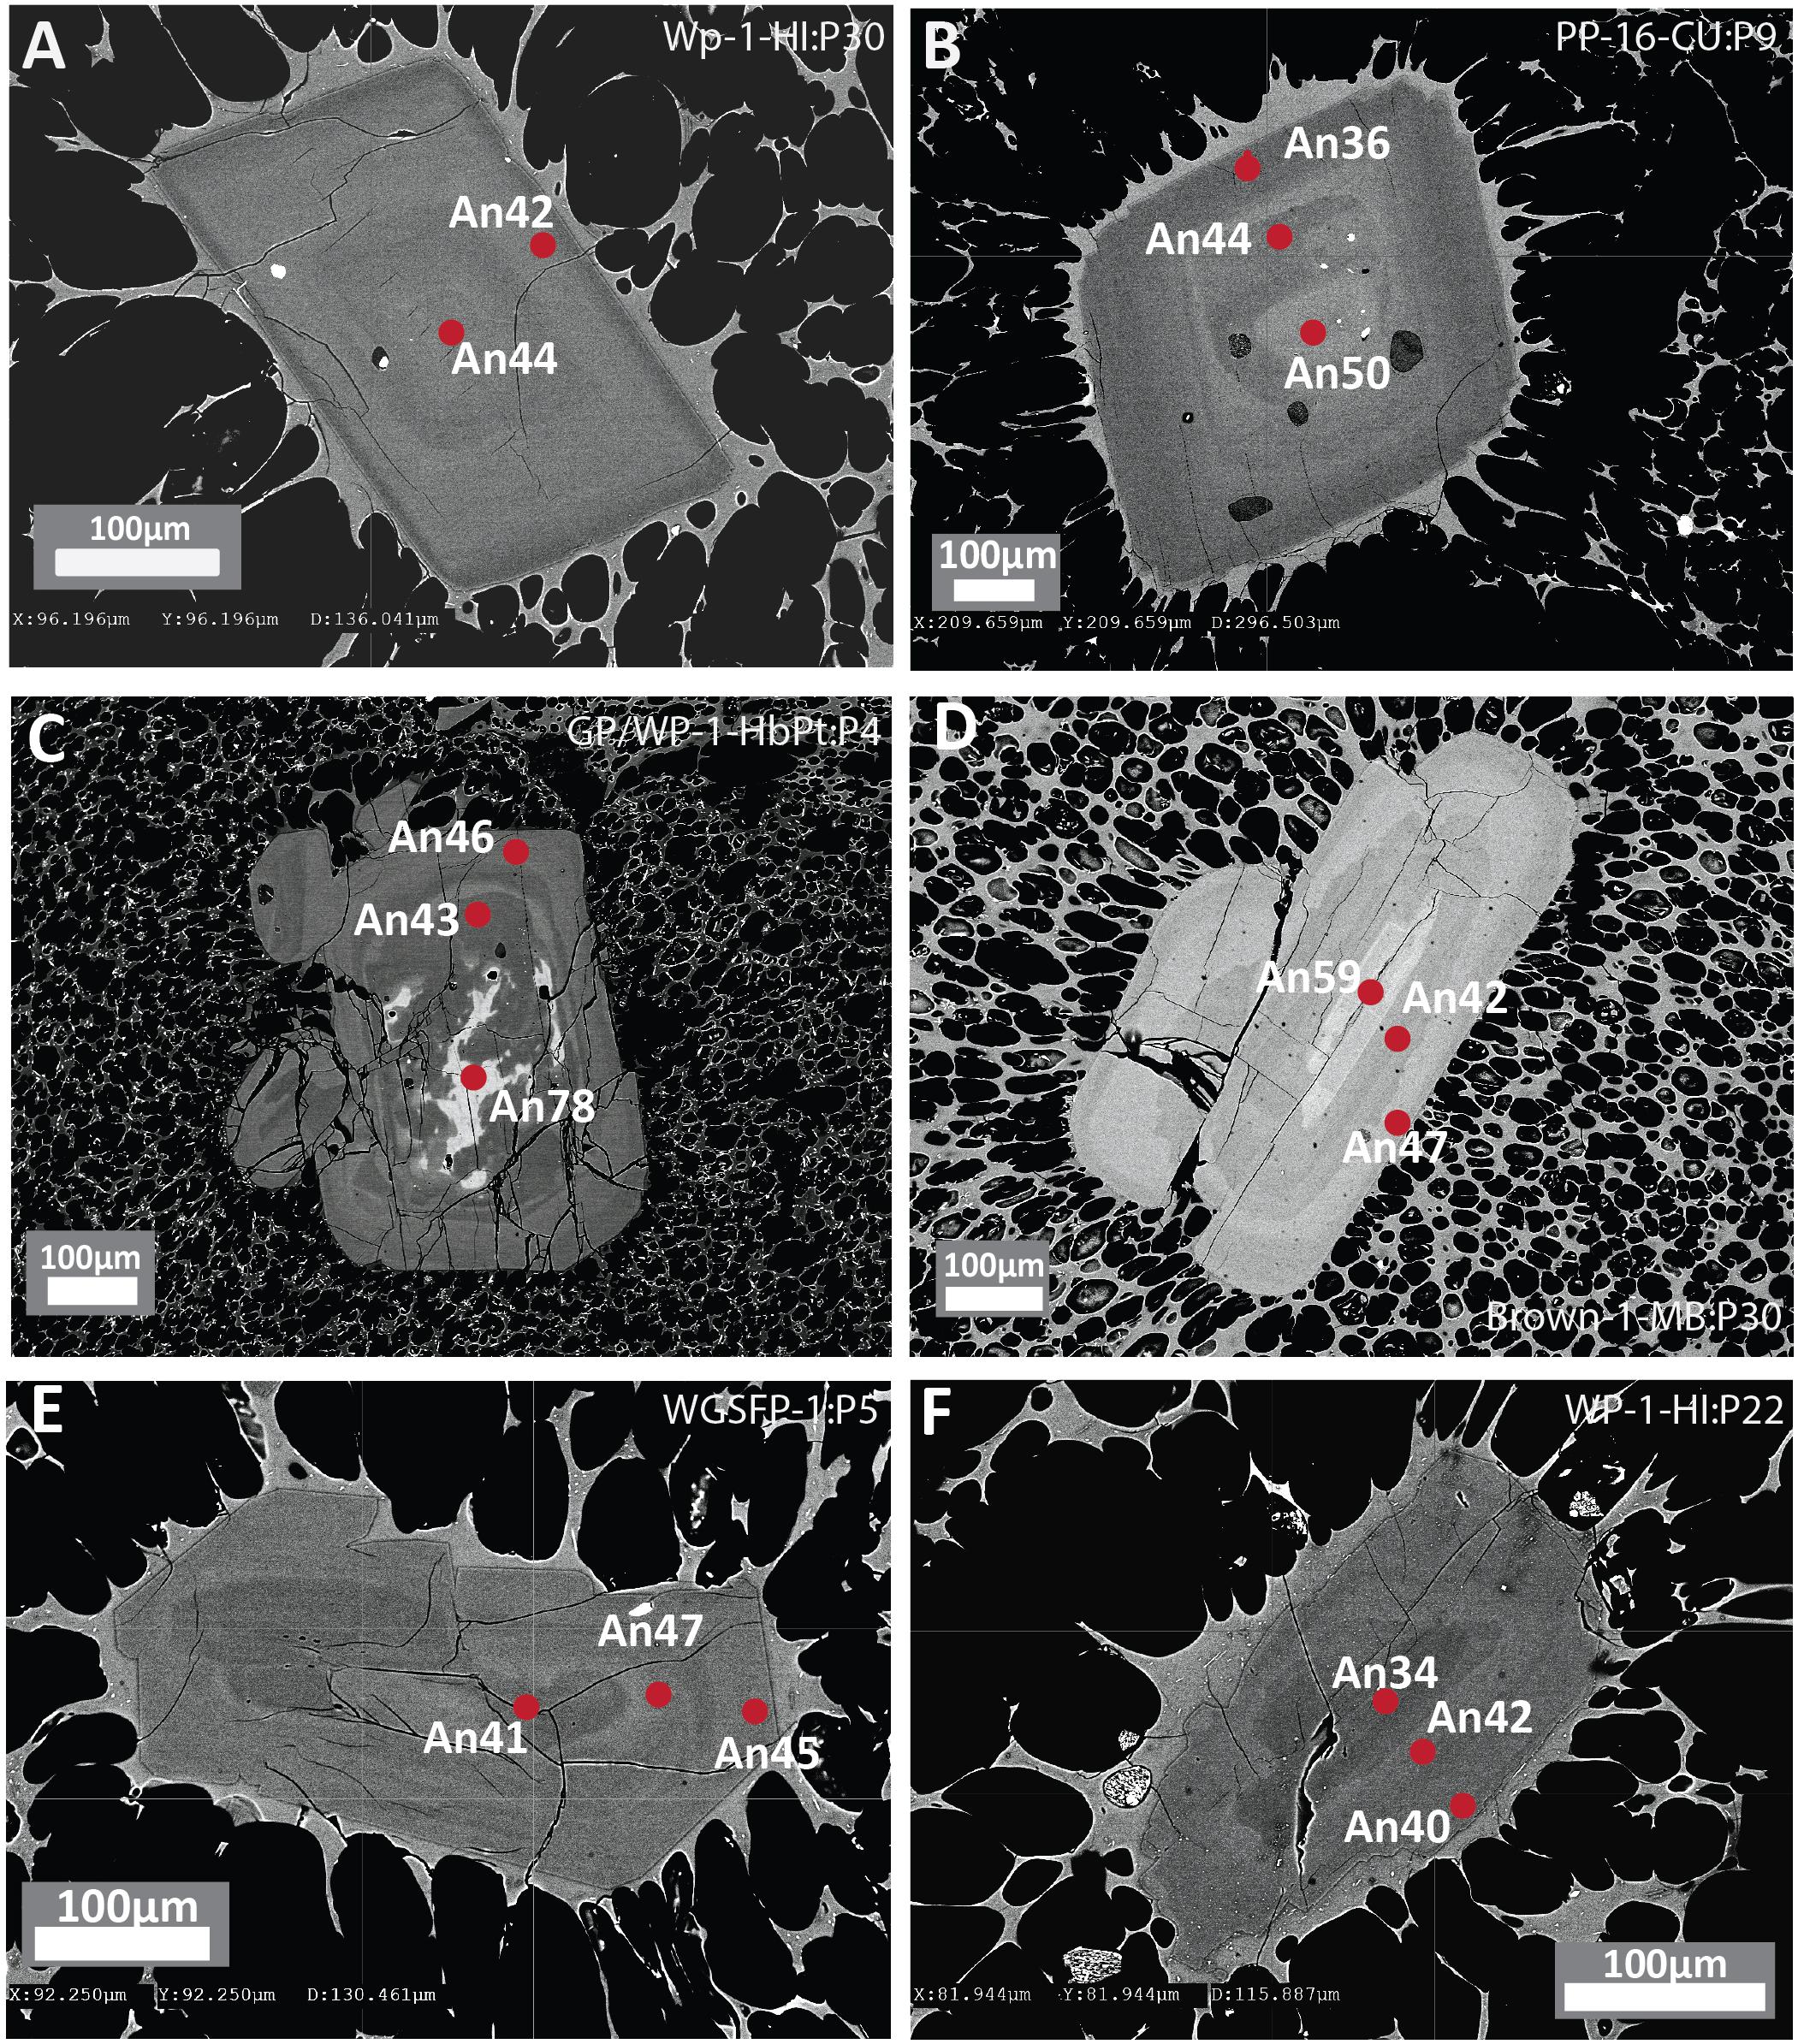
Figure 2. Backscattered electron (BSE) images of plagioclase phenocrysts from white pumice raft samples with concentric zoning showing contrasting core to rim relationships. (A,B) Euhedral plagioclase phenocrysts showing normal compositional zoning with minor oscillations. (C,D) Euhedral plagioclase phenocrysts with compositionally distinct An-rich resorbed cores and oscillatory zoned overgrowths. (E,F) Subhedral plagioclase phenocrysts with partially resorbed sodic plagioclase cores. Red dots denote location of EPMA with corresponding An content.
To resolve the origin of the crystal cargo of the 2012 Havre rhyolite, a detailed study of mineral phase abundance, texture, chemistry and zonation patterns was undertaken, which can be particularly insightful in terms of recording pre-eruptive magma interactions and processes. Modal abundance data for twenty-two samples are presented in Table 2. Point counting of thin sections used a grid with a 0.5 mm spacing in the X direction and 1 mm step size in the Y direction allowing for an average of ∼1500 counts per standard thin section.
Table 2. Modal abundances of Havre eruptive products.
Textural variations from core to rim in minerals are a useful indication of equilibrium vs disequilibrium crystallization conditions from the time of nucleation (i.e., cores) to last stages of crystallization prior to eruption (i.e., rims). Anhedral crystals or internally resorbed/embayed textures can indicate chemical disequilibrium and can typically be marked by sharp compositional boundaries and changes. Therefore, the shape and compositional zoning (or lack thereof) present in crystals provides context on the origins of the crystal cargo or domains within crystals. A detailed petrographic review of all eruptive products was completed through backscatter electron (BSE) imaging of each mineral phase. BSE images reveal the typical range of crystal morphologies (i.e., anhedral vs euhedral) of each mineral phase and any zoning patterns. The extent of mineral chemical variation from core to rim provides information on different zoning vectors (i.e., normal vs reserve zoning) and provides context on conditions of crystallization over time in the magmatic system. Microlites and nanolite crystals in the glass record syn-eruptive conditions typically associated with degassing and decompression (Hammer et al., 1999; Cashman and Blundy, 2000; Toramaru et al., 2008; Mollo and Hammer, 2017).
In this study, in situ electron probe micro analysis (EPMA) was performed on the phenocryst assemblage of orthopyroxene, clinopyroxene, plagioclase and Fe-Ti oxides. Mineral chemistry and a select population of raft pumice glass analysis results are reported in Supplementary Excel File 1 as wt.% oxides and ion proportions based on stoichiometric cation to oxygen ratios for each mineral phase. Core and rim single-spot EPMA were performed on individual crystals when a certain spot size was permitted (i.e., microphenocrysts and phenocrysts) to investigate zoning patterns and potential compositional variations for each mineral phase. Microlites due to their small size are only analyzed in one location. EPMA- 1-μm spatial resolution elemental maps reveal detailed compositional patterns of orthopyroxene and clinopyroxene. Elemental maps indicate the presence or lack thereof, of internal compositional variations and disequilibrium textures, which can be drawn upon to further interpret the magmatic processes and conditions that the pyroxene phases experienced.
Quantitative in situ spot analyses by wavelength dispersive spectrometry (WDS) of pumice glass and minerals in thin section, as well as quantitative, background-corrected elemental maps of pyroxenes, were performed using a JEOL JXA 8530f field emission microprobe equipped with five wavelength-dispersive spectrometers and using Probe Software applications (Probe for EPMA, Probe Image and CalcImage; Eugene, OR, United States). Thin sections were coated with 20 nm carbon prior to analysis. For spot analysis of glass, instrument conditions of 15 kV accelerating voltage, 10 nA beam current and a 10 μm-defocused beam were used, with X-ray counts for Si and Na collected first and concurrently in the element analysis order. The on-peak counting times were adjusted to provide detection limits ≤ 300 ppm for most elements with the exceptions of Ba (500 ppm), F (370 ppm), and Na (380 ppm) for which a 5 second on-peak counting time was used in order to minimize Na loss under the electron beam. An LDE1 analyzing crystal was used for F, as well an exponential fit to the continuum background and interference correction for Fe La on F Ka. A selection of commercially available and in-house natural and synthetic standards was used as calibration materials, including Astimex albite (Na), barite (Ba), plagioclase An59 (Al), hematite (Fe), rhodonite (Mn), tugtupite (Cl) and orthoclase (K); NBS synthetic glass standard K411 (Ca, Mg); and in-house celestite (Sr), topaz (F), rutile (Ti), and Lipari glass (Si). Oxygen was calculated by stoichiometry. Mafic minerals were analyzed in a separate session under conditions of 15 kV accelerating voltage, 30 nA beam current and a 3 μm-defocused beam. Similar standard assignments were used as for glass, with exceptions and additions being NBS K411 for Si, and Astimex standards Cr2O3 (Cr) and pentlandite (Ni). Detection limits for all elements in the mineral routines are ≤ 200 ppm. Analyzing crystals for glass on spectrometers 1-5 included: 1-LDE1 (F Ka), 2-PETL (Ca-K-Cl-S-P Ka, Sr La), 3-TAP (Si-Al Ka), 4-LIFH (Fe-Mn-Cr-Ti K, Ba La), 5-TAPH (Na-Mg Ka); and for pyroxenes 1-PETJ (Ca Ka), 2-LIFL (Ni-Cr Ka), 3-TAP (Si-Al Ka), 4-LIFH (Fe-Mn-Cr-Ti Ka, 5-TAPH (Na-Mg Ka). Data quality control was monitored during all analytical runs using in-house secondary standards including separate sessions for mineral and pumice glass analysis.
In order to achieve a 1-μm spatial resolution for detailed elemental mapping of pyroxene, the selection of analytical conditions was informed by Monte-Carlo simulations of electron beam trajectories in pyroxene using CASINO software (Université de Sherbrooke, Québec, Canada). A reduced accelerating voltage of 10 kV, beam current of 100 nA and 500 ms dwell time were used, with a 1-μm defocused beam to match the step size. The mean atomic number (MAN) background method was used for map acquisition, which permits two passes over the map area to yield background corrected data for 10 elements (Si, Ti, Al, Cr, Fe, K, Mn, Mg, Ca, Na). In order to illuminate the interfaces between pyroxene and glass, K was included in the setup. Map data were acquired using Probe Image and processed using CalcImage softwares (Eugene, OR, United States), and output to Surfer (Golden Software) for visualization. Oxygen is calculated by stoichiometry, with standards identical to those for pyroxenes described above.
Previous studies (Carey et al., 2014, 2018; Manga et al., 2018a, b; Mitchell et al., 2019) have focused primarily on the seafloor giant pumice and lava flows (< 7% by volume). Through our extensive sampling of beach stranded raft pumice, we observe a wider variety of pumice textural types than has been recognized from the Havre summit and seafloor deposits including a subpopulation of white pumice with secondary pink coloration and a ‘brown’ pumice with bread crusted surfaces (Supplementary Material 2). Of note is that the brown pumice textural type is observed to be in direct contact with white and banded raft pumice textural types within individual clasts confirming that it was an additional pumice type produced in the 2012 eruption. Although the majority of the pumice raft material has a heterogenous vesicle size and shape distribution and typically lacks vesicles < 20 μm (e.g., Rotella et al., 2015; Manga et al., 2018a); the brown and other bread crusted pumice types are distinctive in having a much more homogeneous vesicle size and shape distribution with nearly spherical vesicles typically 20–40 μm in size (Figure 2D).
Major element chemistry of the Havre pumice is presented in Table 1 and represents a more extensive set of chemical analyses of the raft pumice (i.e., white, banded, brown and bread crusted pumice textural types) than previously published (Rotella et al., 2015; Carey et al., 2018). Whole-pumice chemistry shows some difference to glass chemistry determined by EPMA (Supplementary Excel File 1; see also Mitchell et al., 2019) despite the overall low crystal contents of the Havre pumice. For example, FeO(t) displays the most prominent difference of the major oxides from ∼2.9 wt.% (whole-pumice) to 2.2 wt.% in the glass. These differences are most likely due to plagioclase and Fe-Ti oxide microlite (see glass domains in Figure 2) and nanolite crystallization upon eruption/ascent. On the basis of major element chemistry, the Havre eruption appears to have evacuated a sizeable, relatively chemically homogenous volume (∼1.5 km3) of metaluminous, medium-K calc-alkaline rhyolite.
Havre pumice raft samples contain the phenocryst/microphenocryst assemblage of plagioclase, orthopyroxene (enstatite), clinopyroxene (augite), and Fe-Ti oxides (titanomagnetite, ilmenite), with plagioclase being the dominant phenocryst phase in all erupted products. Trace occurrences of apatite, quartz and pyrrhotite were observed in some samples (Table 2). The plagioclase-two pyroxene assemblage is characteristic of pumice materials from other volcanoes in the Tonga-Kermadec arc (e.g., Bryan, 1970; Bryan et al., 2004; Wright et al., 2006; Barker et al., 2013). Most mineral phases occur as phenocrysts (0.5–3 mm), microphenocrysts (0.2–0.5 mm), microlites (< 0.2 mm) and as components of polymineralic glomerocrysts. Glomerocrysts typically consist of plagioclase, orthopyroxene and Fe-Ti oxides (ilmenite and/or titanomagnetite), where rare glomerocrysts contain clinopyroxene. Modal abundance data indicate subtle differences in crystal content between the raft pumice, the giant seafloor pumice and lavas (Table 2). This is consistent with the observations of Carey et al. (2018) who reported slightly higher abundances of plagioclase (3–5%) and orthopyroxene (1–2%), and less Fe-Ti oxides (< 1%) in the giant seafloor pumice compared to the raft pumice such that giant seafloor pumice has slightly higher overall phenocryst contents. When considering all the erupted products from the 2012 Havre eruption, a spectrum exists in terms of crystal content from very crystal-poor rhyolite (white raft pumice, ∼3–6%) through banded raft pumice and giant seafloor pumice (4–7%) to more phenocrystic lavas (up to 15%) that are distinctly more plagioclase-rich (Table 2).
Plagioclase is the most abundant mineral phase in all Havre 2012 eruptive products and is observed as phenocrysts, microphenocrysts, microlites and in glomerocrysts often containing inclusions of titanomagnetite and/or ilmenite. Plagioclase microlites and microphenocrysts are typically euhedral to subhedral whereas plagioclase phenocrysts and glomerocrysts are more subhedral showing some rounding and truncation of zoning bands (Figure 2). Internally, zoning is common in the larger plagioclase, and distinct resorbed or rounded core domains can also be distinguished (Figure 2).
Overall, plagioclase compositions range from An33 to An79 and can be classified as sodic andesine to calcic labradorite with minimal orthoclase content (< Or1). The range of An content is observed in plagioclase from all eruptive products (Figure 3A), but when discriminated on the basis of crystal size (Figure 3B), high-An plagioclase compositions (> An50) are mostly present as cores to phenocrysts and glomerocrysts (Figures 2B,C). In contrast, plagioclase rim and microlite compositions are much more uniform in composition and show little compositional variation (mostly An40–45; Figure 3C). As observed in BSE images (Figure 2), zoning is most pronounced in the plagioclase phenocrysts and glomerocrysts. Despite the optical evidence for zonation, a significant proportion of plagioclase shows only minor compositional zonation of < An5 when paired core and rim analyses from single plagioclase crystals are compared (Figure 3A). However, plagioclase phenocrysts and particularly glomerocrysts tend to exhibit relatively strong normal zoning with up to An30 difference between core and rim compositions (Figure 3B). Some plagioclase microphenocrysts and phenocrysts show a weak reverse zonation with up to An10 difference between core and rim compositions.
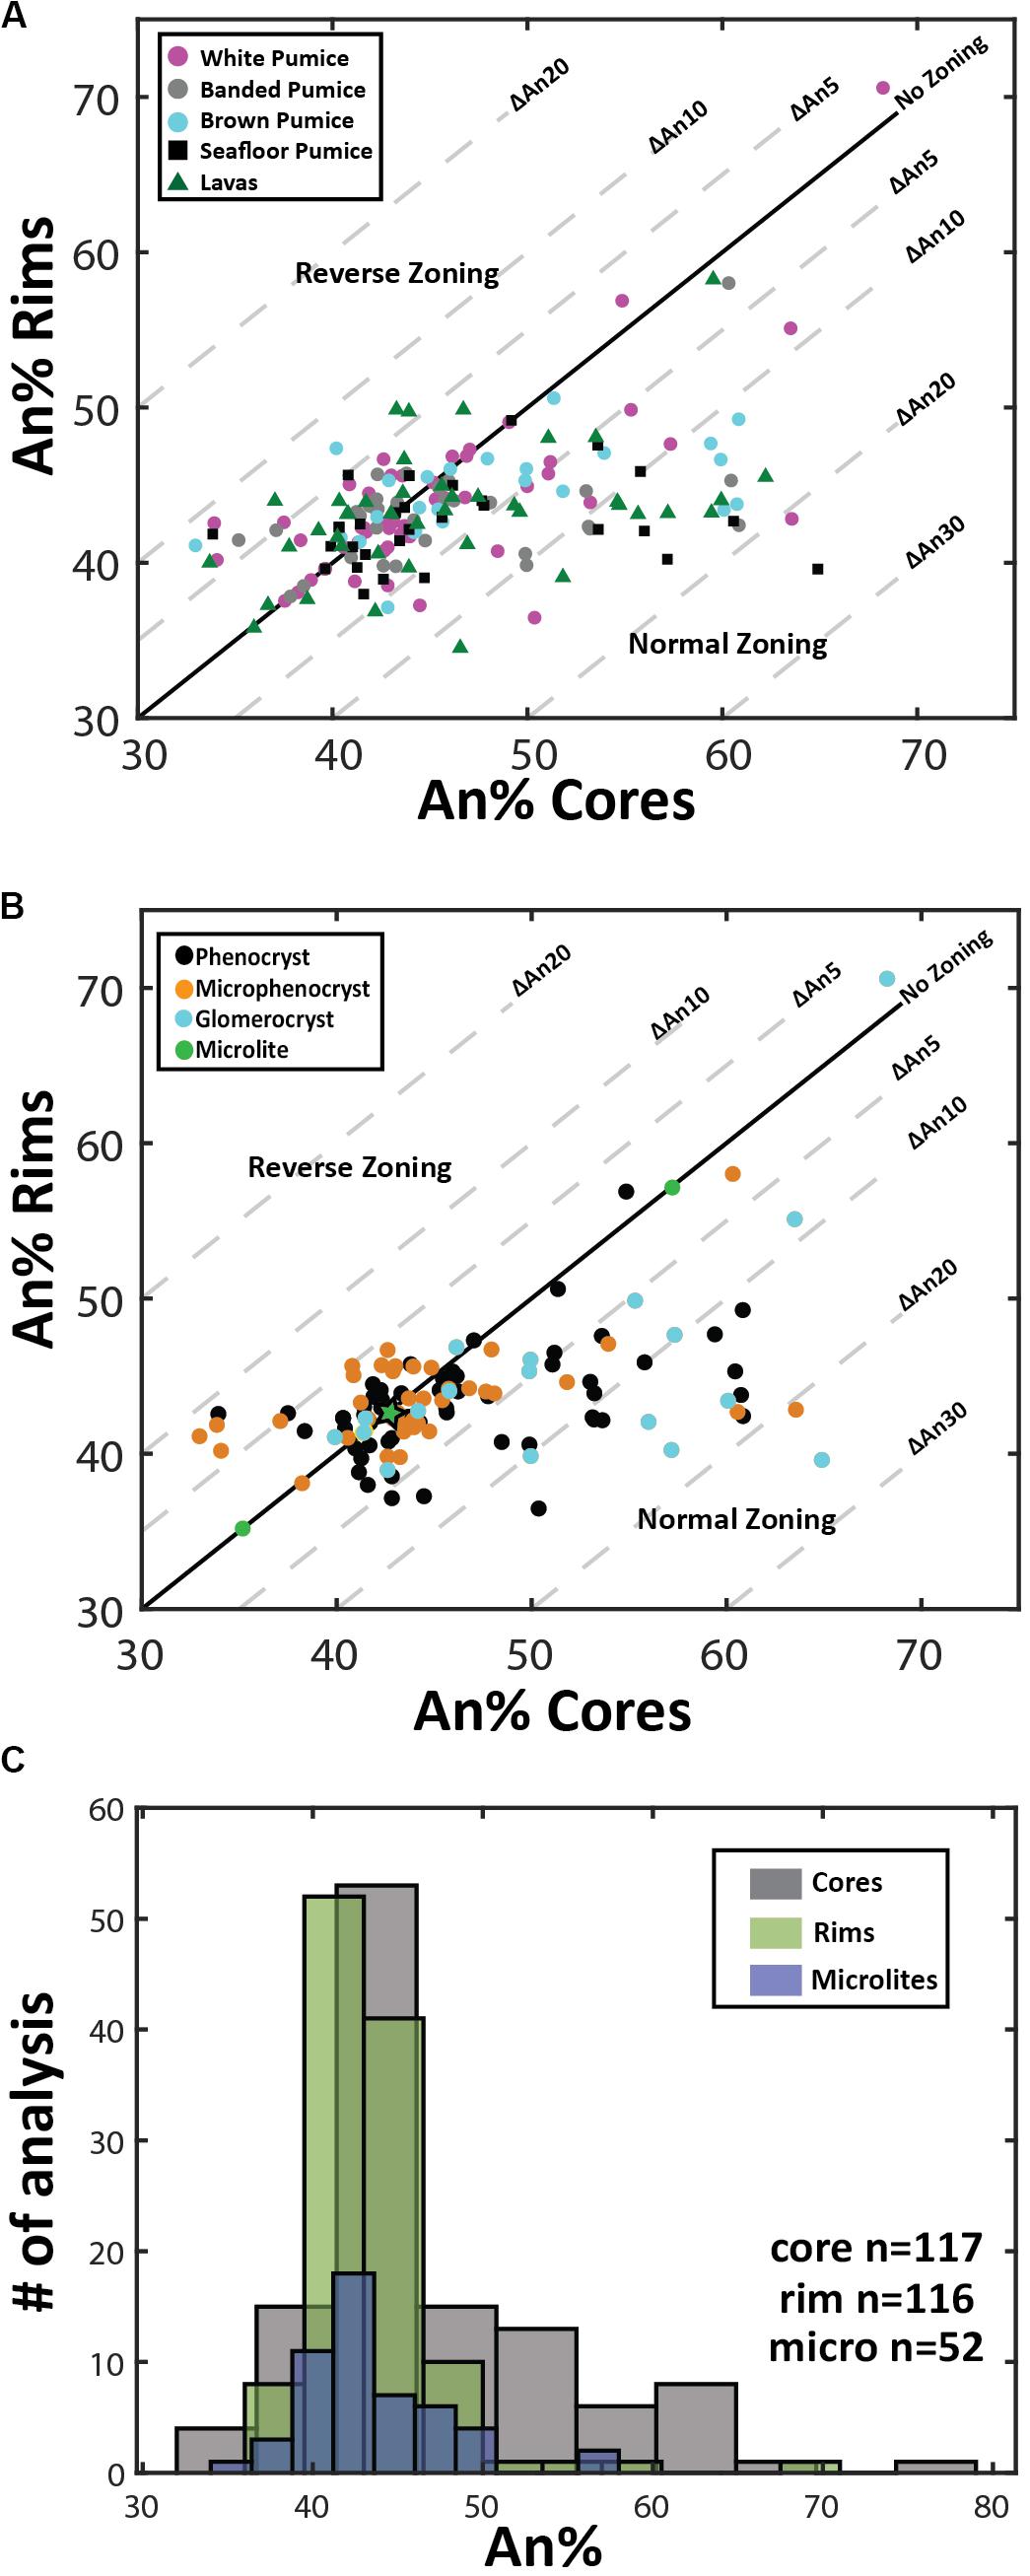
Figure 3. Plagioclase compositional variation. (A) and (B) Zoning patterns of plagioclase where core and rim analyses are plotted to illustrate growth history of individual phenocrysts. Plagioclase zoning patterns are discriminated by eruptive product (A) and crystal size (B). Plagioclase phenocrysts tend toward lower anorthite contents during fractional crystallization of rhyolite magma under closed-system conditions, resulting in normal compositional zoning; normal zoning is most pronounced in the phenocrysts and glomerocrystic plagioclase. Note that microlite compositions are based on 1 analysis per crystal as microlite size prevented paired core-rim analyses being obtained from each microlite. The maximum and minimum An content of microlites is plotted on the one-one line as green circles and the mean of all microlite analyses is plotted as a green star at An43.5. (C) Histograms comparing microlite compositions with plagioclase core and rim phenocryst compositions. Note the larger spread of plagioclase core compositions and the overlap of rim and microlite compositions that are An40–45. Note in C the normal distribution of the cores is shifted to the right by ∼An5 relative to microlite distribution, while a normal distributions of the phenocryst rim and microlite An content are nearly identical. The number of single spot EPMA for plagioclase cores, rims, and microlites are 116, 117, and 52, respectively.
Two pyroxenes are present in all the Havre eruptive products, but orthopyroxene is typically more modally abundant than clinopyroxene (Table 2). Modal abundance estimates indicate subtle differences in relative abundances across the erupted products. In the volumetrically dominant white raft pumice, orthopyroxene is twice as abundant as clinopyroxene while in the giant seafloor and some banded pumice their proportions are subequal. Highest clinopyroxene abundances are recorded from the lavas (Table 2). These results, however, cannot be compared with the study of the Havre 2012 lavas by Ikegami et al. (2018) as ortho- and clinopyroxene were not distinguished. Like plagioclase, orthopyroxene occurs as phenocrysts, microphenocrysts and microlites in the pumice glass, as well as in small glomerocrysts associated with plagioclase, titanomagnetite or ilmenite, and rarely clinopyroxene. Clinopyroxene crystals are mainly microphenocrysts < 200 μm in size, but are rarely > 0.5 mm. Orthopyroxene is more euhedral and zoning is less frequently observed when compared to the subhedral to anhedral clinopyroxene that often shows zoning and resorption textures (Figure 4).
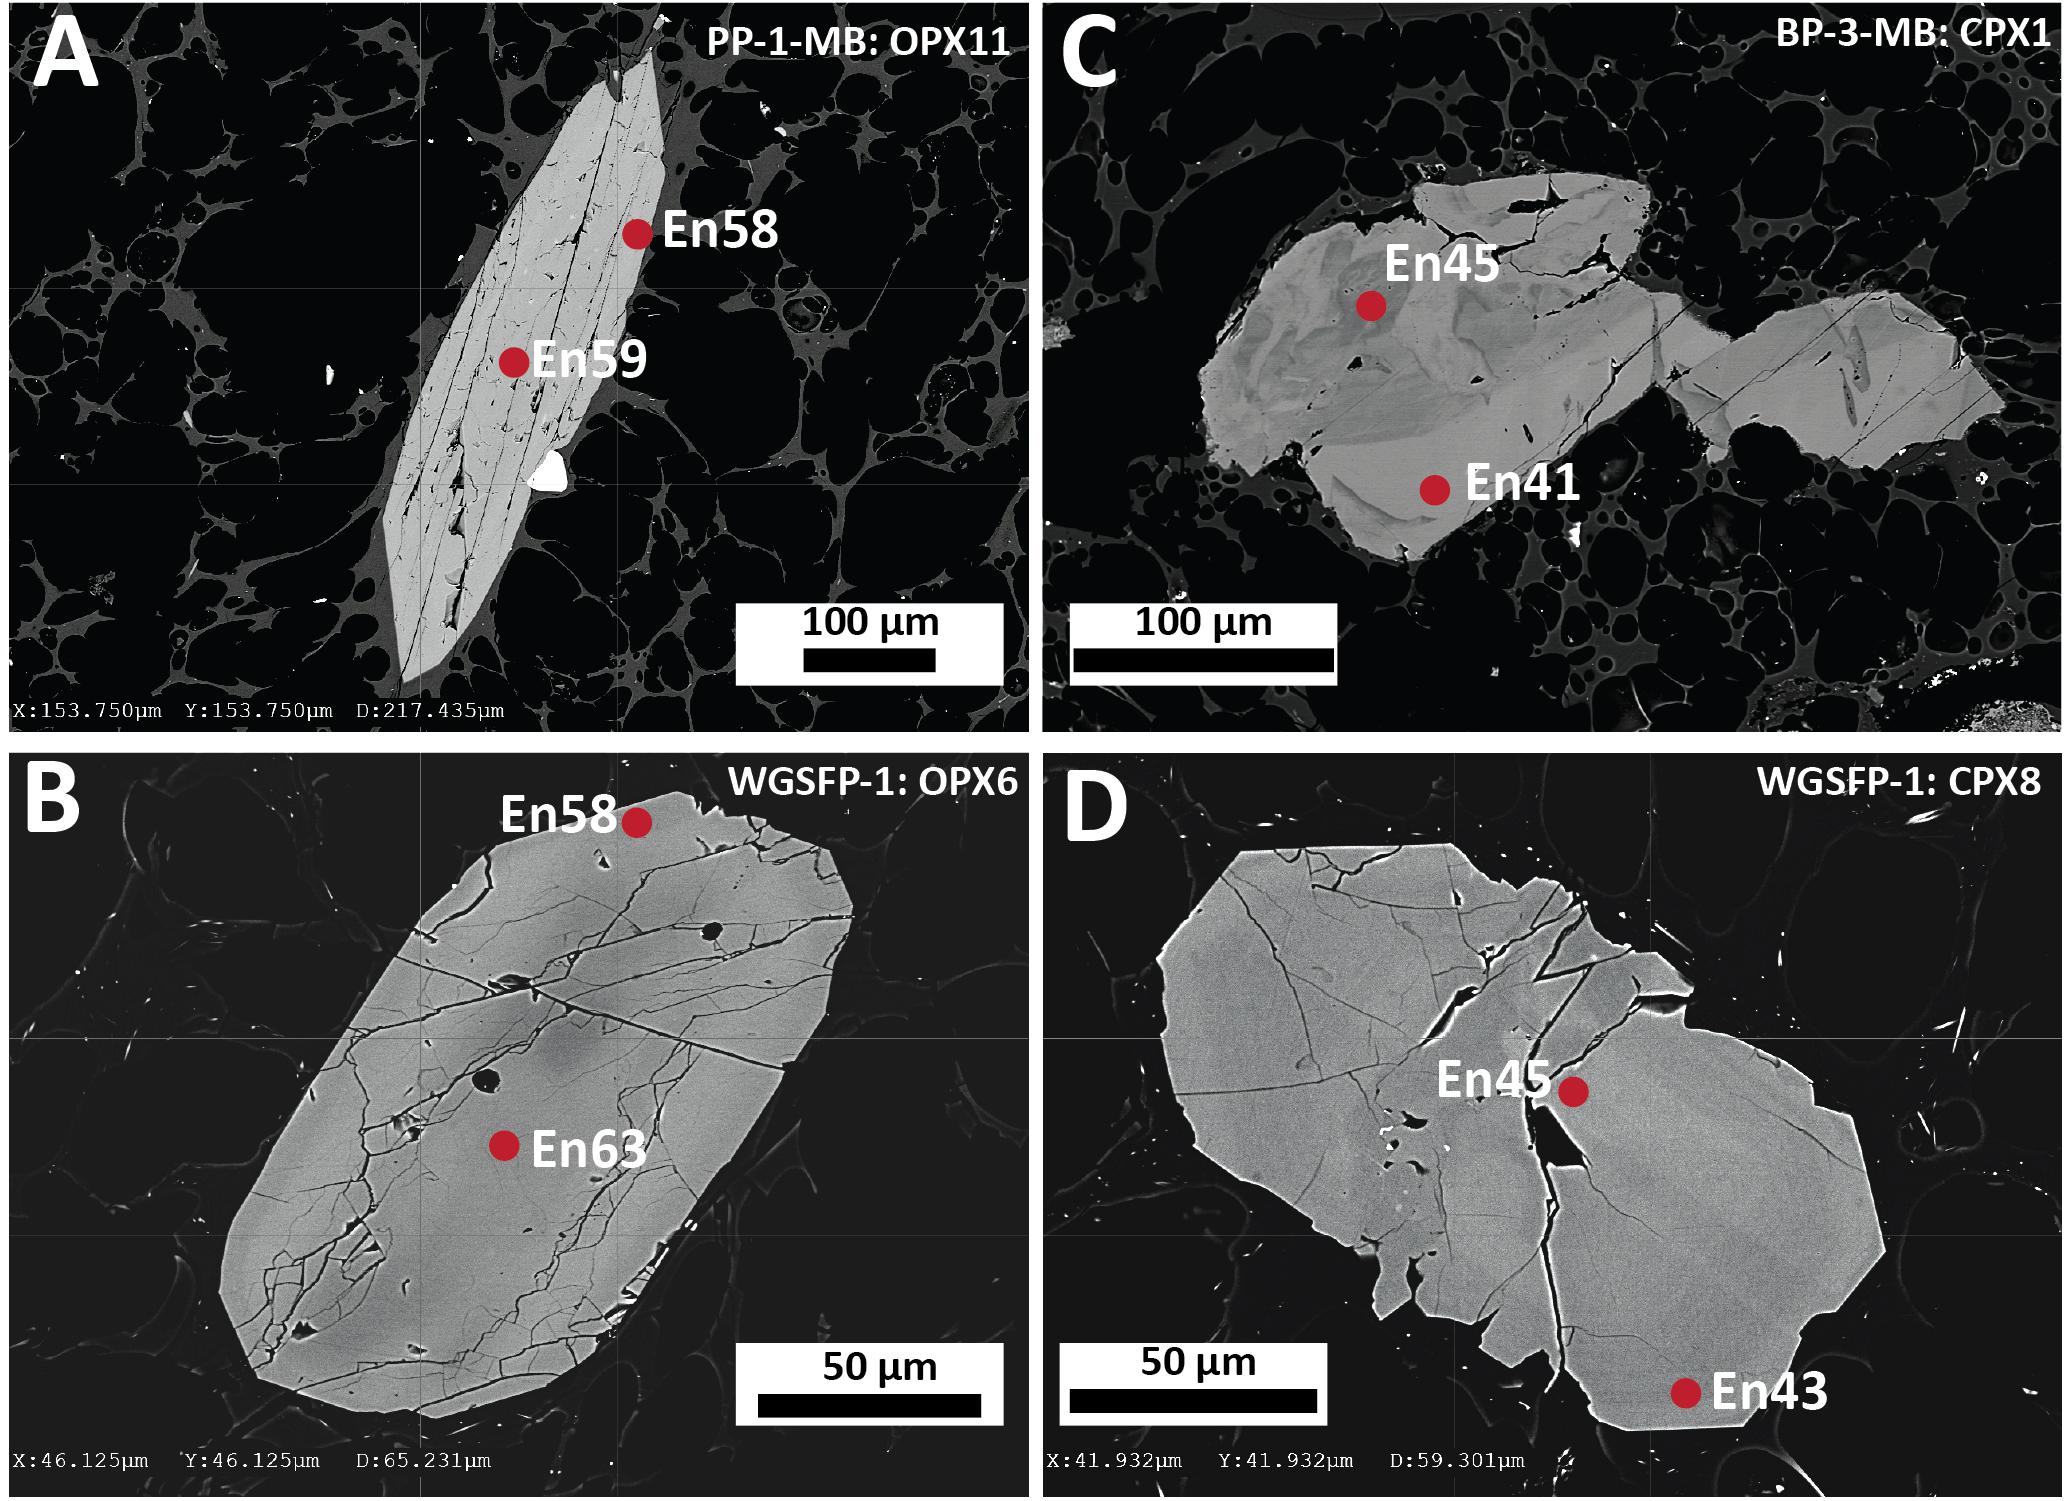
Figure 4. Representative backscattered electron images of orthopyroxene and clinopyroxene highlighting the main textural features of orthopyroxene and clinopyroxene in the Havre 2012 eruptive products. (A) Euhedral orthopyroxene phenocryst with an intergrown Fe-Ti oxide crystal from a white raft pumice sample PP-1-MB. (B) Euhedral orthopyroxene microphenocryst from a giant seafloor pumice sample WGSFP-1. (C) Subhedral clinopyroxene microphenocryst displaying a patchy zoning pattern from a banded raft pumice sample BP-2-MB. (D) Weakly subhedral clinopyroxene microphenocryst displaying faint concentric zoning and embayed rims from a giant seafloor pumice sample WGSPF-1.
End-member compositions (i.e., Wo, En, Fs) have been calculated using the Lindsley and Andersen (1983) projection scheme considering minor constituents that readily replace major cations (i.e., Ti, Cr, Al) in pyroxene. Augite compositions range from En39Fs23Wo37 to En54Fs6Wo40. However, at least two distinct compositional groups can be distinguished with most clinopyroxenes having En40–45 and a minor population at En50–55 (Figure 5). This compositional variation is observed for phenocryst core, phenocryst rim and small anhedral crystals < 200 μm, although rim compositions are mostly restricted to En40–45 (Figure 6B).
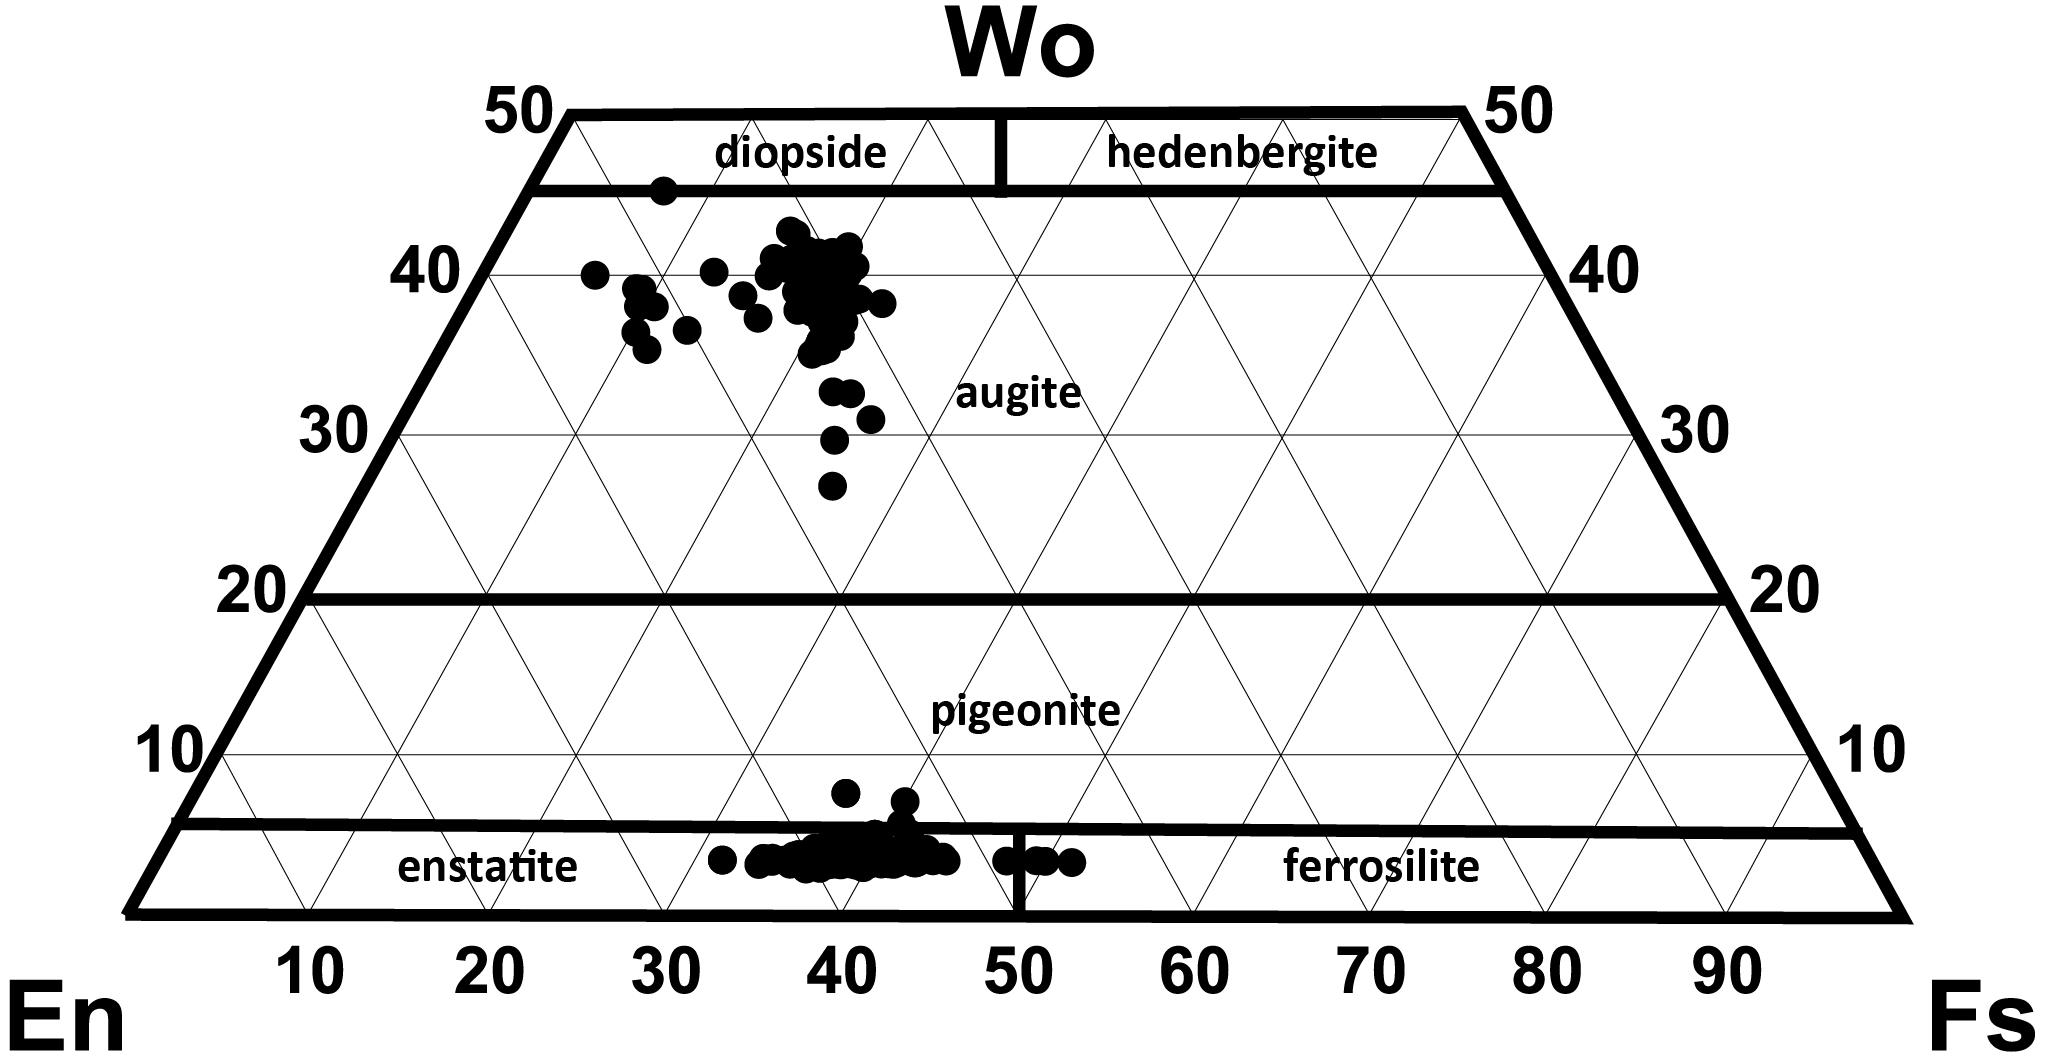
Figure 5. Pyroxene quadrilateral diagram for all orthopyroxene (n = 195) and clinopyroxene (n = 138) analyses (projection scheme of Lindsley and Andersen, 1983).
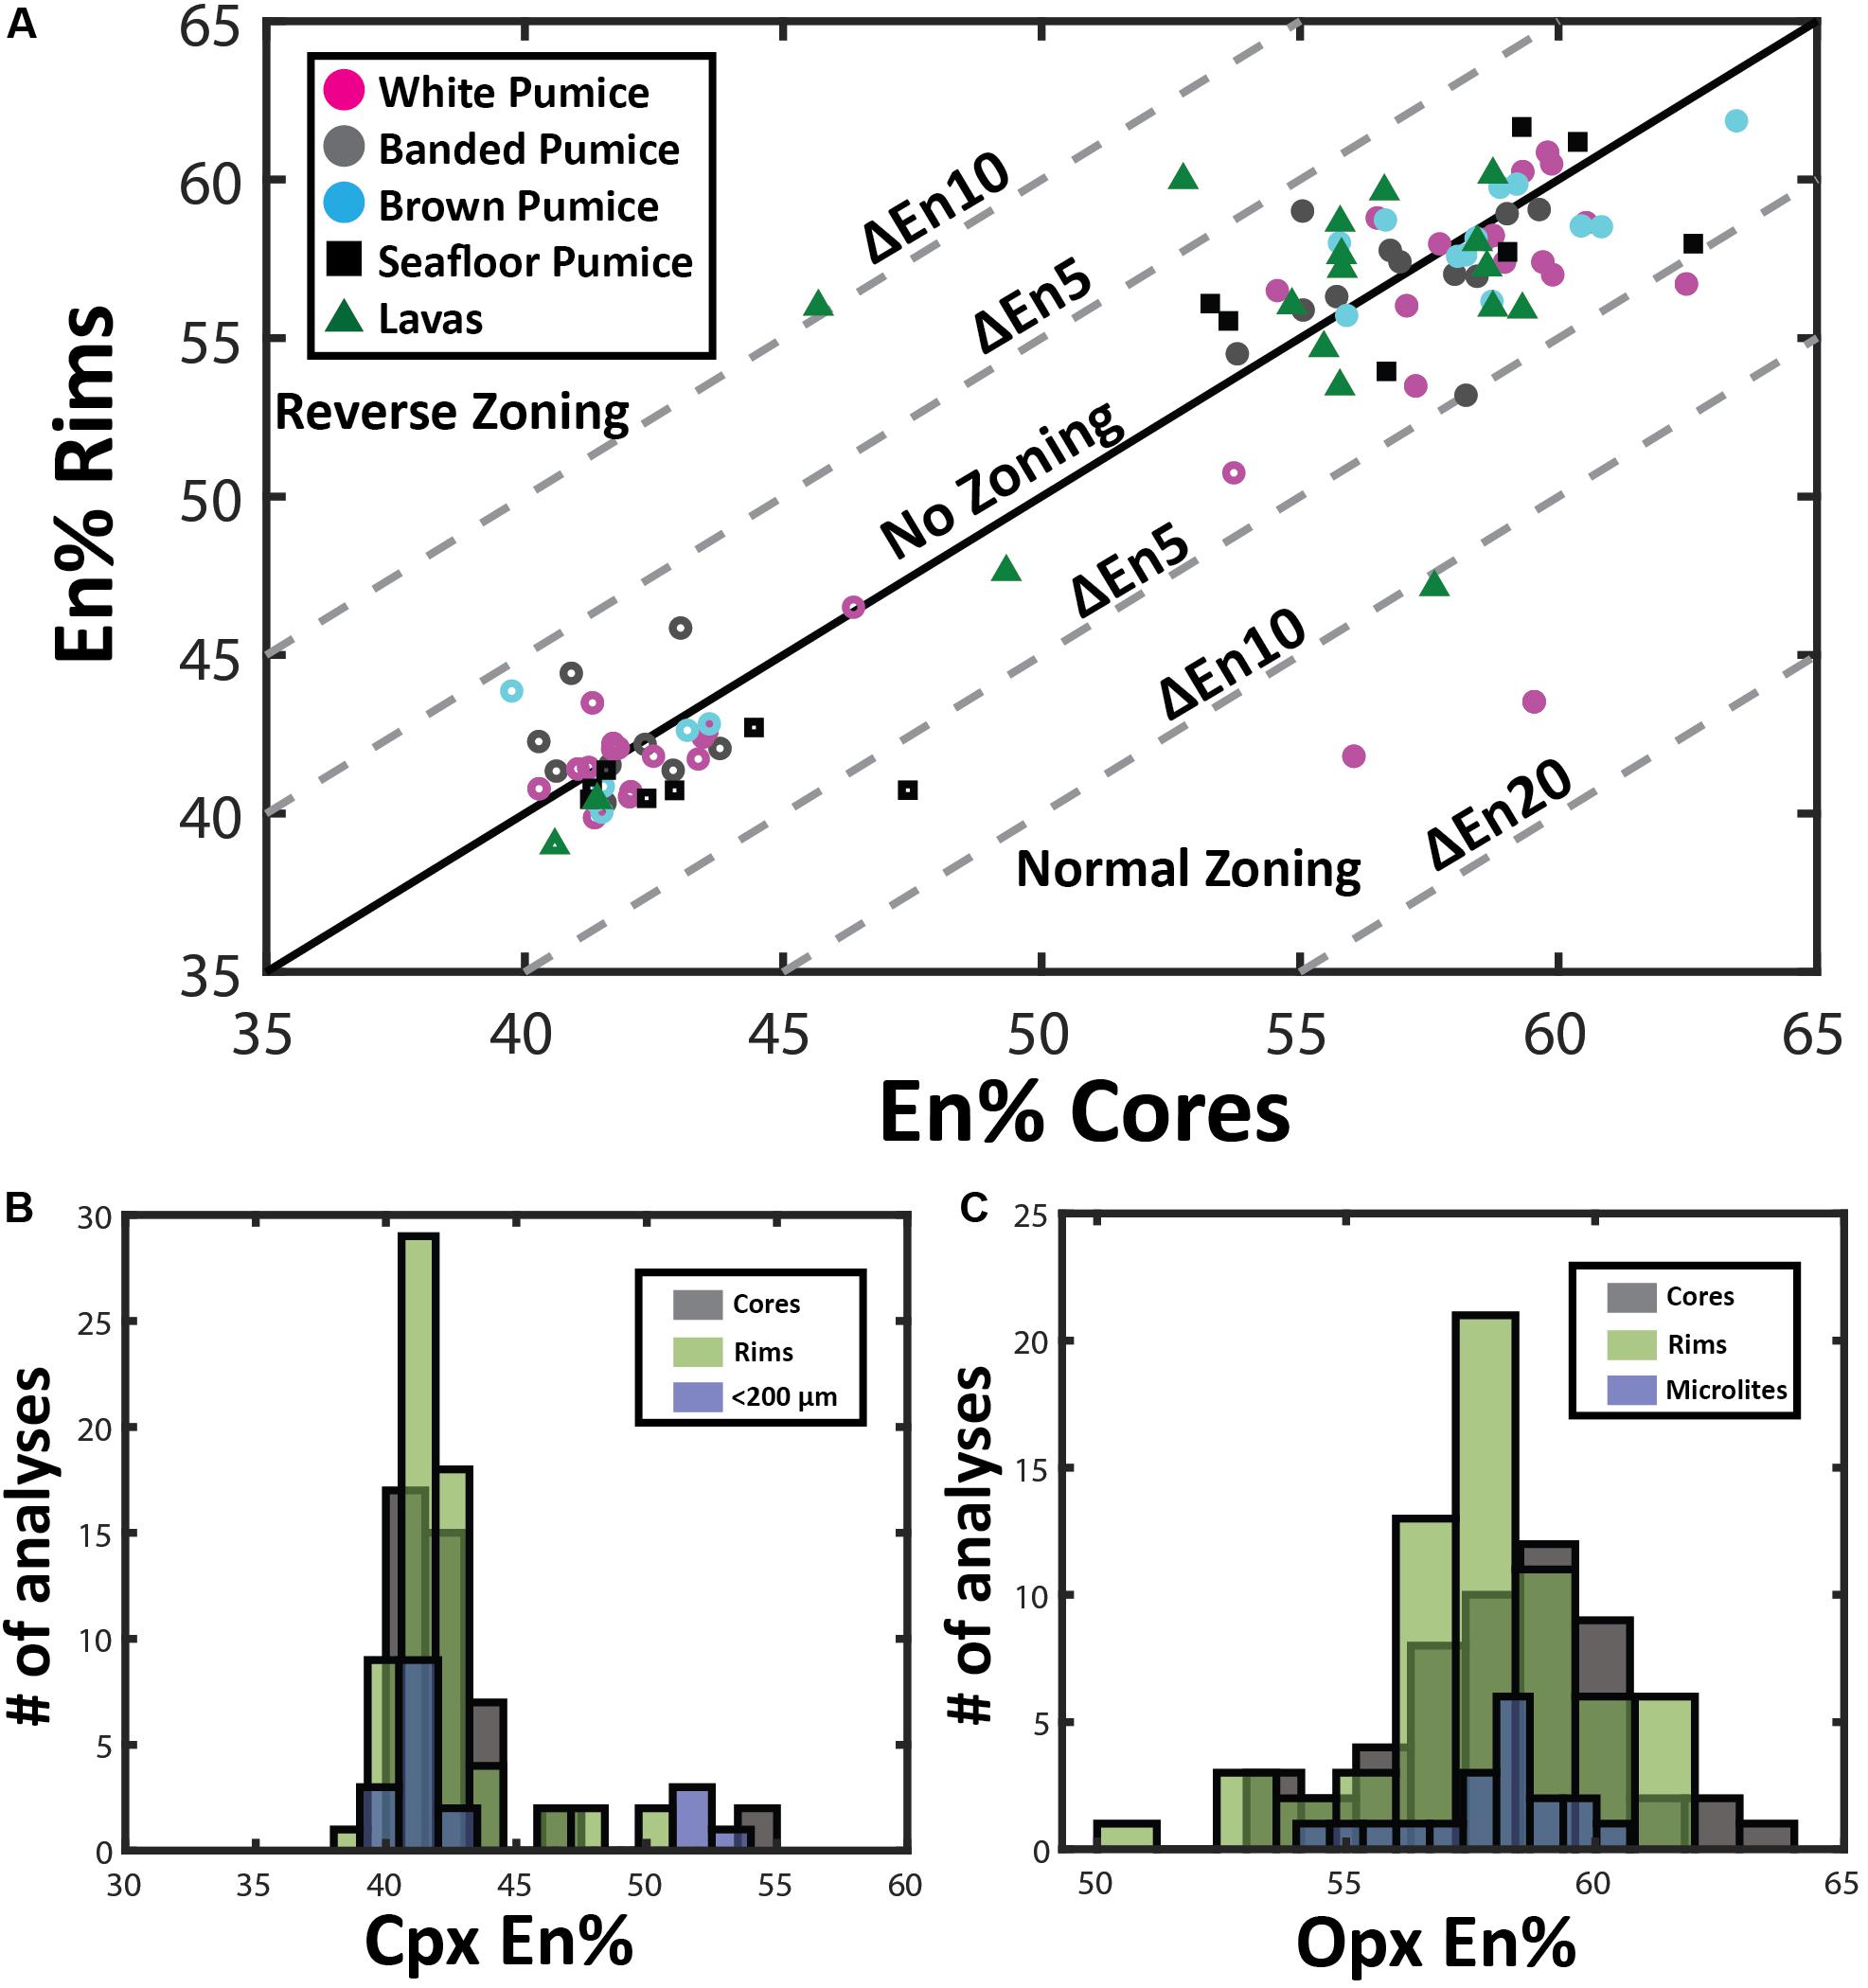
Figure 6. Pyroxene compositional variation. (A) Zoning patterns of pyroxene where core and rim analyses are plotted to illustrate growth history of individual phenocrysts discriminated by eruptive product. Pyroxene phenocrysts tend toward lower enstatite contents during fractional crystallization of rhyolite magma under closed-system conditions, resulting in normal compositional zoning. Open symbols are clinopyroxene, and filled symbols, orthopyroxene compositions. (B) and (C) Histograms comparing microlite compositions with pyroxene rim and core compositions in clinopyroxene (B) and orthopyroxene (C).
Orthopyroxene compositions range from En53Fs44Wo3 to En63Fs34Wo3 and can be classified as enstatite with minimal wollastonite content (< Wo5). In contrast to clinopyroxene, orthopyroxene has a much more uniform composition with little variation in mean En values (∼En42–43) observed from core to rim, as well as between phenocrysts and microlites (Figure 6C). In contrast to plagioclase, both clinopyroxene and orthopyroxene show very subtle to no compositional zonation with most crystals exhibiting < En5 variation between core and rim (Figure 6A). This is consistent with only faint traces of zonation visible in SEM backscatter images (Figure 4) and elemental maps (Figures 7, 8).
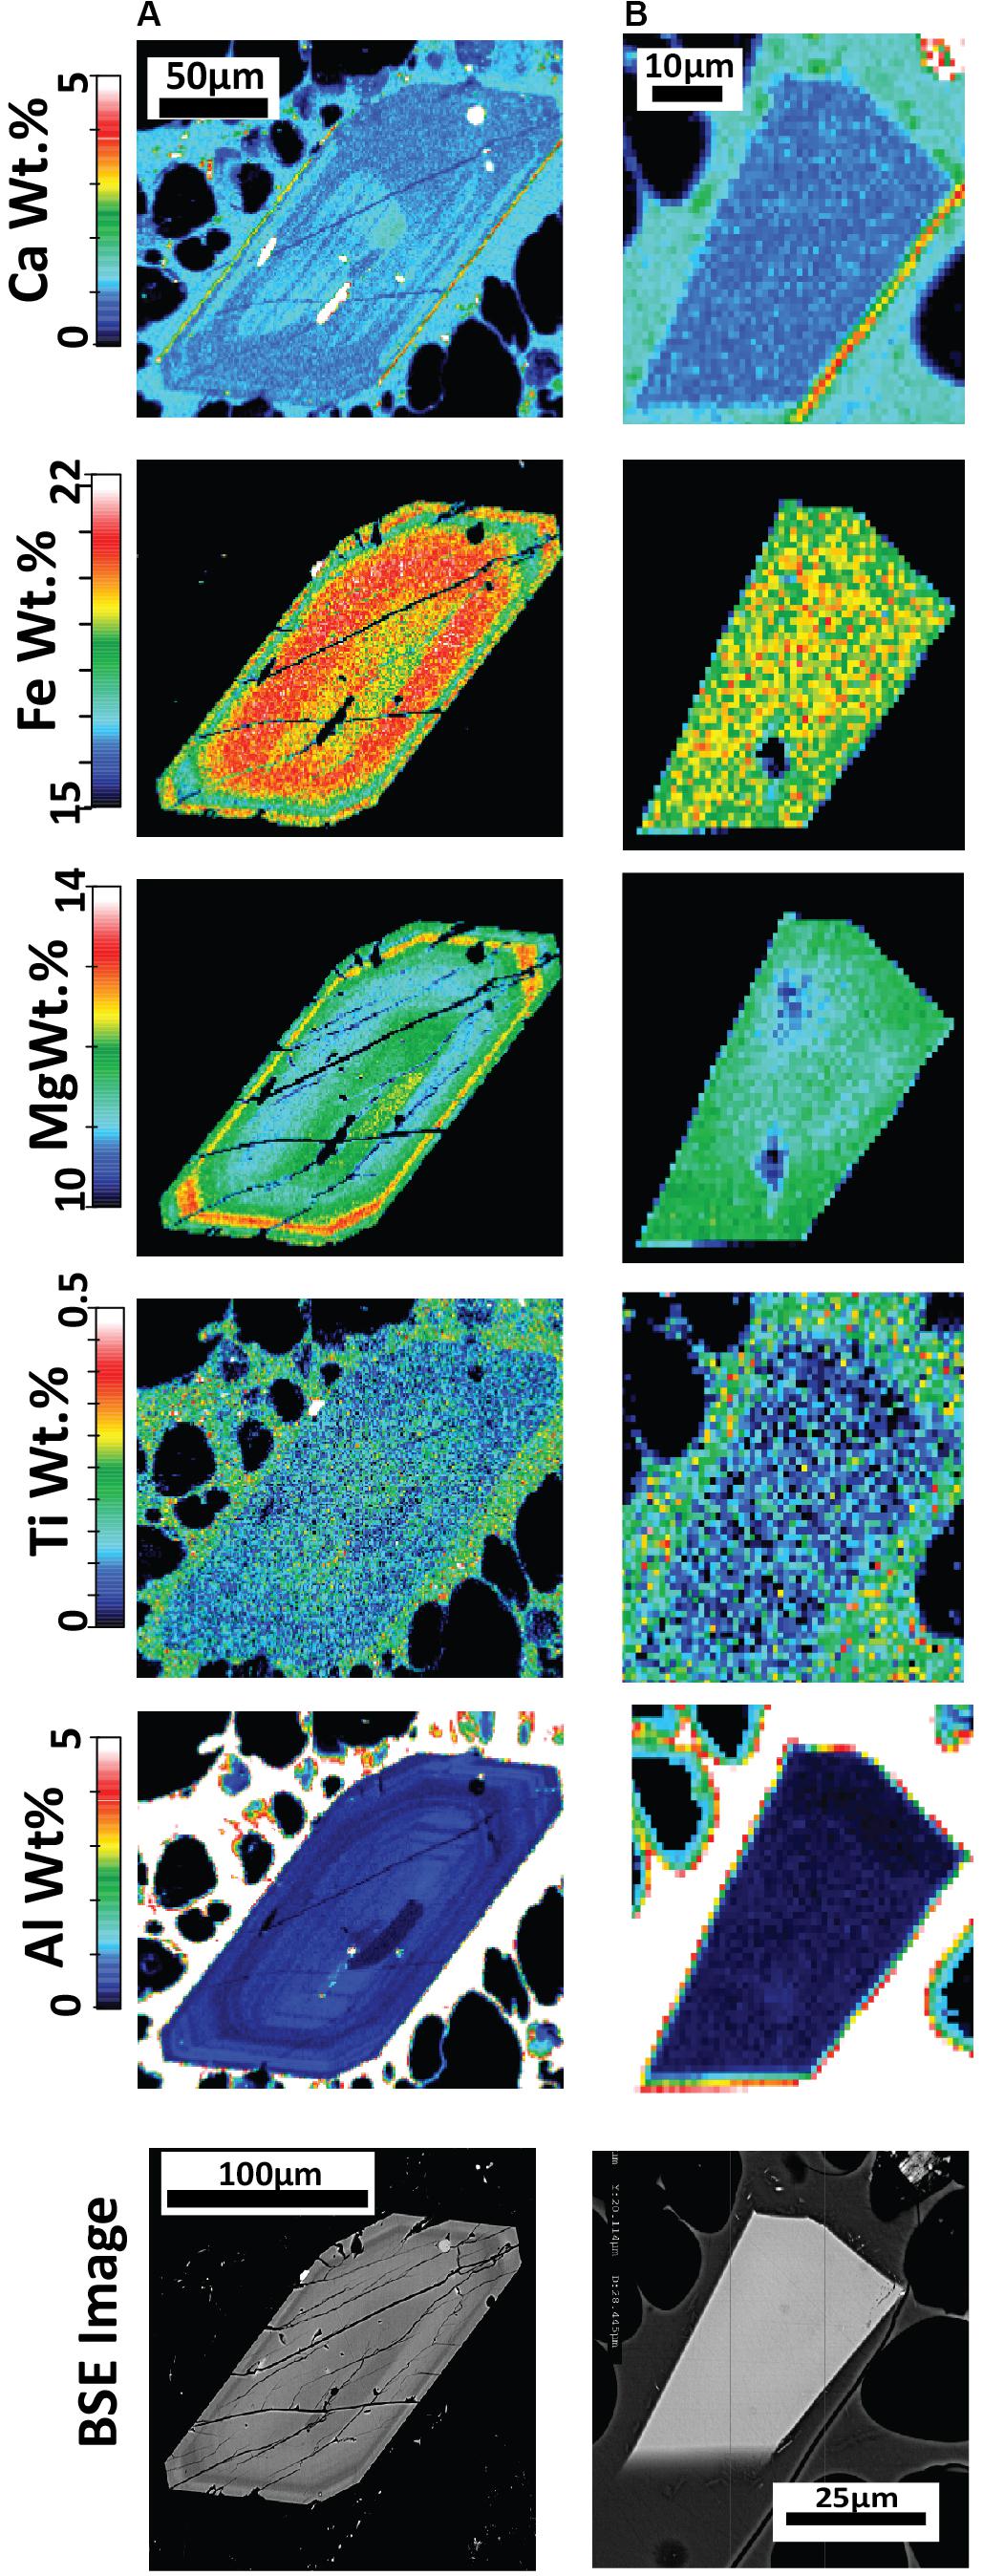
Figure 7. Quantitative major element compositional maps acquired byEPMA for orthopyroxene (A,B) with corresponding backscattered electron (BSE) images from pumice raft samples. The maps represent background-corrected, fully quantitative analytical results acquired at 10 kV accelerating voltage with a 1 um step size and spatial resolution and are semiquantitative for the surrounding glass groundmass. (A) Orthopyroxene with concentric zoning from banded pumice sample BP-53-BB; (B) A homogeneous orthopyroxene microlite from white raft pumice sample WP-1-HI. The elemental maps reveal an overlap in composition between the microlites and phenocryst/microphenocryst rims, such as in (A).
Figure 8. Quantitative elemental compositional maps acquired by EPMA for low-En augite (A,B) and high-En augite (C,D) with corresponding backscattered electron (BSE) images from pumice raft samples. The maps represent background-corrected, fully quantitative analytical results acquired at 10 kV accelerating voltage with a 1um step size and spatial resolution and are semiquantitative for the surrounding glass groundmass. (A) Clinopyroxene with an embayed rim displaying slight reverse zoning; banded pumice sample BP-53-BB. (B) Clinopyroxene with near homogenous composition from giant seafloor pumice sample GSFP-2 (C) A clinopyroxene microphenocryst displaying sector zoning from white raft pumice sample WP-1-HI; (D) Resorbed clinopyroxene with Fe-Ti oxide inclusions from giant seafloor pumice sample GSFP-2.
Pyroxene elemental maps are used in this study to assess several aspects of the magmatic history of the 2012 Havre eruption. First, the zoning patterns for enstatite and augite can provide valuable records of the magmatic history because elemental diffusion is relatively slow (Costa and Morgan, 2011; Müller et al., 2013) thereby preserving a more protracted record (e.g., Ubide and Kamber, 2018). Second, pyroxene is present across much of the spectrum of magma compositions erupted in the Tonga-Kermadec arc (e.g., Haase et al., 2002; Wright et al., 2006; Smith et al., 2010) and can crystallize across the entire crustal column at varying pressures, temperatures, and water contents (Putirka, 2008). Third, the zoning patterns of enstatite and augite are compared to see if they record similar zonation patterns and thus record similar magmatic conditions and histories indicating their co-existence during crystallization.
Orthopyroxene elemental EPMA mapping (Figure 7) indicates many enstatite minerals are generally unzoned, consistent with evidence from EPMA spot analysis and core-rim relationships (Figure 6A). Some orthopyroxene was found to exhibit concentric zoning with some oscillations in Fe+2 and Mg2+ (Figure 7A). Where significant zoning was observed (e.g., Figure 7A), rim compositions overlap compositions of the euhedral microlites (Figure 7B).
New element maps for clinopyroxene confirm the presence of two compositionally distinct populations in terms of Fe-Mg content (Figures 8A,B). The low-En augite exhibits subtle zonation where the outer crystal boundary truncates compositional bands. The high-En augite shows strikingly different compositional zonation patterns and crystal forms (Figures 8C,D). The majority of the high-En augite are enriched in Mg and Al but are enveloped by a thin, relatively Fe-, Ti-rich and Al-poor rim, and where sector zoning is also present (Figure 8C). The sector zoned augite follows similar enrichment and depletion trends in the hourglass to prism sectors as observed in Mount Etna clinopyroxene where increased Al+3 is considered to record increasing degrees of undercooling (Ubide et al., 2019). The small (< 100 μm), slightly more Ca-rich augite exhibits strongly embayed forms (Figure 8D) and contrast with the euhedral shape of equivalent-sized orthopyroxene microlites. Cr in clinopyroxene follows sector zoning where present (Figure 8C) as well as concentric oscillatory zoning, primarily in the mantle of the crystal, independent of hourglass and prism zoning. However, in general, both the low- and high-En augites contain relatively low Cr contents and lack Cr-rich zones indicating augite growth has largely occurred in the absence of new injections of basaltic magma directly into the Havre rhyolite magma chamber (Streck, 2008; Ubide et al., 2019).
Small, euhedral titanomagnetite and ilmenite grains (Figures 9C,D) are often incorporated as inclusions in pyroxene, plagioclase and also occur in glomerocrysts. Both Fe-Ti oxide minerals are found in all pumice textural types, although ilmenite appears to be more abundant in the giant seafloor pumice and is least abundant in the white raft pumice. Overall, Fe-Ti oxide modal abundance (Table 2) is lowest in the white raft pumice (∼0.5 wt%), slightly higher in banded and giant seafloor pumice (∼0.7%) and highest in the Havre lavas (∼1.2%). Fe-Ti oxide microlites and nanolites are observed frequently throughout all eruptive products with banded and seafloor pumice containing the greatest density of Fe-oxide microlites (see glass domains in Figure 9).
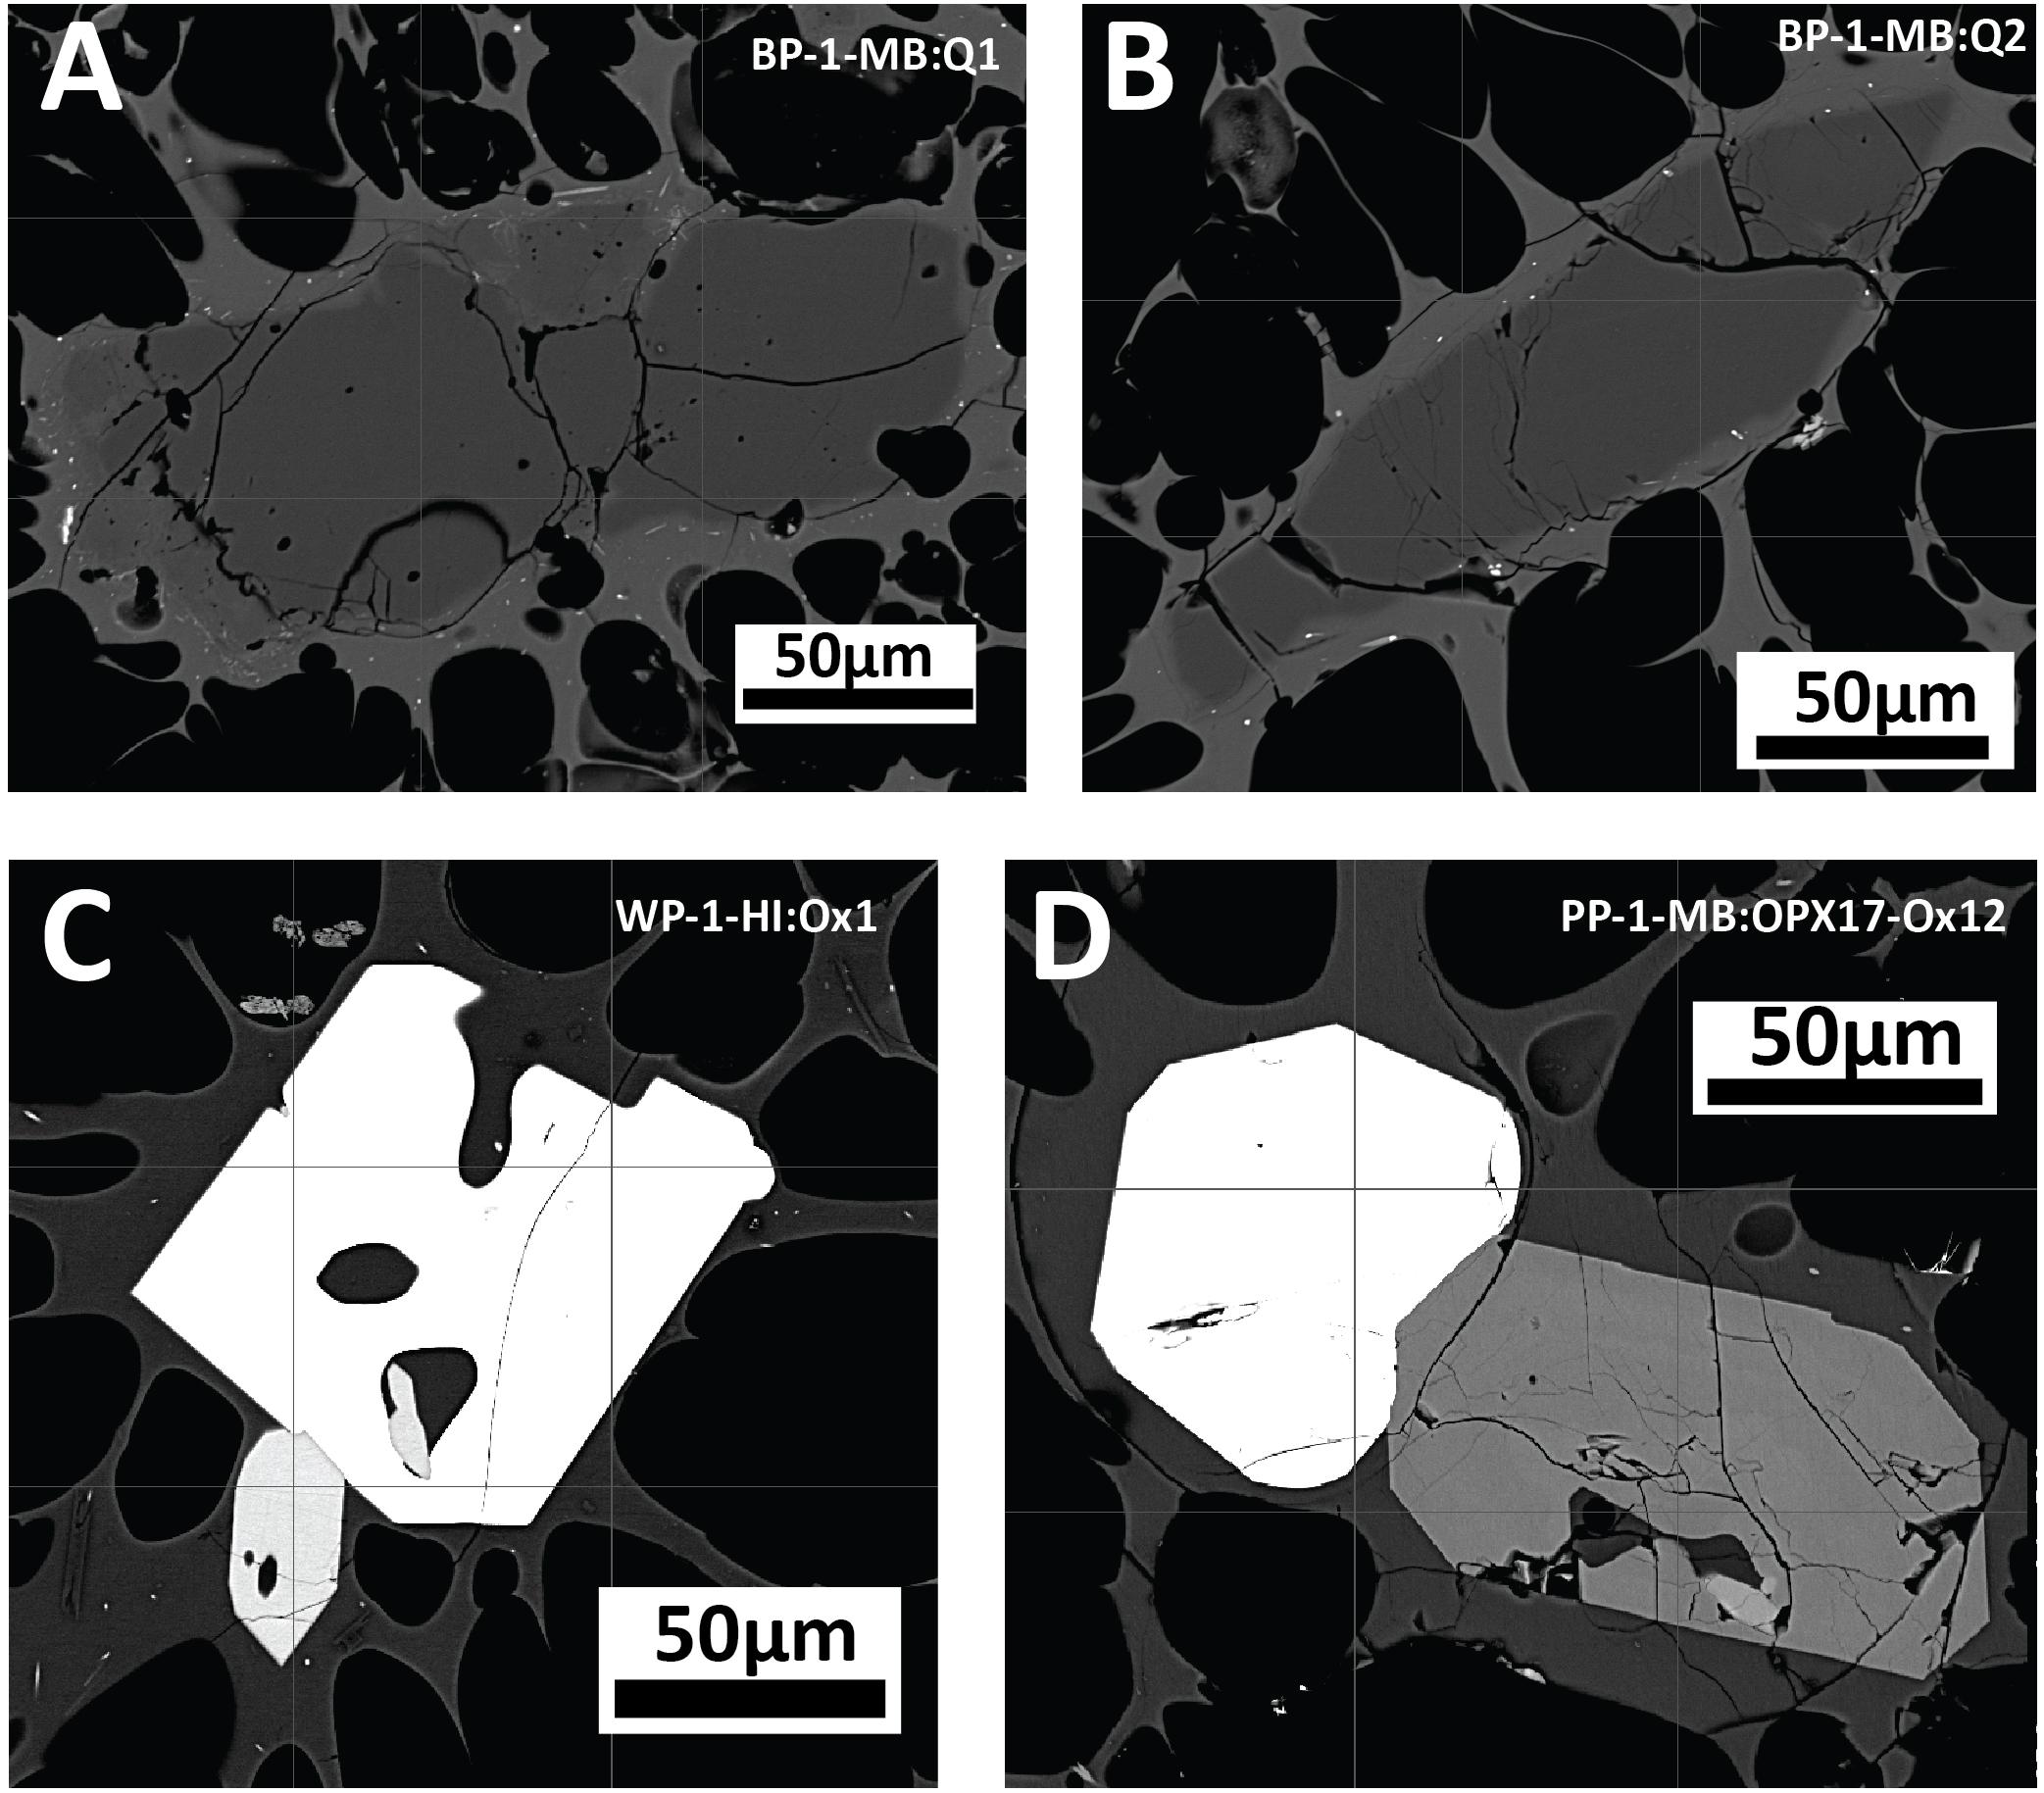
Figure 9. Backscatter images of accessory phases of anhedral quartz (A,B) in banded pumice sample BP-1-MB, and Fe-Ti oxides and orthopyroxene intergrowths displaying euhedral crystal faces (C,D) in white pumice raft samples WP-1-HI and PP-1-MB.
Ulvospinel solid-solution cation proportions are estimated following the method of Carmichael and Nicholls (1967). Cation proportions are then used to estimate Mol% of Usp in titanomagnetite and Mol% of Ilmenite-Hematite (Ilm-Hmt) following calculations from Lindsley and Spencer (1982). Titanomagnetite ranges from Usp35 to Usp38, whereas ilmenite shows a restricted compositional range (Ilm86–89). The Fe-Ti oxides have moderate enrichments in minor elements with ∼1.9 to 2 wt% Al2O3 and ∼1.36 to 1.5 wt% MgO. No compositional differences in Fe-Ti oxide compositions are apparent between the different erupted products.
Trace amounts of quartz (< 1%) have previously been reported from the giant seafloor pumice and some raft pumice (Carey et al., 2018). In a more extensive analysis of the raft pumice in this study, only trace amounts of quartz (∼0.1%) have been observed in the banded raft pumice, and quartz has not been observed in the volumetrically dominant white and volumetrically minor brown pumice types (Table 1). Where quartz is present, it is small (< 200 μm), has anhedral forms and shows evidence of some resorption (Figures 9A,B). Apatite has so far only been observed as 1–20 μm inclusions in orthopyroxene, and Ikegami et al. (2018) also reported apatite being present in the rhyolite lavas and domes. Rare, euhedral to subhedral grains of pyrrhotite are observed but appear restricted to the white raft pumice.
The observed phenocryst/microphenocryst assemblage permits the application of a number of geothermometers and geobarometers to constrain pre-eruptive magmatic temperatures, pressures of crystallization as well as fO2 and water concentrations. A previous temperature estimate of 850 ± 20°C for the Havre rhyolite magma was given by Manga et al. (2018a), and this was based on the clinopyroxene-orthopyroxene Fe–Mg exchange geothermometer (Putirka, 2008), but was reported without mineral chemistry data or equilibrium tests. Therefore, previous Havre 2012 clinopyroxene-orthopyroxene temperature estimates have assumed the two pyroxenes are in equilibrium and co-crystallized from the Havre rhyolite melt prior to eruption.
Based on the observed mineralogy, we use and compare the following geothermometers to constrain pre-eruptive magmatic temperatures: (1) plagioclase-melt geothermometer of Putirka (2005); (2) paired clinopyroxene-orthopyroxene as well as orthopyroxene-melt and clinopyroxene-melt geothermometers of Putirka (2008); and (3) compositions of coexisting Fe–Ti oxides (Carmichael and Nicholls, 1967) for ilmenite-magnetite geothermometry (Lepage, 2003) and fO2 (Spencer and Lindsley, 1981). Pressure estimates are also obtainable using plagioclase- and orthopyroxene-melt compositions and assuming an initial magmatic water content of 5.8 wt% determined from plagioclase-hosted melt inclusions from giant seafloor pumice (Manga et al., 2018a). Titanomagnetite–ilmenite pairs were checked for Mg/Mn equilibrium (Bacon and Hirschmann, 1988), ‘Rhodes diagrams’ for clinopyroxene-orthopyroxene pairs (Rhodes et al., 1979), and plagioclase-melt using KD(Ab-An)plag–liq exchange (Putirka, 2005) to give confidence to temperature estimates.
The Fe–Ti oxide temperature estimates are thought to approximate those when the titanomagnetite–ilmenite–liquid equilibrium was quenched by the eruption (e.g., Bryan et al., 2002). Although titanomagnetite and ilmenite are not observed as touching pairs, they are observed to be present within the same thin section and pumice clast. Therefore ilmenite-titanomagnetite compositions analyzed from the same thin section are inputted into Eq.17 and Eq.18 from Spencer and Lindsley (1981) to estimate temperatures, and oxygen fugacity, respectively. The Mg/Mn ratios of ilmenite-magnetite pairs fall within the error range of the Mg/Mn plot (Bacon and Hirschmann, 1988), confirming equilibrium between the coexisting oxide phases in the Havre rhyolite melt (Supplementary Material 3). Temperature and fO2 estimates using equations 17 and 18 of Spencer and Lindsley (1981) give a temperature range of 871–915°C and an oxygen fugacity of 0.307–0.533 above the NNO (nickel–nickel oxide) buffer.
The KD(Ab-An)plag–liq exchange between a plagioclase crystal and melt will be 0.1 ± 0.05 for crystals in equilibrium at temperatures < 1050°C (Putirka, 2005). According to the KD(Ab-An)plag–liq between plagioclase and the melt, all plagioclase rim and microlite compositions are in chemical equilibrium with the whole-pumice chemistry, whereas core compositions > An53 are out of equilibrium, which is consistent with textural observations of resorption of high-An core domains in the plagioclase (Figure 2). Plagioclase crystallization temperatures are calculated using Eq.26 of Putirka (2005), which uses the plagioclase and corresponding whole-pumice chemistry, and the water content of 5.8 wt.% (Manga et al., 2018a) to take into account the effect water will have on the plagioclase crystallization temperature (± 37°C uncertainty). Based on the available compositions, the-plagioclase-melt geothermometer yielded a temperature range from 877 to 909°C (1 s.d. = 5.6°C) and a mean of 890 ± 37°C.
Crystallization depths can be estimated using Equation 25a of Putirka (2005), which considers the effect of water on the pressure or crystallization depth of plagioclase. The plagioclase-melt geobarometer yields pressures ranging from 0.7 to 5.5 kbars (mean of 2.64 kbars, equivalent to 9.8 km depth). The resulting pressures are taken cautiously as the errors are significant (± 3.8 kbars). However, the majority of geobarometer estimates are between 2 and 4 kbars.
The two-pyroxene geothermometer has previously been used to constrain a magmatic temperature of 850°C for the 2012 Havre eruption (Manga et al., 2018a). The geothermometer is ideal for estimating pre-eruptive temperatures of a melt when both mineral phases are touching or in very close proximity and can be shown to be in chemical equilibrium with each other and the surrounding melt (Putirka, 2008). Equilibrium tests (Figures 10, 11A) were undertaken for augite and enstatite compositions following the method of Rhodes et al. (1979), which revealed the augite to not be in equilibrium with both the melt composition and co-existing enstatite in the same pumice samples. Orthopyroxene-clinopyroxene pairs that are in equilibrium have KD (Fe-Mg)opx–cpx values between 1.09 ± 0.14. However, the orthopyroxene and clinopyroxene phases present in all the Havre pumice show a range in KD (Fe-Mg)opx–cpx from 0.6 to 0.89 (Supplementary Excel File). When a clinopyroxene crystal is in chemical equilibrium with the surrounding melt, the KD(Fe-Mg)cpx–liq will be 0.27 ± 0.3 (Putirka, 2008). The ‘Rhodes diagram’ helps illustrate this disequilibrium (Figure 10A), which plots the Mg number of clinopyroxene vs the Mg number of the melt constrained from whole-pumice chemistry, and is subsequently compared with KD(Fe-Mg)cpx–liquid values (0.27 ± 0.3) determined experimentally (Rhodes et al., 1979). The Mg number of Havre augite ranges from 62 to 85, much higher than predicted from the host melt composition, and thus almost all Havre augite plot outside the equilibrium field. A comparison of the predicted vs observed Diopside-Hedenbergite (DiHd; Putirka et al., 1996; Mollo et al., 2013) and EnFs (Putirka, 1999) components of the augite (Figures 10B,C) further support the conclusion that the clinopyroxene is an out of equilibrium phase in the Havre melt. Consequently, we have not pursued temperature estimates based on augite compositions using Putirka (2008).
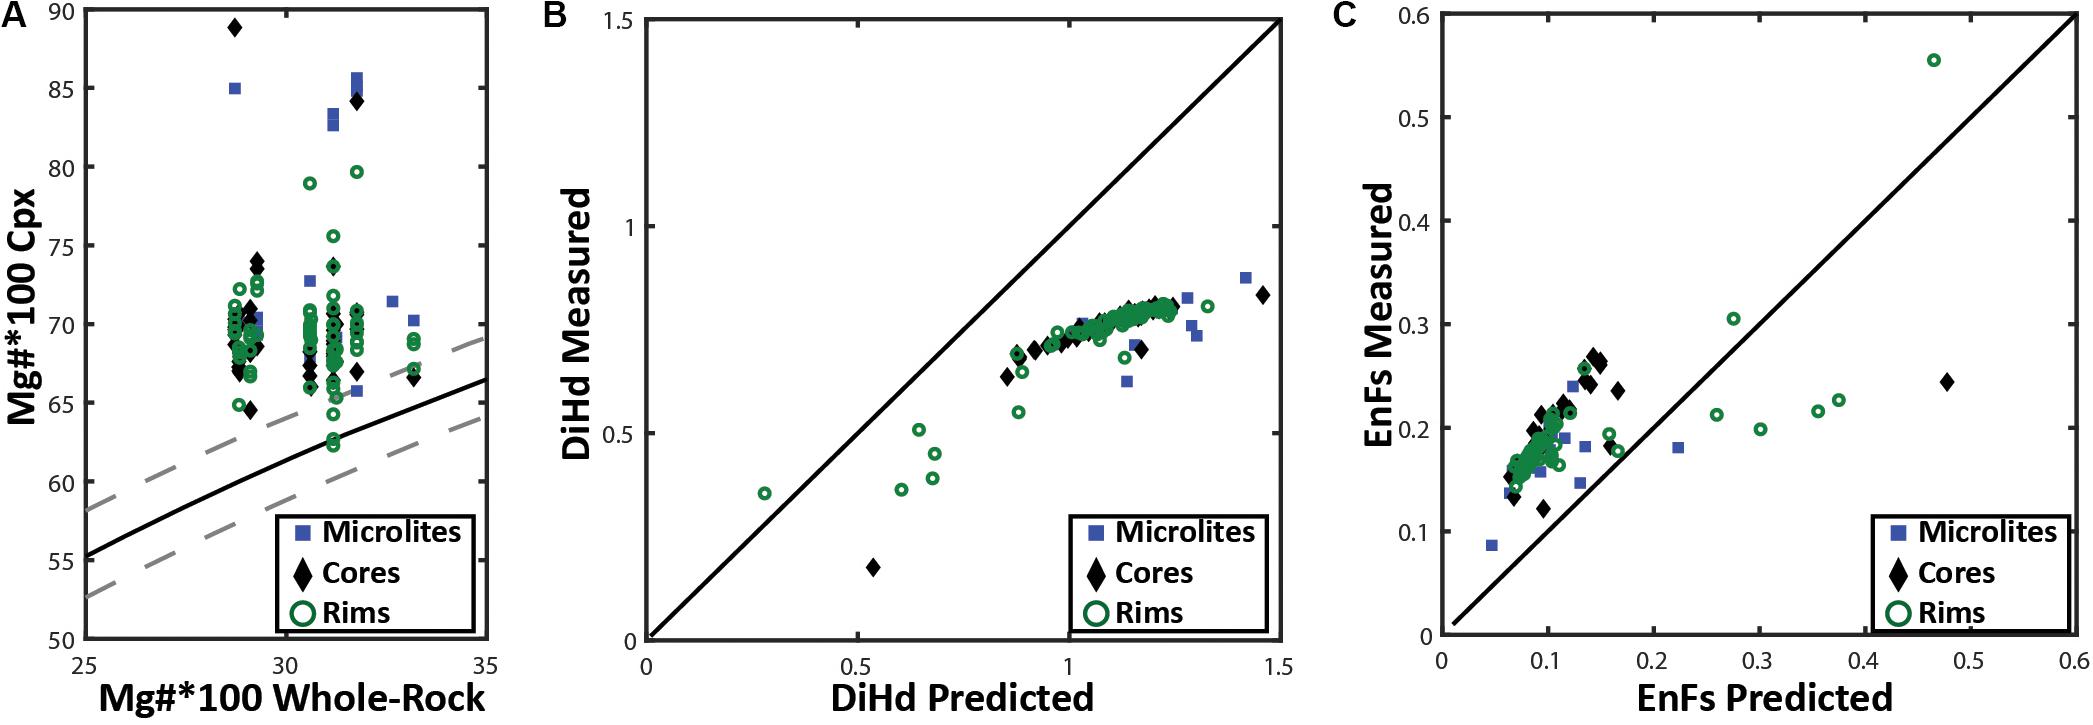
Figure 10. (A) | Rhodes diagram following Rhodes et al. (1979) for clinopyroxene- whole rock chemistry distinguished by analysis location. The X-axis is the 100*Mg# of whole rock and the Y-axis represents the 100*Mg# of a corresponding clinopyroxene crystal. The solid black line is the ideal KD(Fe-Mg)cpx–liquid for chemical equilibrium (0.26), where the dashed lines on either side of this line represent possible KD(Fe-Mg)cpx–liquid range from 0.23 to 0.29 that is acceptable for clinopyroxene to be considered to be in chemical equilibrium with the whole rock/melt chemistry. (B) Plotting the predicted vs measured DiHd (Diopside-Hedenbergite) and (C) EnFs (Ferrosilite-Enstatite) clinopyroxene components as a secondary test for clinopyroxene-melt equilibrium. Here DiHd observed and predicted components are calculated by using the normative scheme from Putirka et al. (1996), Mollo et al. (2013) and Eq.3.1a (Putirka, 1999), respectively. The black line in (B) and (C) defines a 1-1 line between the measured and predicted clinopyroxene components; plotting further away from this line indicates the clinopyroxene is less likely to be in equilibrium with the melt.
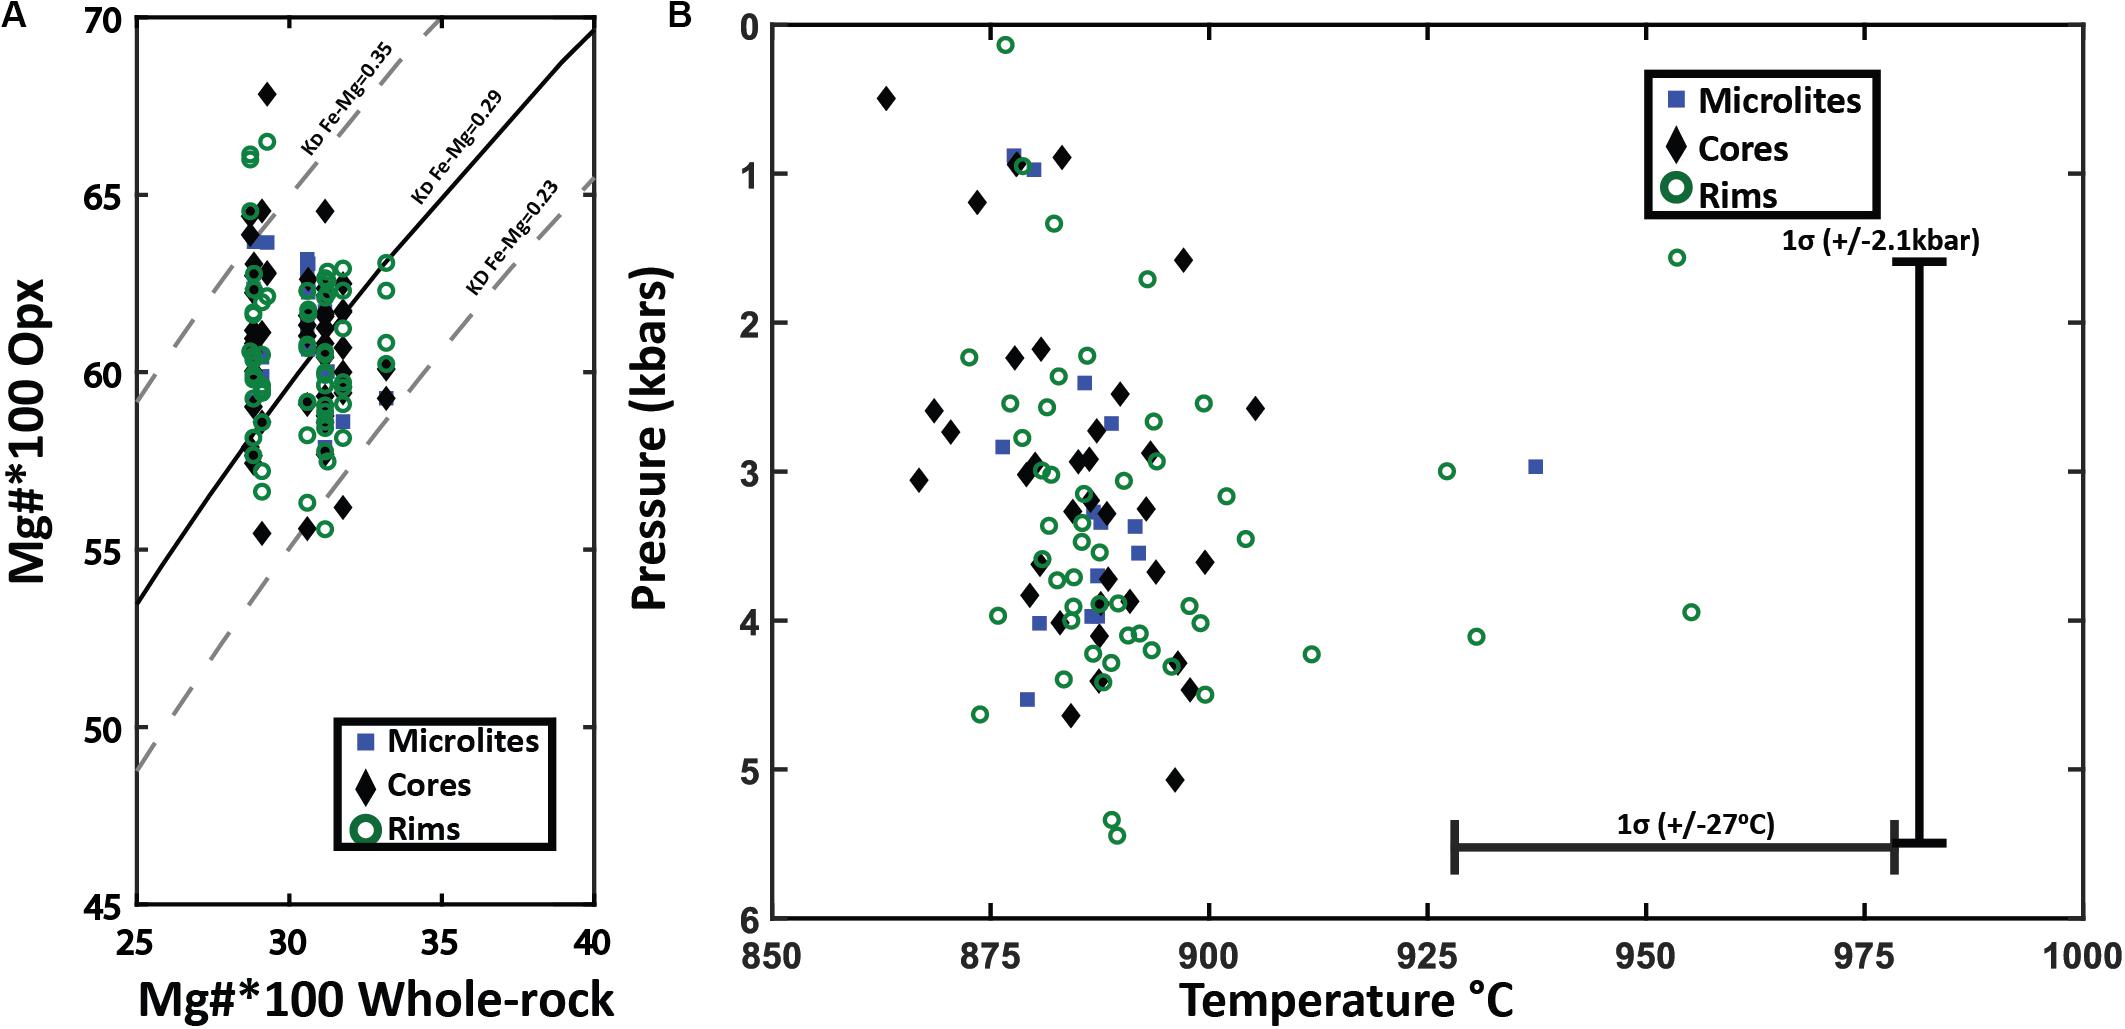
Figure 11. Orthopyroxene-whole pumice/melt equilibrium test and thermobarometry. (A) Fe-Mg chemical equilibrium test between analyzed orthopyroxene and whole pumice chemistry for Havre raft pumice. Rhodes diagram (Rhodes et al., 1979) for orthopyroxene-whole pumice chemistry for all orthopyroxene crystals plotted by analysis location. The X-axis is the 100*Mg# = (Mg/Mg + Fe)*100 of the whole pumice and the Y-axis is the corresponding 100*Mg# for an orthopyroxene crystal. The solid black line is the ideal KD(Fe-Mg)Opx–liquid for chemical equilibrium (0.29), where the dashed lines on either side represent the range of KD(Fe-Mg)Opx–liquid from 0.23 to 0.35 that indicate chemical equilibrium with the melt chemistry. (B) Orthopyroxene-whole rock/melt thermobarometry plotted by analysis spot location. Orthopyroxene chemistry and corresponding whole-rock XRF chemistry are inputted into Putirka, 2008 Eq.28a to yield temperature estimates (± 27°C uncertainty) with a magmatic water content of 5.8 wt.% H2O. Temperature estimates are then used in Eq.29b of Putirka (2008) to calculate pressures (± 2.1 kbars uncertainty).
The enstatite was similarly assessed for equilibrium with the Havre melt composition. The KD(Fe-Mg) Opx–liq will be 0.29 ± 0.06 if an orthopyroxene is in chemical equilibrium with the melt (Putirka, 2008). The Mg number of the Havre enstatite ranges from 53 to 67 and when plotted against Mg numbers of corresponding whole-rock/melt chemistry, almost all analyzed enstatite plots within the equilibrium field (Figure 11A). The equilibrium tests for orthopyroxene and melt chemistry, therefore, provide confidence that the Havre orthopyroxene-liquid thermobarometry equations of Putirka (2008) can be utilized to constrain pre-eruptive temperatures and pressures of the Havre magmatic system (Figure 11B). The orthopyroxene-melt geothermometer (Equation 28a of Putirka, 2008 with ± 27°C uncertainty), yielded a temperature range from 857 to 1001°C (mean temperature of 890°C). These temperature estimates are consistent with those obtained from the coexisting Fe-Ti oxide and plagioclase-melt geothermometers.
Pre-eruptive water concentrations of the Havre 2012 rhyolite have been determined previously from plagioclase-hosted melt inclusions from the giant seafloor pumice (∼5.8 ± 0.7 wt.%; Manga et al., 2018a). A subsequent study that analyzed a different set, and a larger number of melt inclusions hosted in plagioclase and quartz from both raft and giant seafloor pumice reported a slightly lower water content of 4.9 ± 0.8 wt.% for the Havre rhyolite (Manga et al., 2018b). However, the host mineral phase was not identified for each melt inclusion analysis. When the melt inclusion data for the giant seafloor pumice from the two studies are combined, the average water content is 5.4 wt.% (n = 29) and higher than the average water content reported from the raft pumice samples only (4.8 wt.%; n = 26).
In this study, Equation 25b of Putirka (2008) provides an independent assessment of water contents in the melt, and the corresponding plagioclase and melt compositions indicate pre-eruptive water contents of 5.1 to 6.2 wt.% H2O (mean of 5.6 ± 1.1 wt.% H2O). Water content in the melt has also been calculated using Waters and Lange (2015) plagioclase-melt hygrometer assuming temperatures estimated from Putirka (2005) plagioclase-melt geothermometer (∼890°C), and a pressure of 2 kbars yields slightly lower water contents of 4.5 ± 0.35 wt.%. These estimates are within error of the water concentrations measured from melt inclusions (Manga et al., 2018a, b).
As a melt evolves through crystal fractionation the water content of the melt typically increases proportionally with the degree of crystallization until water saturation is reached. The program MagmSat (following H2O-CO2 mixed fluid saturation models from Ghiorso and Gualda, 2015) is used here to estimate at what H2Omelt concentrations the Havre rhyolite would become water saturated. Inputted variables of whole-rock composition (PP-16-CU; Table 1), CO2 estimates (80 ppm) from plagioclase-hosted melt inclusions (Manga et al., 2018a), pressure (2 kbars) and temperature (890°C) are kept constant, while melt water concentrations were increased incrementally until the magmatic system reached water saturation. The Havre 2012 rhyolite becomes water saturated when the melt contains > 6.04 wt.% H2O at these conditions; consistent with H2Omelt concentration values reported here and from plagioclase-melt inclusions (Manga et al., 2018a). Water saturation criteria are sensitive to pressure, where at low pressures (1.5 kbars) the melt becomes water saturated at lower water contents (> 5.05 wt.%), and at higher pressure (3 kbars) the melt only becomes water saturated at significantly higher water concentrations (> 8.45 wt.%).
It is increasingly realized that crystal populations present in magmas are not grown solely from the host melt in which they are resident on emplacement (Jerram and Martin, 2008). In particular, arc magmas have been shown to have prolific crystal cargoes, and much of the assembly of crystals can occur in the final stages of emplacement (e.g., Kent et al., 2010; Zellmer et al., 2014). Magmas commonly have a range of crystals where a combination of textural and microgeochemical analysis can be used to distinguish different genetic origins of crystals. However, for crystal-poor rhyolites like the Havre pumice, it can be difficult to determine whether the few phenocrysts present truly represent autocrysts crystallizing from the surrounding melt, are antecrysts due to mush remobilization, or even xenocrysts derived from source materials or chamber walls, or possibly a combination of all of the above. Previous studies on the historic 2012 submarine eruption have assumed all phenocryst present are autocrystic (e.g., Manga et al., 2018a, b). Importantly then, the few crystals present are strongly relied upon to constrain pre-eruptive conditions such as magmatic temperatures, pressures, water content and fO2.
The textural and chemical characterization of the Havre mineral phases highlights some potential issues with assuming all phases are autocrystic and have co-existed and co-precipitated from the host silicic melt. Some phases are mostly euhedral (plagioclase, Fe-Ti oxides, orthopyroxene), whereas resorption, truncation of compositional banding and subhedral to anhedral shapes are evident in other phases (clinopyroxene, quartz). Geochemical tests reveal that some mineral phases are also not in equilibrium with the host melt composition (high-An plagioclase, clinopyroxene). This raises the question: what mineral phases are in or out of equilibrium with the host melt? The answer to this question will determine what mineral phases are autocrystic and can inform us on the host rhyolite melt and its conditions immediately prior to eruption, and those mineral phases that are inherited into the melt (either antecrysts or xenocrysts) and provide complementary information on the magmatic system and its architecture beneath the Havre volcano.
Plagioclase is the dominant phenocryst and microlite phase in the Havre pumice, and phenocrysts are typically euhedral in form. Phenocryst rim compositions strongly overlap with microlite compositions (andesine, An40–50). Calculated KD(An-Ab)plag–liq values between the melt and plagioclase compositions demonstrate that phenocryst and glomerocryst core compositions with > An53 are not in chemical equilibrium with the host melt. This is consistent with the rounded to resorbed boundaries of these high-An core domains to plagioclase phenocrysts (Figure 2). Consequently, the labradorite to rare bytownite plagioclase components are excluded from the autocrystic mineral assemblage of the Havre rhyolite.
Nearly all orthopyroxene crystals, including core and rim domains, and microlites, are in equilibrium with the host melt composition based on KD(Mg-Fe)opx–liq exchange between the orthopyroxene and melt (Figure 11A). This is supported by the generally euhedral shape observed for all orthopyroxene crystals. Enstatite compositions are relatively restricted and overlapping between core, rim and microlites (En55–60), and consistent with all orthopyroxene crystallization occurring from the host melt. However, subtle textural variations and the presence of relatively homogenous and unzoned to zoned phenocrysts (Figures 6A,C) suggests some orthopyroxene phenocrysts may contain inherited components that record earlier crystallization histories in the Havre magmatic system. The equilibrium tests and restricted composition suggests this earlier crystallization of orthopyroxene was from compositionally similar (i.e., silicic) magma.
Both Fe-Ti oxides are shown to be in chemical equilibrium based on the Mg/Mn partitioning test (Bacon and Hirschmann, 1988), and is consistent with their general euhedral form. Abundant, euhedral Fe-Ti oxide micro- and nanolites are also observed in the pumice glass and are particularly prevalent in the banded and giant seafloor pumice samples (e.g., Figure 2). Apatite is observed as inclusions in both orthopyroxene and clinopyroxene crystals and is typically euhedral in shape and therefore is interpreted as an early crystallizing phase in the Havre rhyolite.
Two key, and somewhat unexpected, mineral phases are identified here as not being autocrystic, and are interpreted to have been mobilized into the Havre rhyolite melt prior to eruption. The main mineral phase is augite, and a number of features are consistent with augite phenocrysts and microphenocrysts not being in equilibrium. As with plagioclase, a wider, and slightly bimodal range of compositions are observed for augite core domains (En40Fs19Wo41 to En54 Fs6Wo40). Augite is always subordinate to enstatite, and typically shows more subhedral to anhedral forms (e.g., Figure 4). Pyroxene elemental maps reveal a greater diversity of augite zonation patterns and confirm the existence of two discrete compositional populations characterized by relatively lower and higher Mg, Ca (Figure 8). All chemical equilibrium tests (i.e., KD(Fe-Mg)opx–cpx: KD(Fe-Mg)cpx–liq; predictive vs observed pyroxene components; Figure 11) further indicate the augite is not in equilibrium with the melt or co-existing enstatite and is therefore, not autocrystic.
The second mineral phase interpreted to be inherited is quartz. Given the silicic melt composition, quartz crystallization would be expected. However, quartz is rare and principally observed in the erupted products with higher phenocryst contents – the banded and giant seafloor pumice and lavas/domes (Table 2). The few quartz crystals present are small and subhedral to anhedral (Figures 9A,B). The recycled origin for quartz is examined further with Rhyolite-MELTS modeling in the following section.
To further test if the main mineralogy observed in the Havre rhyolite (i.e., plagioclase, enstatite, augite, titanomagnetite, and ilmenite ± quartz) is all autocrystic and can be produced by closed system fractional crystallization, a matrix of Rhyolite-MELTS (Gualda et al., 2012; Ghiorso and Gualda, 2015) models were calculated. Two starting compositions (see Supplementary Excel File) were used: (1) one of the Havre rhyolite raft pumice (sample PP-16-CU), and (2) a low-K dacite lava collected prior to the 2012 eruption from the flanks of Havre volcano (Dredge Sample 47-03 from Wright et al., 2006; Figure 1B). The later sample is chosen as a parental composition given it is less evolved and derived from the same magma system as the eruptive material from the Havre 2012 eruption.
All Rhyolite-MELTS models are calculated at fO2 = NNO (or QFM + 0.4) based on oxygen fugacity estimates from co-existing Fe-Ti oxides. Slightly different starting values have been used for Rhyolite-MELTS modeling using the Havre raft pumice or Havre flank lava as parental compositions. For the models using the raft pumice as the starting composition, the initial water content of 5.8 wt% is consistent with plagioclase hygrometer constraints from this study (i.e., Putirka, 2005) and plagioclase hosted melt inclusion data from the giant seafloor pumice (Manga et al., 2018a). We do not use water concentrations of 4.9 wt.% (Manga et al., 2018b) as this includes measurements from quartz-hosted melt inclusions, which is now suspected of being antecrystic; in this case, water concentrations measured from quartz will not record the water concentrations of the host melt (i.e., Havre rhyolite). Pressure is varied in models from 1.5 to 5 kbars based on opx-whole-rock geobarometer results. The initial parameters for Rhyolite-MELTS models using the Havre flank dacite starting composition are: fO2 = NNO and 4 wt.% H2O with 4 isobaric models generated at 1 kbar increments from 1–4 kbars. Models using an initial water content of 4 wt.% are presented here because at higher water contents, the melt quickly becomes water saturated with crystallization. A less evolved starting composition in the Rhyolite-MELTS models also provides a test for the origins of the mineral phases observed in the Havre pumice, as the mineral suite observed in nature is predicted to be derived from crystallization of a slightly less evolved melt composition than the final eruptive products. However, the Havre flank is only a proxy for a parental magma to the Havre 2012 crystal poor-rhyolite, and is used here because there is no evidence for a more primitive parental source of magma (i.e., basaltic enclaves, or magma mixing signatures). Therefore, this study does not speculate on the extent of prior crystallization and/or partial melting needed to produce the Havre flank composition from a more primitive melt or country rock.
All Rhyolite-MELTS models for each starting composition are run froma temperature slightly higher than the calculated liquidus (e.g., the temperature of the first crystallizing phase of each pressure dependent model; ∼910–960°C) down to 750–760°C in 10°C increments. For each 10°C increment, Rhyolite-MELTS provides the proportion of liquid to crystals (Figures 12C,D), the composition of the evolving liquid (Figures 12E,F) and each crystallizing phase (Figure 13). We use multiple isobaric pressure models, conducted at constant fO2 and water concentrations, to produce synthetic phase diagrams in T-P space based on both starting compositions (Figures 12A,B). A suite of models at varying conditions of water were also conducted, where reducing the water content does not greatly affect the sequence or composition of crystallizing phases and only slightly increases the liquidus temperature of each phase.
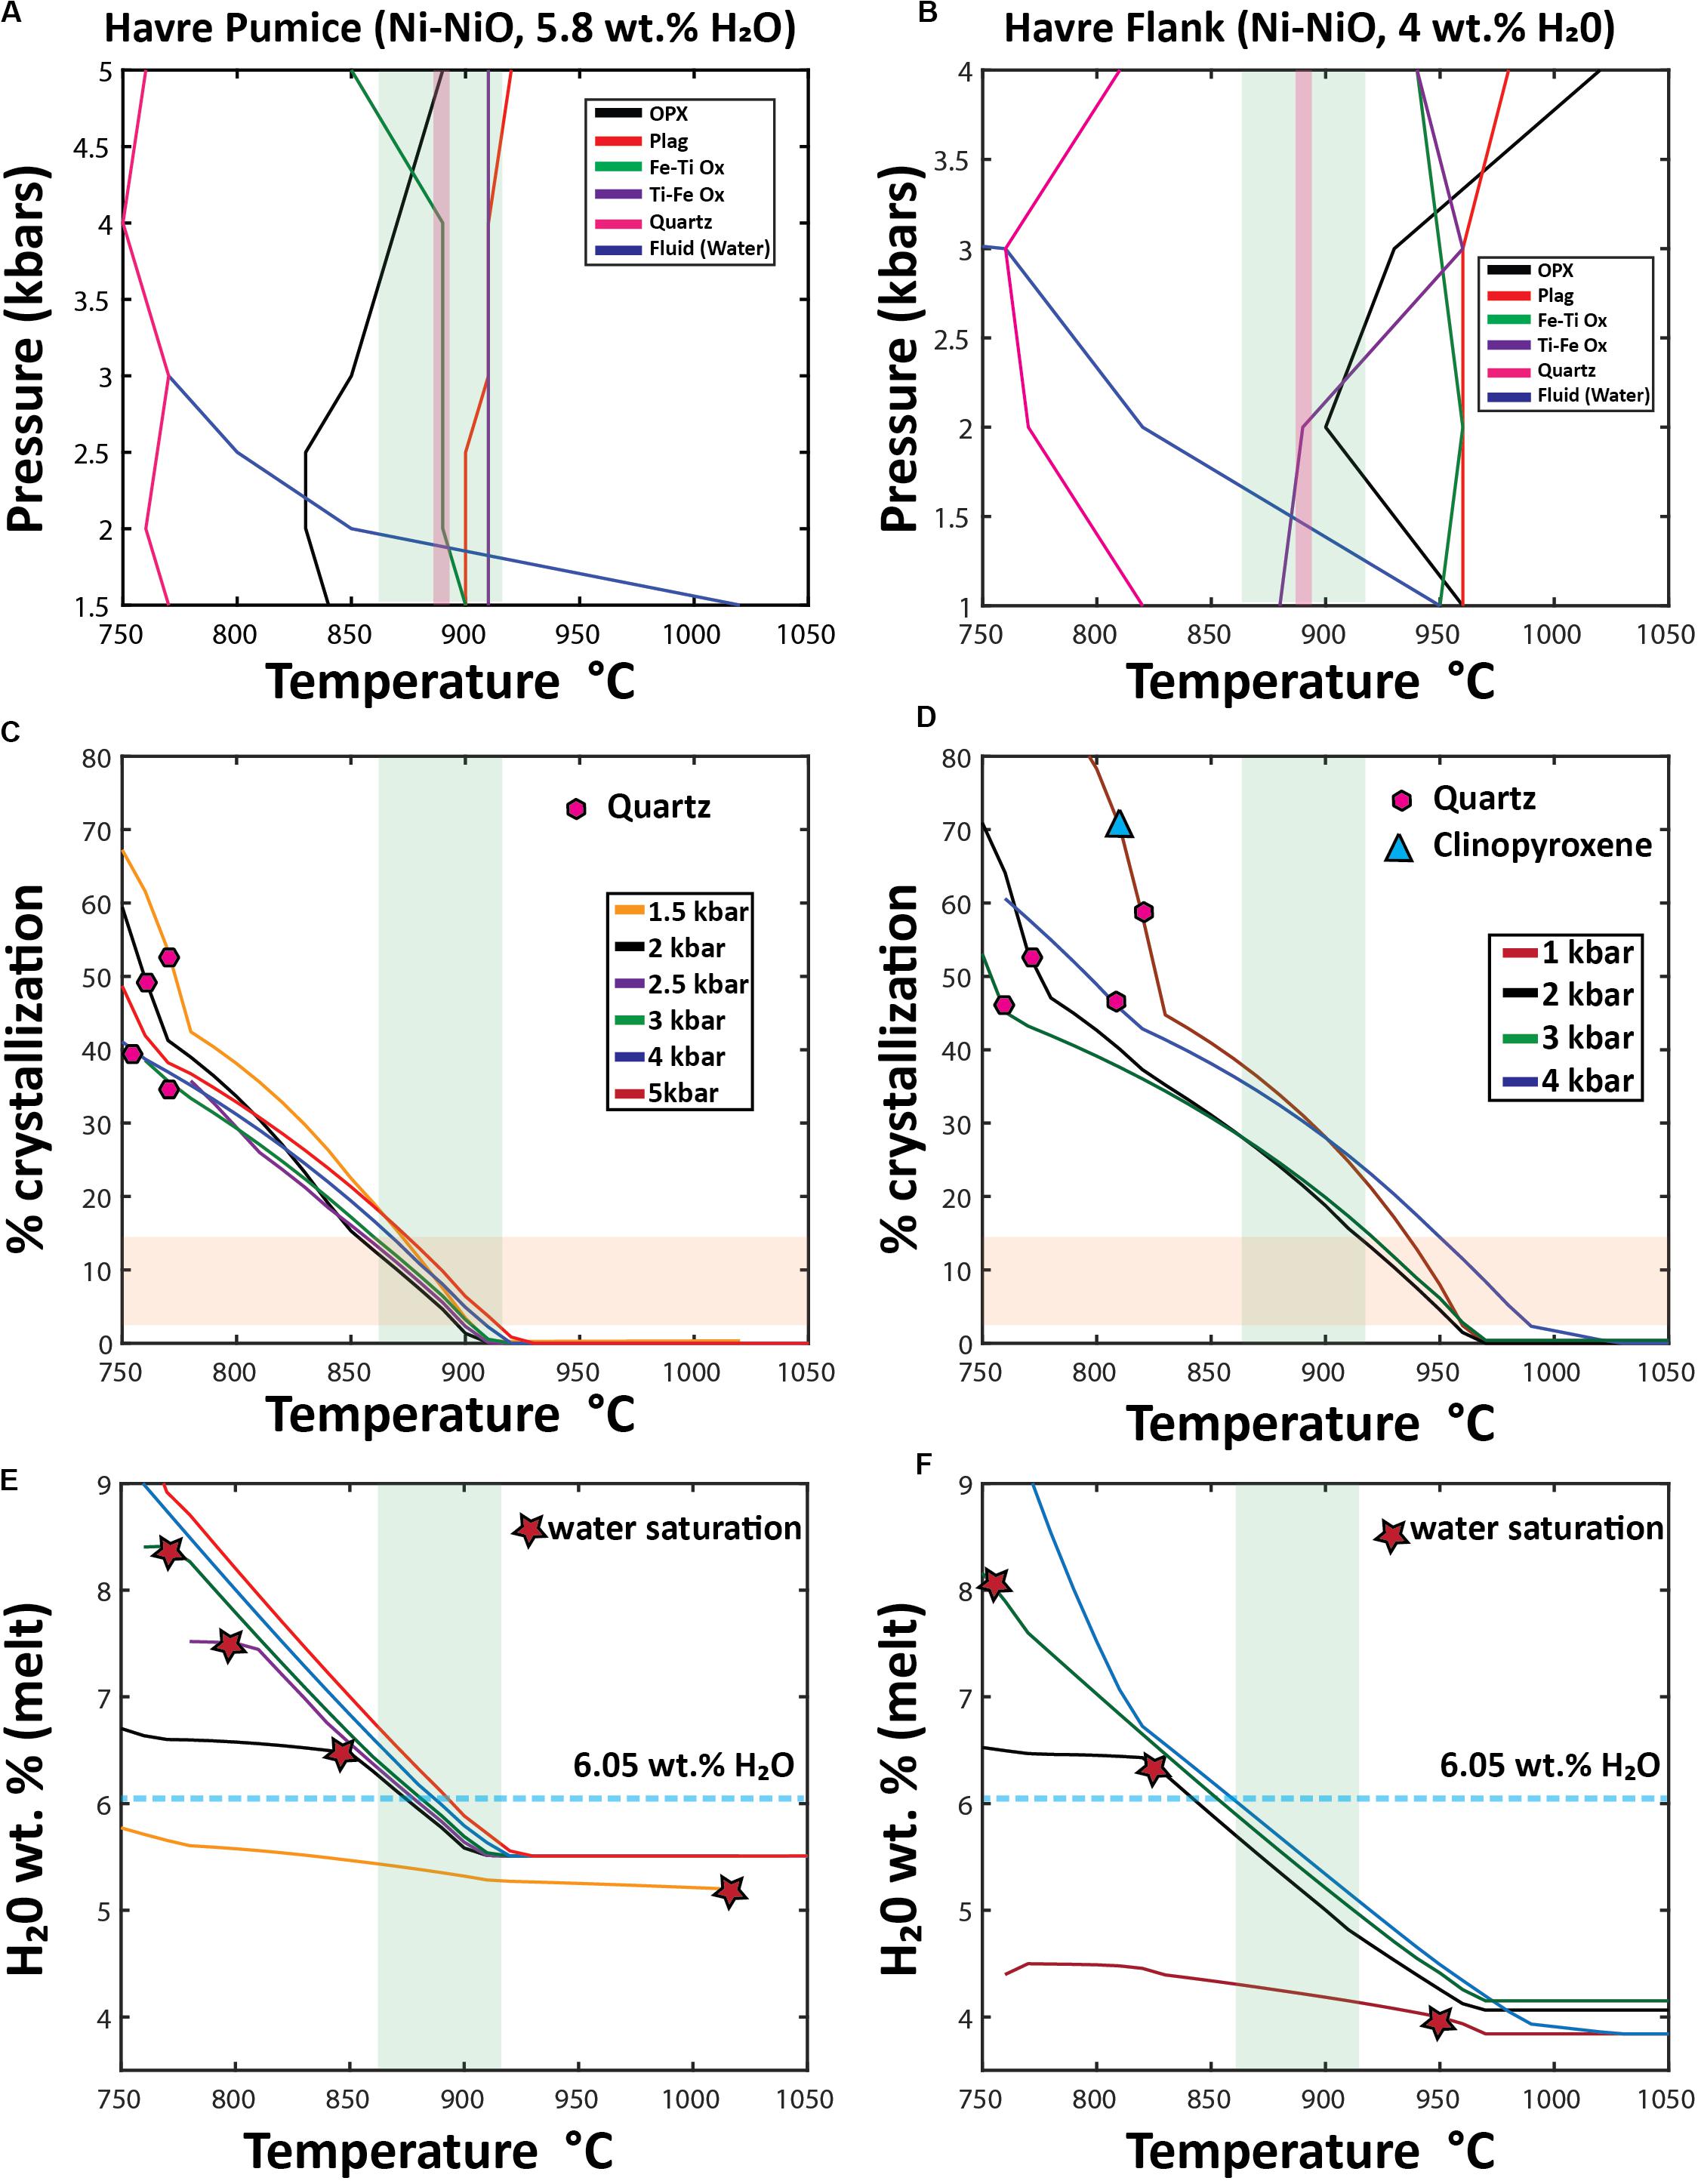
Figure 12. Outcomes of Rhyolite MELTS modeling using two differentstarting compositions: Havre pumice raft (PP-16-CU), and a pre-2012 Havre flank dacite lava (Wright et al., 2006). Starting compositions for both Rhyolite-MELTS models are given in the Supplementary Excel File 1. (A,B) “synthetic” phase diagrams; (C,D) Crystallization% vs temperature (E,F) H2Omelt vs temperature, In the temperature vs. pressure phase diagrams (A,B) produced from multiple Rhyolite-MELTS models, each line is the result of combining the liquidus temperature of an individual crystallizing phase at different pressures; the blue line shows the calculated temperature and pressure at which the melt becomes water saturated. The green band represents the orthopyroxene-melt geothermometry results (890 ± 27°C) of the Havre pumice in all diagrams (A–F). In (A,B), the pink shaded field represents geothermometry results of Fe-Ti oxide pairs (∼885–890°C). In the% crystallization vs temperature diagrams (C,D), the horizontal orange field denotes the range of crystal contents (3–15%) observed throughout all Havre 2012 eruptive products. The first appearance of quartz (pink hexagons) and clinopyroxene (light blue triangles) is shown for each pressure model run. The H2Omelt vs temperature diagrams (E,F) are used to show when the melt becomes water saturated (red stars) and the estimated concentration of water in the melt needed for the Havre rhyolite to be water saturated (light blue dashed line at 6.05 wt.% H2O, 100 ppm CO2) calculated from Ghiorso and Gualda (2015) fluid mixing models. In all rhyolite-MELTS models crystallization continues in the presence of an exsolved/exsolving fluid phase following water saturation.
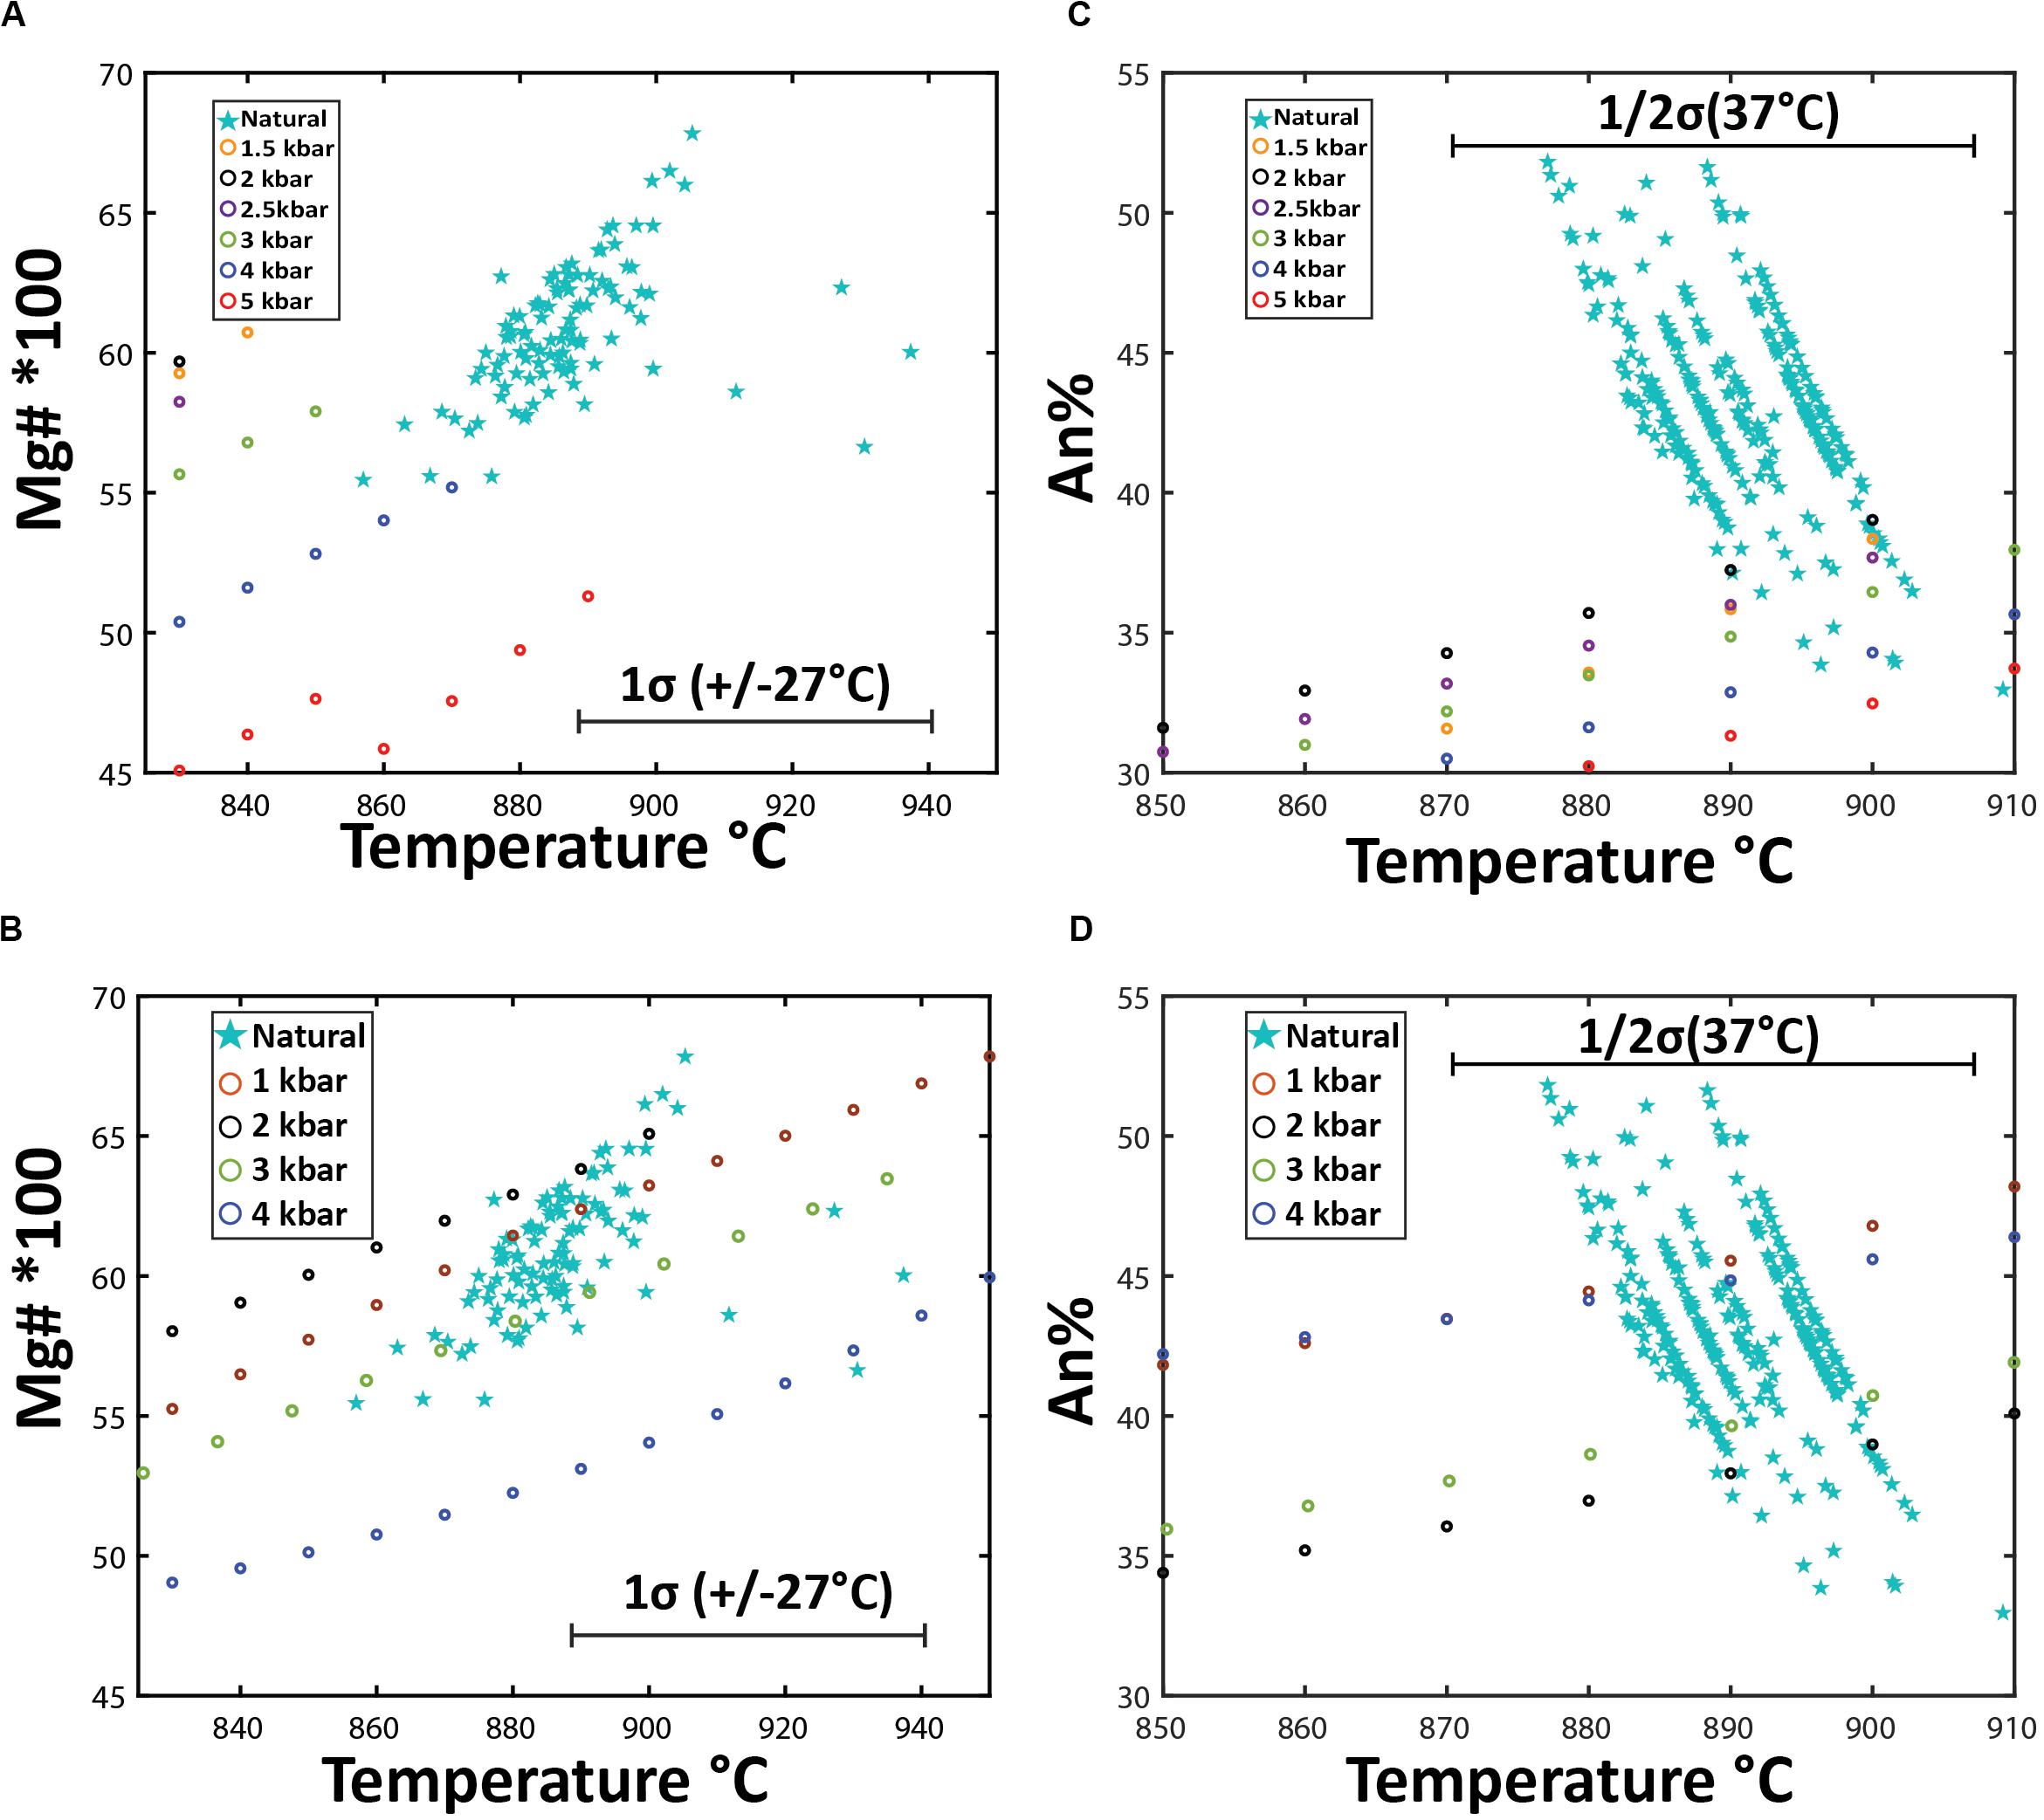
Figure 13. Mineral chemistry outcomes of Rhyolite-MELTS modeling using two different starting compositions: (A,C) Havre pumice raft (PP-16-CU), and (B,D) a pre-2012 Havre flank dacite lava (Wright et al., 2006). (A,B) are a comparison of measured vs Rhyolite-MELTS calculated orthopyroxene compositions where temperatures (± 27°C uncertainty) for measured orthopyroxene compositions are calculated from eq. 28a of Putirka (2008) assuming 5.8% H2O magmatic water content. (C,D) compares measured vs Rhyolite-MELTS calculated plagioclase compositions where temperatures (± 37°C uncertainty) for measured plagioclase are calculated based on eq. 26 of Putirka (2005) for in equilibrium plagioclase based on Ab-An exchange criteria.
Rhyolite-MELTS isobaric models calculated at 1–4 kbar pressure using the Havre pumice (PP-16-CU) as a parental composition predict a crystallization sequence from first to last crystallizing phase of ilmenite, plagioclase, titanomagnetite, orthopyroxene and quartz (Figure 12A). At > 4 kbars, plagioclase replaces ilmenite as the liquidus phase, and orthopyroxene crystallizes before titanomagnetite (Figure 12A). Clinopyroxene is never produced under any pressures. Quartz is only crystallized when the melt reaches 750–770°C, and after 35 to 53% of the melt has crystallized (Figure 12C). Water saturation can be reached at high temperatures (1020°C) and low pressures (1.5 kbar), whereas at slightly higher pressures (2–3 kbars), water saturation is not reached until the melt has cooled to lower temperatures from 860 to 770°C (Figure 12A). However, at pressures in excess of 3 kbars, the melt remains water undersaturated. Water saturation is reached at lower H2Omelt concentrations (∼5.2 wt.%) in the melt for lower pressure models (1.5 kbars) but at higher pressures from 2 to 3 kbars, the melt does not reach water saturation until the melt has accumulated ∼6.5 to 8.4 wt.% H2O (Figure 12E). Modifying the starting composition of the 2 kbar rhyolite-MELTS model to include 80 ppm CO2 (as indicated from melt inclusions, Manga et al., 2018a), alters the temperature (880°C) and H2Omelt concentrations (6.14 wt.%) at which water saturation is reached.
Rhyolite-MELTS modeling using the dacite flank lava as the parental composition predicts the following crystallization sequence at low pressures (1–3 kbar): plagioclase, ilmenite, orthopyroxene, and magnetite. The first crystallizing phase changes at progressively higher-pressure conditions of crystallization with ilmenite and plagioclase (3 kbar) and orthopyroxene (4 kbar) being the liquidus phase (Figure 12B). Clinopyroxene only crystallizes in 1 kbar pressure models as a near solidus phase at 810°C and only after ∼70% of the melt has already crystallized (Figure 12D). Quartz crystallizes in all pressure models from 750 to 820°C after 45 to 58% of the system has crystallized (Figures 12B,D). Water saturation occurs at 950°C in lower pressure (1 kbar) models and at 760°C at 3 kbars; water saturation is not reached when crystallization occurs at 4 kbar (Figures 12B,F). Water saturation is reached at a H2O melt concentration of ∼4 wt.% in lower pressure (1 kbar) models; at ∼6.4 wt.% in the 2 kbar model; and at ∼8.2 wt.% in the 3 kbar model (Figure 12F).
In addition to the crystallization sequence, the Rhyolite-MELTS modeling allows comparison of the crystallization temperatures of each phase and the mineral chemistry of the calculated and observed mineral assemblage (Figure 13). Comparisons of orthopyroxene compositions (Figures 13A,B) are based on the measured and calculated Mg number and corresponding pyroxene-melt temperatures (Putirka, 2008; eq.28) with Rhyolite-MELTS calculated temperatures of crystallization at different pressures. Measured Havre orthopyroxene compositions, crystallization temperatures, and pressure are consistent with the Havre flank Rhyolite-MELTS model results for orthopyroxene at 1–3 kbars (Figure 13B). For example, the temperature at which orthopyroxene crystallizes (890–900°C) in Rhyolite-MELTS models over 2–3.5 kbars is consistent with temperature and pressure estimates calculated by orthopyroxene-melt thermobarometry of 890 ± 27°C and 2–4 kbars, respectively. In contrast, much less consistency is observed for the Havre pumice Rhyolite-MELTS model that in general, does not produce the same orthopyroxene composition and crystallization temperature at any pressure (Figure 13A). Natural Havre pumice orthopyroxene have higher Mg numbers and calculated temperatures (∼890°C) where the Rhyolite-MELTS models predict orthopyroxene crystallization at lower temperatures (< 863°C).
Figures 13C,D compare measured An content of plagioclase with calculated plagioclase compositions crystallizing from the two starting melt compositions over a pressure range from 1–4 kbars. The Havre rhyolite pumice Rhyolite-MELTS model produces plagioclase compositions of An35 at low pressures (1–2 kbars), which overlaps only with the most sodic andesine analyzed from the Havre pumice (Figure 13C). In contrast, measured Havre plagioclase compositions, and calculated temperatures and pressures using the plagioclase-liquid geobarometer of Putirka (2005) are consistent with Rhyolite-MELTS calculated plagioclase compositions in the Havre dacite (flank) models at all pressures from 1–4 kbars (Figure 13D). Of note is that the Rhyolite-MELTS calculated plagioclase liquidus temperature is much greater than plagioclase-melt thermobarometer estimates, however, plagioclase continuously crystallizes throughout all the Rhyolite-MELTS models (Figures 12A,B).
In the Havre flank (dacite) Rhyolite-MELTS model (Figure 12B), ilmenite and titanomagnetite are both predicted to crystallize at high temperatures (940–970°C) and at higher pressures (> 2 kbars), whereas at lower pressures, titanomagnetite crystallizes out at a higher temperature (∼940–950°C) and does not coexist with ilmenite until lower temperatures (880–900°C). These calculated crystallization temperatures are therefore consistent with results from Fe-Ti oxide geothermometry (∼885–890°C). Similarly, Havre pumice Rhyolite-Melts models indicate ilmenite and titanomagnetite to co-exist at 890°C at pressures < 4 kbars, where ilmenite is shown to be the first crystallizing oxide at 910°C in all pressure models (Figure 12B).
Several implications arise from the Rhyolite-MELTS modeling and through comparison with the observed mineral assemblage, compositions and phase relationships. First, as indicated from textural relationships, clinopyroxene rarely appears as a crystallizing phase, and quartz does not appear as a crystallizing phase until near solidus temperatures (750–820°C). Clinopyroxene is only produced from these silicic melt compositions at low temperatures, at near-solidus conditions (> 70% crystallization; Figure 12D), and at low pressures (1 kbar). Second, Rhyolite-MELTS modeling confirms the autocrystic phases being co-existing Fe-Ti oxides, sodic plagioclase and orthopyroxene (Figures 12A,B). The crystallization order can be subtly changed with increasing pressure of crystallization. Third, given the relatively high initial water content, the Rhyolite-MELTS models are sensitive to pressure as well as to when the magma reached fluid saturation (Figures 12E,F). Water saturation of a melt potentially can be a trigger for eruption and terminate crystallization unrelated to decompression and degassing (e.g., Sparks, 1978; Melnik, 2000). If crystallization occurred at shallow depths (< 1.5–2.25 kbars) then fluid saturation occurs before any other phase has crystallized (Figures 12A,B,E,F). This could then imply the entire crystal cargo is inherited or that crystallization was occurring in the presence of an exsolved fluid phase. However, when pressure is > 2 kbars in Havre pumice models (Figure 12A) and > 1.5 kbars in Havre flank models (Figure 12B), then crystallization of plagioclase, orthopyroxene and Fe-Ti oxides can occur prior to any water saturation. The H2Omelt concentration at which water saturation occurs in each model provides the conditions (i.e., temperature and crystal content) required for volatile exsolution (Figures 12C–F). Water saturation needs to follow H2Omelt concentrations in breaching water saturation criteria (> 6.04 wt.% H2Omelt) for models to truly represent a scenario where the eruption could be triggered by a pressure build-up in the crystallizing, water-supersaturated Havre magma (e.g., Tait et al., 1989). This is the case for 2 kbars models that reach water saturation of ∼6.4 wt.% H2O at ∼860°C (Figure 12E). While, the addition of a small amount of CO2 dissolved in the magma (80 ppm from plagioclase-hosted melt inclusions; Manga et al., 2018a) raises the temperature at which the magma reaches fluid saturation (e.g., 880°C at 6.14 wt.% H2O), it does not cause any substantive change in the crystallization sequence. Fourth, Rhyolite-MELTS calculated melt compositions overlap observed Havre pumice compositions after ∼7.5–14% crystallization (Figures 12C,E), and this is consistent with the observed low crystal contents in the 2012 Havre erupted products (Table 2). Fifth, Rhyolite-MELTS models and using the Havre flank lava starting composition run at moderate pressures (2–3 kbars), best replicate the observed mineralogy, crystallization sequence as informed by enclosing relationships and relative modal abundances, and pressure estimates from the different geobarometers (Figures 12A–D, 13).
The combination of textural and microgeochemical analysis with Rhyolite-MELTS modeling provides valuable insights into the assembly of the crystal cargo of the Havre rhyolite magma and improved constraints on the pre-eruptive conditions.
The autocrystic mineral assemblage of the Havre rhyolite is concluded to be andesine plagioclase, magnetite, ilmenite, enstatite and accessory apatite. This is supported by the generally euhedral forms of these mineral phases, and their common occurrence in small crystal aggregates or glomerocrysts. Phenocryst/microphenocryst rim compositions typically overlap with euhedral microlite compositions in the pumice glass (Figures 3, 6). This crystallizing assemblage is replicated after low degrees of crystallization (7–15%) in a range of Rhyolite-MELTS models using slightly different silicic melt starting compositions, pressures and initial water contents. Liquidus temperatures are interpreted to be recorded by the co-existing Fe-Ti oxides at ∼940°C. Eruptive temperatures appear to be slightly lower at ∼890-900°C based on plagioclase-melt, orthopyroxene-melt, and co-existing Fe-Ti oxide geothermometry. The consistency in temperature estimates by these three different geothermometers gives confidence to the results. Rhyolite-MELTS models and geobarometry estimates from orthopyroxene-melt and plagioclase-melt compositions indicate final magma storage and crystallization at depths of ∼2–3 kbar.
We conclude that augite, the calcic plagioclase (labradorite-bytownite) components of plagioclase phenocrysts and trace quartz are inherited crystal components into the Havre rhyolite magma. The exact origin of these mineral phases remains unclear and could be better constrained if more was known on the pre-eruptive history of the Havre magmatic system.
At least two compositionally and texturally distinct augites are present (Figures 6, 8) suggesting an ultimate derivation from crystal mush zones in the Havre plumbing system. Sector zoning in clinopyroxene (Figure 8C) has been attributed to slow, near-equilibrium crystallization kinetics associated with low degrees of undercooling (< 40°C; Ubide et al., 2019; Masotta et al., 2020). The low degrees of undercooling can be explained by clinopyroxene subjected to slow magma ascent, or gradual recharge of a crystal mush zone (Ubide et al., 2019). While, most major elements partition into sectors (i.e., Mg+2 and Si+4 in hourglass sectors and Ca+, Ti+4 and Al+3 in prism sectors), Cr and Fe+2 in contrast, follow concentric zoning patterns, with enriched Cr zones recording mafic recharge events (e.g., Ubide and Kamber, 2018). Enriched Cr rims of sector zoned clinopyroxene are consistent with a mafic recharge event triggering eruptions at Mount Etna (e.g., Ubide and Kamber, 2018); however, at Havre, Cr enrichment is only observed in crystal interiors, and most likely recording older recharge events perhaps in a crystal mush zone somewhere at depth in the Havre magmatic plumbing system. The implication of the rhyolite-MELTS models for clinopyroxene to appear only after extended crystallization (> 70%; Figure 12D) is consistent with low temperature crystallization of clinopyroxene in a crystal mush zone. Preserving sector zoning then requires rapid cooling and/or quenching of the pyroxene upon eruption where decompression and degassing induced crystallization is recorded in Al+3 and Ti+4 enriched rims (Figure 8) relative to the clinopyroxene mantle (e.g., Ubide et al., 2019).
The occurrence of quartz suggests some mush zones are very silicic. Melts models indicate quartz is a likely antecryst incorporated into the erupted melt from a cooler/dryer crystal-rich mush zone (> 50%) or margins of the reservoir. The spectrum of crystal contents observed between Havre eruptive products could also be explained by a crystal-poor rhyolite cap immediately overlying a crystal-rich zone where greater entrainment of crystals occurs on eruption as a result of withdrawal dynamics. A similar process could occur near the margin of the magma reservoir where the magma system would be progressively crystal-rich and cooled from the center to margins of the system. Crystal entrainment from cooler parts of the magma system is consistent with higher counts of antecryst (e.g., quartz and clinopyroxene; Table 2) in the seafloor eruptive products compared to the pumice raft. However, the more calcic plagioclase may be sourced from more mafic-intermediate compositions or during partial melting of source material. The occurrence of thin rim overgrowths (10–100 μm) to phenocrysts (e.g., Figures 2, 7A) with compositions that overlap microlites suggests the inherited crystal components resided in the Havre rhyolite melt for a brief period prior to eruption. The H2O-rich and CO2-poor (< 200 ppm) compositions of the plagioclase-hosted melt inclusions (Manga et al., 2018a) would also be consistent with some magma storage prior to eruption (e.g., Cashman and Sparks, 2013).
The discrimination of these mineral phases into autocrystic and inherited components is significant. Although the proportion of inherited crystal material is low, and does not materially change the bulk rock texture or composition, it shows that even in crystal-poor magmas, crystal cannibalization from other source materials can occur, and that the mineral phases added to the crystal cargo may not be obviously out of equilibrium (e.g., quartz in rhyolite). Previous studies presented pre-eruptive H2O melt concentrations from plagioclase-hosted melt inclusions (Manga et al., 2018a) as well as quartz-hosted melt inclusions (Manga et al., 2018b). Plagioclase with An < 53 is shown to be in equilibrium in this study, however quartz is a likely antecrystic or xenocrystic phase, and therefore the melt inclusion data incorporating quartz-hosted melt inclusion compositions (Manga et al., 2018b) are less likely to accurately record the pre-eruptive conditions and water concentrations in the host melt. This study considers water concentrations of 5.8 ± 0.7 wt.% from only plagioclase-hosted melt inclusions (Manga et al., 2018a) to more accurately record the pre-eruptive melt water concentrations and these concentrations are consistent with the plagioclase-melt hygrometer estimates reported here.
The clinopyroxene has previously been relied upon to constrain the pre-eruptive temperature of the Havre rhyolite magma. Manga et al. (2018a) derived a temperature estimate of 850 ± 20°C using the coupled orthopyroxene-clinopyroxene geothermometer of Putirka (2005). Several lines of evidence have been presented here to show the clinopyroxene is not in equilibrium, and the geothermometer yields low temperature estimates compared to a range of other geothermometers underpinned by equilibrium tests.
The 2012 Havre eruption has been somewhat controversial in terms of whether the eruption was explosive or effusive. This is due to the water depth of ∼900 m for the summit of Havre volcano, and modeled eruption parameters and observed products at the vent indicating an overall effusive style of eruption (Manga et al., 2018a), yet a large volume and buoyant pumice raft was produced and textural features to some ash deposits related to the eruption suggest some magma-driven explosivity (Carey et al., 2014; Murch et al., 2019). Models used to simulate the Havre eruption (e.g., magma ascent conduit model of Manga et al., 2018a) are sensitive to changes in eruption temperature. For example, more than a four-fold increase in ascent rate results if an eruption temperature of 890°C is used, and ascent rates > 200 m s–1 can result for magmatic temperatures of 1000°C. Rhyolite-MELTS models demonstrate that the magma remains fluid undersaturated at high pressures (> 2.5 kbars), crystallizing all inferred autocrystic phases (plagioclase, Fe-Ti oxides, and orthopyroxene) in agreement with geothermometry estimates. However, the magma is primed for fluid saturation and volatile exsolution at lower pressures (< 2 kbars) suggesting subsurface fragmentation was possible during the pumice raft-producing phase of the Havre eruption. We conclude that considerable uncertainty exists as to whether an entirely effusive eruption (Manga et al., 2018a) produced the voluminous pumice raft of the 2012 Havre eruption.
A detailed petrographic and compositional study of the Havre pumice mineralogy, coupled with Rhyolite-MELTS modeling have identified complexities in the crystal cargo of a relatively large volume, crystal-poor and apparently chemically homogenous rhyolite magma. While the mineral assemblage is not diverse or unusual for a subduction-related rhyolite magma, a range of different but complementary approaches were able to distinguish autocrystic from inherited crystal components. The autocrystic assemblage crystallizing just prior to eruption was plagioclase (An40–45), enstatite, Fe-Ti oxides and accessory apatite. Inherited crystal components include An-rich (> An53) plagioclase, augite and quartz. Rhyolite-MELTS modeling and geothermometric indicators suggest the quartz and augite are antecrystic and derived from cooler, silicic mush zones in the Havre magmatic system as quartz was found to crystalize at 750–820°C, and clinopyroxene only crystallized at low pressures and as a near-solidus phase (> 70% crystallization). When the entire eruptive sequence is considered, a subtle trend emerges of increasing crystal content and inherited crystal cargo from the volumetrically dominant white raft pumice to the volumetrically minor and late-erupted summit lava flows (Carey et al., 2018; Murch et al., 2019).
Discriminating autocrystic from inherited crystal components is critical when attempting to constrain the pre-eruptive characteristics of the magma body. Even when crystal contents are low, phenocryst assemblages are restricted and phases may be broadly consistent with melt or whole-rock compositions, it should not automatically be assumed all mineral phases present are autocrystic. Equilibrium tests confirmed clinopyroxene was not in equilibrium with host melt or co-existing orthopyroxene compositions, and temperature estimates using clinopyroxene (Manga et al., 2018a) have been found to be low. A range of different thermometers validated by equilibrium tests yielded consistent pre-eruptive temperature estimates for the Havre rhyolite: 890 ± 27°C (orthopyroxene-melt; Putirka, 2008); 890 ± 37°C (plagioclase-melt, Putirka, 2008), and 890-900°C (Fe-Ti oxides; Spencer and Lindsley, 1981). Oxygen fugacity constrained by ilmenite and titanomagnetite pairs indicate the magma was not strongly oxidizing (QFM + 0.4 ∼NNO). Corresponding plagioclase and melt compositions indicate pre-eruptive water contents of 5.1 to 6.2 wt% H2O (mean of 5.6 ± 1.1 wt.% H2O) and are consistent with magmatic water contents previously determined from plagioclase melt inclusions (Manga et al., 2018a). Moderate crystallization depths of 2–4 kbars are also indicated from plagioclase-melt compositions (Putirka, 2008). The consistency of results for the different mineral-based geothermometers gives confidence that plagioclase, orthopyroxene and Fe-Ti oxides were co-crystallizing in the Havre rhyolite magma immediately prior to eruption.
The lack of strong mafic recharge signals (e.g., reverse compositional zoning, Cr-rich rims in clinopyroxene) suggest mafic recharge did not directly trigger the eruption. Given the relatively high initial water content, the Rhyolite-MELTS models are sensitive to pressure and timing of when magma reached fluid saturation. The observed mineral phase relationships and Rhyolite-MELTS modeling results are most consistent with some crystallization occurring at pressures > 2 kbar prior to eruption and that the Havre magma was primed for volatile exsolution on decompression and ascent to the surface. Rhyolite-Melts modeling suggests limited fractionation from a dacitic parental composition can successfully produce the erupted Havre melt composition and observed autocrystic mineralogy.
All datasets presented in this study are included in the article/Supplementary Material.
This manuscript is a result of JK’s Ph.D. research, where sample preparation, chemical analyses, data analysis, and production of figures was completed by JK with the guidance/training of QUT’s Central Analytical Research Facility (CARF) staff and Ph.D. supervisors SB, DG, and HC. SB is JK’s principle Ph.D. supervisor with expertise in volcanology, pumice raft-producing eruptions, and igneous petrology. He provided guidance on petrographic and mineral chemistry interpretations and had a major role in writing and editing the manuscript. DG with his expertise in petrology and mineralogy provided guidance in mineral chemistry calculations and interpretations presented in this study. DG also conducted a suite of Rhyolite-MELTS models presented here. HC with her expertise in EPMA performed routine EPMA set up and standardization for EPMA of glass and mineral chemistry for all single spot and pyroxene spatial elemental map sessions. All authors contributed to the article and approved the submitted version.
JK was supported by a QUT PRA scholarship and an AINSE postgraduate research scholarship.
The authors declare that the research was conducted in the absence of any commercial or financial relationships that could be construed as a potential conflict of interest.
We acknowledge the Central Analytical Research Facility (CARF) at Queensland University of Technology for EPMA and XRF chemical analyses. Thank you to Rebecca Carey for kindly providing samples of the 2012 Havre lavas and giant seafloor pumice included in this study that initially formed the basis of a QUT vacation research experience project to Daniel Franks. The two reviewers are thanked for their constructive reviews and comments which have greatly improved the manuscript. Thank you to Teresa Ubide for presenting the opportunity to be a part of this special issue and providing constructive feedback during the research process.
The Supplementary Material for this article can be found online at: https://www.frontiersin.org/articles/10.3389/feart.2020.00310/full#supplementary-material
MATERIAL S1 | XRF desalination methods.
MATERIAL S2 | Unique Havre raft pumice types.
MATERIAL S3 | Mn/Mg Fe-Ti oxide pairs equilibrium test.
MATERIAL S4 | Excel files of mineral chemistry (plagioclase, orthopyroxene, clinopyroxene, magnetite & ilmenite), EPMA glass chemistry, orthopyroxene-clinopyroxene equilibrium test results, and starting compositions of MELTS models.
Bachmann, O., and Bergantz, G. W. (2004). On the origin of crystal-poor rhyolites: extracted from batholithic crystal mushes. J. Petrol. 45, 1565–1582. doi: 10.1093/petrology/egh019
Bachmann, O., and Bergantz, G. W. (2008a). Rhyolites and their source mushes across tectonic settings. J. Petrol. 49, 2277–2285. doi: 10.1093/petrology/egn068
Bachmann, O., and Bergantz, G. (2008b). The magma reservoirs that feed supereruptions. Elements 4, 17–21. doi: 10.2113/gselements.4.1.17
Bacon, C. R., and Hirschmann, M. M. (1988). Mg/Mn partitioning as a test for equilibrium between coexisting Fe-Ti oxides. Am. Mineral. 73, 57–61.
Barker, S. J., Wilson, C. J. N., Baker, J. A., Millet, M. A., Rotella, M. D., Wright, I. C., et al. (2013). Geochemistry and petrogenesis of silicic magmas in the intra-oceanic Kermadec arc. J. Petrol. 54, 351–391. doi: 10.1093/petrology/egs071
Bryan, S. E., Cook, A., Evans, J. P., Colls, P. W., Wells, M. G., Lawrence, M. G., et al. (2004). Pumice rafting and faunal dispersion during 2001-2002 in the Southwest Pacific: record of a dacitic submarine explosive eruption from Tonga. Earth Planet. Sci. Lett. 227, 135–154. doi: 10.1016/j.epsl.2004.08.009
Bryan, S. E., Ferrari, L., Reiners, P. W., Allen, C. M., Petrone, C. M., Ramos-Rosique, A., et al. (2008). New insights into crustal contributions to large-volume rhyolite generation in the mid-Tertiary Sierra Madre Occidental province. Mexico, revealed by U–Pb geochronology. J. Petrol. 49, 47–77. doi: 10.1093/petrology/egm070
Bryan, S. E., Marti, J., and Leosson, M. (2002). Petrology and geochemistry of the Bandas del Sur formation, Las Cañadas edifice, Tenerife (Canary Islands). J. Petrol. 43, 1815–1856. doi: 10.1093/petrology/43.10.1815
Bryan, W. B. (1970). Mineralogy of Coral Sea drift pumice. Carnegie Institute Washington Yearbook. 68, 187–190.
Carey, R., Soule, S. A., Manga, M., White, J. D., McPhie, J., Wysoczanski, R., et al. (2018). The largest deep-ocean silicic volcanic eruption of the past century. Sci. Adv. 4:e1701121. doi: 10.1126/sciadv.1701121
Carey, R. J., Wysoczanski, R., Wunderman, R., and Jutzeler, M. (2014). Discovery of the largest historic silicic submarine eruption. Eos Trans. Am. Geophys. Union 95, 157–159. doi: 10.1002/2014eo190001
Carmichael, I. S. E., and Nicholls, J. (1967). Iron-titanium oxides and oxygen fugacities in volcanic rocks. J. Geophys. Res. 72, 4665–4687. doi: 10.1029/jz072i018p04665
Cashman, K., and Blundy, J. (2000). Degassing and crystallization of ascending andesite and dacite. Philos. Trans. R. Soc. Lon. Ser. AMath. Phys. Eng. Sci. 358, 1487–1151.
Cashman, K., and Sparks, R. S. J. (2013). How volcanoes work: a 25 year perspective. Geol. Soc. Am. Bull. 125, 664–690. doi: 10.1130/b30720.1
Charlier, B. L. A., Bachmann, O., Davidson, J. P., Dungan, M. A., and Morgan, D. J. (2007). The upper crustal evolution of a large silicic magma body: evidence from crystal-scale Rb–Sr isotopic heterogeneities in the Fish Canyon magmatic system. Colorado. J. Petrol. 48, 1875–1894. doi: 10.1093/petrology/egm043
Charlier, B. L. A., Wilson, C. J. N., Lowenstern, J. B., Blake, S., Van Calsteren, P. W., and Davidson, J. P. (2005). Magma generation at a large, hyperactive silicic volcano (Taupo, New Zealand) revealed by U–Th and U–Pb systematics in zircons. J. Petrol. 46, 3–32. doi: 10.1093/petrology/egh060
Cooper, K. M., and Kent, A. J. (2014). Rapid remobilization of magmatic crystals kept in cold storage. Nature 506, 480–483. doi: 10.1038/nature12991
Costa, F., and Morgan, D. (2011). “Time constraints from chemical equilibration in magmatic crystals,” in Timescales of Magmatic Processes: From Core to Atmosphere, eds S. P. Turner, J. A. Van-Orman, and A. Dosset (Chichester: Wiley), 125–159. doi: 10.1002/9781444328509.ch7
Davidson, J. P., Morgan, D. J., Charlier, B. L. A., Harlou, R., and Hora, J. (2007). Tracing magmatic processes and timescales through mineral-scale isotopic data. Annu. Rev. Earth Planet. Sci. 35, 273–311.
Deering, C. D., and Bachmann, O. (2010). Trace element indicators of crystal accumulation in silicic igneous rocks. Earth Planet. Sci. Lett. 297, 324–331. doi: 10.1016/j.epsl.2010.06.034
Deering, C. D., Bachmann, O., Dufek, J., and Gravley, D. M. (2011). Rift-related transition from andesite to rhyolite volcanism in the Taupo Volcanic Zone (New Zealand) controlled by crystal–melt dynamics in mush zones with variable mineral assemblages. J. Petrol. 52, 2243–2263. doi: 10.1093/petrology/egr046
Ghiorso, M. S., and Gualda, G. A. R. (2015). An H2O-CO2 mixed fluid saturation model compatible with rhyolite-MELTS. Contribut. Mineral. Petrol. 169:53.
Gill, J., Reagan, M., Tepley, F., and Malavassi, E. (2006). Arenal volcano, costa rica: magma genesis and volcanological processes. J. Volcanol. Geoth. Res. 157, 1–8.
Gualda, G. A. R., Ghiorso, M. S., Lemons, R. V., and Carley, T. L. (2012). Rhyolite-MELTS: a modified calibration of MELTS optimized for silica-rich, fluid-bearing magmatic systems. J. Petrol. 53, 875–890. doi: 10.1093/petrology/egr080
Haase, K. M., Worthington, T. J., Stoffers, P., Garbe-Schönberg, D., and Wright, I. (2002). Mantle dynamics, element recycling, and magma genesis beneath the Kermadec Arc-Havre Trough. Geochem. Geophy. Geosyst. 3, 1–22. doi: 10.1029/2002gc000335
Hammer, J. E., Cashman, K. V., Hoblitt, R. P., and Newman, S. (1999). Degassing and microlite crystallization during pre-climactic events of the 1991 eruption of Mt. Pinatubo, Philippines. Bull. Volcanol. 60, 355–380. doi: 10.1007/s004450050238
Hildreth, W., and Wilson, C. J. (2007). Compositional zoning of the Bishop Tuff. J. Petrol. 48, 951–999. doi: 10.1093/petrology/egm007
Huber, C., Bachmann, O., and Dufek, J. (2012). Crystal-poor versus crystal-rich ignimbrites: a competition between stirring and reactivation. Geology 40, 115–118. doi: 10.1130/g32425.1
Ikegami, F., McPhie, J., Carey, R., Mundana, R., Soule, A., and Jutzeler, M. (2018). The eruption of submarine rhyolite lavas and domes in the deep ocean–Havre 2012. Kermadec Arc. Front. Earth Sci. 6:147. doi: 10.3389/feart.2018.00147
Jerram, D. A., and Martin, V. M. (2008). Understanding crystal populations and their significance through the magma plumbing system. Geol. Soc. Lon. Special Publ. 304, 133–148. doi: 10.1144/sp304.7
Jutzeler, M., Marsh, R., Carey, R. J., White, J. D., Talling, P. J., and Karlstrom, L. (2014). On the fate of pumice rafts formed during the 2012 Havre submarine eruption. Nat. Communi. 5, 1–10.
Kent, A. J., Darr, C., Koleszar, A. M., Salisbury, M. J., and Cooper, K. M. (2010). Preferential eruption of andesitic magmas through recharge filtering. Nat. Geosci. 3, 631–636. doi: 10.1038/ngeo924
Lepage, L. D. (2003). ILMAT: an Excel worksheet for ilmenite-magnetite geothermometry and geobarometry. Comput. Geosci. 29, 673–678. doi: 10.1016/S0098-3004(03)00042-6
Lindsley, D. H., and Andersen, D. J. (1983). A two-pyroxene thermometer. J. Geophys. Res. Solid Earth 88, A887–A906. doi: 10.1029/JB088iS02p0A887
Lindsley, D. H., and Spencer, K. J. (1982). Fe-Ti oxide geothermometry: reducing analyses of coexisting Ti-magnetite (Mt) and ilmenite (Ilm). EOS Transactions, American Geophysical Union 63:471.
Lubbers, J., Deering, C., and Bachmann, O. (2020). Genesis of rhyolitic melts in the upper crust: fractionation and remobilization of an intermediate cumulate at Lake City caldera, Colorado, USA. J. Volcanol. Geoth. Res. 392:106750. doi: 10.1016/j.jvolgeores.2019.106750
MacKenzie, W. S., Donaldson, C. H., and Guilford, C. (1982). Atlas of Igneous Rocks and Their Textures, Vol. 12. London: Longman.
Manga, M., Fauria, K. E., Lin, C., Mitchell, S. J., Jones, M., Conway, C. E., et al. (2018a). The pumice raft-forming (2012) Havre submarine eruption was effusive. Earth Planet. Sci. Lett. 489, 49–58. doi: 10.1016/j.epsl.2018.02.025
Manga, M., Mitchell, S. J., Degruyter, W., and Carey, R. J. (2018b). Transition of eruptive style: pumice raft to dome-forming eruption at the Havre submarine volcano, southwest Pacific Ocean. Geology 46, 1075–1078. doi: 10.1130/g45436.1
Masotta, M., Pontesilli, A., Mollo, S., Armienti, P., Ubide, T., Nazzari, M., et al. (2020). The role of undercooling during clinopyroxene growth in trachybasaltic magmas: Insights on magma decompression and cooling at Mt. Etna volcano. Geochim. Cosmochim. Acta 268, 258–276. doi: 10.1016/j.gca.2019.10.009
Melnik, O. (2000). Dynamics of two-phase conduit flow of high-viscosity gas-saturated magma: large variations of sustained explosive eruption intensity. Bull. Volcanol. 62, 153–170. doi: 10.1007/s004450000072
Mitchell, S. J., Houghton, B. F., Carey, R. J., Manga, M., Fauria, K. E., Jones, M. R., et al. (2019). Submarine giant pumice: a window into the shallow conduit dynamics of a recent silicic eruption. Bull. Volcanol. 81:42.
Mitchell, S. J., McIntosh, I. M., Houghton, B. F., Carey, R. J., and Shea, T. (2018). Dynamics of a powerful deep submarine eruption recorded in H2O contents and speciation in rhyolitic glass: the 2012 Havre eruption. Earth Planet. Sci. Lett. 494, 135–147. doi: 10.1016/j.epsl.2018.04.053
Mollo, S., and Hammer, J. E. (2017). Dynamic crystallization in magmas. EMU Notes Mineral. 16, 373–418.
Mollo, S., Putirka, K., Misiti, V., Soligo, M., and Scarlato, P. (2013). A new test for equilibrium based on clinopyroxene–melt pairs: clues on the solidification temperatures of Etnean alkaline melts at post-eruptive conditions. Chem. Geol. 352, 92–100. doi: 10.1016/j.chemgeo.2013.05.026
Müller, T., Dohmen, R., Becker, H. W., Ter Heege, J. H., and Chakraborty, S. (2013). Fe–Mg interdiffusion rates in clinopyroxene: experimental data and implications for Fe–Mg exchange geothermometers. Contribut. Mineral. Petrol. 166, 1563–1576. doi: 10.1007/s00410-013-0941-y
Murch, A. (2018). Ash Generation in the 2012 Eruption of Havre Volcano, Kermadec Arc: The Largest Deep Subaqueous Eruption of the Last Century. Doctoral dissertation, University of Otago, Dunedin.
Murch, A. P., White, J. D., and Carey, R. J. (2019). Characteristics and deposit stratigraphy of submarine-erupted silicic ash, Havre volcano, Kermadec Arc, New Zealand. Front. Earth Sci. 7:1. doi: 10.3389/feart.2019.00001
Putirka, K. (1999). Clinopyroxene+ liquid equilibria to 100 kbar and 2450 K. Contribut. Mineral. Petrol. 135, 151–163. doi: 10.1007/s004100050503
Putirka, K., Johnson, M., Kinzler, R., Longhi, J., and Walker, D. (1996). Thermobarometry of mafic igneous rocks based on clinopyroxene-liquid equilibria, 0–30 kbar. Contribut. Mineral. Petrol. 123, 92–108. doi: 10.1007/s004100050145
Putirka, K. D. (2005). Igneous thermometers and barometers based on plagioclase+ liquid equilibria: tests of some existing models and new calibrations. Am. Mineral. 90, 336–346. doi: 10.2138/am.2005.1449
Putirka, K. D. (2008). Thermometers and barometers for volcanic systems. Rev. Mineral. Geochem. 69, 61–120. doi: 10.1515/9781501508486-004
Rhodes, J. M., Dungan, M. A., Blanchard, D. P., and Long, P. E. (1979). Magma mixing at mid-ocean ridges: evidence from basalts drilled near 22 N on the Mid-Atlantic Ridge. Tectonophysics 55, 35–61. doi: 10.1016/0040-1951(79)90334-2
Rotella, M. D., Wilson, C. J., Barker, S. J., Schipper, C. I., Wright, I. C., and Wysoczanski, R. J. (2015). Dynamics of deep submarine silicic explosive eruptions in the Kermadec arc, as reflected in pumice vesicularity textures. J. Volcanol. Geoth. Res. 301, 314–332. doi: 10.1016/j.jvolgeores.2015.05.021
Ryan, W. B., Carbotte, S. M., Coplan, J. O., O’Hara, S., Melkonian, A., Arko, R., et al. (2009). Global multi-resolution topography synthesis. Geochem. Geophys. Geosyst. 10. doi: 10.1029/2008GC002332
Smith, I. E., Stewart, R. B., Price, R. C., and Worthington, T. J. (2010). Are arc-type rocks the products of magma crystallisation? Observations from a simple oceanic arc volcano: raoul Island, Kermadec Arc, SW Pacific. J. Volcanol. Geoth. Res. 190, 219–234. doi: 10.1016/j.jvolgeores.2009.05.006
Sparks, R. S. J. (1978). The dynamics of bubble formation and growth in magmas: a review and analysis. J. Volcanol. Geoth. Res. 3, 1–37. doi: 10.1016/0377-0273(78)90002-1
Spencer, K. J., and Lindsley, D. H. (1981). A solution model for coexisting iron–titanium oxides. Am. Mineral. 66, 1189–1201.
Streck, M. J. (2008). Mineral textures and zoning as evidence for open system processes. Rev. Mineral. Geochem. 69, 595–622. doi: 10.1515/9781501508486-016
Tait, S., Jaupart, C., and Vergniolle, S. (1989). Pressure, gas content and eruption periodicity of a shallow crystallizing magma chamber. Earth Planet. Sci. Lett. 92, 107–123. doi: 10.1016/0012-821x(89)90025-3
Toramaru, A., Noguchi, S., Oyoshihara, S., and Tsune, A. (2008). MND (microlite number density) water exsolution rate meter. J. Volcanol. Geoth. Res. 175, 156–167. doi: 10.1016/j.jvolgeores.2008.03.035
Ubide, T., and Kamber, B. S. (2018). Volcanic crystals as time capsules of eruption history. Nat. Commun. 9, 1–12.
Ubide, T., Mollo, S., Zhao, J. X., Nazzari, M., and Scarlato, P. (2019). Sector-zoned clinopyroxene as a recorder of magma history, eruption triggers, and ascent rates. Geochim. Cosmochim. Acta 251, 265–283. doi: 10.1016/j.gca.2019.02.021
Velasquez, E., Bryan, S. E., Ekins, M., Cook, A. G., Hurrey, L., and Firn, J. (2018). Age and area predict patterns of species richness in pumice rafts contingent on oceanic climatic zone encountered. Ecol. Evol. 8, 5034–5046. doi: 10.1002/ece3.3980
Waters, L. E., and Lange, R. A. (2015). An updated calibration of the plagioclase-liquid hygrometer-thermometer applicable to basalts through rhyolites. Am. Mineral. 100, 2172–2184. doi: 10.2138/am-2015-5232
Wright, I. C., Worthington, T. J., and Gamble, J. A. (2006). New multibeam mapping and geochemistry of the 30–35 S sector, and overview, of southern Kermadec arc volcanism. J. Volcanol. Geoth.. Res. 149, 263–296. doi: 10.1016/j.jvolgeores.2005.03.021
Zellmer, G. F., Sakamoto, N., Iizuka, Y., Miyoshi, M., Tamura, Y., Hsieh, H. H., et al. (2014). Crystal uptake into aphyric arc melts: insights from two-pyroxene pseudo-decompression paths, plagioclase hygrometry, and measurement of hydrogen in olivines from mafic volcanics of SW Japan. Geol. Soc. Lon. Special Publ. 385, 161–184. doi: 10.1144/sp385.3
Keywords: crystal-poor rhyolite, Havre 2012 eruption, pumice raft, Rhyolite-MELTS, autocryst, antecryst
Citation: Knafelc J, Bryan SE, Gust D and Cathey HE (2020) Defining Pre-eruptive Conditions of the Havre 2012 Submarine Rhyolite Eruption Using Crystal Archives. Front. Earth Sci. 8:310. doi: 10.3389/feart.2020.00310
Received: 07 April 2020; Accepted: 30 June 2020;
Published: 31 July 2020.
Edited by:
Chiara Maria Petrone, Natural History Museum, United KingdomReviewed by:
Mike Cassidy, University of Oxford, United KingdomCopyright © 2020 Knafelc, Bryan, Gust and Cathey. This is an open-access article distributed under the terms of the Creative Commons Attribution License (CC BY). The use, distribution or reproduction in other forums is permitted, provided the original author(s) and the copyright owner(s) are credited and that the original publication in this journal is cited, in accordance with accepted academic practice. No use, distribution or reproduction is permitted which does not comply with these terms.
*Correspondence: Joseph Knafelc, am9zZXBoLmtuYWZlbGNAaGRyLnF1dC5lZHUuYXU=; a25hZmVsYy5qb3NlcGhAZ21haWwuY29t
Disclaimer: All claims expressed in this article are solely those of the authors and do not necessarily represent those of their affiliated organizations, or those of the publisher, the editors and the reviewers. Any product that may be evaluated in this article or claim that may be made by its manufacturer is not guaranteed or endorsed by the publisher.
Research integrity at Frontiers
Learn more about the work of our research integrity team to safeguard the quality of each article we publish.