 Chenghai Wang
 Wen Zhao
 Yang Cui
95% of researchers rate our articles as excellent or good
Learn more about the work of our research integrity team to safeguard the quality of each article we publish.
Find out more
ORIGINAL RESEARCH article
Front. Earth Sci. , 07 July 2020
Sec. Atmospheric Science
Volume 8 - 2020 | https://doi.org/10.3389/feart.2020.00270
The Qinghai-Tibet Plateau (QTP) has the largest extent of high altitude permafrost at the middle and low latitudes in northern hemisphere and is surrounded by dozens of seasonally frozen ground. Rising air temperatures have resulted in frozen ground degradation over QTP since the last century. Based on the daily frozen soil depth, annual mean daily minimum air temperatures and annual mean air temperatures obtained from 19 in-situ observations over QTP, the changes in the thickness, temporal and spatial distributions of frozen ground, as well as the associated attributions, are analyzed for the period of 1960–2019. The results show that the maximum depth of frost penetration, the beginning time of soil freezing and the ending time of soil thawing have changed considerably. On average, the maximum depth of frost penetration (MDFP) has reduced by 0.14∼1.71 m at most stations. The annual frozen period has decreased by about 40 days. The changes in seasonal freezing of soils appear to be attributed to the rising of minimum air temperatures in winter, especially at the higher elevations range from 4500 to 5000 m.
Frozen ground is one of the consequences of the alternation between cold and warm climate status, it is very sensitive to climate change. During the past several decades, studies of frozen ground indicated that significant changes were occurring in the distribution and temperature of both permafrost and seasonally frozen ground (SFG) in the northern hemisphere including the Qinghai-Tibet Plateau (QTP) (e.g., Wang, 1993; Serreze et al., 2000; Wang et al., 2000, 2015, 2017a, 2019; Zhao et al., 2004; Cheng and Wu, 2007; Shi and Wang, 2015; Kong and Wang, 2017; Wang and Yang, 2018; Yang et al., 2018). Such changes are the products of substantial changes in the energy and moisture fluxes between the land and the atmosphere (Yang et al., 2018; Wang et al., 2019). They, in turn, are the results of changes in the climate systems at both regional and global scales (Smith and Burgess, 1999; Nelson et al., 2001; Yang et al., 2018).
Since 1967, seasonally frozen depth (SFD) has thinned by 5 cm, with an average rate of 0.7 cm/year over the eastern QTP (Zhao et al., 2004), and the maximum depth of frost penetration (MDFP) also shows a decreasing trend over the QTP since 1980s (Wang et al., 2001), and decreases by up to 33 cm since the middle of 1980s (Li et al., 2009). The observation also suggested that the beginning date of soil freezing becomes later, and the beginning date of soil thawing becomes earlier (Gao et al., 2008), which all confirmed that frozen ground over the QTP degraded gradually.
Previous studies on frozen ground mainly focused on permafrost changes and their climate impacts (Wang et al., 2003, 2017b; Yi et al., 2014; Yang et al., 2016; Yang and Wang, 2019a, b). In this study, the in-situ observed maximum depth of frost penetration (MDFP) over QTP from 1960 to present are used to analyze the temporal and spatial characteristics of seasonally thawing depth over QTP. Besides, the mechanisms associated with the changing seasonally thawing depth will also be investigated.
The next section provides informations on the research domain and data. Section “Results” shows the diagnose results regarding the temporal and spatial characteristics and variations of seasonally frozen ground during 1960–2019. Discussion and conclusions are the last two sections.
In this study, 19 in-situ observations are selected, which are located over the eastern and southern QTP (Figure 1). The data includes the daily frozen soil depth recorded once a day, and annual mean of daily minimum air temperatures and annual mean air temperatures (air temperatures are observed at 1.5 m above ground level). The observation of frozen soil begins once the surface temperature reaches to or is below 0°C. The above observations, which cover the period 1960–2019, are obtained from China Meteorology Administration (CMA), have been carefully examined after quality control, before the analysis of this study. The completion of observation data is more than 99%, the missing data are not used in the analysis. Therefore, the observations used in this study should be reliable.
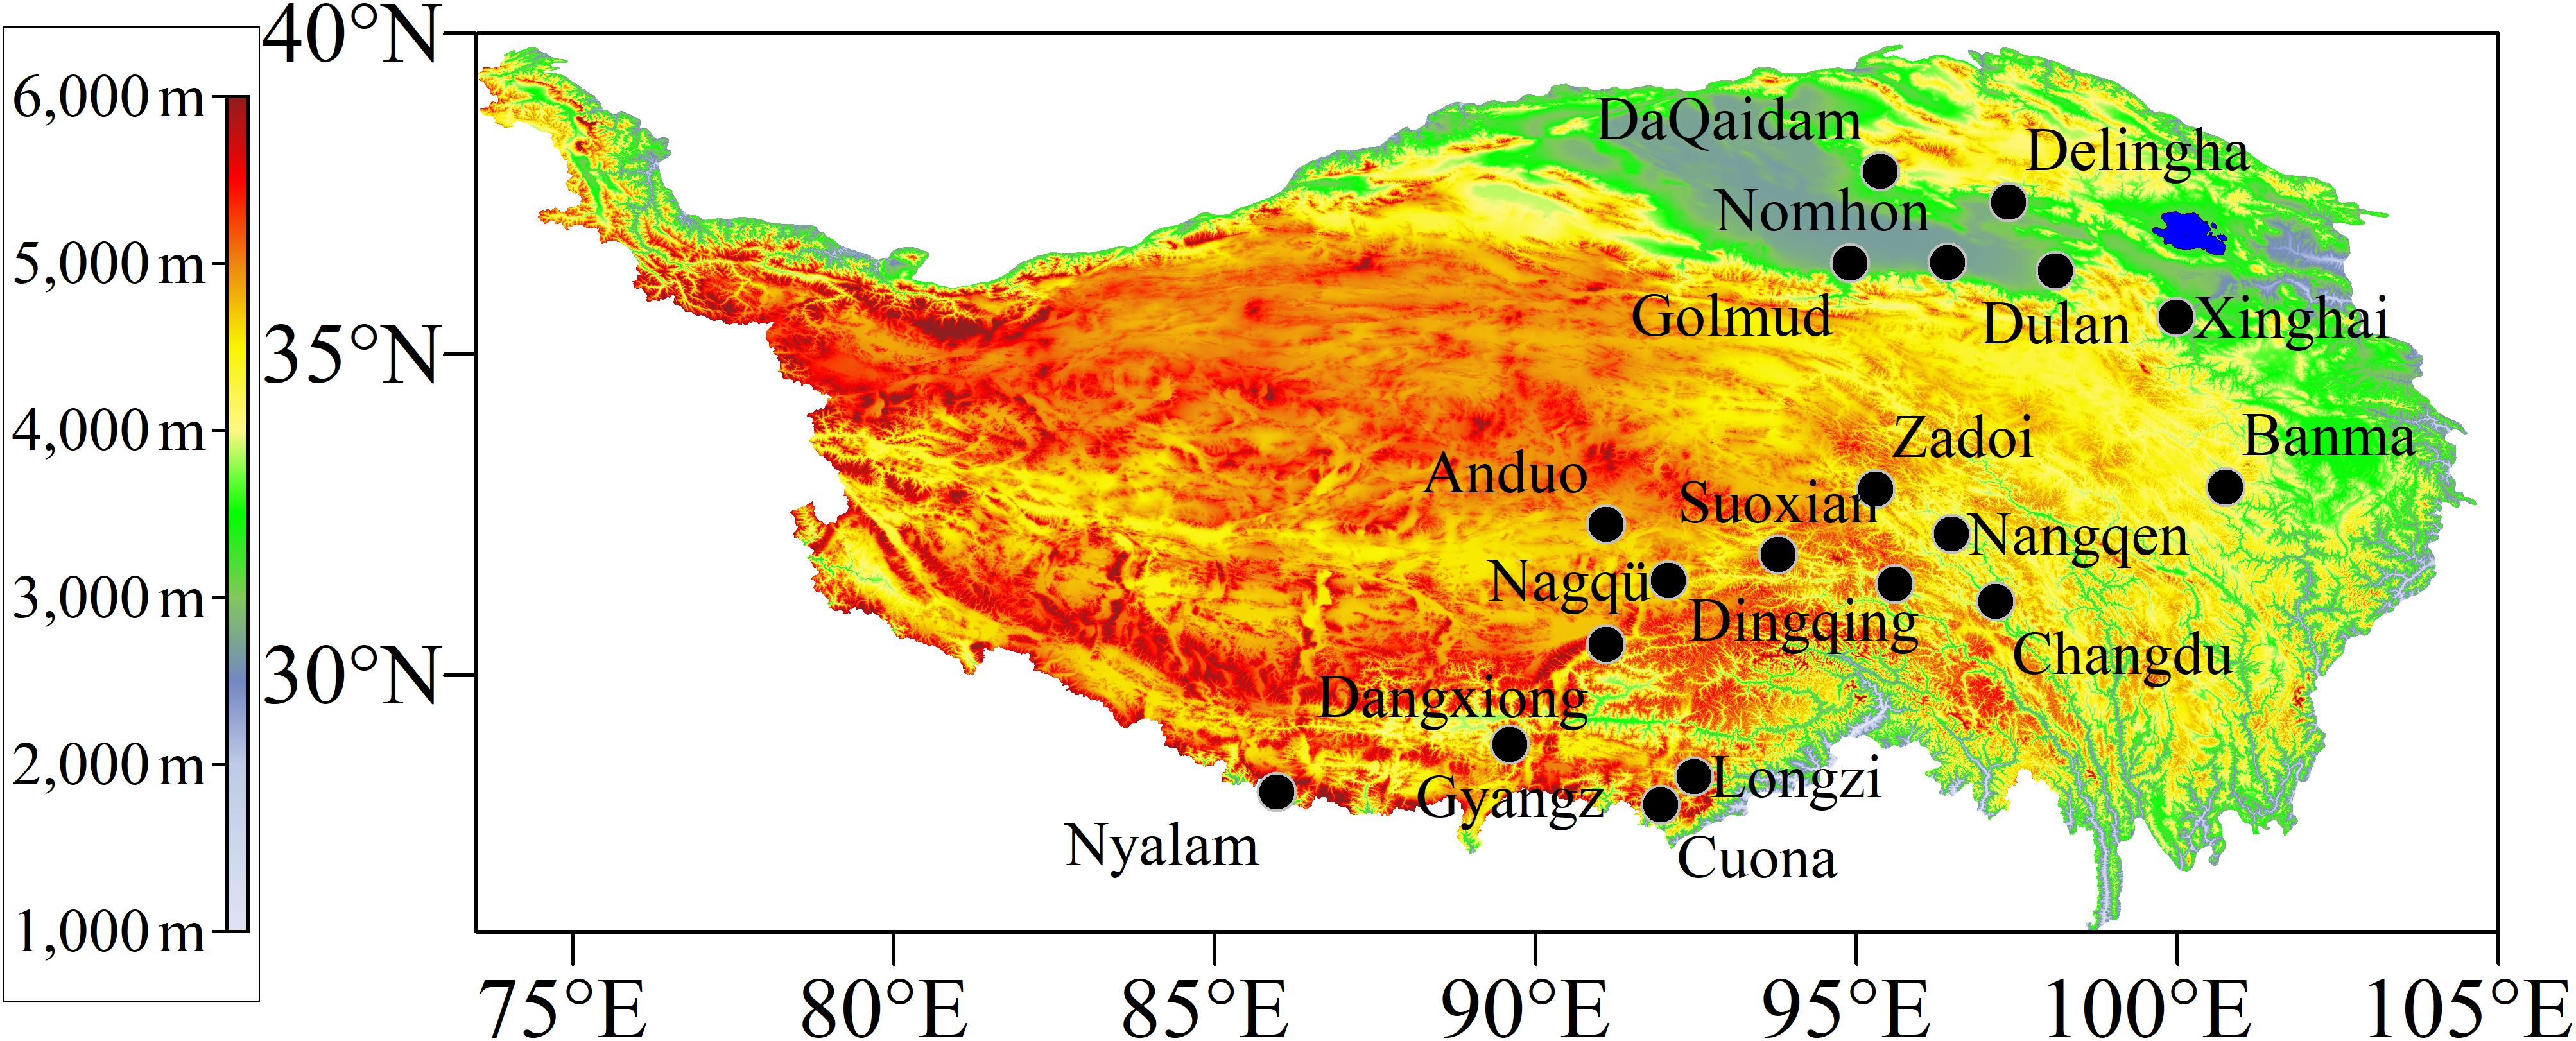
Figure 1. Distribution of the 19 in-situ observations used in this study.
Pearson correlation coefficients were used to explore the relationship between de-trended MDFP and temperature data. The linear trend of frost data and temperature data used in the study are based on linear least-squares regression. The significance test of the correlation and trend analysis are based on Student’s t-test. The de-trended data series is obtained by removing the best straight-line fit from original data series.
Figure 2 shows the onset date of soil freezing, the date when ground thawed completely, the length of the period of soil frozen, and the maximum depth of soil frozen from 1960 to 2019. These quantities are usually regarded as the indicator for the changes of SFG. Results indicate that, the freezing date of the ground surface starts earlier in the northern and western QTP than in the southern slopes of the QTP. In general, the thawing of ground starts earlier in the southern and eastern QTP. As a result, the period during which the ground is frozen in the basin is similar to that recorded on the southern and eastern flanks of the QTP. MDFP decreases southwards except in the northern basins at lower elevations, basically parallel to the distribution of mean annual air temperature (MAAT) (Li et al., 2009). Overall results in Figure 2 suggest that, the related SFG indicators all have changed, but have spatial discrepancies due to the impacts of terrain elevations and climate conditions, the average onset date of soil freezing, date when soil thawed completely, length of soil frozen period, and maximum depth of soil frozen from 1960 to 2019 for all 19 stations are October 16, April 24, 190 days and 105 cm, respectively. Detailed descriptions about changes of each indicator will be given in the following sections.
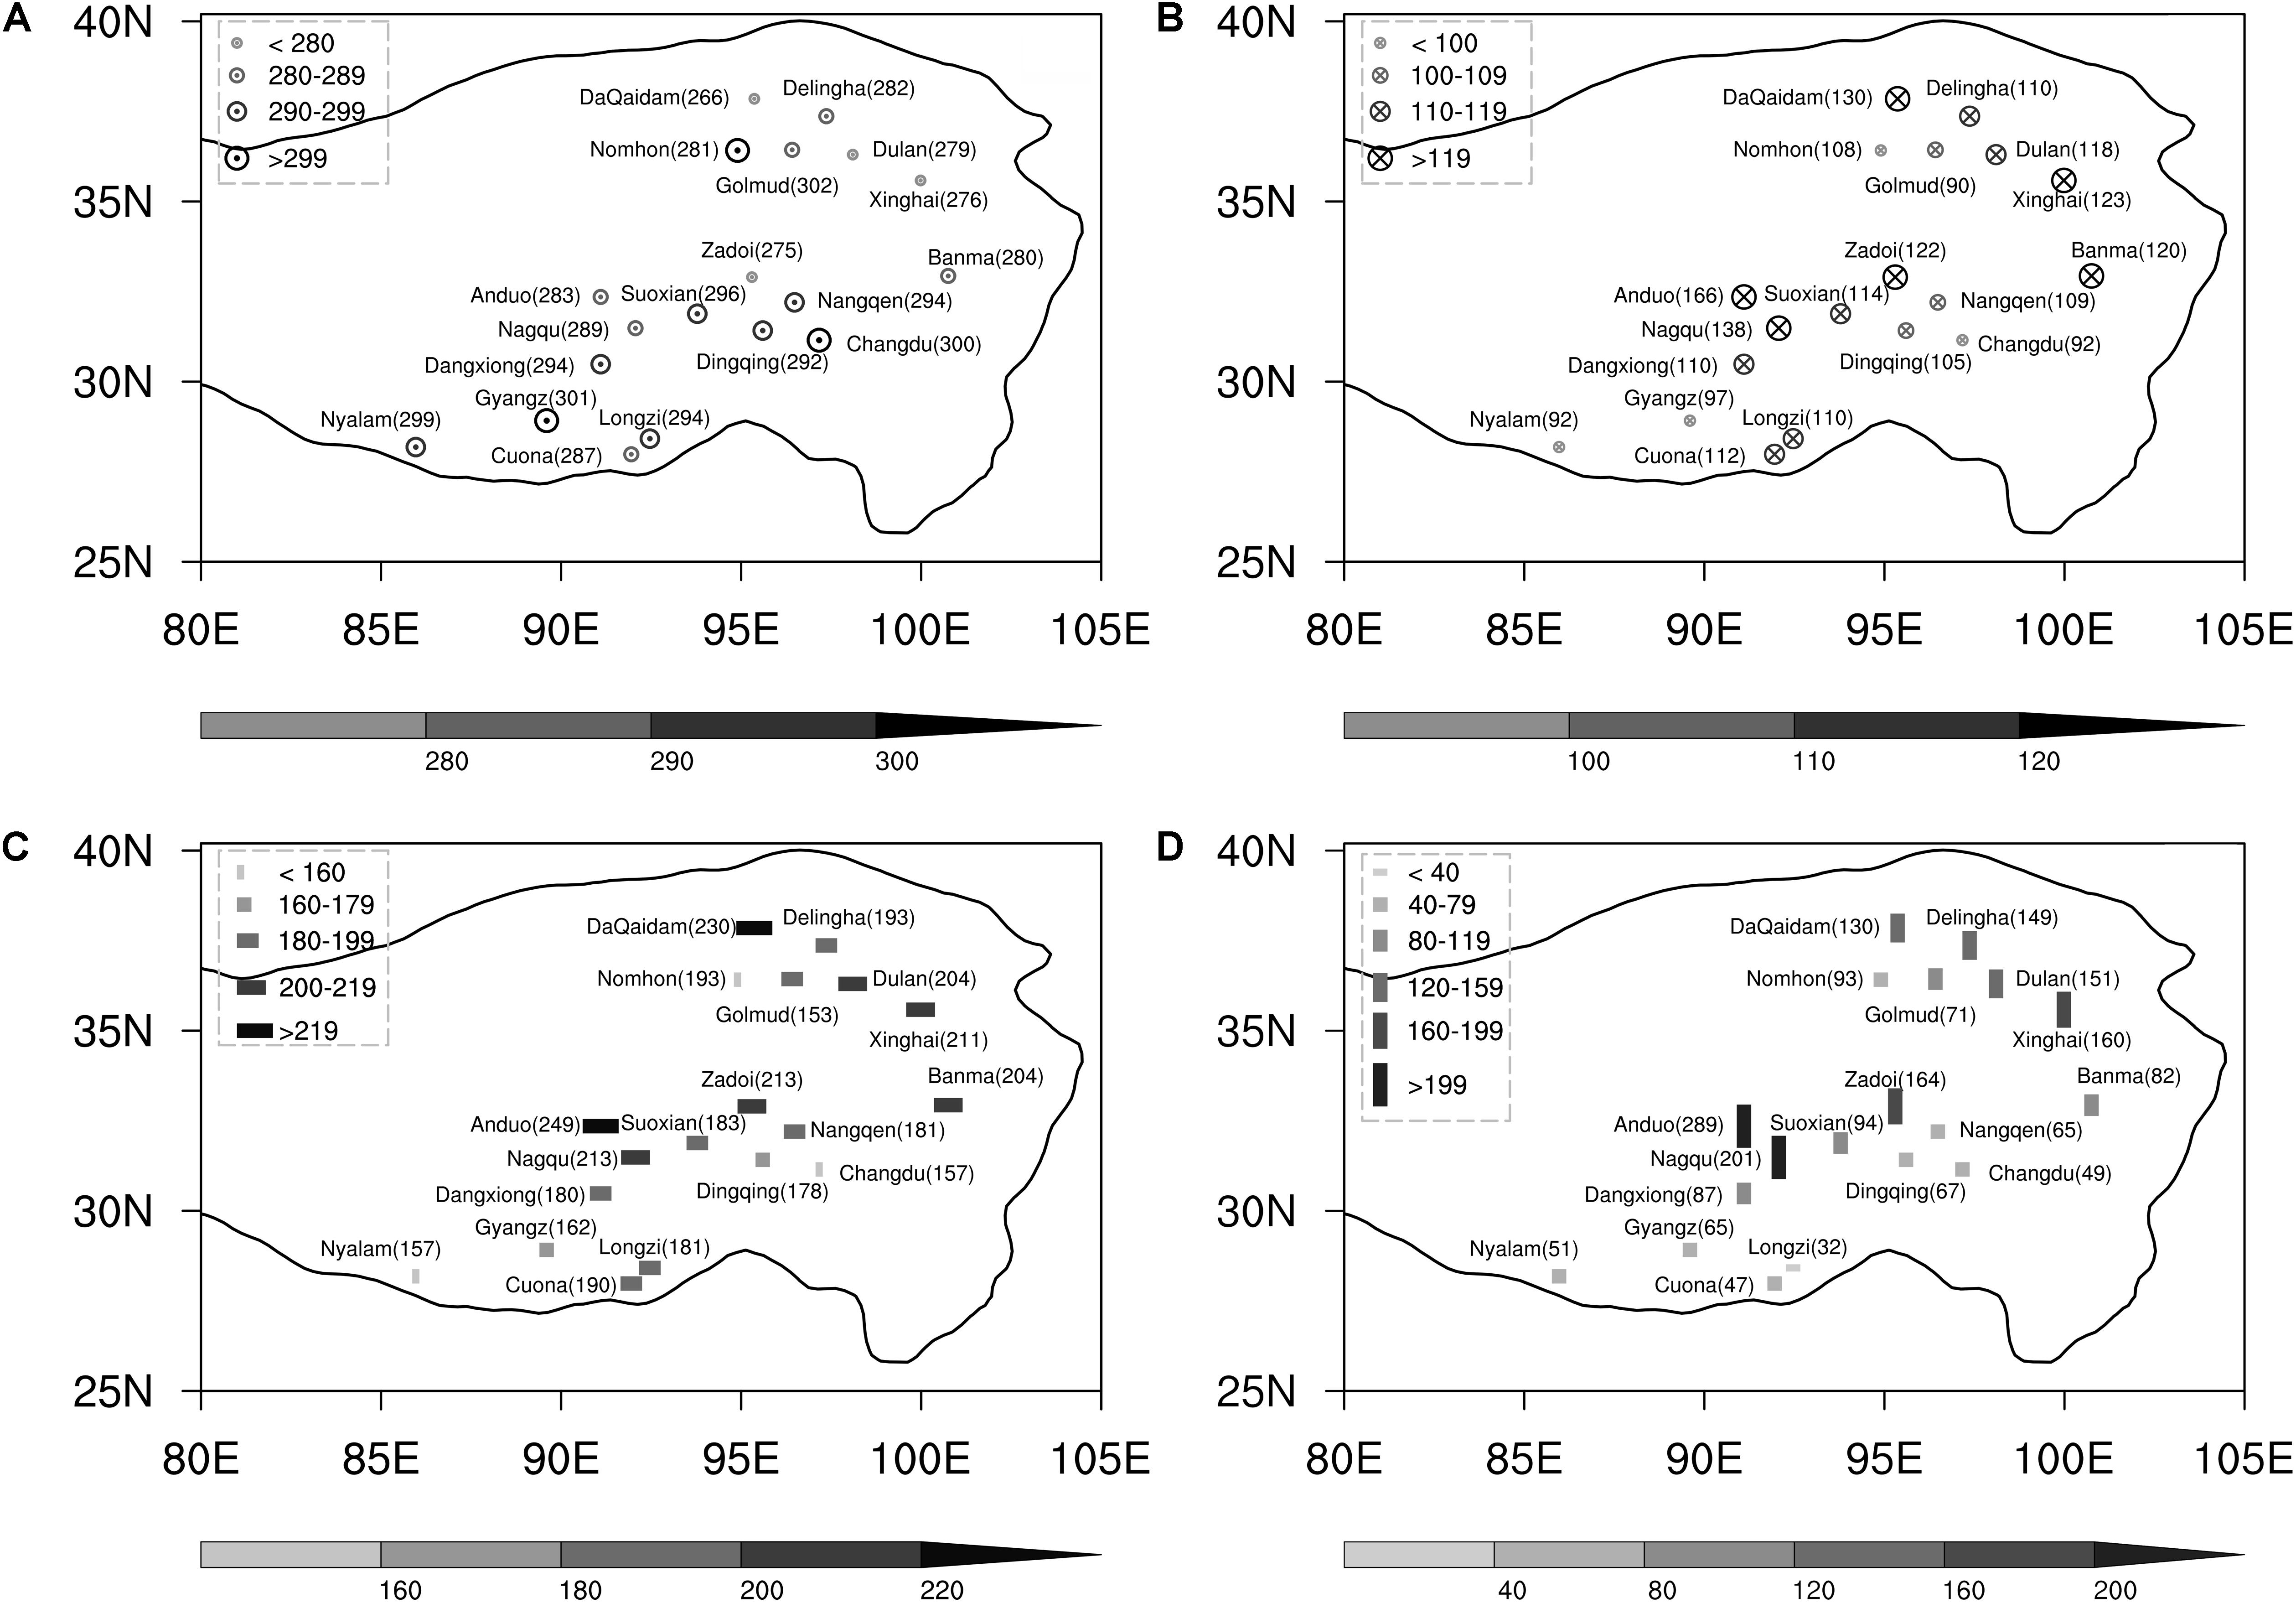
Figure 2. Annual mean (A) onset date of soil freezing (unit: day), (B) the date when ground thawed completely (unit: day), (C) the length of the period of soil frozen (unit: day), (D) the maximum depth of soil frozen (unit: cm) from 1960 to 2019. The numbers in Figures. (A–C) represent the order of the day start from 01 January.
All the observation sites are located on flat areas, either in a basin or on a plateau surface, without substantial discrepancies in the elevations. Figure 3 shows the variations of the maximum depth of frost penetration during 1960–2019. Results indicate that the MDFP presents a decreasing trend at most stations, with a much greater decline at higher elevations. MDFP declined much more rapidly at most stations especially after 1995, compared to only a slight decrease between 1960 and 1995 (Table 3). The smallest MDFP of all stations was about 0.17 m for Changdu station in 2007. The averaged MDFP is 1.05 m for stations below 3000 m, with the decrease of 0.21 m during 1960 to 2019. At the stations above 4500 m, the changing of the MDFP is distinctly higher than other stations. During 1960–2019, the averaged MDFP decreased by 1.37 m above 4500 m, while decreased by 0.35 m below 4500 m. These results suggest that the variations of maximum depth of frost penetration are correlated to the higher elevations.
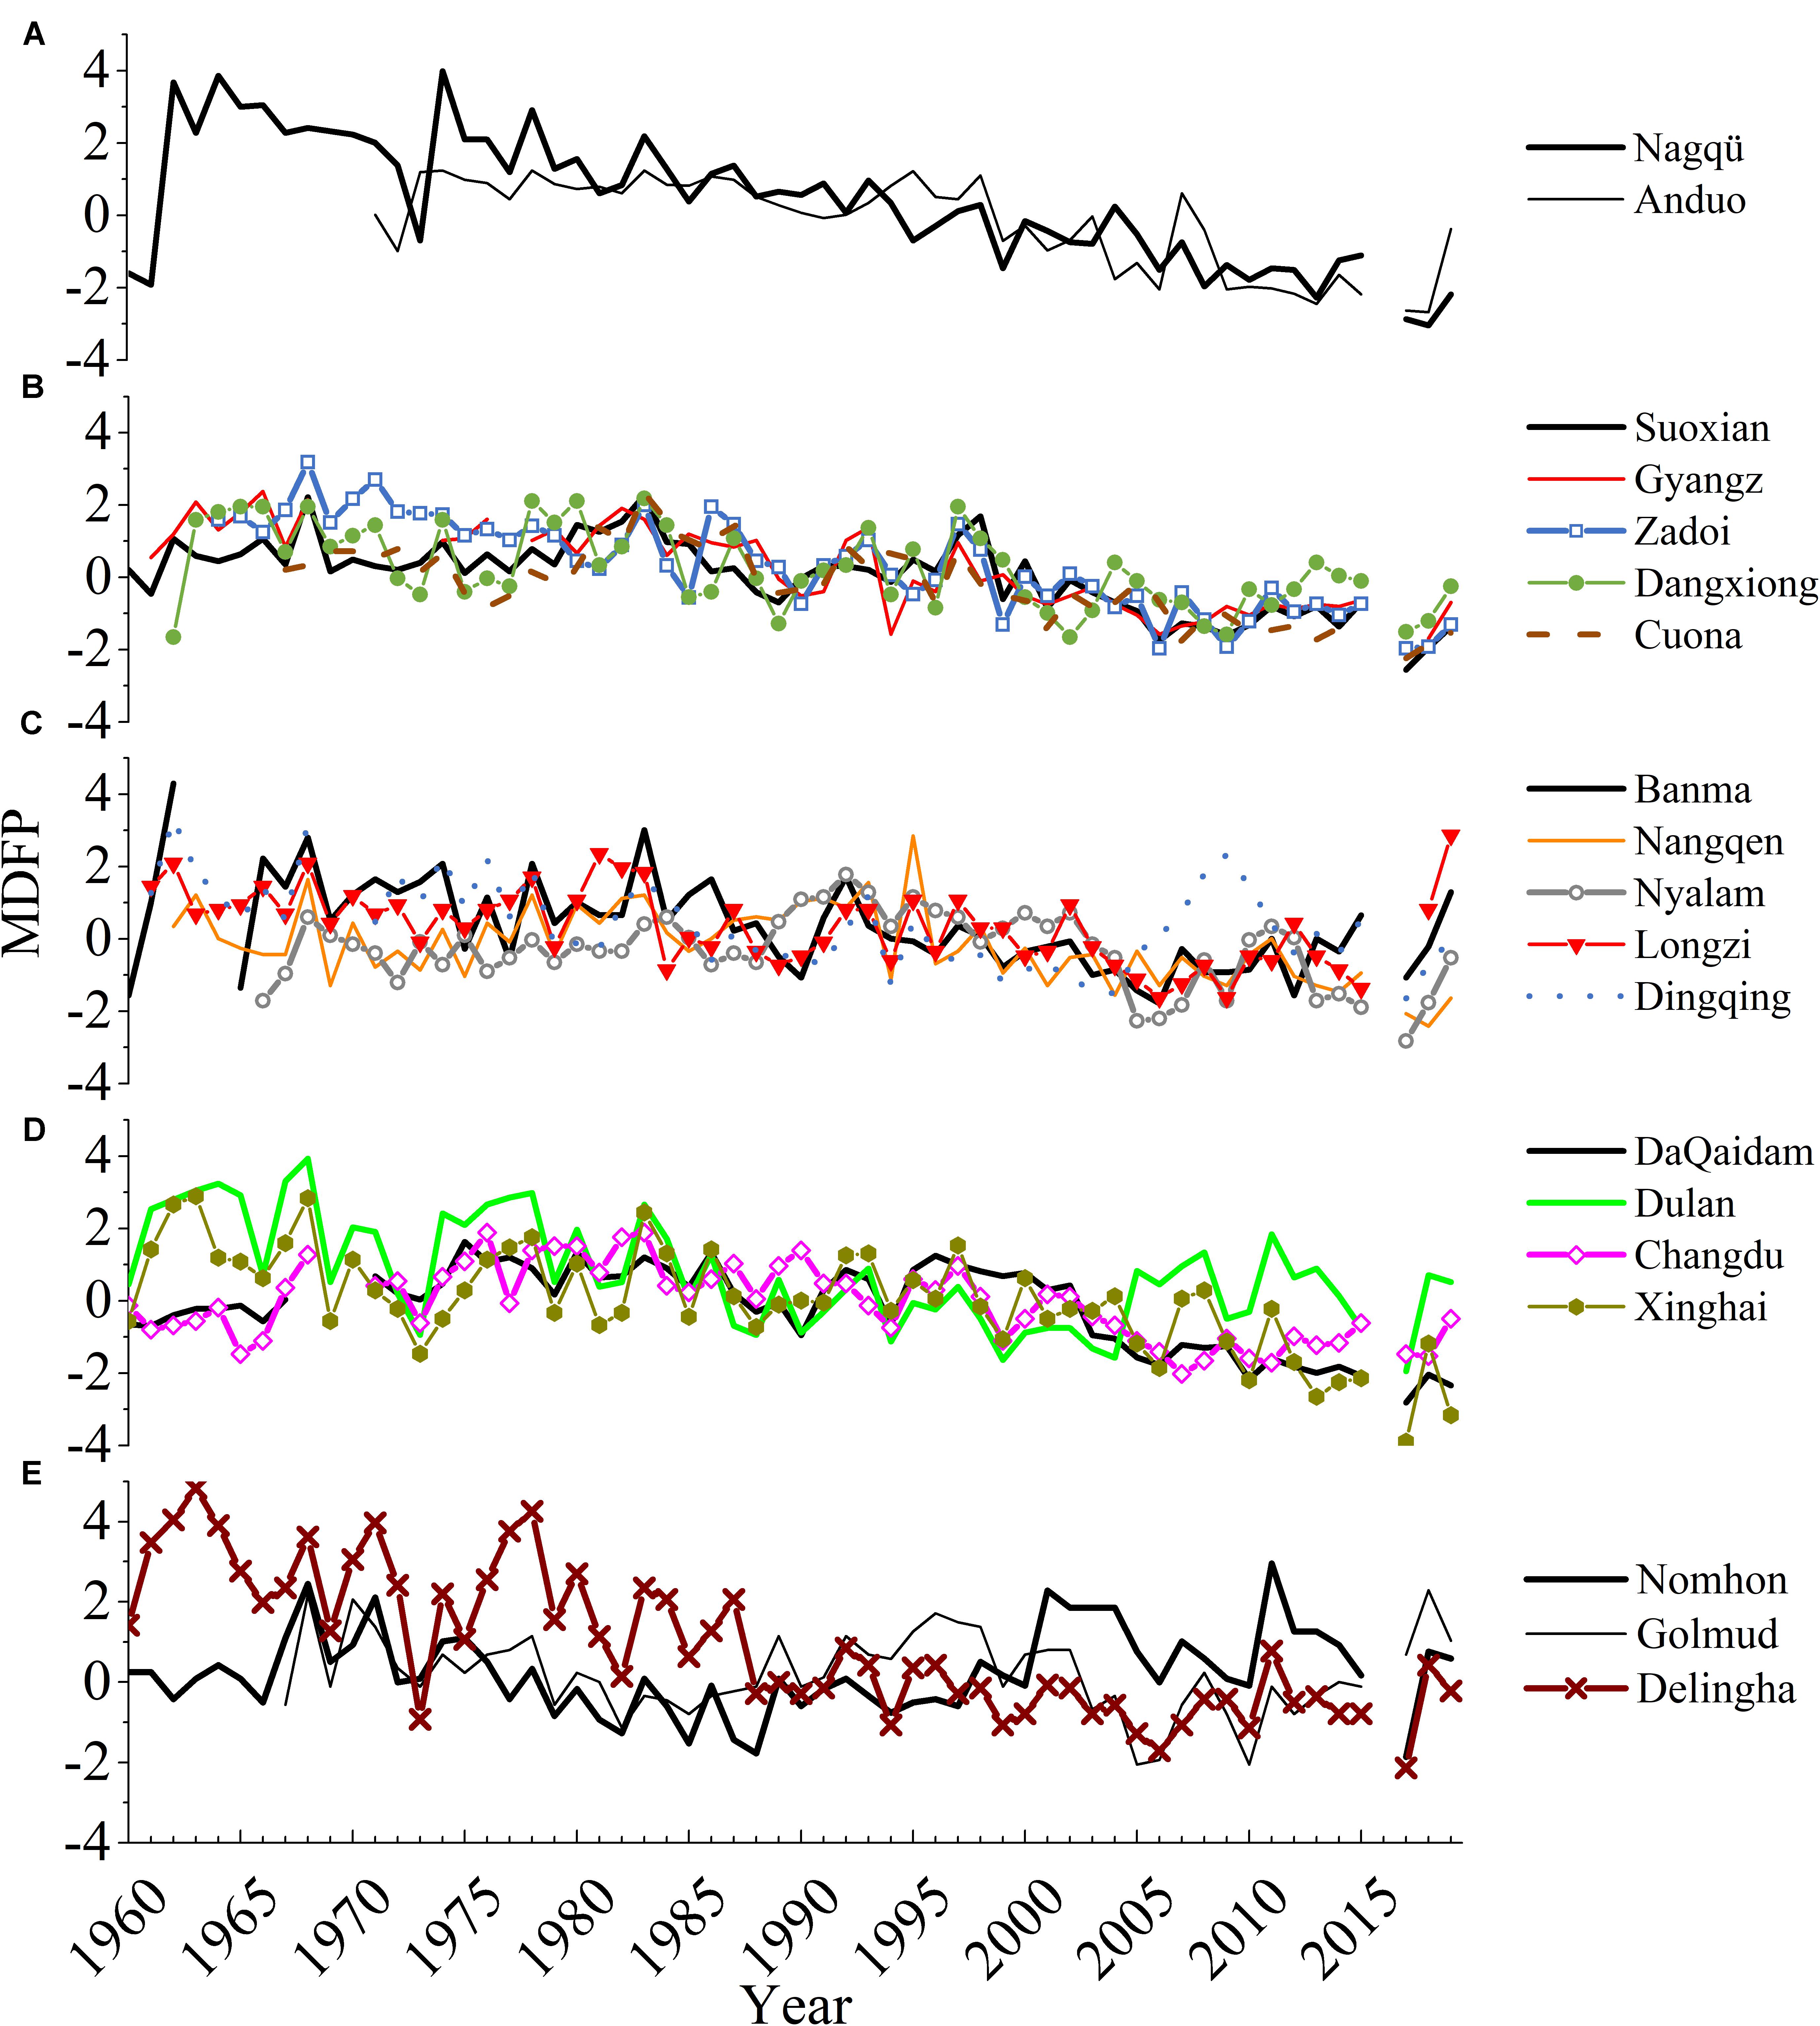
Figure 3. Time series of the maximum depth of frost penetration (normalized relative to 1981–2010) during 1960 to 2019 for (A) stations with the altitude between 4500 and 5000 m, (B) stations with the altitude between 4000 and 4500 m, (C) stations with the altitude between 3500 and 4000 m, (D) stations with the altitude between 3000 and 3500 m, and (E) stations with the altitude between 2500 and 3000 m.
Figure 4 shows the variations of the onset date of ground freezing during 1960–2019. Results indicate that the onset date of ground freezing delayed during the last 60 years. The earliest freezing date of all stations occurred on August 19 (Xinghai station in 1965) and the average onset date of ground freezing was around October 15 at 2500–3000 m, the averaged onset date of ground freezing of all stations delayed 31 days from 1960 to 2019 at 2500–3000 m, compared with 16 days above 4500 m over the same period. However, the ending date of soil thawing advanced earlier at most study sites (Figure 5). On average, the ending date of ground thawing was on April 14 at 2500–3000 m, and the averaged thawing date gradually delayed with the increase of altitude, the ending date of soil thawing occurred on June 1 above 4500 m. For instance, the averaged thawing date of all stations became earlier about 26 days from 1960–2019 at 2500–3000 m, with an range of 42 days above 4500 m. Overall results imply that the duration of ground freezing shortened, with a decline of 44 days from 1960 to 2019.
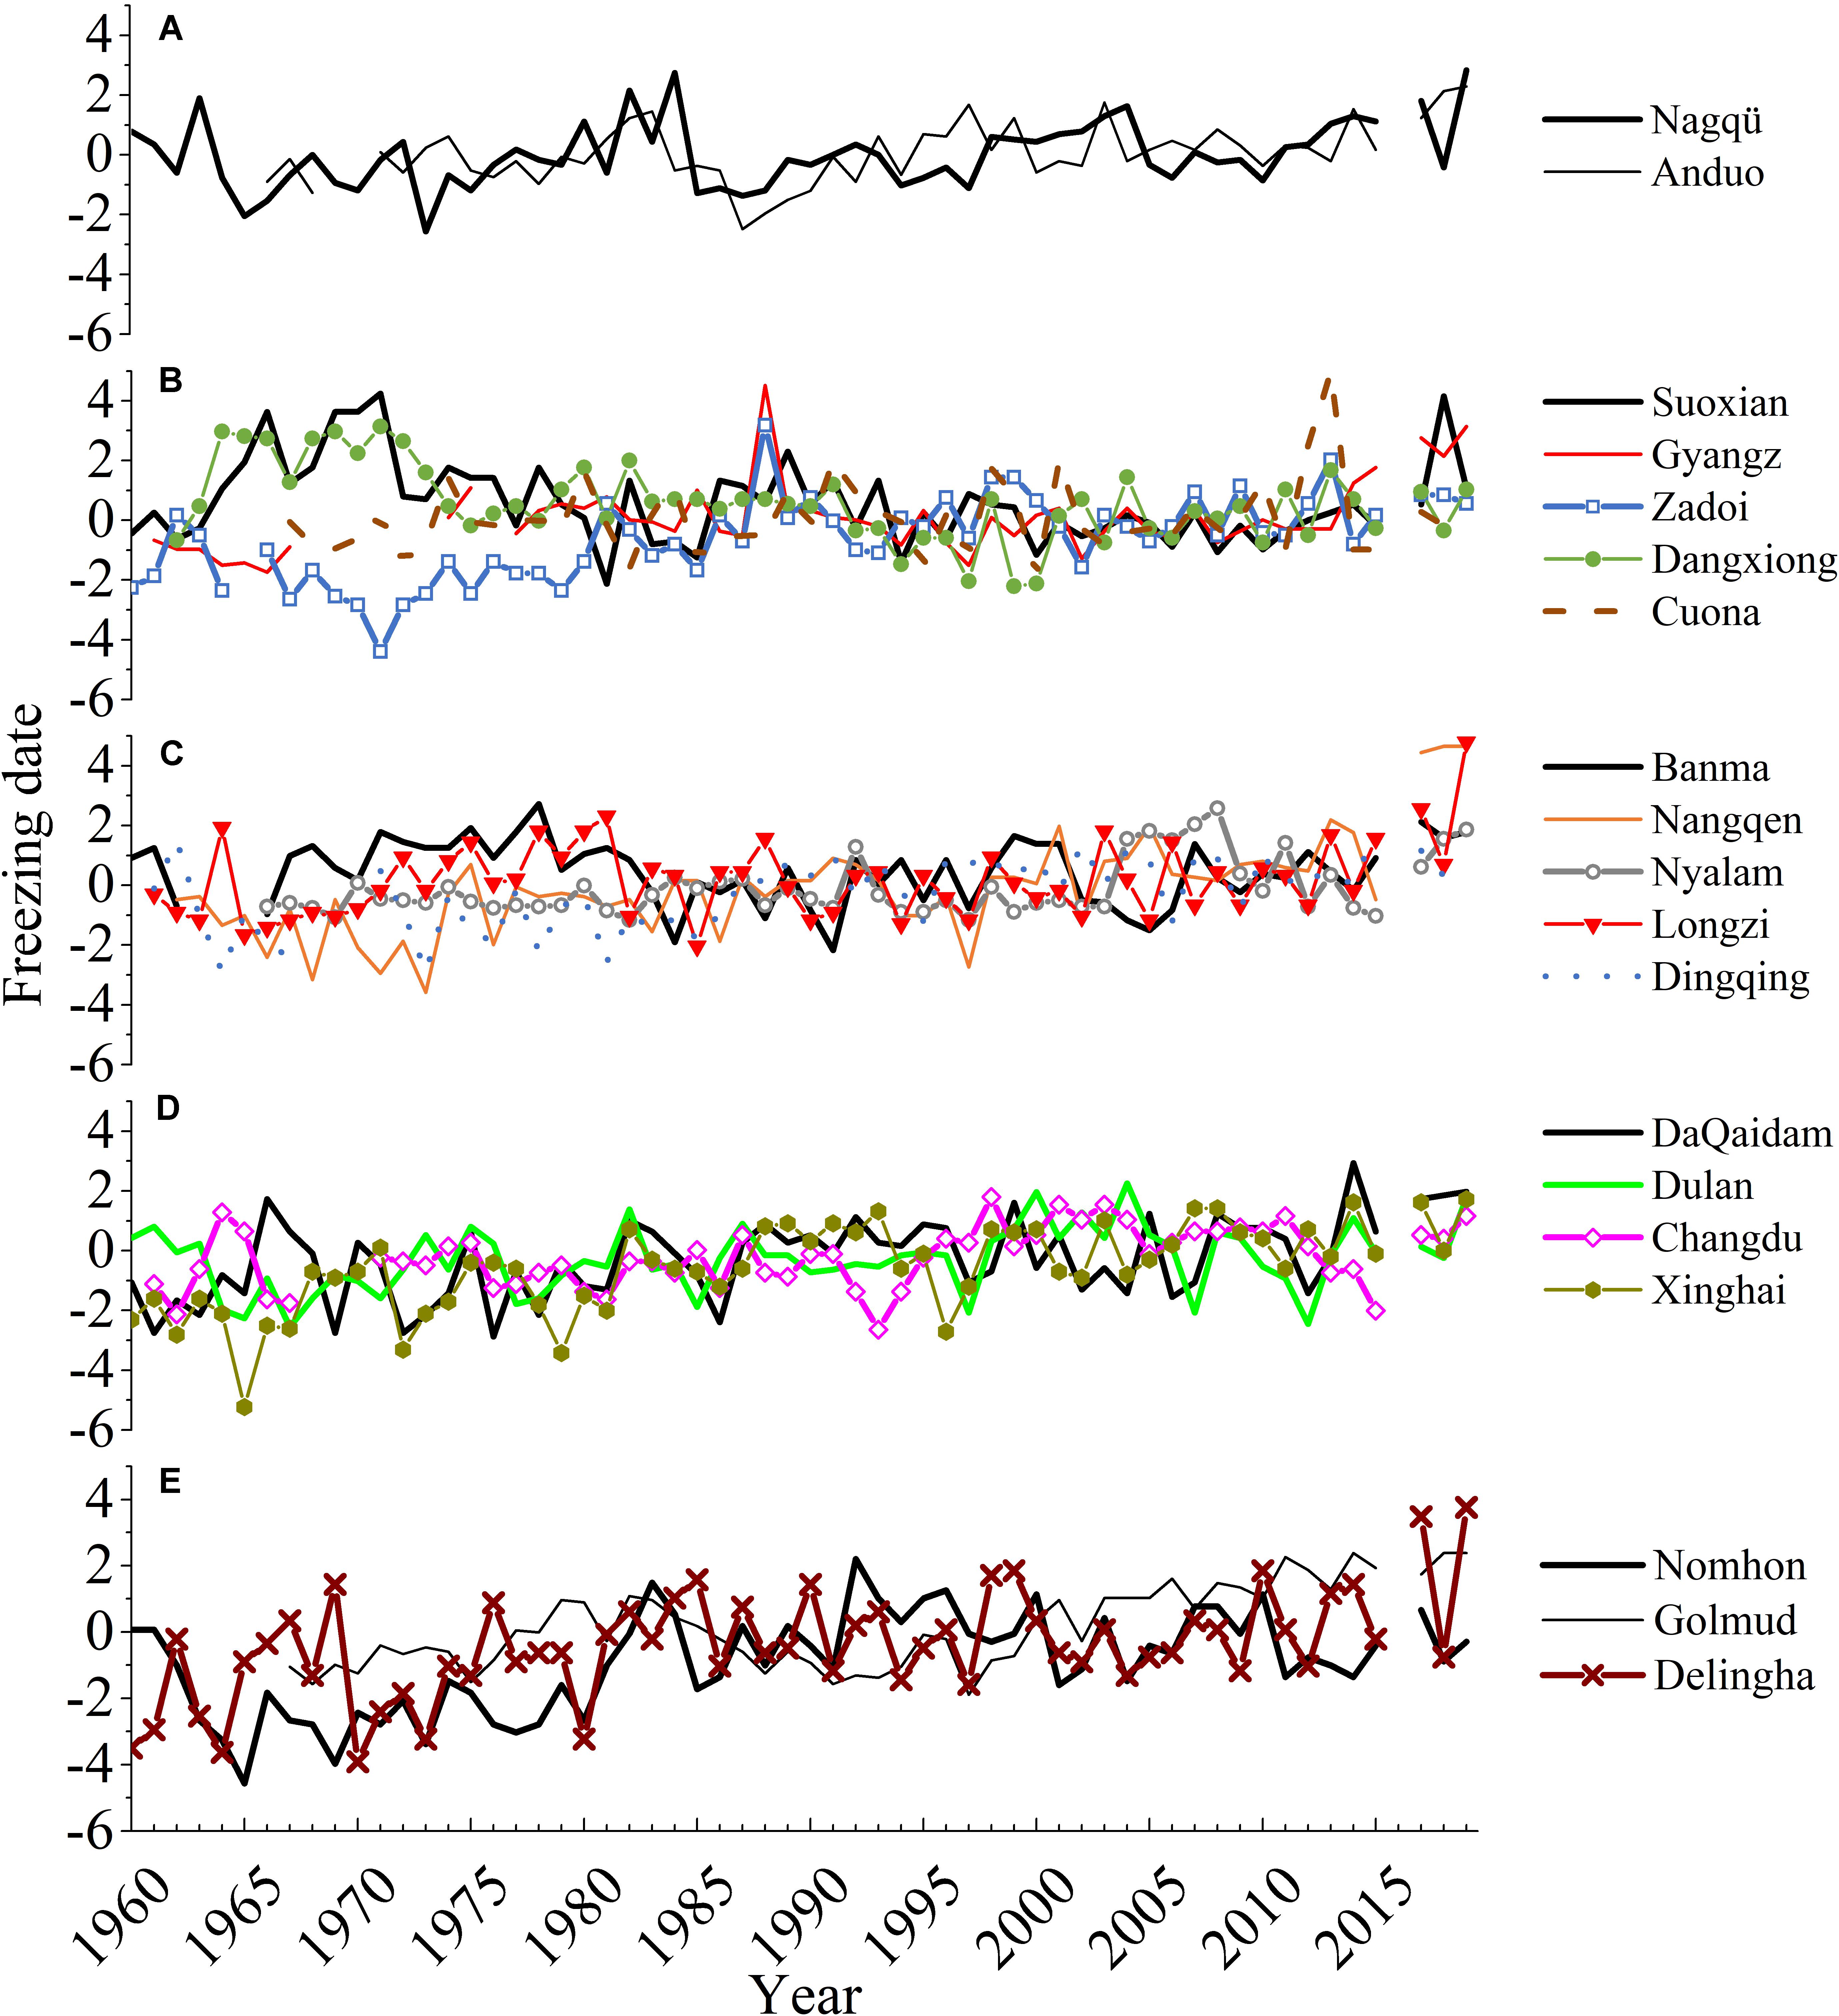
Figure 4. Similar to Figure 3, but for the onset date of ground freezing.
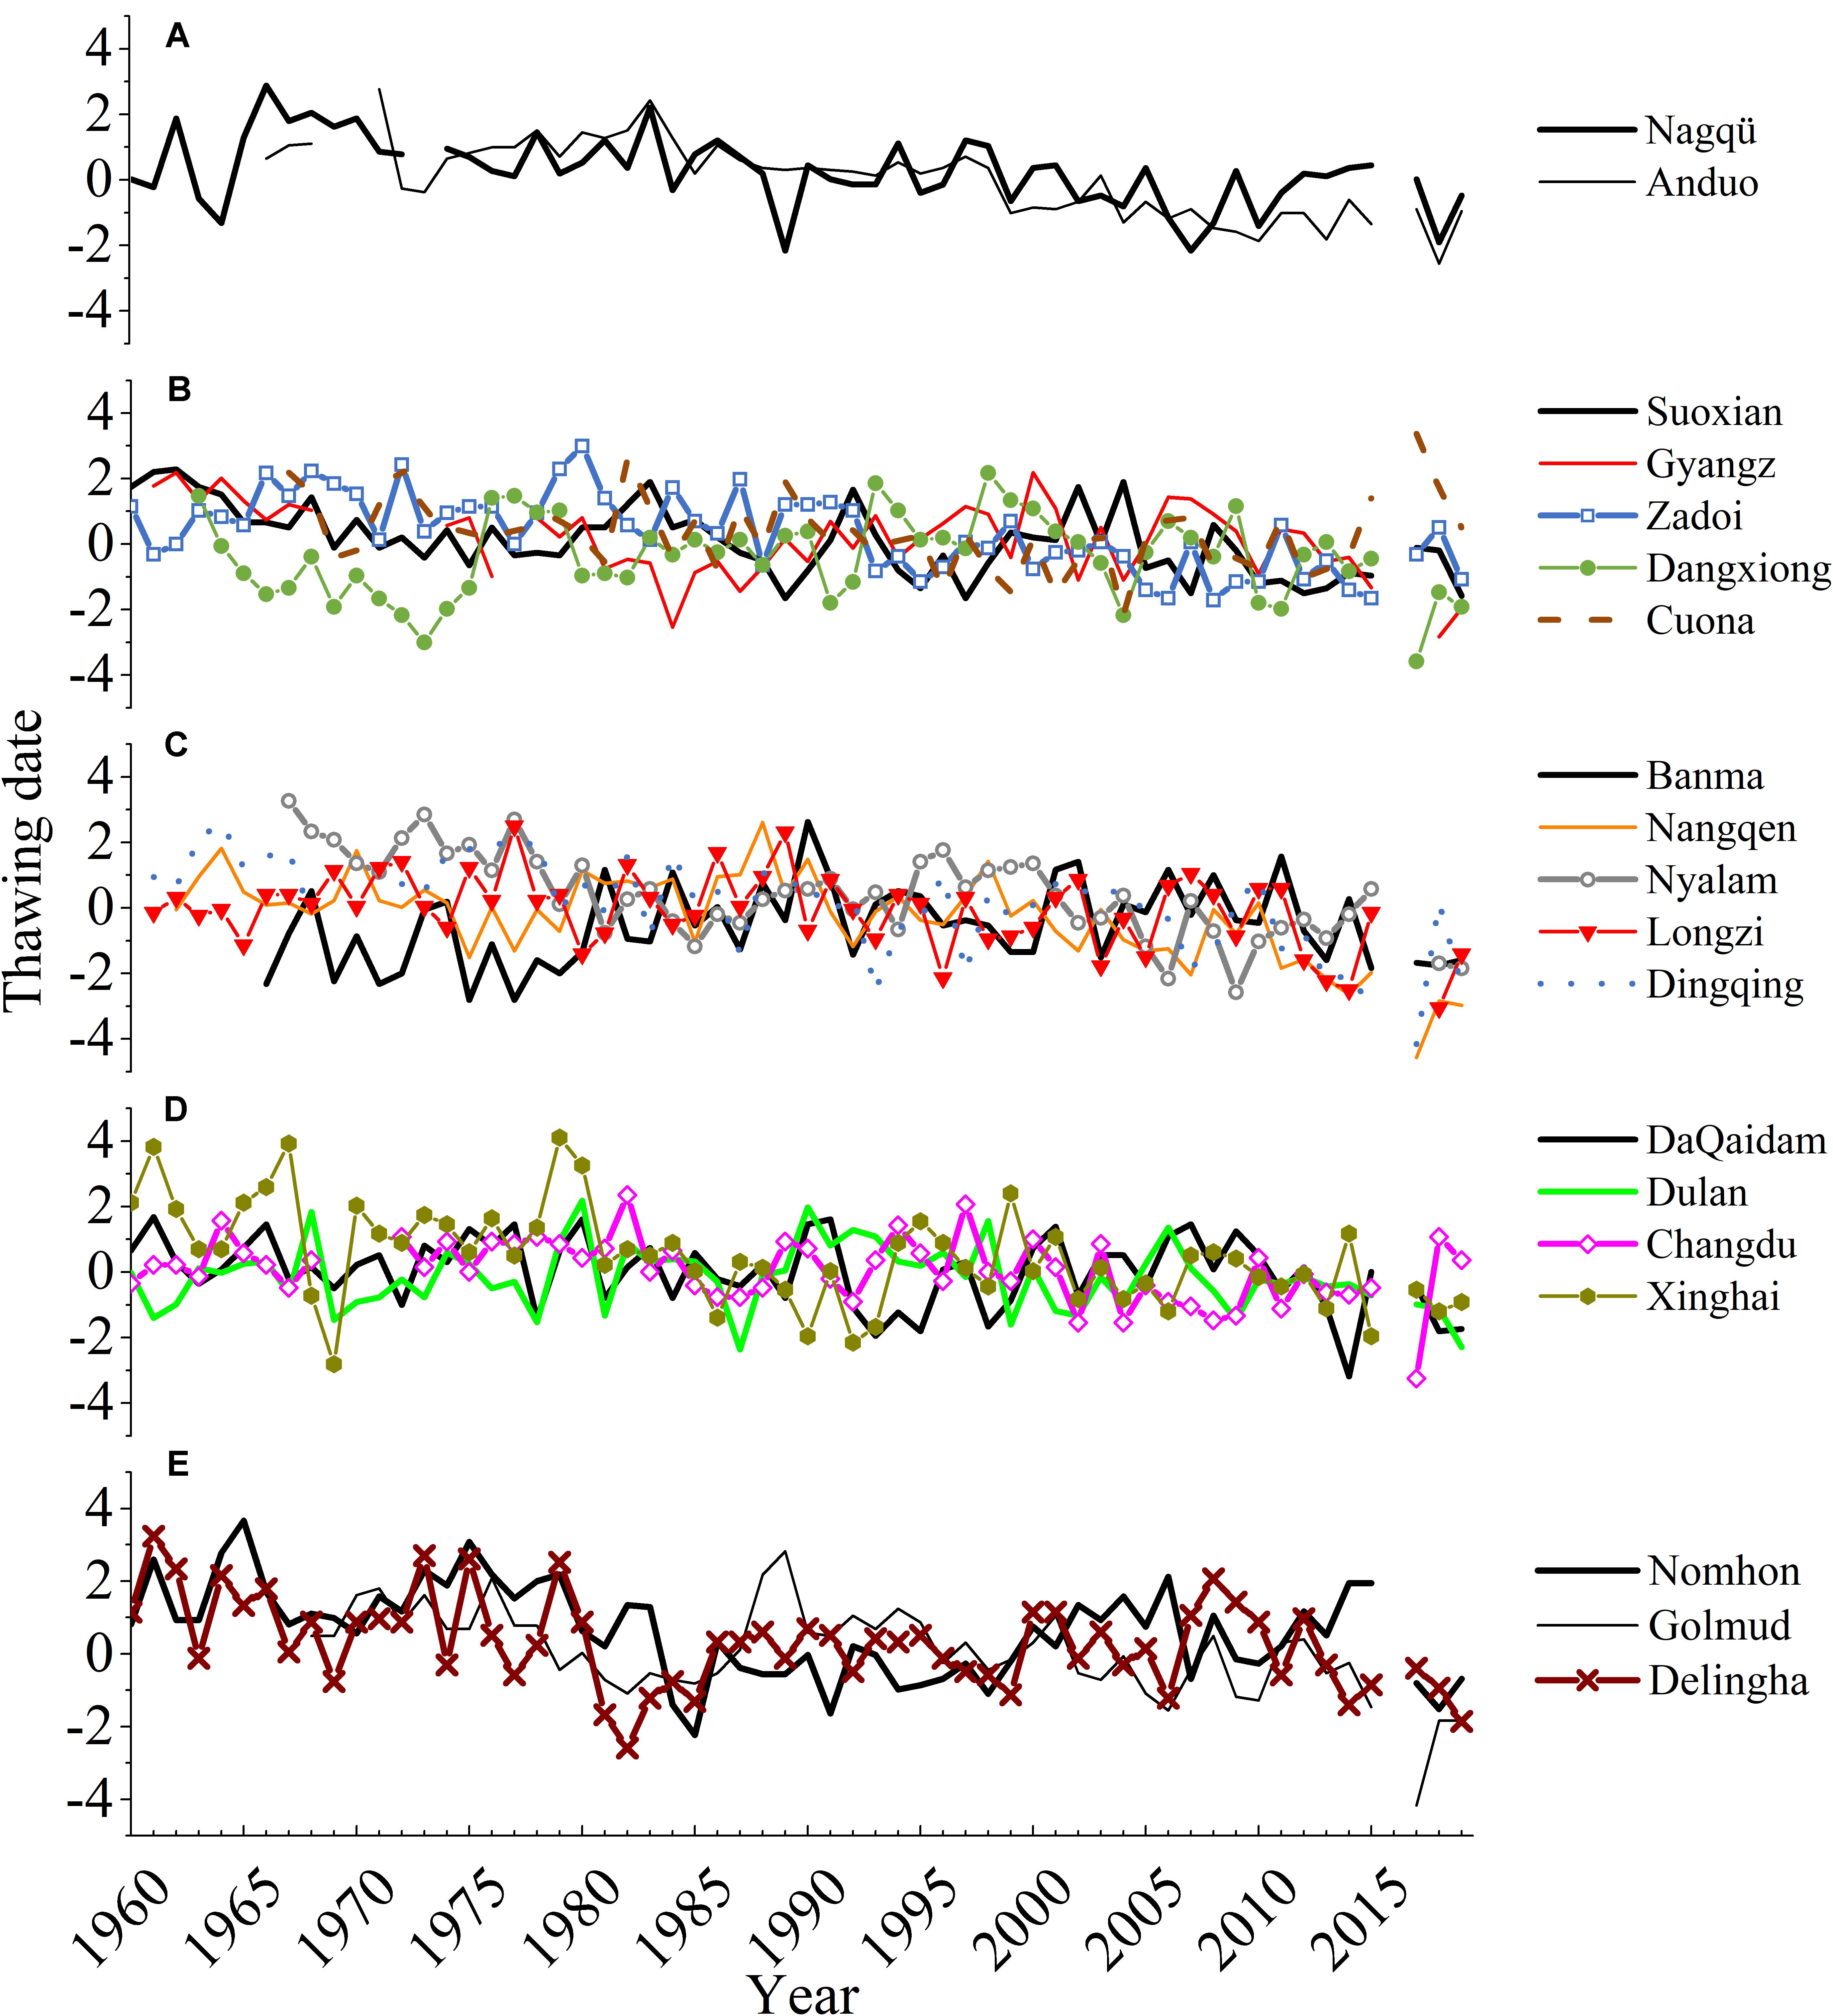
Figure 5. Similar to Figure 3, but for the date of disappearance of frost in the ground.
The correlation between SFD and annual minimum air temperature is calculated in Table 1. Results indicate that, almost all correlation coefficients pass the significant level at 99%. In general, mean daily minimum temperature has the best correlation with MDFP. Since the daily minimum temperature and annual minimum temperature commonly appears in the nighttime and in the winter, respectively, thus, these illustrate the decline of SFD over QTP in the past 60 years can be primarily attributed to the increasing temperature during the nighttime and the winter.
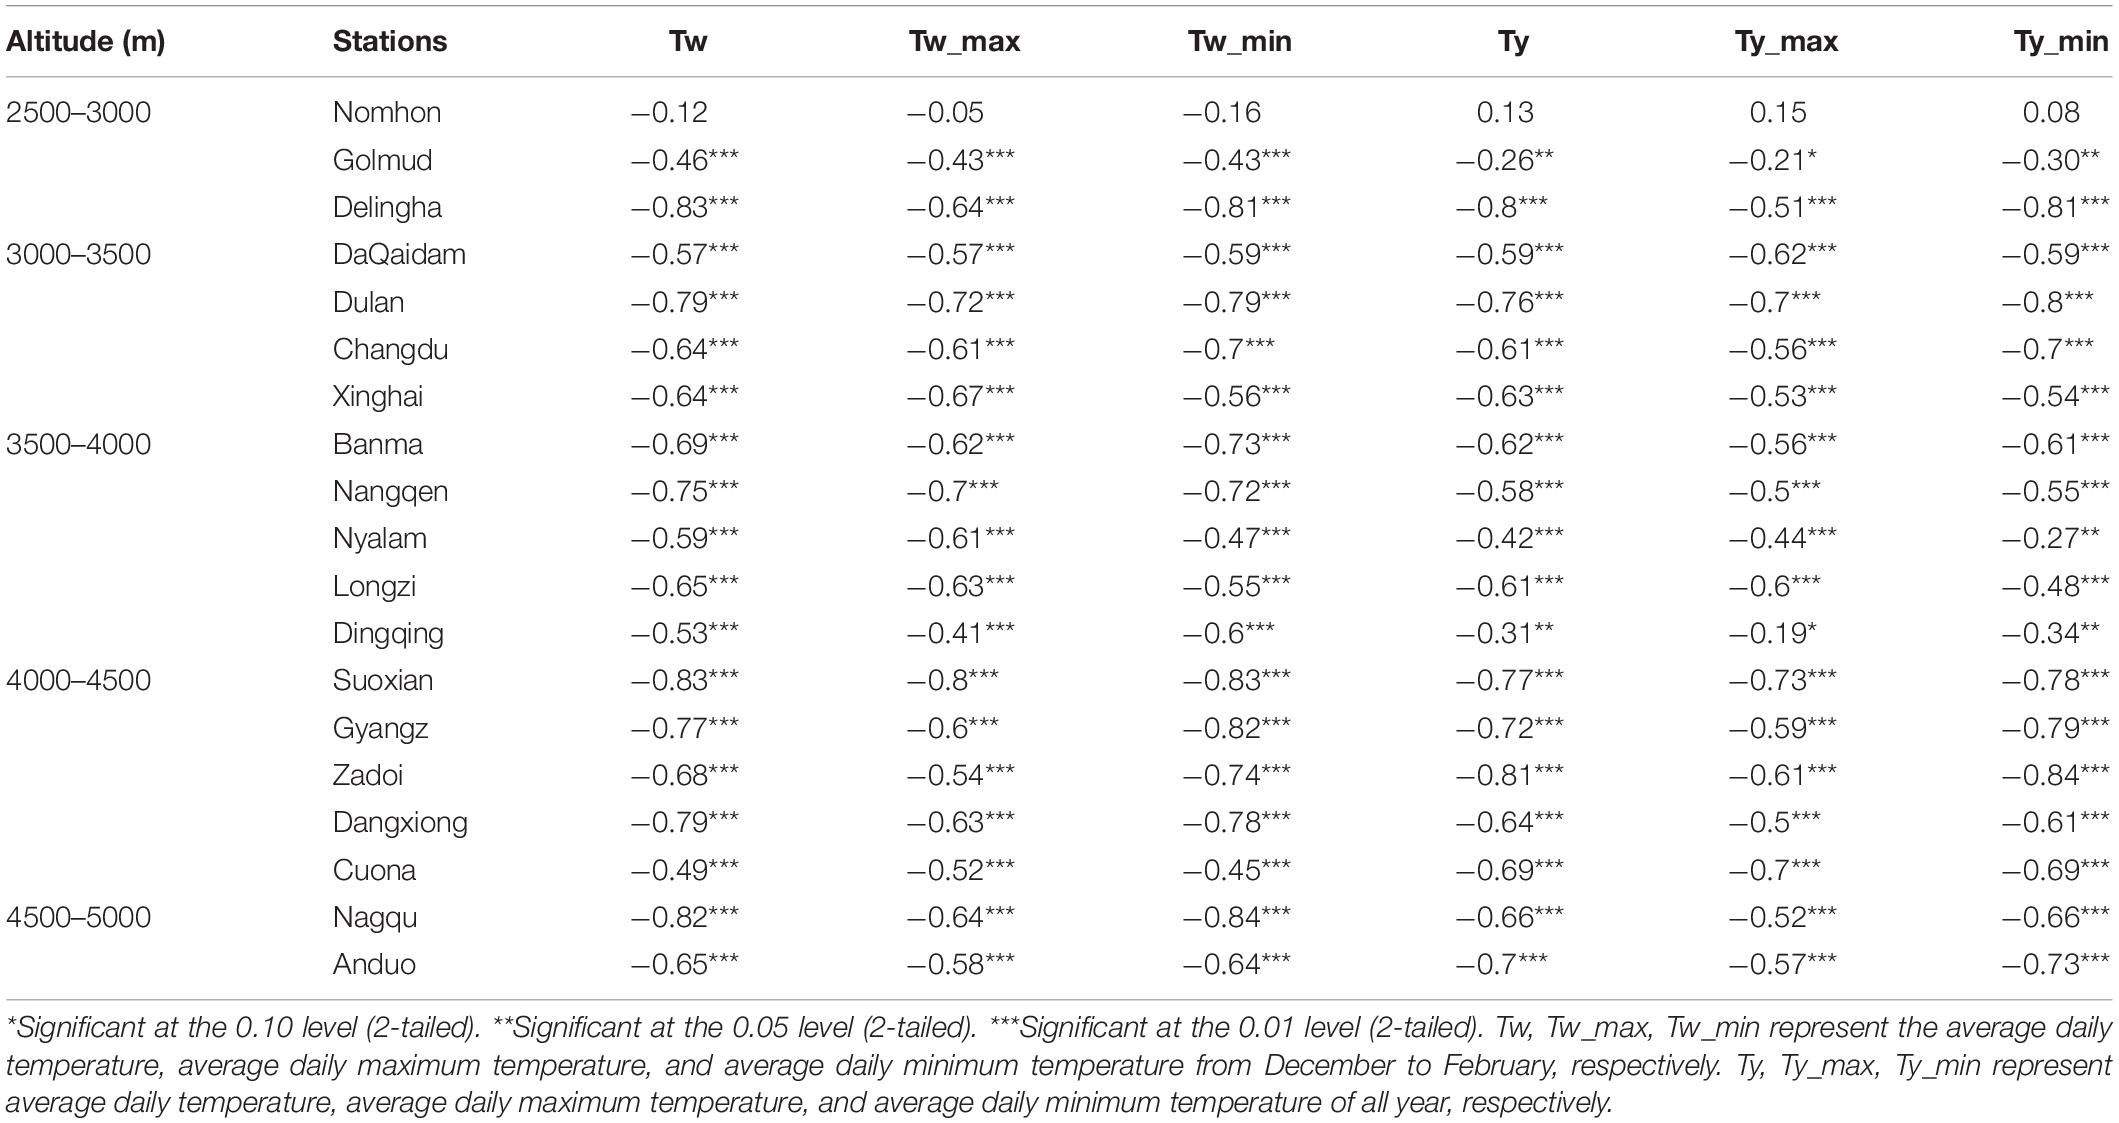
Table 1. Correlation coefficient between air temperature and maximum depth of frozen soil.
Changes in SFD over the QTP primarily attribute to the increasing air temperature. Figure 6 shows the changes in the MAAT and mean annual minimum air temperatures of 19 stations from 1960 to 2019. It indicates that the increasing trend of mean annual minimum temperature is larger than that of MAAT. The MAAT of the 19 stations increased by 1.8°C from 1960 to 2019, with an increasing trend of 0.3°C/decade. However, during the period of 1995–2019, the MAAT increased by 0.6°C. Similarly, mean annual minimum air temperature increased by 2.6 and 0.7°C during the period of 1960–2019 and 1995–2019, respectively. Overall results indicate that the mean annual minimum air temperature increases more rapidly than MAAT, implying that the MAAT will increase continuous. Simulation results of Coupled Model Inter-comparison Project Phase 5 (CMIP5) also suggest that the degradation of frozen ground will continue in the 21st century. Results of Table 2 indicate that, the mean annual minimum air temperatures present significant increasing trend (passes 95% confidence level). In particular, the increasing trend of mean annual minimum air temperatures at stations (Nagqü and Anduo) at higher altitude (4500–5000 m) is almost two times larger than other regions. Except for the stations at elevation of 4000–5000 m, the annual precipitation at most stations present significant increasing trend and passes 95% confidence level. These results suggest that the changes in mean annual minimum air temperature are more significant than MAAT, especially when the altitude is higher than 4500 m.
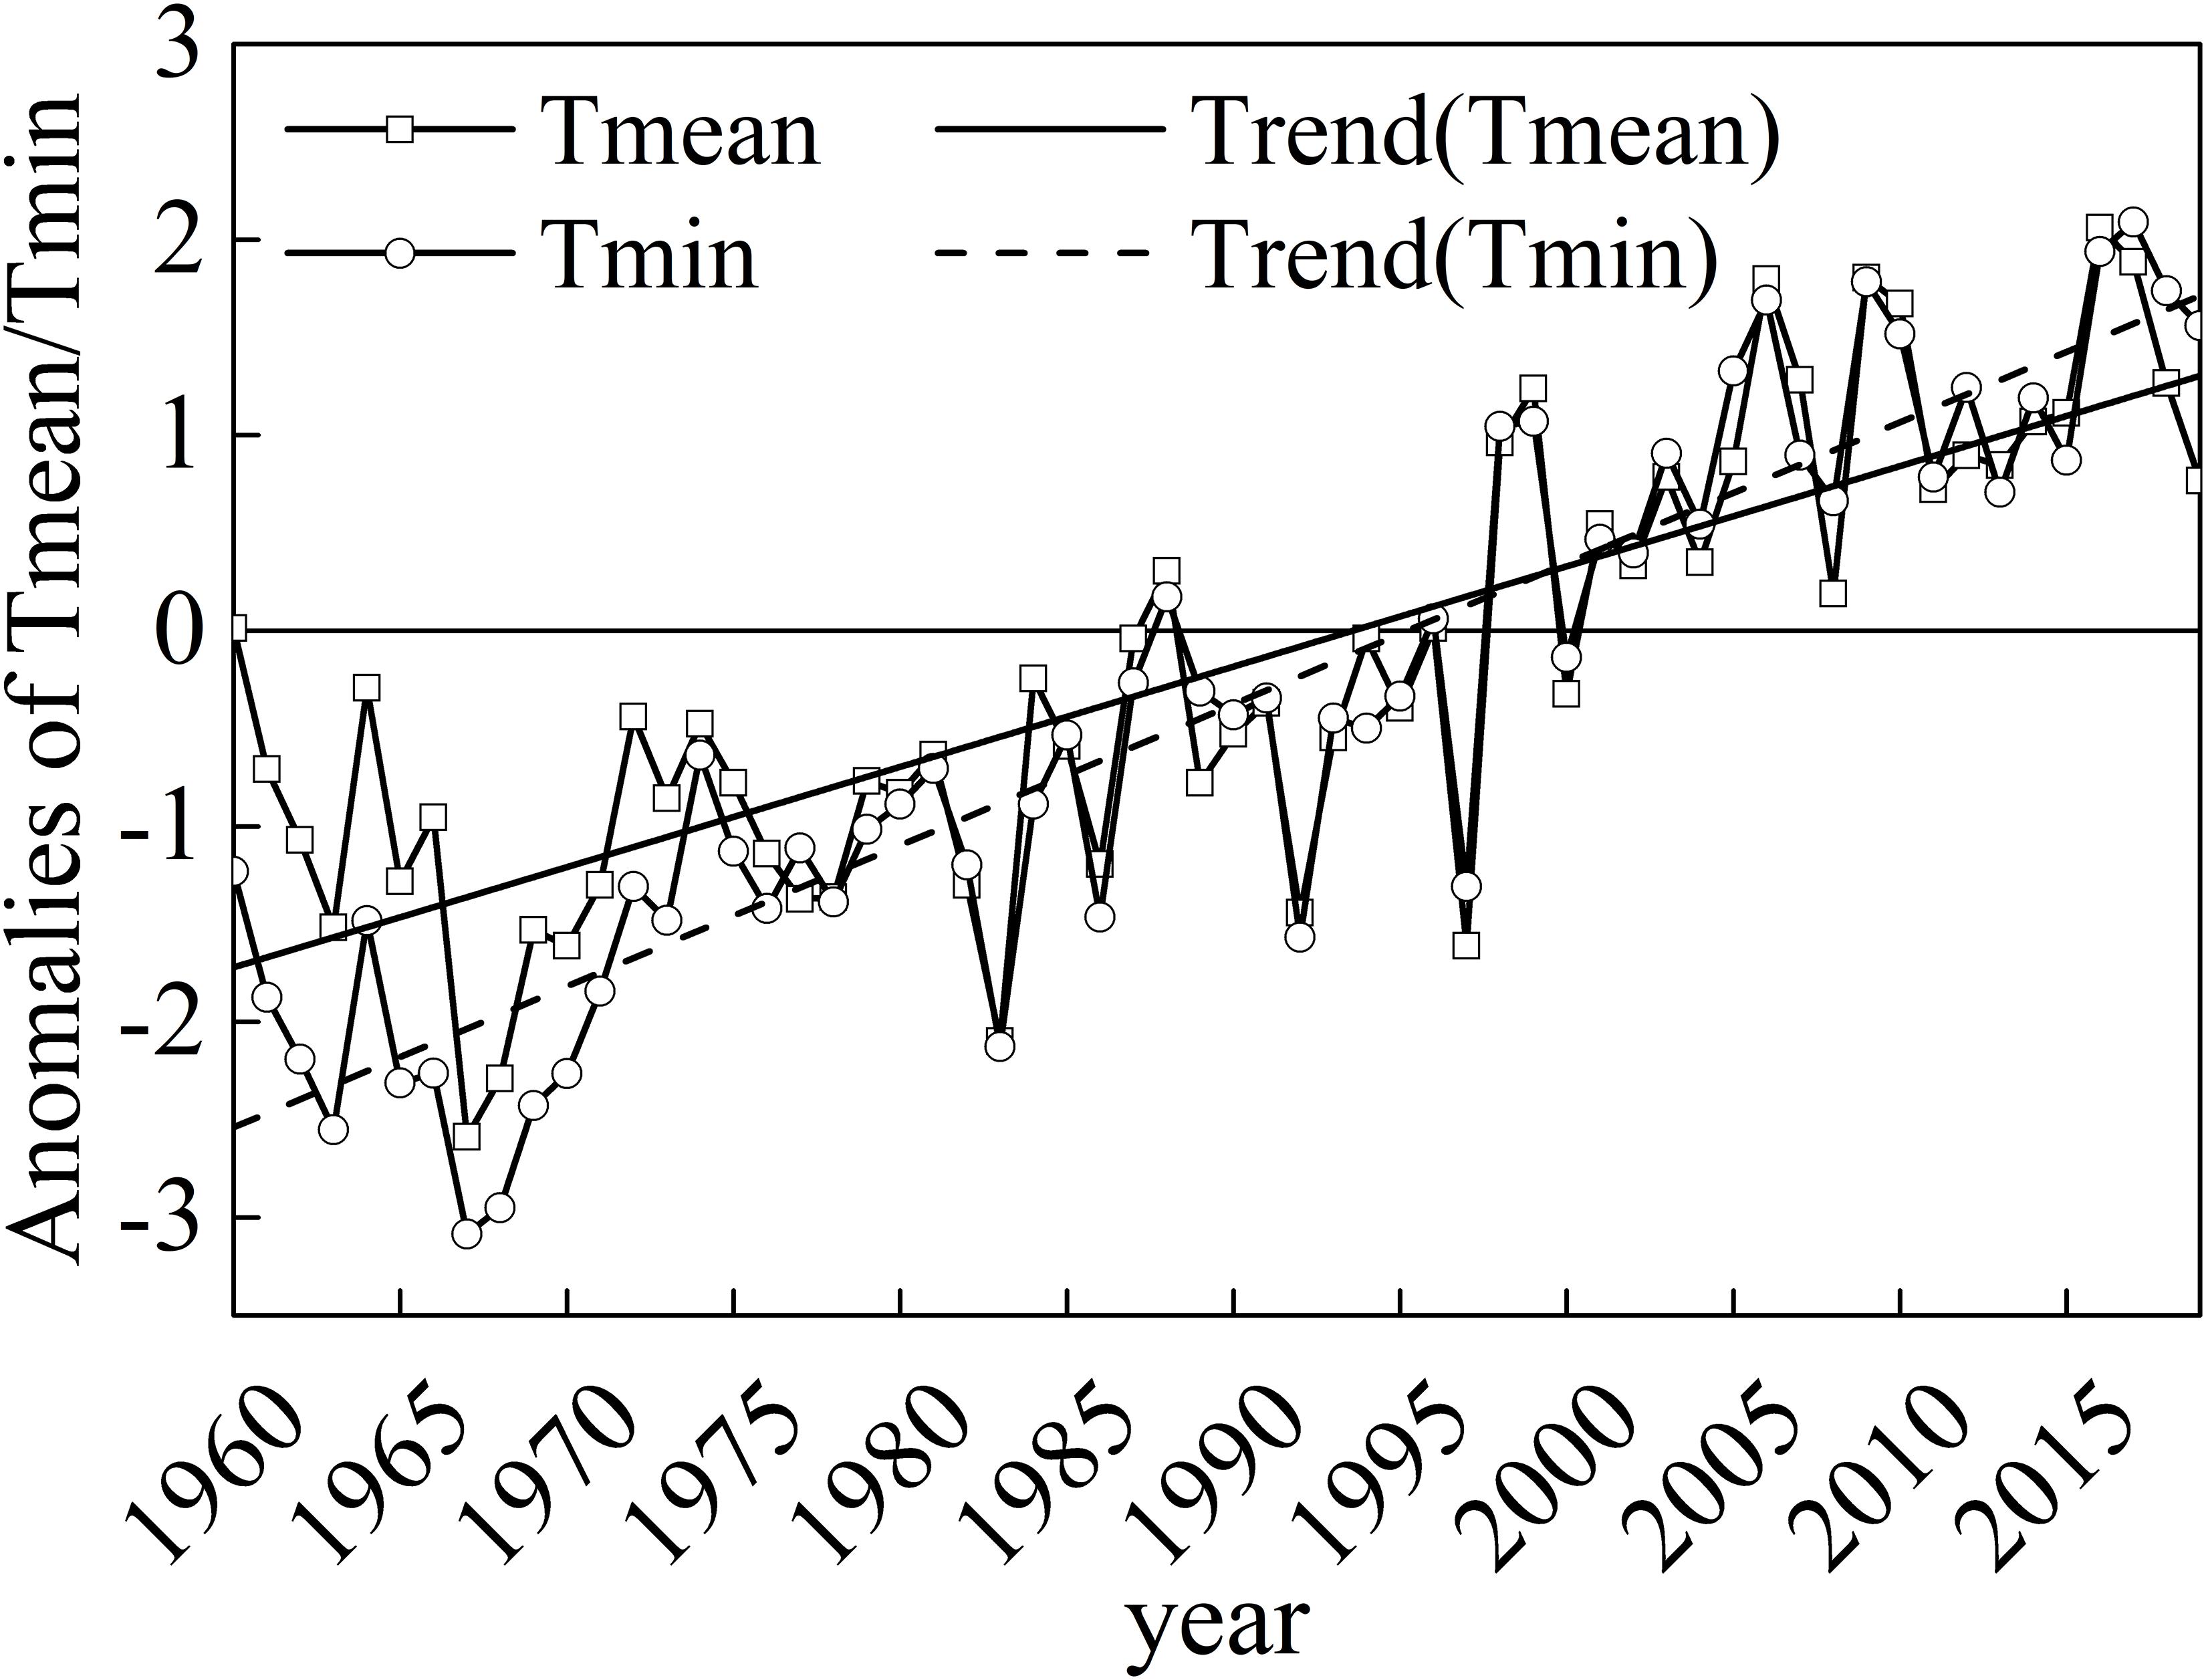
Figure 6. Increase in annual mean air temperature and mean annual minimum air temperature for all 19 stations from 1960 to 2019.
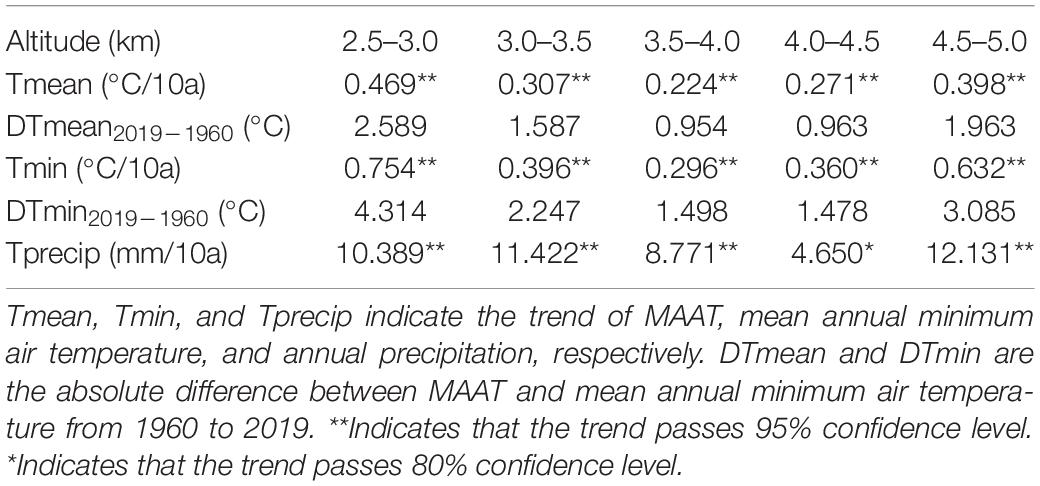
Table 2. Trends of MAAT, mean annual minimum air temperature, annual mean precipitation, and absolute difference (DT) of temperature over the QTP from 1960 to 2019.
The change of frozen ground is an indicator for changing climate. On one hand, surface characteristics of QTP is affected easily by climate change. Results of Peng et al. (2020) showed that, the Qinghai-Tibet Plateau and Siberia underwent distinct decrease in frozen soil depth during 1850–2005 and would decrease quickly in 2006–2100 based on the simulation of CMIP5; on the other hand, the change of QTP surface can in turn influences the surrounding atmospheric circulations. The changing of frozen ground would influence the land-air interactions over QTP, because of the high elevation of QTP, which acts as a huge stove at middle level troposphere to heat/cool atmosphere, it is commonly considered as a climate change starter in middle latitude in northern hemisphere. Investigation and understanding on the temporal and spatial characteristics of frozen soil are imperative.
Study of Guo and Wang (2013) investigated SFG over the QTP using simulation results of Community Land Model (CLM), their results showed that the mean MDFP over QTP decreased by 0.34 m/decade; at a depth of 1 m, the onset date of SFG freezing delayed linearly by 4.0 days/decade, while the ending date of SFG thawing advanced linearly by 4.6 days/decade, and freeze duration is about 124 days. Results based on the 19 in-situ observations in our study are similar to Guo and Wang (2013), both suggesting that the MDFP of SFG and the frozen period present decreasing trend in past decades, with the onset date of freezing and the ending date of thawing delayed and advanced, respectively. The findings of the current study are also consistent with the satellite-derived results (Li et al., 2012), namely, the annual frozen days decreased by 16.8 days per decade over the QTP, with the ending date of soil thawing advanced earlier by ∼14 days, and onset date of ground freezing has been postponed by ∼10 days during 1988–2007. Our study indicates that the degradation of permafrost at most sites accelerate more significantly, especially since 1995 (Table 3). In addition, results of this study suggest that the changes in SFG are more distinct in the regions where annual mean maximum depth of soil frozen is relatively thicker (e.g., Figure 2 and Table 4), these results are similar to the findings of Zhao et al. (2004), namely, the most significant changes of SFG occurred in regions where SFG is thickest. Specifically, the averaged MDFP above and below 4500 m decrease by 1.37 and 0.35 m during 1960 to 2019, respectively, suggesting that the decrease of the MDFP is much stronger at the stations above 4500 m (e.g., Anduo and Nagqu stations), compared to other stations.
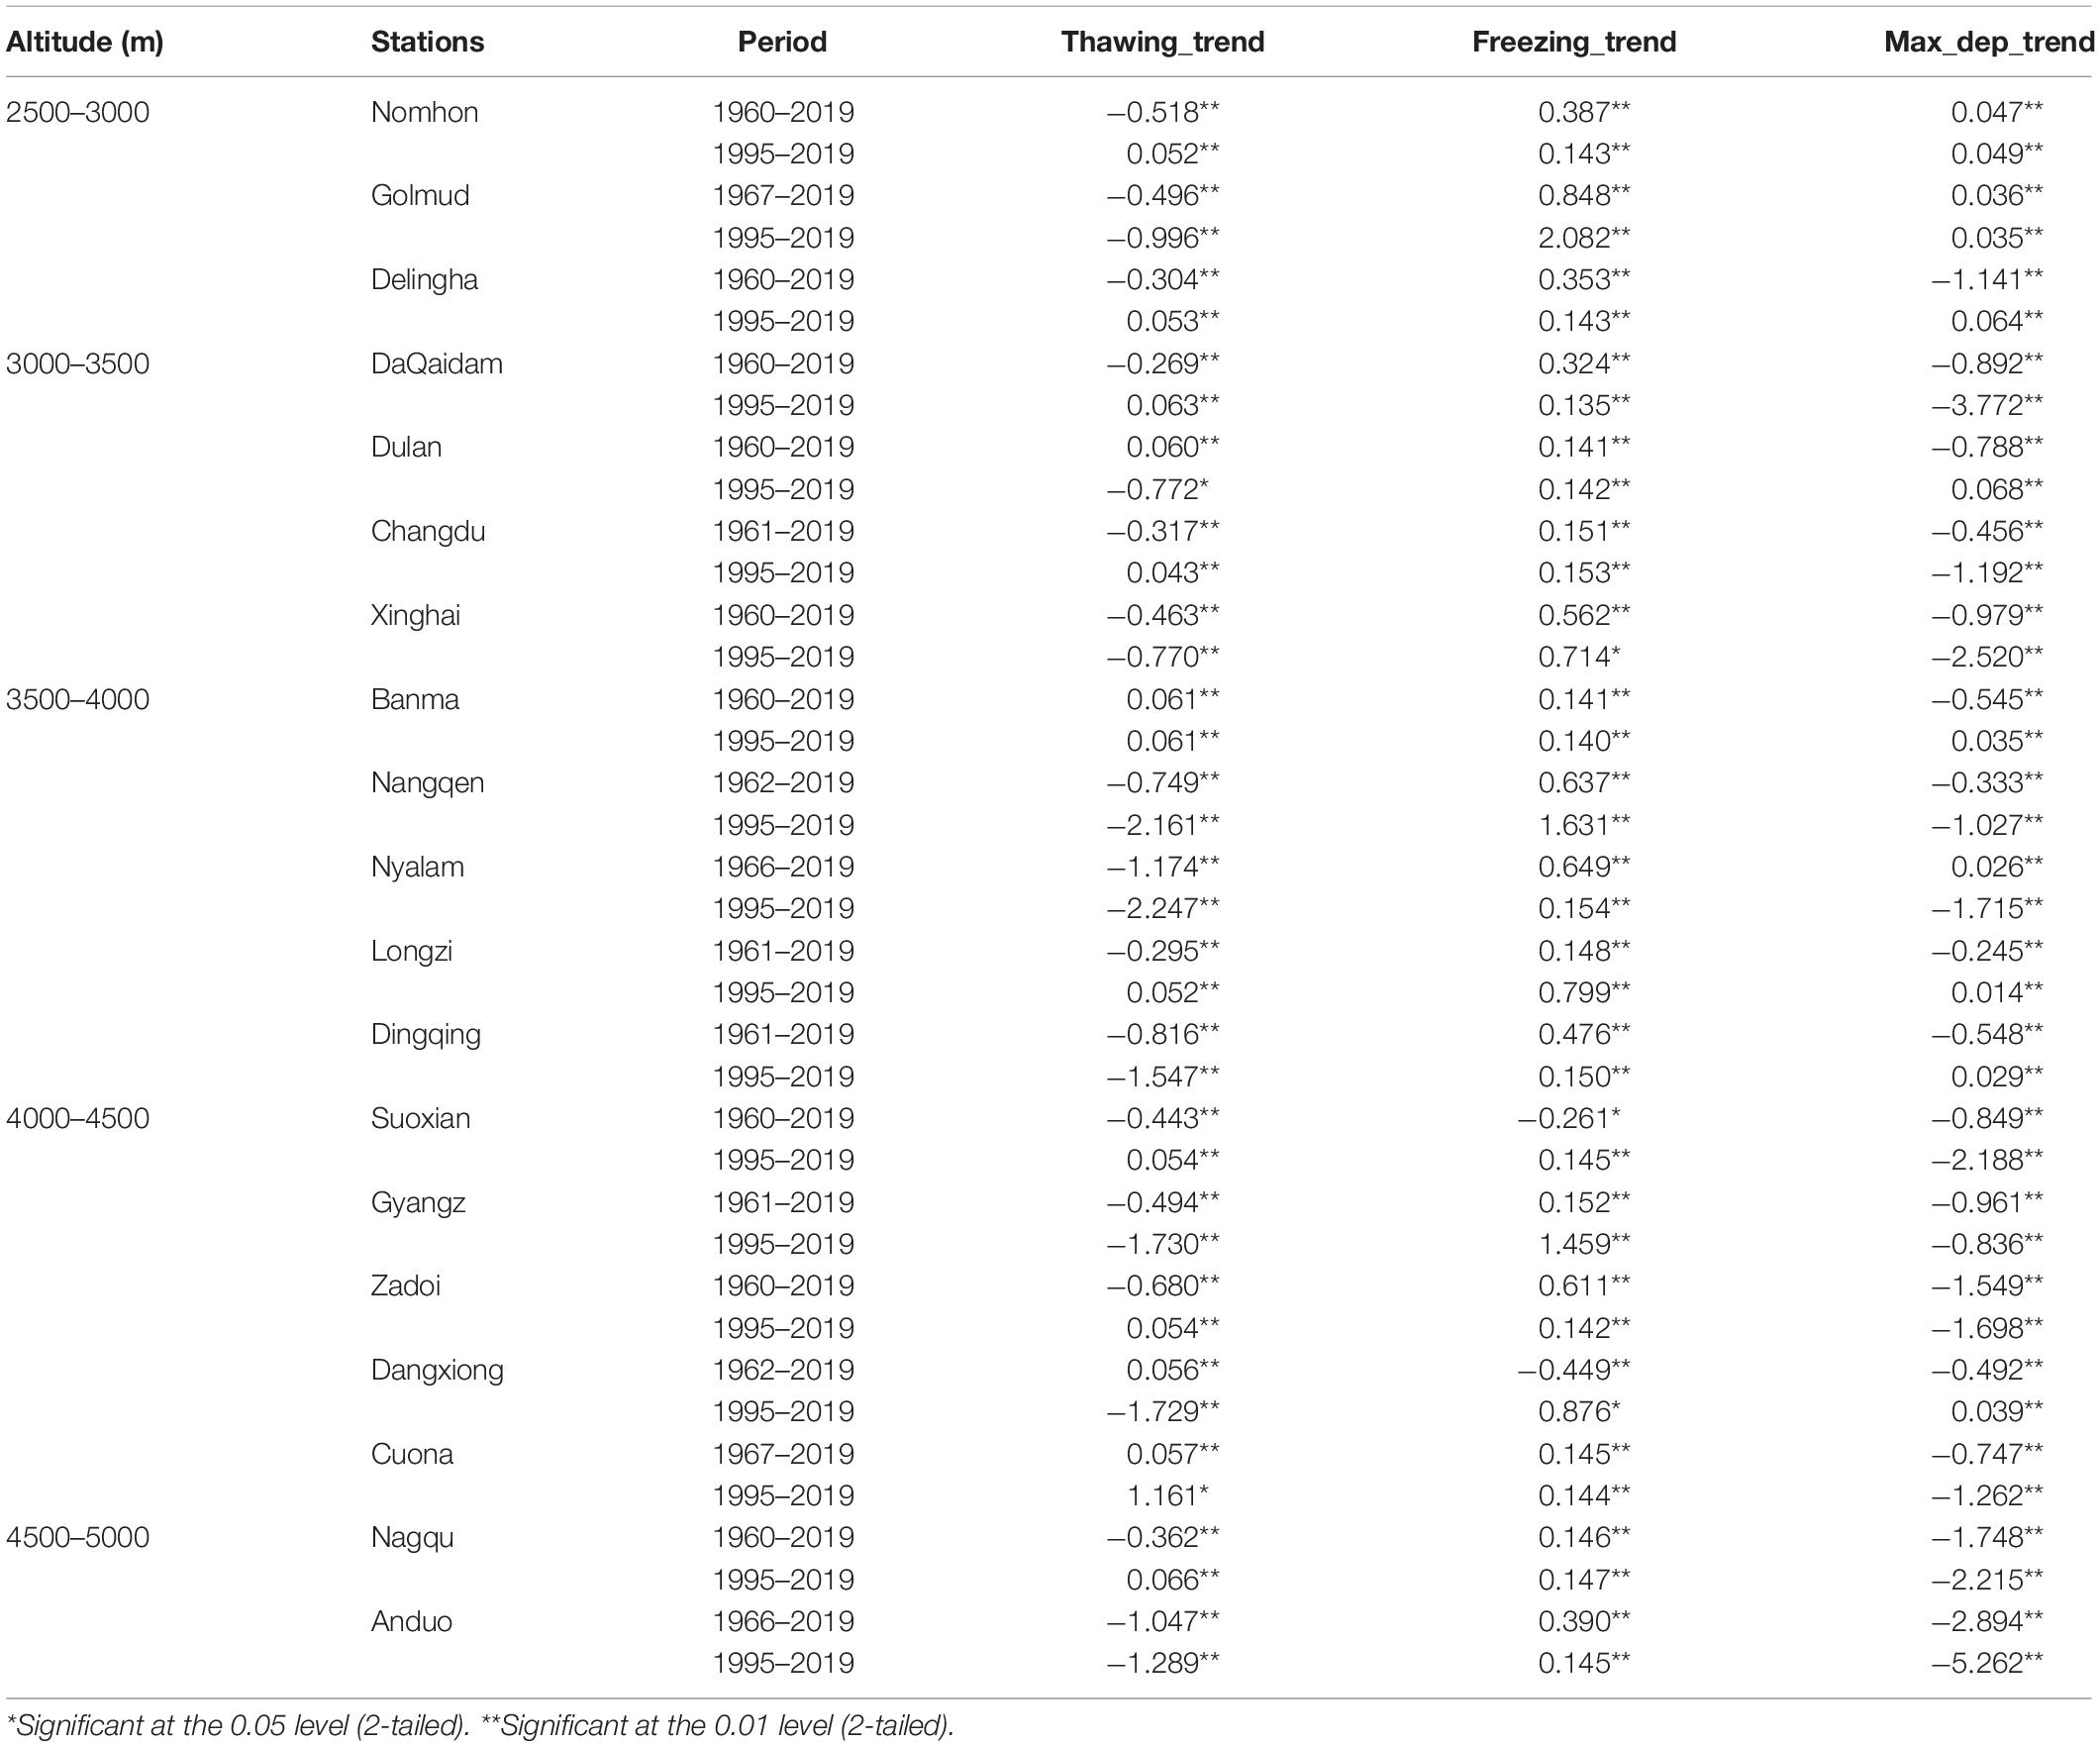
Table 3. Trends of thawing date, freezing date and maximum depth of frozen soil during 1960–2019 and 1995–2019.

Table 4. Same as Table 3, but for the results during the period 1960–2019.
Figure 7 shows the changes of the monthly mean air temperature and precipitation from 1960 to 2019. Results indicate that, the changes of the monthly mean air temperatures have evident inter-annual features, the increase occurs mainly from October to January, while the decrease occurs mainly from March to July, these implies that the increase and decrease of air temperature occur in cold season and warm season, respectively. These results agree well with the seasonal changes of temperature in the high altitude regions (Stocker et al., 2013). Figure 7 also indicates that the increase in precipitation (snow) occurs in cold season, which might be an important reason in restraining the decrease of soil temperature in cold seasons, consistent with the results of Frauenfeld et al. (2004) and Zhao et al. (2004).
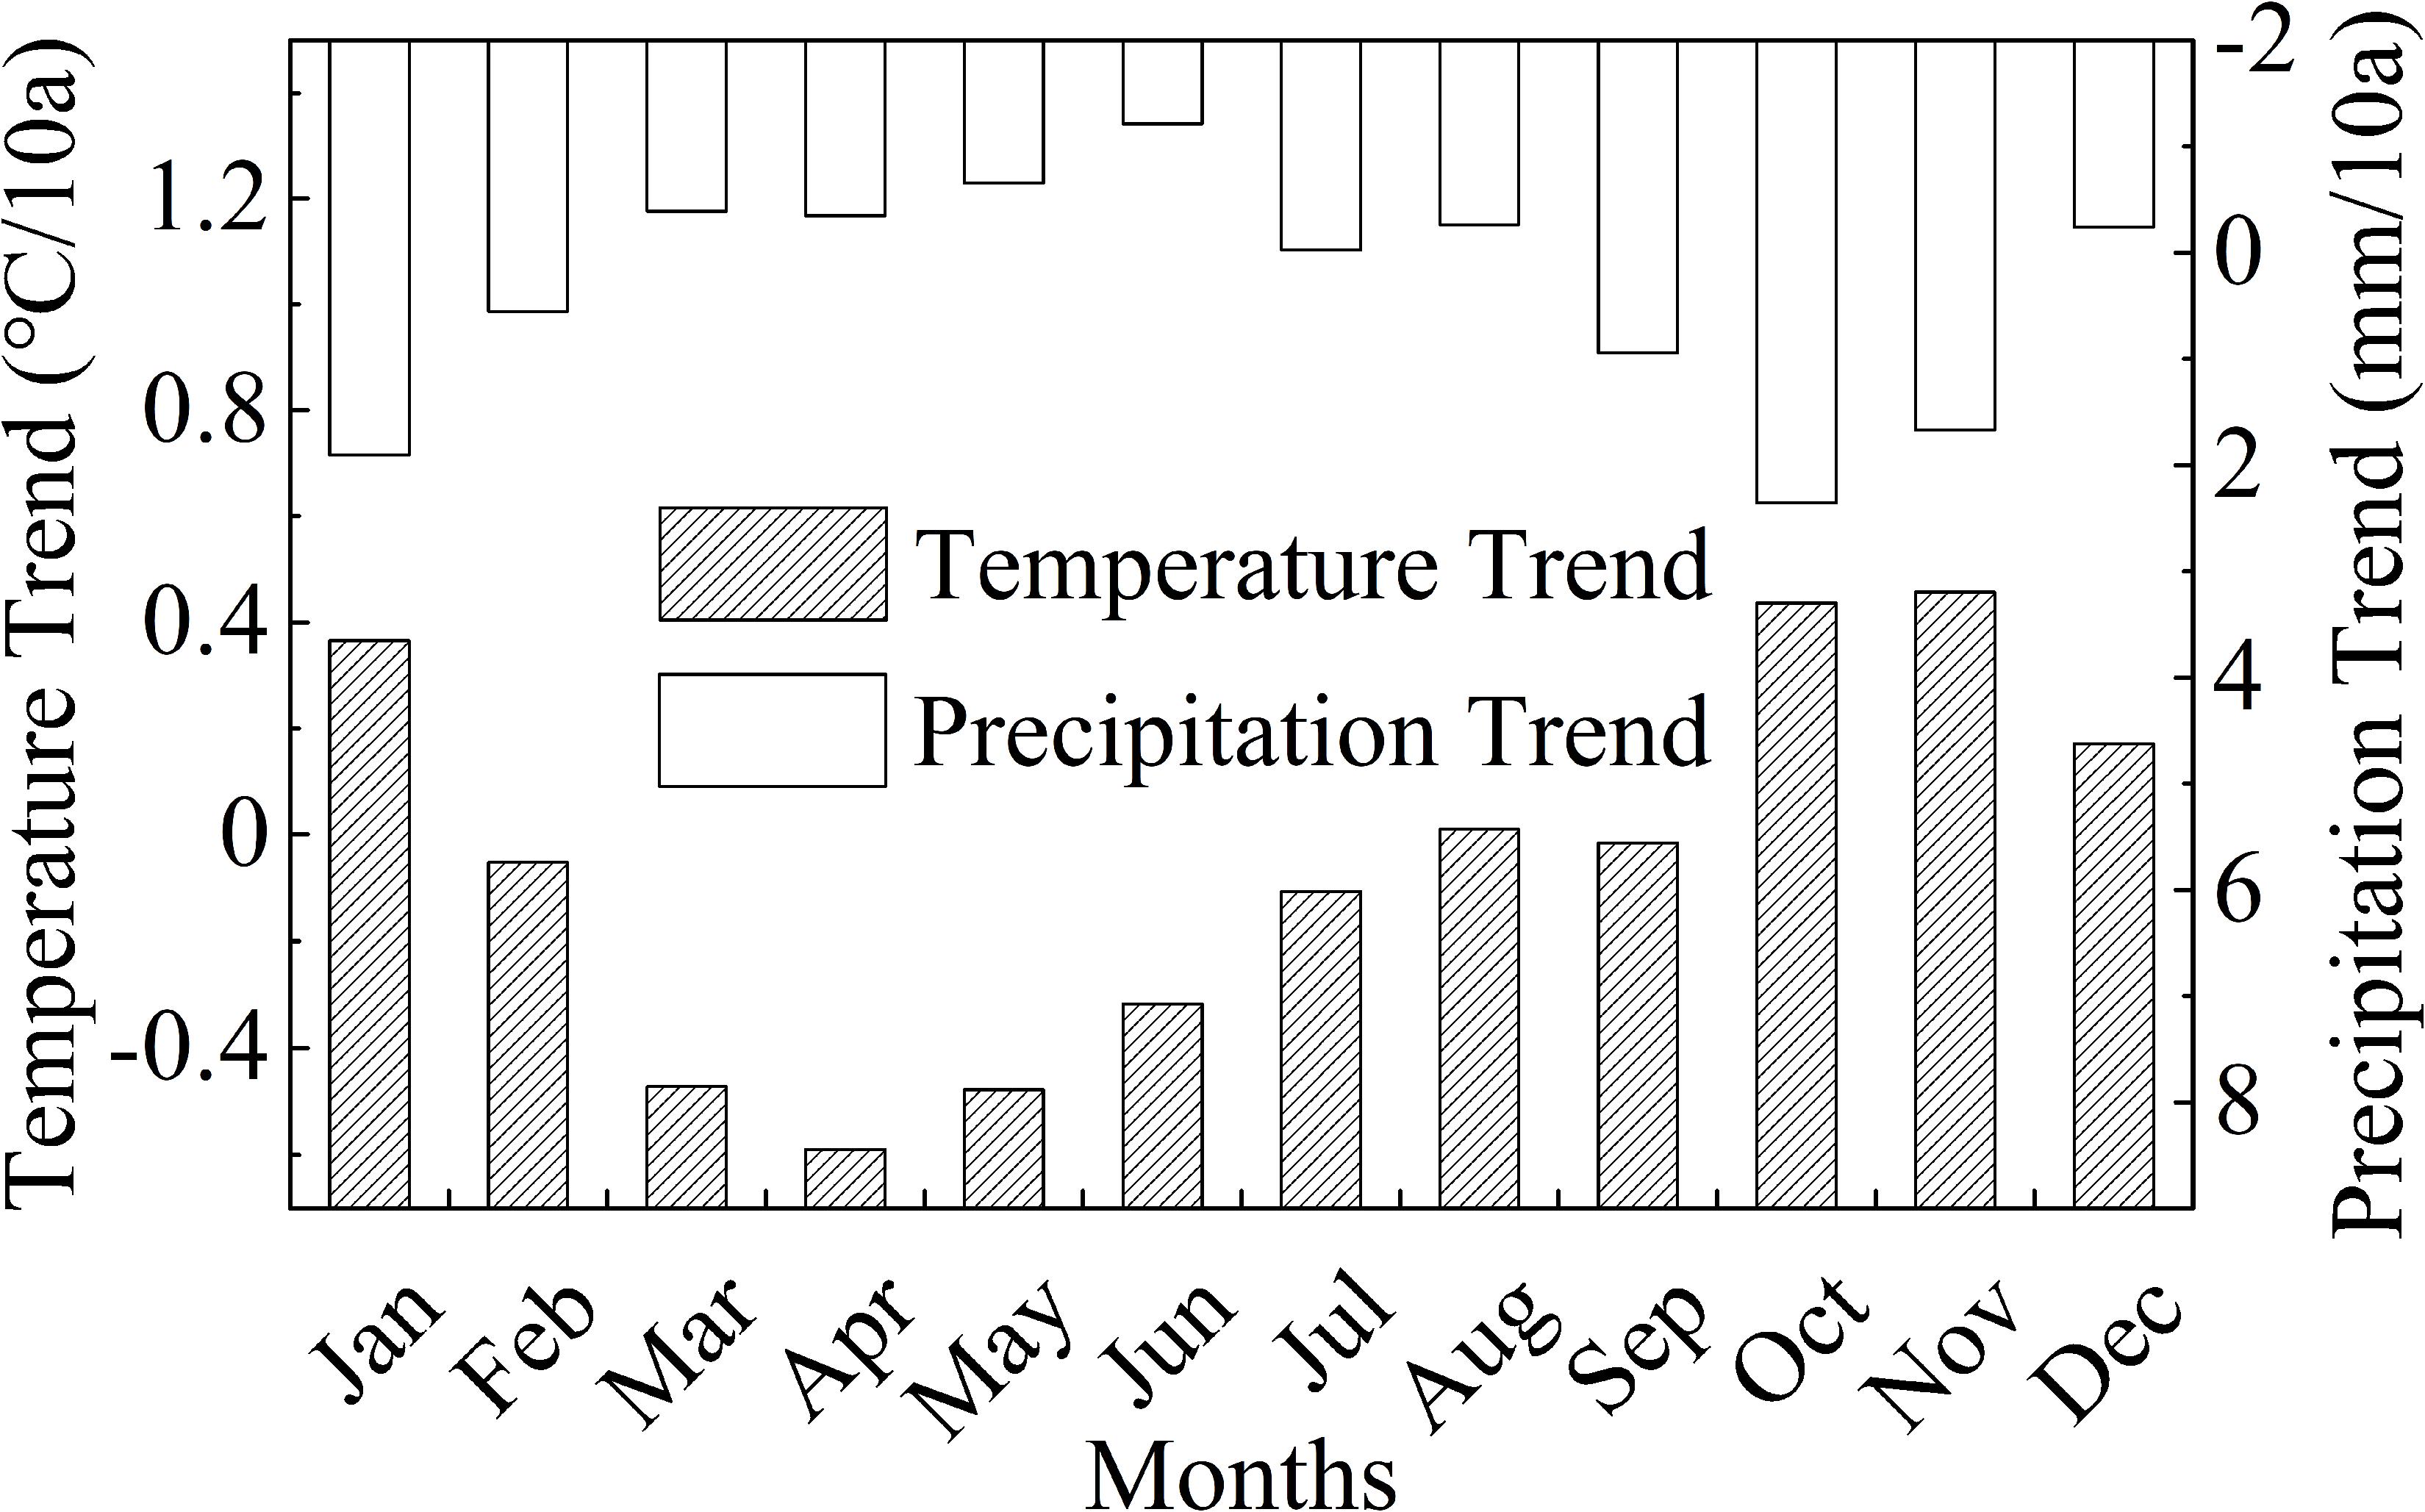
Figure 7. Changes in the mean monthly air temperature and precipitation for all 19 stations from 1960 to 2019.
Thawing of frozen ground can significantly changes soil moisture content, surface energy balance, water, and carbon exchange between land and atmosphere (Hinzman et al., 1991; Lewkowicz, 1992; Jorgenson et al., 2001; Cui and Wang, 2009). It will cause changes in the interaction between the land surface and atmosphere over the QTP (Wang et al., 2003).
Based on the long-term in-situ observations, results in this study indicates that, the duration of ground freezing becomes shorter, the freezing date delayed, the thawing date moved up, and the seasonal discrepancies of temperature becomes small. Overall results indicate that QTP is becoming warming and imply that the existing atmosphere circulation regime formed in the past will probably change as well.
The correlation between winter air temperatures and MDFP implies that the annual minimum air temperature is a primary factor that affects frozen ground, especially at the high altitude. The period of ground freezing has also shortened in the past 60 years, which also can be attributed to warmer temperatures during Autumn. Storage of water in the form of ice during winter delays the warming of the soil in March to June, due to the increase of latent heat required to thaw the ice. The low thermal conductivity of the dry soil in summer and higher thermal conductivity of ice-rich soil in winter also play a role in causing the differences in the annual soil and air temperature regimes.
The data analyzed in this study is subject to the following licenses/restrictions: The copyright of these data belongs to China Meteorological Agency. Anyone who uses this data should register as a user. Requests to access these datasets should be directed to www.nmic.cn.
CW designed and wrote the manuscript. WZ processed the data and figures. YC revised the manuscript. All authors contributed to the article and approved the submitted version.
This research was supported by the National Science Foundation of China (Grant Nos. 91837205, 41975111, 41805032, and 41801015).
The authors declare that the research was conducted in the absence of any commercial or financial relationships that could be construed as a potential conflict of interest.
Cheng, G., and Wu, T. (2007). Responses of permafrost to climate change and their environmental significance, qinghai-tibet plateau. J. Geophys. Res. Earth Surface 112:F02S03. doi: 10.1029/2006JF000631
Cui, Y., and Wang, C. (2009). Comparison of sensible and latent heat fluxes during the transition season over the western tibetan plateau from reanalysis datasets. Prog. Nat. Sci. 19, 719–726. doi: 10.1016/j.pnsc.2008.11.001
Frauenfeld, O. W., Zhang, T., Barry, R. G., and Gilichinsky, D. (2004). Interdecadal changes in seasonal freeze and thaw depths in Russia. J. Geophys. Res. Atmospheres 109:D05101. doi: 10.1029/2003JD004245
Gao, R., Dong, W. J., and Wei, Z. G. (2008). The features of temporal and spatial distributions of seasonal frozen soil in the Tibetan Plateau. J. Glaciol. Geocryol. 30, 740–744.
Guo, D., and Wang, H. (2013). Simulation of permafrost and seasonally frozen ground conditions on the Tibetan Plateau, 1981–2010. J. Geophys. Res. Atmospheres 118, 5216–5230. doi: 10.1002/jgrd.50457
Hinzman, L., Kane, D., Gieck, R., and Everett, K. (1991). Hydrologic and thermal properties of the active layer in the Alaskan Arctic. Cold Reg. Sci. Technol. 19, 95–110. doi: 10.1016/0165-232x(91)90001-w
Jorgenson, M. T., Racine, C. H., Walters, J. C., and Osterkamp, T. E. (2001). Permafrost degradation and ecological changes associated with a warmingclimate in central alaska. Clim. Change 48, 551–579. doi: 10.1023/A:1005667424292
Kong, Y., and Wang, C. H. (2017). Responses and changes in the permafrost and snow water equivalent in the Northern Hemisphere under a scenario of 1.5 °C warming. Adv. Clim. Change Res. 8, 235–244. doi: 10.1016/j.accre.2017.07.002
Lewkowicz, A. G. (1992). “Factors influencing the distribution and initiation of active-layer detachment slides on Ellesmere Island, Arctic Canada,” in Periglacial Geomorphology. Proceedings of the 22nd Annual Binghamton Symposium in Geomorphology, eds J. C. Dixon, and A. D. Abrahams (West Sussex: John Wiley & Sons, Inc), 223–250. doi: 10.4324/9781003028901-10
Li, R., Zhao, L., Ding, Y., Shen, Y., Du, E., and Liu, G. (2009). The climatic characteristics of the maximum seasonal frozen depth in the Tibetan Plateau. J. Glaciol. Geocryol. 31, 1050–1056.
Li, X., Jin, R., Pan, X., Zhang, T., and Guo, J. (2012). Changes in the near-surface soil freeze-thaw cycle on the qinghai-tibetan plateau. Int. J. Appl. Earth Observ. Geoinform. 17, 33–42. doi: 10.1016/j.jag.2011.12.002
Nelson, F. E., Anisimov, O. A., and Shiklomanov, N. I. (2001). Subsidence risk from thawing permafrost. Nature 410, 889–890. doi: 10.1038/35073746
Peng, X., Zhang, T., Frauenfeld, O. W., Du, R., Wei, Q., and Liang, B. (2020). Soil freeze depth variability across Eurasia during 1850–2100. Clim. Change 158, 531–549. doi: 10.1007/s10584-019-02586-4
Serreze, M., Walsh, J., Chapin, F. S., Osterkamp, T., Dyurgerov, M., Romanovsky, V., et al. (2000). Observational evidence of recent change in the northern high-latitude environment. Clim. Change 46, 159–207.
Shi, H., and Wang, C. (2015). Projected 21st century changes in snow water equivalent over northern hemisphere landmasses from the CMIP5 model ensemble. Cryosphere 9, 1943–1953. doi: 10.5194/tc-9-1943-2015
Smith, S. L., and Burgess, M. M. (1999). Mapping the Sensitivity of Canadian Permafrost to Climate Warming. Wallingford: Iahs Publication, 71–80.
Stocker, T. F., Qin, D., Plattner, G. K., Tignor, M., Allen, S. K., Boschung, J., et al. (2013). IPCC, 2013: Climate Change 2013: The Physical Science Basis. Contribution of Working Group I to the Fifth Assessment Report of the Intergovernmental Panel on Climate Change. Cambridge, NY: Cambridge University Press, 1535. doi: 10.1017/CBO9781107415324
Wang, C., Dong, W., and Wei, Z. (2001). The feature of seasonal frozen soil in qinghai-tibet plateau. Acta Geogr. Sin. Chin. Ed. 56, 525–531.
Wang, C., Wang, Z., Kong, Y., Zhang, F., Yang, K., and Zhang, T. (2019). Most of the northern hemisphere permafrost remains under climate change. Sci. Rep. 9, 1–10.
Wang, C., Wu, D., Kong, Y., Li, R., and Shi, H. (2017a). Changes of soil thermal and hydraulic regimes in northern hemisphere permafrost regions over the 21st century. Arc. Antarct. Al. Res. 49, 305–319. doi: 10.1657/aaar0016-026
Wang, C., Yang, K., Li, Y., Wu, D., and Bo, Y. (2017b). Impacts of spatiotemporal anomalies of tibetan plateau snow cover on summer precipitation in Eastern China. J. Clim. 30, 885–903. doi: 10.1175/jcli-d-16-0041.1
Wang, C., and Yang, K. (2018). A new scheme for considering soil water-heat transport coupling based on community land model: model description and preliminary validation. J. Adv. Mode. Earth Sys. 10, 927–950. doi: 10.1002/2017ms001148
Wang, C.-H., Dong, W. J., and Wei, Z. G. (2003). Study on relationship between freezing-thawing processes of the qingh ai-tibet plateau and the atmosphericcirculation over East A-sia. Chin. J. Geophys. 46, 438–448. doi: 10.1002/cjg2.3361
Wang, S. (1993). Recent change of permafrost along qinghai-xizang highway. Arid Land Geogr. 16, 1–7.
Wang, S., Jin, H., Li, S., and Zhao, L. (2000). Permafrost degradation on the qinghai–tibet plateau and its environmental impacts. Permafr. Periglac. Process. 11, 43–53. doi: 10.1002/(sici)1099-1530(200001/03)11:1<43::aid-ppp332>3.0.co;2-h
Wang, W., Rinke, A., Moore, J., Cui, X., Ji, D., Li, Q., et al. (2015). Diagnostic and model dependent uncertainty of simulated tibetan permafrost area. Cryosphere Discuss. 9, 1769–1810. doi: 10.5194/tcd-9-1769-2015
Yang, K., and Wang, C. (2019a). Seasonal persistence of soil moisture anomalies related to freeze–thaw over the tibetan plateau and prediction signal of summer precipitation in eastern China. Clim. Dyn. 53, 2411–2424. doi: 10.1007/s00382-019-04867-1
Yang, K., and Wang, C. (2019b). Water storage effect of soil freeze-thaw process and its impacts on soil hydro-thermal regime variations. Agric. For. Meteorol. 265, 280–294. doi: 10.1016/j.agrformet.2018.11.011
Yang, K., Wang, C., and Bao, H. (2016). Contribution of soil moisture variability to summer precipitation in the Northern Hemisphere. J. Geophys. Res. Atmospheres 121, 12,108–12,124.
Yang, K., Wang, C., and Li, S. (2018). Improved simulation of frozen-thawing process in land surface model (CLM4. 5). J. Geophys. Res. Atmospheres 123, 13,238–13,258.
Yi, S., Wang, X., Qin, Y., Xiang, B., and Ding, Y. (2014). Responses of alpine grassland on qinghai–tibetan plateau to climate warming and permafrost degradation: a modeling perspective. Environ. Res. Lett. 9:074014. doi: 10.1088/1748-9326/9/7/074014
Keywords: qinghai-tibet plateau, seasonally frozen ground, maximum depth of frost penetration, climate change, freezing-thawing process
Citation: Wang C, Zhao W and Cui Y (2020) Changes in the Seasonally Frozen Ground Over the Eastern Qinghai-Tibet Plateau in the Past 60 Years. Front. Earth Sci. 8:270. doi: 10.3389/feart.2020.00270
Received: 09 April 2020; Accepted: 15 June 2020;
Published: 07 July 2020.
Edited by:
Jing-Jia Luo, Bureau of Meteorology, AustraliaReviewed by:
Dongliang Luo, Northwest Institute of Eco-Environment and Resources (CAS), ChinaCopyright © 2020 Wang, Zhao and Cui. This is an open-access article distributed under the terms of the Creative Commons Attribution License (CC BY). The use, distribution or reproduction in other forums is permitted, provided the original author(s) and the copyright owner(s) are credited and that the original publication in this journal is cited, in accordance with accepted academic practice. No use, distribution or reproduction is permitted which does not comply with these terms.
*Correspondence: Chenghai Wang, d2NoQGx6dS5lZHUuY24=
Disclaimer: All claims expressed in this article are solely those of the authors and do not necessarily represent those of their affiliated organizations, or those of the publisher, the editors and the reviewers. Any product that may be evaluated in this article or claim that may be made by its manufacturer is not guaranteed or endorsed by the publisher.
Research integrity at Frontiers
Learn more about the work of our research integrity team to safeguard the quality of each article we publish.