 Lisheng Hao
 Liye He
 Ning Ma
 Sujie Liang
 Jun Xie
- Tianjin Climate Center, Tianjin, China
Based on the data regarding summer precipitation in North China, the tropical Madden–Julian Oscillation (MJO) index (meaning the “All-Season Real-Time Multivariate MJO index,” abbreviated as RMM1 and RMM2), and National Centers for Environmental Prediction (NCEP)/National Center for Atmospheric Research (NCAR) reanalysis data, this paper analyzed the relationship between the summer precipitation of 2018 in North China and MJO by applying multiple statistical methods. Findings indicate that (1) summer precipitation in North China is closely related to MJO. When MJO was in phases 5 and 6, North China had heavy precipitation. (2) The correlation mechanism is primarily as follows: At 850 hPa, when MJO storm clouds move eastward, anticyclonic circulation is stimulated in the north side of the convection area, thus forming a pair of cyclones and anticyclones. Although MJO storm clouds cannot move northward to higher latitudes to have a direct impact on the summer precipitation in North China, when MJO moves eastward into phases 5 and 6, the anticyclonic circulation on the north side of cyclones can strengthen the water-vapor transmission by southerly wind for RMM1 or by southeast wind for RMM2 in summer in North China thus providing favorable water-vapor conditions for precipitation in North China. At 500 hPa, when MJO moves eastward into phases 5 and 6, the western Pacific subtropical high will move northward to the area near the Korean Peninsula and be strengthened, thus blocking weather systems that come from the west, and facilitating ascending motions in North China. (3) MJO can be used for the extended-range forecasting of summer precipitation over North China.
Introduction
In recent years, to meet the pressing needs for 10–30 days weather forecasting (extended-range forecasting) by governments and global communities, studies related to extended-range forecast technology have become a hot topic throughout the world (Hoskins, 2013; Hsu et al., 2015; Black et al., 2017; Zhu and Li, 2017). Because there is a lack of well-established theory, making accurate extended-range forecasts is still very challenging (Newman et al., 2003; Yang, 2015; Zhang et al., 2019). Intraseasonal oscillation (ISO) is considered a direct link between weather and climate, and it should be feasible to use ISO in extended-range forecasts (Waliser et al., 1999; Jones et al., 2004a; Webster and Hoyos, 2004; Leroy and Wheeler, 2008; Ju et al., 2010; Kang and Kim, 2010; Yang et al., 2012; Rodney et al., 2013; Zhang, 2013). Studies have shown that there are 30–60 days quasi-periodic oscillations in the whole tropical region and global atmosphere, which are regarded as main features of atmospheric low-frequency changes. Subsequently, ISO in tropical regions is called as Madden–Julian Oscillation (MJO; Madden and Julian, 1971, 1972, 1994) by some scholars.
Madden–Julian Oscillation is the most obvious signal of the atmospheric low-frequency changes in tropical regions (Madden and Julian, 1971, 1972, 1994), which shows that the convective activity originated in the tropical West Indian Ocean gradually moves eastward (Lau and Chan, 1986; Madden and Julian, 1994; Chen and Wang, 2018a, b), and a complete MJO cycle lasts for about 45 days. The strength change and propagation characteristics of MJO differ markedly in different seasons, and the amplitude and frequency in different phases show obvious inter-annual variation (Wang F. Y. et al., 2018; Takasuka et al., 2019; Zheng and Chang, 2019). Owing to its influence on global weather and climate, MJO has become an important index for extended-range forecasts (Ferranti et al., 1990; Waliser et al., 2003; Liang and Ding, 2012; Lü et al., 2012; Zhang, 2013; Lin et al., 2016). At present, MJO is widely used in related research and operational construction as a very important signal for extended-range forecasts (Jones et al., 2004b; Ding and Liang, 2010; Li et al., 2013, Li C. Y. et al., 2016; Zhang, 2013; Li, 2014; Ren et al., 2015; Wu et al., 2016).
Since Madden and Julian (1971, 1972) proposed the existence of low-frequency atmospheric oscillation in tropical regions, significant progress has been made in the study of MJO (Chen et al., 2001; Zhang et al., 2003; Wang B. et al., 2018). Comprehensive analysis of Zhang (2013) has found that in the global range, few phenomena have as close a relation to weather and climate as MJO. Ren and Shen (2016) also think that in the subseasonal time scale, MJO is the primary mode for climatic variability worldwide. Jia et al. (2011) and Liang and Lin (2018) discuss the positive contributions of MJO on subseasonal forecasting in East Asia including Northeast Asia during the summer and the influences of MJO on precipitation in China including North China during winter. MJO not only has a direct influence on tropical weather and climate but can also have a significant influence on regions other than tropical regions through propagation and excitation of atmospheric teleconnections (Zheng and Chang, 2019), and has now become the most important predictable source of subseasonal–seasonal climatic forecasting. If there is no proper knowledge about MJO and its influencing mechanism, and MJO forecast capability is not improved, then it is impossible to meet the social demands for weather and climate forecasting (Waliser et al., 2003), let alone support the “no-gaps forecast” development proposed by the World Meteorological Organization (Vitart et al., 2017; World Meteorological Organization [WMO], 2018).
Madden–Julian Oscillation can influence precipitation in more regions around the globe, including the Asian monsoon region (e.g., Lau et al., 1988; Sui and Lau, 1992; Lawrence and Webster, 2002; Barlow et al., 2005; Jeong et al., 2008; Li T. et al., 2012a; Bai et al., 2013; Jia and Liang, 2013; Ma et al., 2014; Wu et al., 2018; Wang H. et al., 2018; Liu et al., 2020), Australian monsoon region (e.g., Hendon and Liebmann, 1990a, b; Wheeler et al., 2009), North America (e.g., Jones, 2000; Maloney and Hartmann, 2000; Higgins and Shi, 2001; Bond and Vecchi, 2003; Zhao et al., 2019), South America and Africa, and other regions (e.g., Liebmann et al., 2004; Matthews et al., 2004). In China, research into the influence and forecast technology of MJO on precipitation focuses mainly on regions such as Southwest China, South China, and the mid-lower reaches of the Yangtze River. MJO is often considered a tropical system, which finds it very difficult to cross the Yangtze River in an eastward and northward movement and have direct influence on North China. This is why little attention has been paid to North China in studies on the influence of MJO on precipitation and little literature on this aspect is available.
East China is located in the subtropical monsoon region of East Asia, and drought and flood disasters often occur, raising requirements for improving precipitation prediction. In particular, the changes in summer precipitation and forecasting techniques have attracted much attention (Huang et al., 1999; Fu et al., 2005; Qi and Zhang, 2015; Hao and Hou, 2018). In recent years, China has been promoting synergistic development in the Beijing–Tianjin–Hebei region as a national development strategy and building the Xiong’an New Area as a millennium development plan, which presents tremendous demands for understanding the change law and improving extended-range forecast technology for precipitation in North China. At present, there are few studies on the relationship between MJO and precipitation in North China, particularly studies into the influence and forecast technology of summer precipitation in North China. It was discovered that there was more summer precipitation in North China in 2018, with three obvious processes that appeared every 30 days on average and very obvious low-frequency characteristics. Is this related to the intraseasonal evolution of MJO? In this paper, the year 2018 is chosen as an example to analyze the relationships between low-frequency summer precipitation in North China and MJO, so as to understand the link between the two and the influence mechanism of MJO on summer precipitation in North China, as well as provide a reference basis for improving extended-range forecast technology.
Data and Method
Data used in this article are as follows: (1) Daily precipitation data. Summer precipitation data from 1700 stations nationwide in 2018 provided by the National Meteorological Information Center are used. The data from 95 stations are chosen for daily summer precipitation in North China (72 stations in Hebei, 14 stations in Beijing, and nine stations in Tianjin; see Figure 1A), with the daily precipitation sequence the mean value of 95 stations. The precipitation data are used for 11-day moving average treatment, to filter out the synoptic-scale weather disturbances (see Figure 1B). (2) MJO index data (Wheeler and Hendon, 2004). RMM real-time multi-variable MJO indexes provided by the Bureau of Meteorology (Australia) are used and can be downloaded from their website1. (3) OLR data. The chosen data are the daily data from the summer of 2018 and can be downloaded from the official website of the National Oceanic and Atmospheric Administration (NOAA)2. (4) Circulation data. The reanalysis data prepared by the National Centers for Environmental Prediction (NCEP)/National Center for Atmospheric Research (NCAR) are used (Kalnay et al., 1996), and can be downloaded from the NOAA’s official website2. Horizontal resolution of the data is 2.5° × 2.5°, and the daily data in the summer of 2018 are chosen, with the variables being horizontal winds u and v, and specific humidity q at 850 hPa, height field h at 500 hPa, and height field h and zonal wind u at 200 hPa.
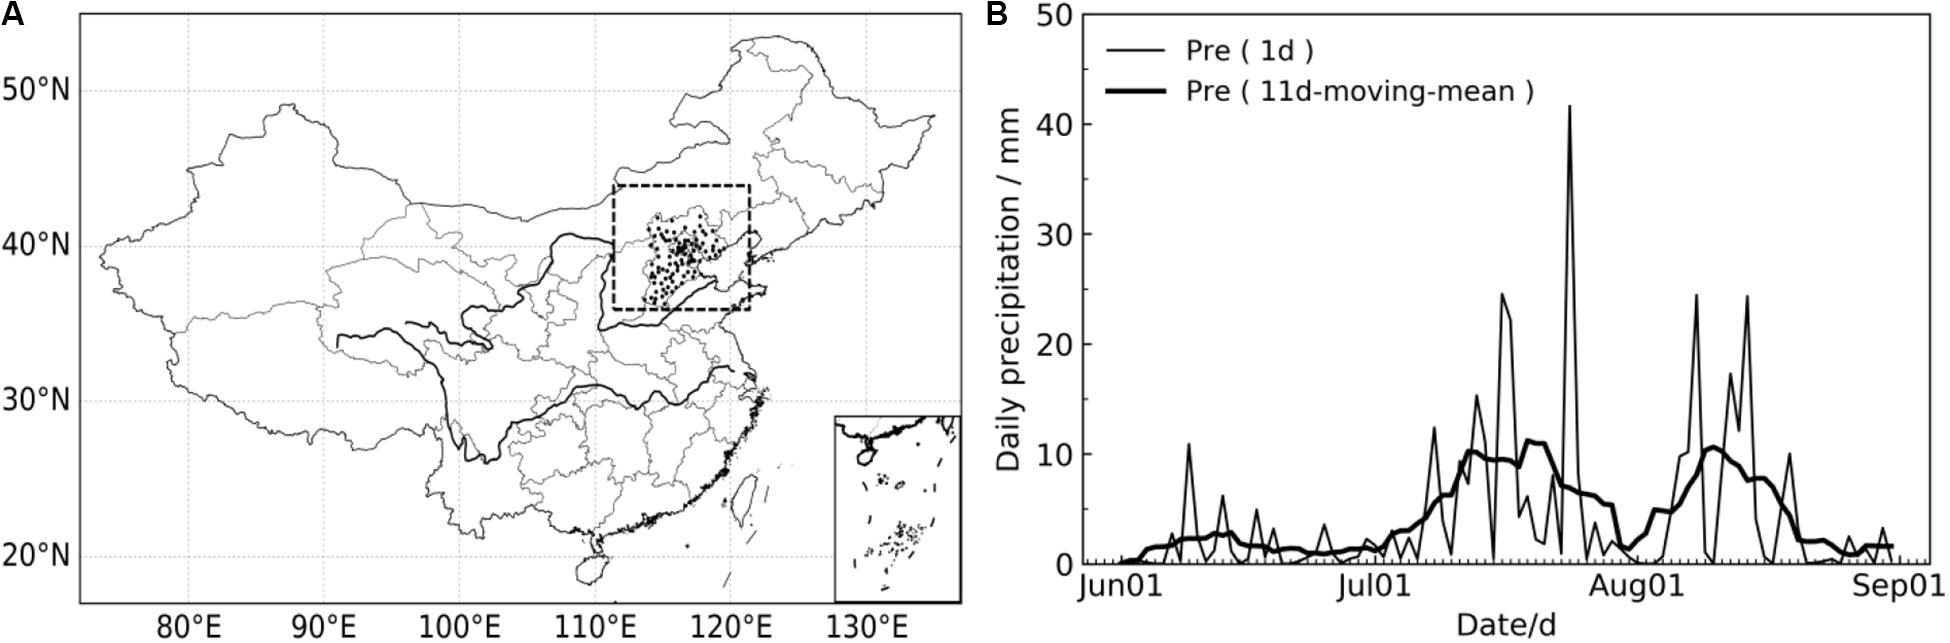
Figure 1. Spatial distribution of precipitation stations (A) and daily precipitation variation (B) in North China in the summer of 2018.
Methods used in this article are as follows: (1) correlation analysis and power spectrum analysis (Wei, 2007); (2) Morlet wavelet analysis (Torrence and Compo, 1998); (3) circulation synthesis analysis; and (4) circulation reconstruction (Wang et al., 2008). To obtain the time series for an individual factor, it is possible to reconstruct the circulation anomaly field with the linear regression method, which has been proven as an effective tool for circulation anomaly analysis in practice (Hao and Hou, 2018). Suppose xi is the time series of a factor and yi is the actual sequence value for a point of the circulation field to be reconstructed, thus
where b is the constant value of the circulation field reconstructed and a is the circulation anomaly field reconstructed. To make the circulation anomaly size close to that of the actual field and facilitate the analysis, it is required to standardize xi in the regressive calculation.
Relationship Between Summer Precipitation in North China and MJO
Characteristics of Summer Precipitation in 2018
Precipitation in North China was above normal during the summer (June to August) of 2018, when three obvious processes occurred with obvious low-frequency characteristics (Figure 1B). To analyze the low-frequency characteristics of summer precipitation in 2018, the 11-day moving average is made on daily precipitation, to filter out the synoptic-scale weather disturbances. It is found that the low-frequency part explains 48% of the total variance of precipitation variation.
First, analyze whether the change of summer precipitation in 2018 in North China had the low-frequency characteristics. Power spectrum analysis allows for identification of the main cycles of overall change in the precipitation sequence, while wavelet analysis allows for identification of the characteristics of the main cycles in different time segments. Figure 2 gives the daily precipitation sequence power spectrum for the summer of 2018 in North China and the Morlet wavelet coefficient distribution. Power spectrum analysis has shown that the power spectrum with the most significant summer precipitation happens near 30 days (Figure 2A), indicating that there is an obvious 30 days period in North China with regard to summer precipitation in 2018. On the Morlet wavelet analysis diagram (Figure 2B), the positive–negative coefficient indicates the fluctuation of precipitation, and the shaded area passed the 95% confidence test. The left side corresponds to periods, which is expressed in days. It can be seen that there is an obvious cycle of about 30 days in summer precipitation for 2018, particularly in July–August.

Figure 2. Power spectrum and distribution of the Morlet wavelet coefficient for precipitation in North China in the summer of 2018. Shaded areas exceed the 95% confidence level. (A) The power spectrum, the dotted line is the power spectrum of white noise with 95% confidence level, and the solid line is the power spectrum of precipitation. (B) The Morlet wavelet coefficient map of daily precipitation, the positive and negative isolines are the distribution of coefficient, the numerical values represent the fluctuation of precipitation, and the shaded areas passed the 95% confidence level.
Relationship Between MJO Change and Summer Precipitation
Figure 3 shows the change curve for daily precipitation in the summer of 2018 in North China corresponding to MJO indexes (meaning the “All-Season Real-Time Multivariate MJO index,” abbreviated as RMM1 and RMM2) RMM1 and RMM2. It can be seen that the change curve of the summer precipitation in 2018 has very good corresponding relations with the change curve of the MJO indexes RMM1 and RMM2 and phase change of MJO, and three obvious precipitations are basically situated in phases 5 and 6 of MJO.
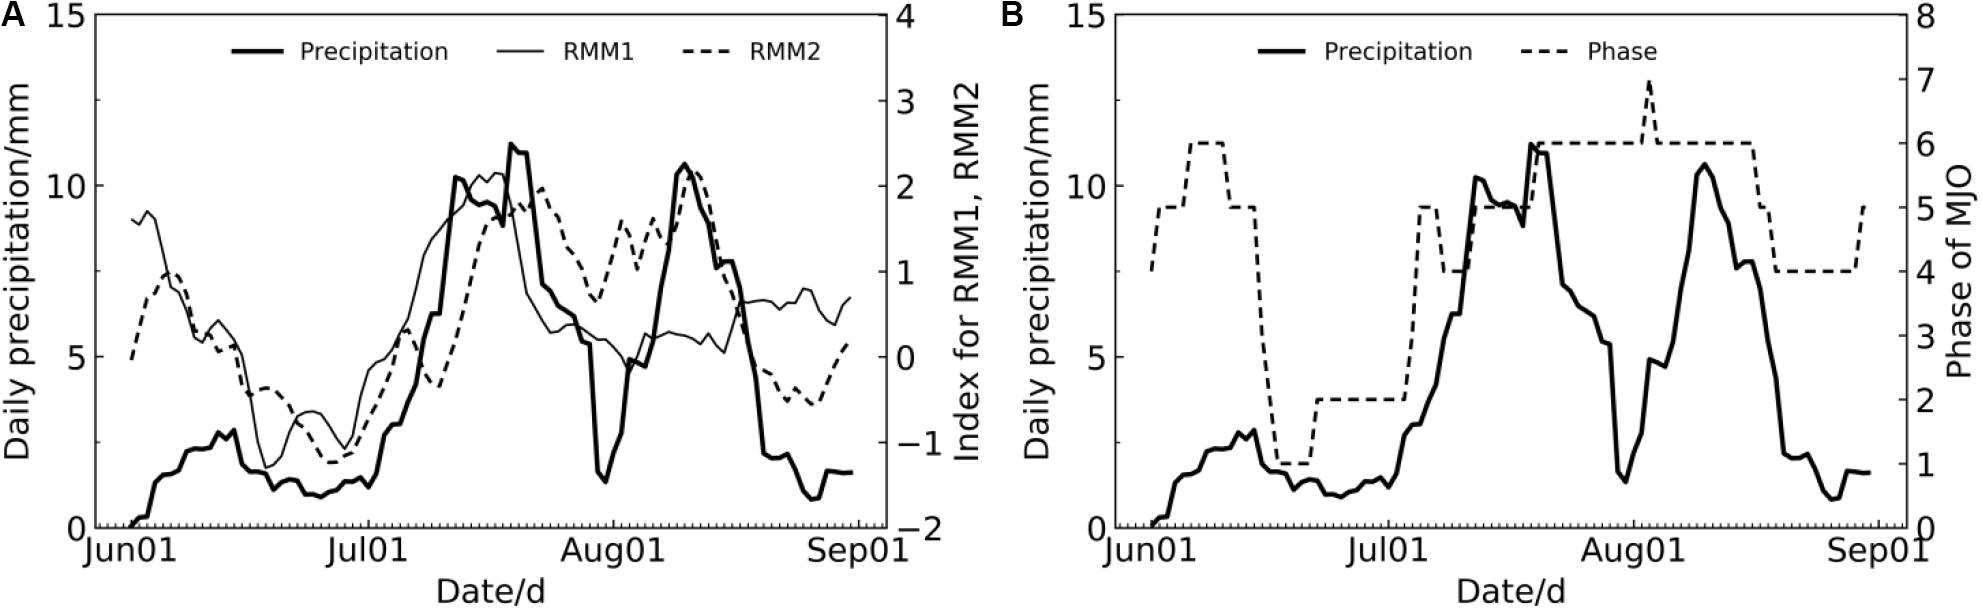
Figure 3. Daily variation of precipitation in North China (heavy line) and RMM1 (A, fine solid line), RMM2 (A, dashed line), phase (B, dashed line) of MJO in the summer of 2018.
The correlation analysis has found that the correlation coefficient of daily summer precipitation in North China with the MJO indexes RMM1 and RMM2 has passed 99% confidence test, indicating that summer precipitation in North China is very closely related to MJO. In the change of the summer precipitation in 2018, the influence of MJO might be significant.
Figure 4 shows the composites of the OLR anomaly in phases 1–2, phases 3–4, phases 5–6, and phases 7–8 of MJO in the summer of 2018. In the calculation, 5 days with the largest amplitude is selected as the combination corresponding to different phases of MJO (the following other factor fields are the same). Anomaly refers to the anomaly value relative to the average value of 1981–2010 (the following other factor fields are the same). It can be seen from the diagram that the OLR indicates the obvious propagation from west to east, and there is obvious northward movement during the east movement. During phases 1–2 of MJO, the main convection area is located over the tropical West Indian Ocean (8°N, 55°E); when MJO enters phases 3–4, the main convection area moves eastward and northward, and the main convection center is located over the Bay of Bengal (15°N, 90°E); when MJO enters phases 5–6, the main convection area moves further eastward and northward; in addition, the convection in the Bay of Bengal moves northwestward, occupying the majority of the Indian Peninsula. The convection area of MJO is inclined from northwest to southeast, the west convection center is located over the Indian Peninsula (20°N, 72°E), and the southeast convection center is located over the ocean to the east of the Philippines (15°N, 130°E); when MJO enters phases 7–8, the main convection area moves eastward further with the strength reduced, and the main convection center is located over Saipan and the ocean to its east (13°N, 150°E, and 155°W). Throughout the entire evolution of MJO, the most significant characteristics are that in phases 5–6, the convection area moves eastward and northward, with the highest intensity, and the shape of inclination from northwest to southeast, with the northward propagation in the Indian Peninsula most obvious.
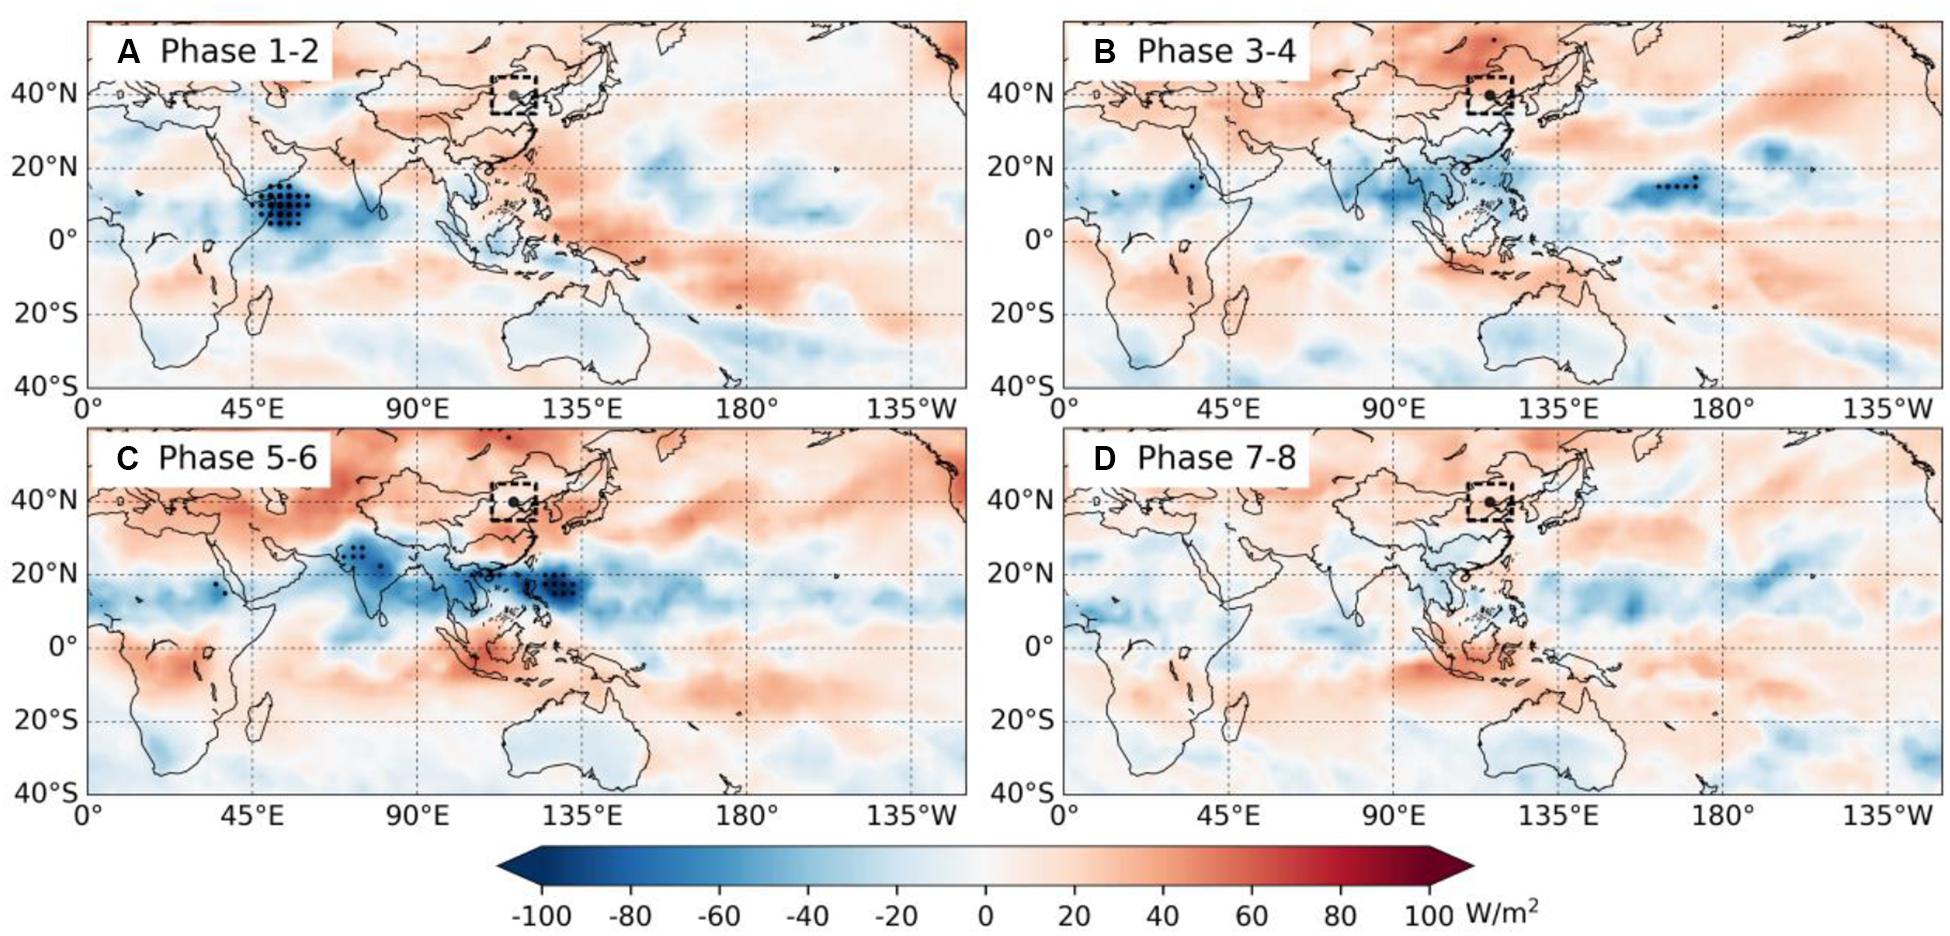
Figure 4. Composites of the OLR anomaly in each phase of MJO in the summer of 2018 (the dotted areas exceed 95% confidence level). Dashed line frame indicates North China area, same as below. Unit: W⋅m–2. (A) The blue shaded areas are the composition of anomalous distribution of outgoing long wave radiation corresponding to the 1-2 phase of MJO, and the dotted areas passed the 95% confidence level. (B–D) The same, but corresponding to the 3-4, 5-6, 7-8 phases of MJO.
The previous studies on MJO (Zhang et al., 2009; Bai et al., 2012, 2016; Li T. et al., 2012b; Li et al., 2013, 2014, Li Y. H. et al., 2016; Zhang and Zhang, 2013; Ma et al., 2014; Yan and Ju, 2016; Zhao et al., 2016; Yuan et al., 2017) have found that, either in the spring or summer, when MJO is located over the Indian Ocean, it is often rainy in the mid-lower reaches of the Yangtze River and in the southwest and southern China regions, while when MJO is located over the Western Pacific, it is often not rainy in the mid-lower reaches of the Yangtze River and in the southwest and southern China regions, not paying any attention to the relationship between MJO and summer precipitation in North China. The study conducted by Yan and Ju (2016) has pointed out that when the summer MJO is constantly active in the equatorial Western Pacific Ocean, the equatorial Walker circulation is weakened, while the Hadley circulation is strengthened, with the Western Pacific subtropical high position is northward. However, it did not illustrate the impact of MJO on summer precipitation in North China. From the previous statistical results, it can be seen that when MJO enters the Western Pacific Ocean (phases 5 and 6) and the amplitude is large, there is too much summer precipitation in North China, and the conclusion of Yan and Ju (2016) actually has a good relationship corresponding to the large summer precipitation in North China in phases 5 and 6 of MJO.
To gain a further understanding of the relationship between the summer precipitation in North China and MJO, the precipitation in the summer of 2018 (June–August, with 11 days moving average) have been regressed and reconstructed onto the MJO indexes RMM1 and RMM2 in the same period (with 11 days moving average), thus obtaining the spatial distribution of percentage of precipitation anomaly corresponding to MJO (Figure 5). Corresponding to RMM1, the summer precipitation in North China is a positive anomaly, the Yangtze River basin is basically a negative anomaly, and the major region of Guangdong Province is a positive anomaly. Corresponding to RMM2, the summer precipitation in North China is a positive anomaly, the Yangtze River and region south of the Yangtze River are basically a negative anomaly, and the coastal area of Guangdong and Guangxi is a positive anomaly. It can be seen that when RMM1 and RMM2 are positive, that is, when MJO enters phases 5 and 6, summer precipitation in North China is a positive anomaly.
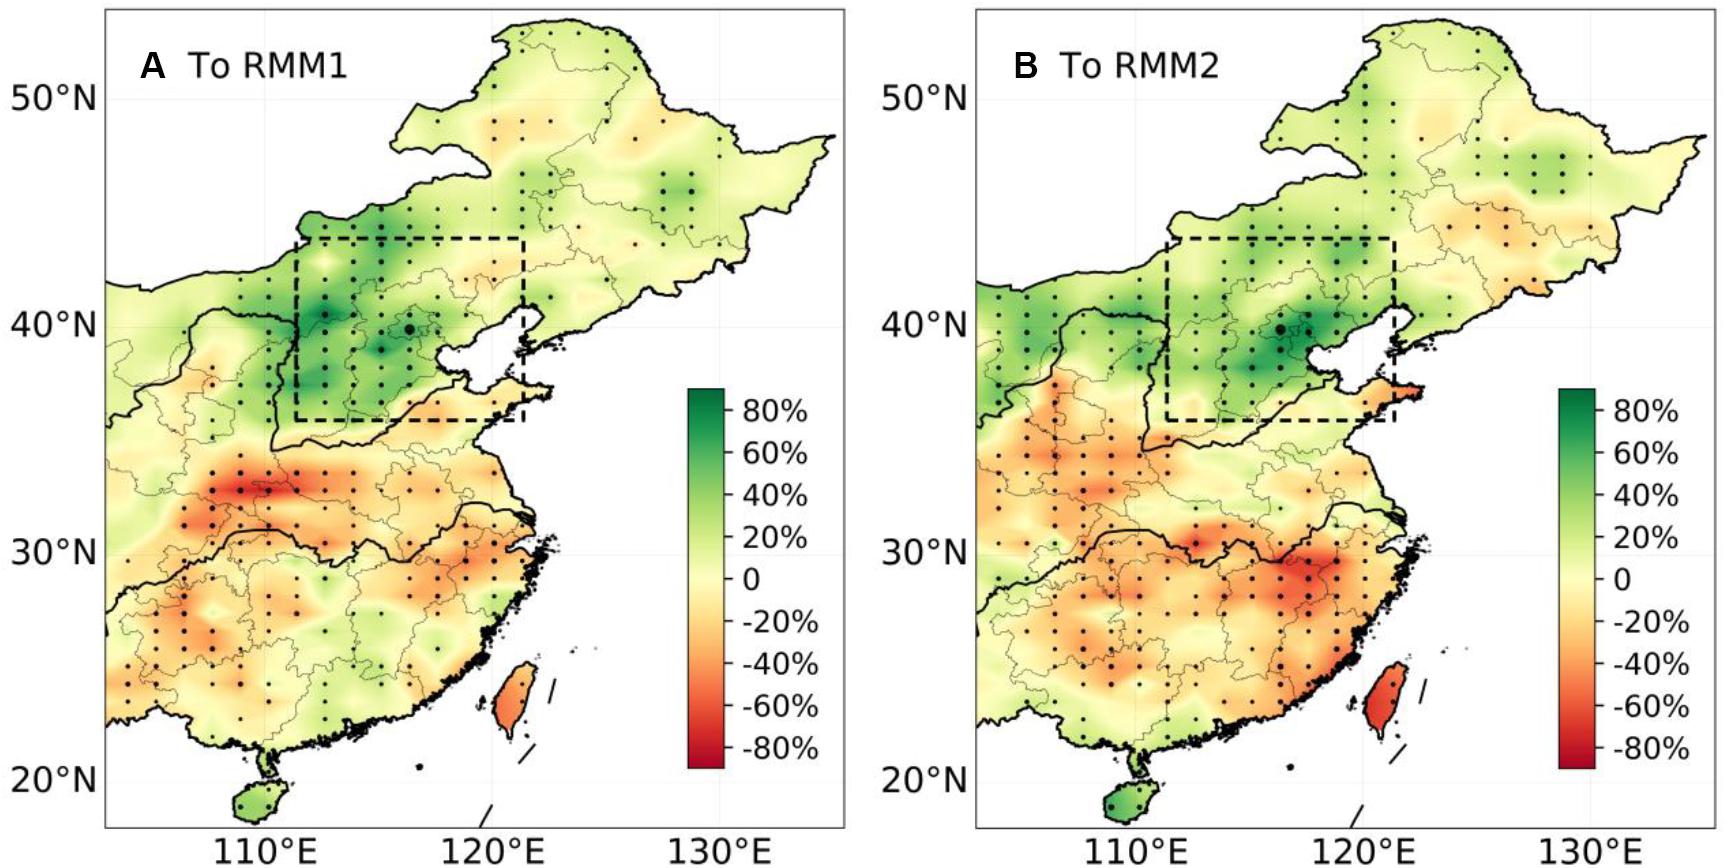
Figure 5. The regressed pattern of the summer precipitation anomaly onto (A) RMM1 and (B) RMM2 in 2018 (the dotted areas exceed 95% confidence level). Unit: %.
Linking Mechanism Between Summer Precipitation in North China and MJO
Wind Field and Water-Vapor Field Anomaly at 850 hPa
Figure 6 shows the horizontal wind field anomaly and water-vapor anomaly at 850 hPa synthesized corresponding to different phases of MJO in the summer of 2018. In phases 1–2 of MJO, there are several obvious characteristics: the West Indian Ocean region has a cyclonic circulation anomaly, the Bay of Bengal and the region to its north have a anticyclonic circulation anomaly, the South China Sea to Southern China have a anticyclonic circulation anomaly, and Southern China has a southwest wind anomaly, but is deficient of water vapor; from 10°N the Indian Ocean north of the equator to the South China Sea, there is an obvious east wind anomaly; there is an obvious divergence area in North China, which is unfavorable for precipitation. When MJO enters phases 3–4, there is obvious change compared with the early stage of circulation, there is a cyclonic circulation anomaly in the Bay of Bengal, the southeast of China, and there is an anticyclonic circulation anomaly near Japan; from 10°N the Indian Ocean north of the equator to the South China Sea, the east wind disappears; for the cyclonic circulation corresponding to the southeast region of China, water vapor has a positive anomaly, and the precipitation in the region south of the Yangtze River might be higher; North China has a northeast wind anomaly, deficient of water vapor, which is thus unfavorable for precipitation. When MJO enters phases 5–6, the circulation has obvious change compared with the early stage, and 15°N the Indian Ocean north of the equator to the South China Sea changes to an obvious west wind anomaly, with the wind direction contrary to that of phases 1–2 of MJO; from north of the South China Sea to the Western Pacific Ocean, there is a cyclonic circulation anomaly, and near the Korean Peninsula, there is a anticyclonic circulation anomaly, thus forming a “cyclone–anticyclone pair”; North China has a southeast wind and southerly wind anomaly, with obviously more water vapor, thus being favorable for precipitation. When MJO enters phases 7–8, the circulation has obvious change by comparison with that in the previous stage, there is an obvious east wind anomaly from the Indian Ocean near 10°N north of the equator to the South China Sea, and the wind direction is the same as that of phases 1–2 of MJO; Eastern China basically has a north wind anomaly, deficient in water vapor, and thus unfavorable for precipitation; North China has a northwest wind anomaly, with less water vapor, thus unfavorable for precipitation. In summary, there are several obvious characteristics: (1) With regard to the change from the Western Indian Ocean north of the equator to the South China Sea, phases 1–2 have a strong east wind anomaly, phases 3–4 do not have an obvious west wind or east wind anomaly, phases 5–6 have a strong west wind anomaly, and phases 7–8 have then turned to an east wind anomaly; (2) in phases 1–2, North China has a divergent wind field anomaly, deficient in water vapor; in phases 3–4, North China has a northeast wind anomaly; in phases 5–6, North China has an obvious south wind and southeast wind anomaly, with significant increase of water vapor; in phases 7–8, North China has a northwest wind anomaly and an abnormal decrease of water vapor.
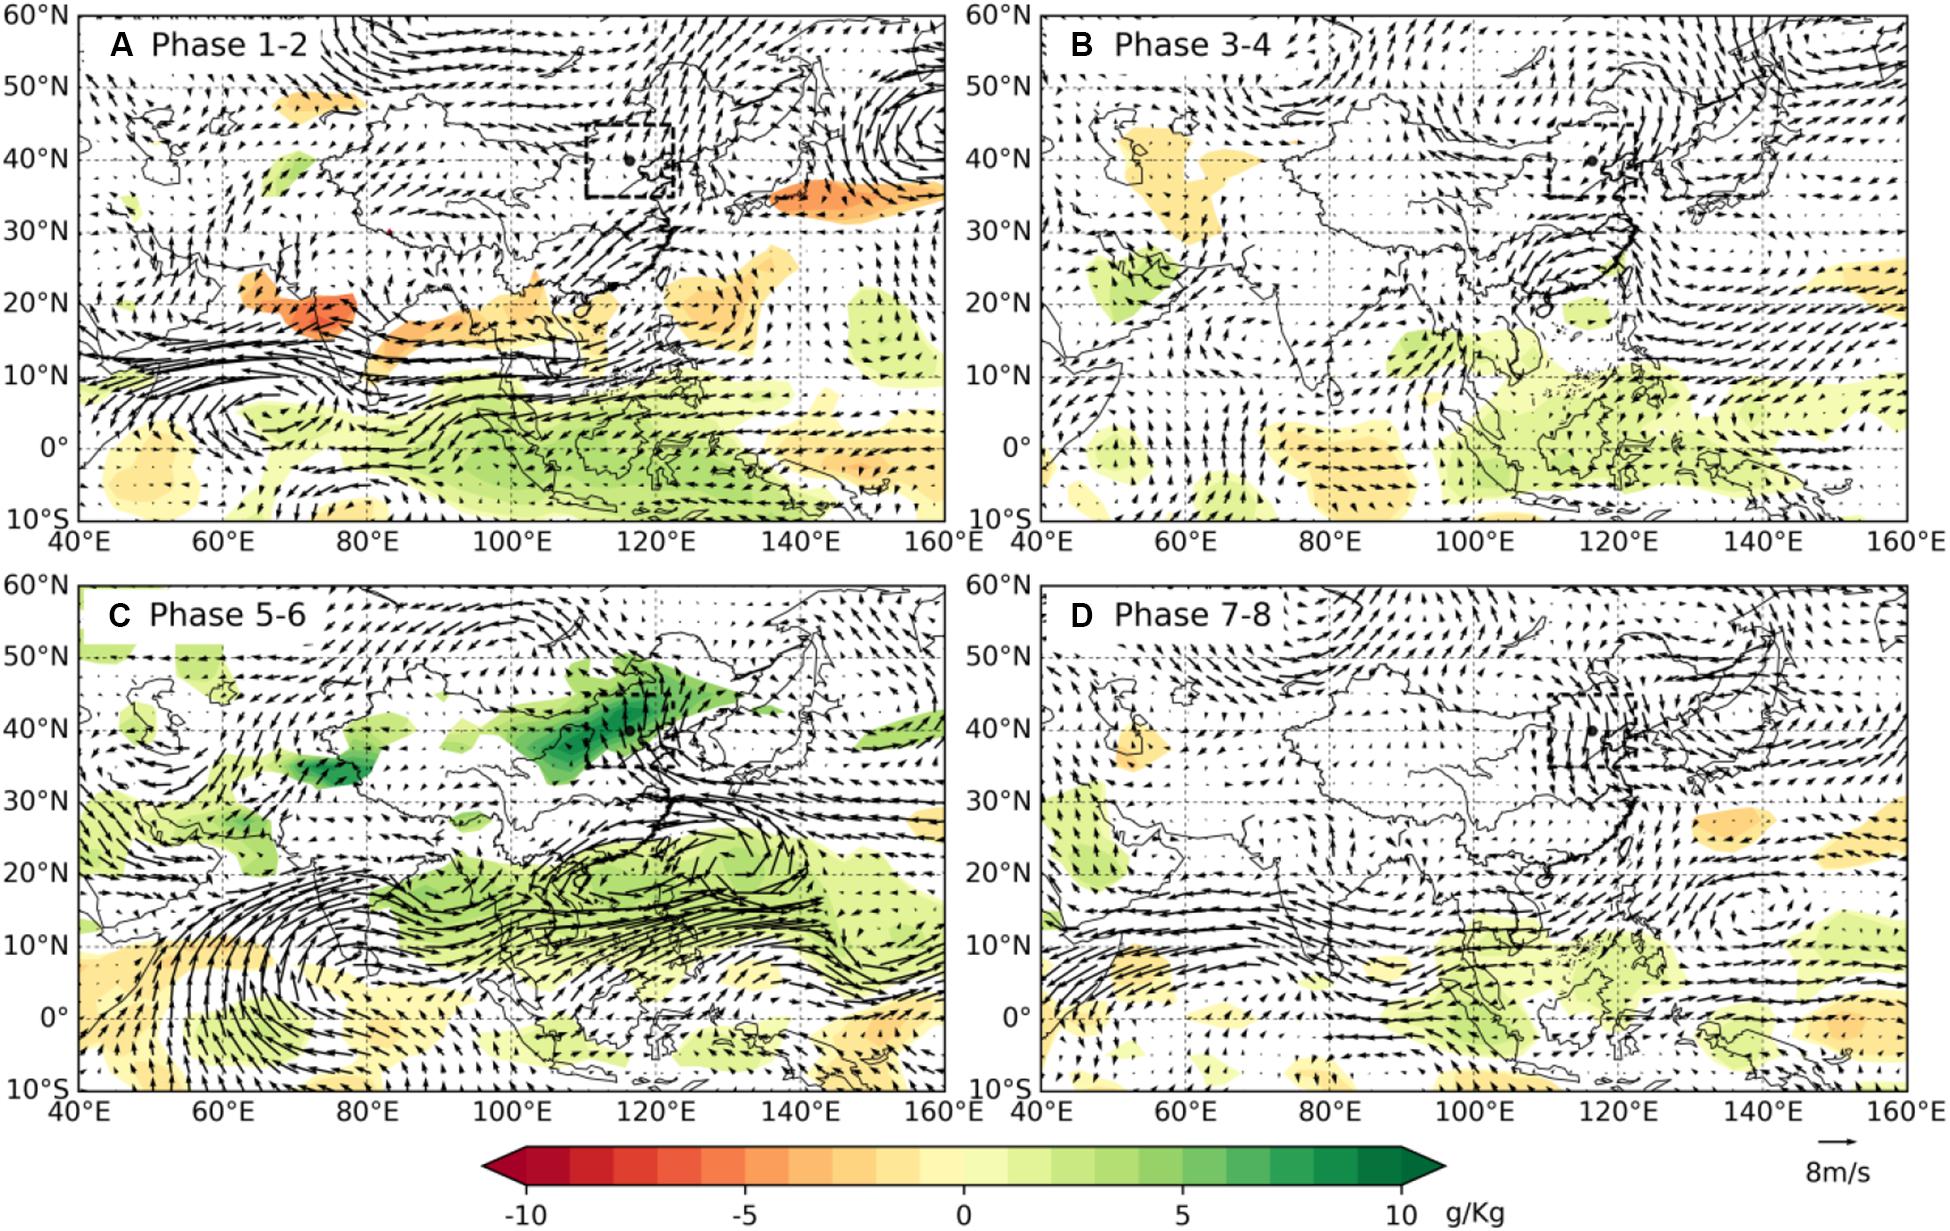
Figure 6. Composites of anomalous wind at 850 hPa in each phase of MJO in the summer of 2018. Unit: m⋅s–1. The shaded areas are the convergence or divergence of water vapor (shaded areas exceed the 95% confidence level). Unit: g⋅kg–1. (A) The Composite map of horizontal wind field anomaly(arrow) and specific humidity field anomaly(shaded areas, passed 95% significance level) on 850hPa layer corresponding to the phase 1-2 of MJO. (B–D) The same, but corresponding to the 3-4, 5-6, 7-8 phases of MJO.
Figure 7 shows the horizontal wind field anomaly at 850 hPa for regression and reconstruction onto the MJO indexes RMM1 and RMM2 in the summer of 2018, and the shaded areas show the convergence and divergence of water vapor. It can be seen that the circulation anomaly is quite similar, but there are some differences. Similar circulation characteristics are as follows: the tropical Indian Ocean has a weak anticyclonic circulation anomaly, there is a cyclonic circulation anomaly to the north of the Bay of Bengal, north of the South China Sea and the Western Pacific Ocean, and there is an anticyclonic circulation anomaly near the Korean Peninsula, forming a “cyclone–anticyclone pair.” The difference is that corresponding to RMM1, North China has a southerly wind anomaly, and water vapor has a positive anomaly; corresponding to RMM2, North China has a southeast wind anomaly, with significantly more water vapor. Therefore, the influence of the two main modes of MJO upon the summer precipitation in North China is caused by different water vapor transfer directions. It should be explained that from the definition of the MJO index, phases 5 and 6 correspond to the maximum positive values of RMM1 and RMM2, so the anomaly field of regression and reconstruction of RMM1 and RMM2 corresponds to phases 5 and 6 of MJO.

Figure 7. The regressed pattern of anomalous wind at 850 hPa onto (A) RMM1 and (B) RMM2 in the summer of 2018 (arrowheads, unit: m⋅s– 1). The shaded areas are the convergence and divergence of water vapor (exceeds the 95% confidence level). Unit: g⋅kg– 1.
Circulation Anomaly at 500 hPa
Figure 8 shows the height field formed at 500 hPa while corresponding to different phases of MJO in the summer of 2018, and the shaded areas show the departure fields after removing the multi-year mean value in summer. It can be seen that corresponding to different phases of MJO, there is obvious change with a mid-high latitude trough and ridge and subtropical high. In phases 1–2 of MJO, to the north of the trough of Lake Baikal, there is a northwest air current over North China, and the subtropical high of the Northwestern Pacific Ocean is weak and southerly. When MJO enters phases 3–4, the area near Lake Baikal turns to ridge, North China is controlled by the northwest air current in front of the ridge, and the subtropical high is strengthened, being southerly and easterly. When MJO enters phases 5–6, the subtropical high obviously moves northward near the Korean Peninsula, and intensity increases; North China is situated on the northwest of the air current in front of the trough and subtropical high. Such circulation is favorable for the ascending motions in North China. When MJO enters phases 7–8, North China is under the effect of a northwest air current behind the west wind trough, and the subtropical high is easterly and southerly. Although there is certain motive for ascending, no water-vapor source is available, thus being unfavorable for precipitation in North China.
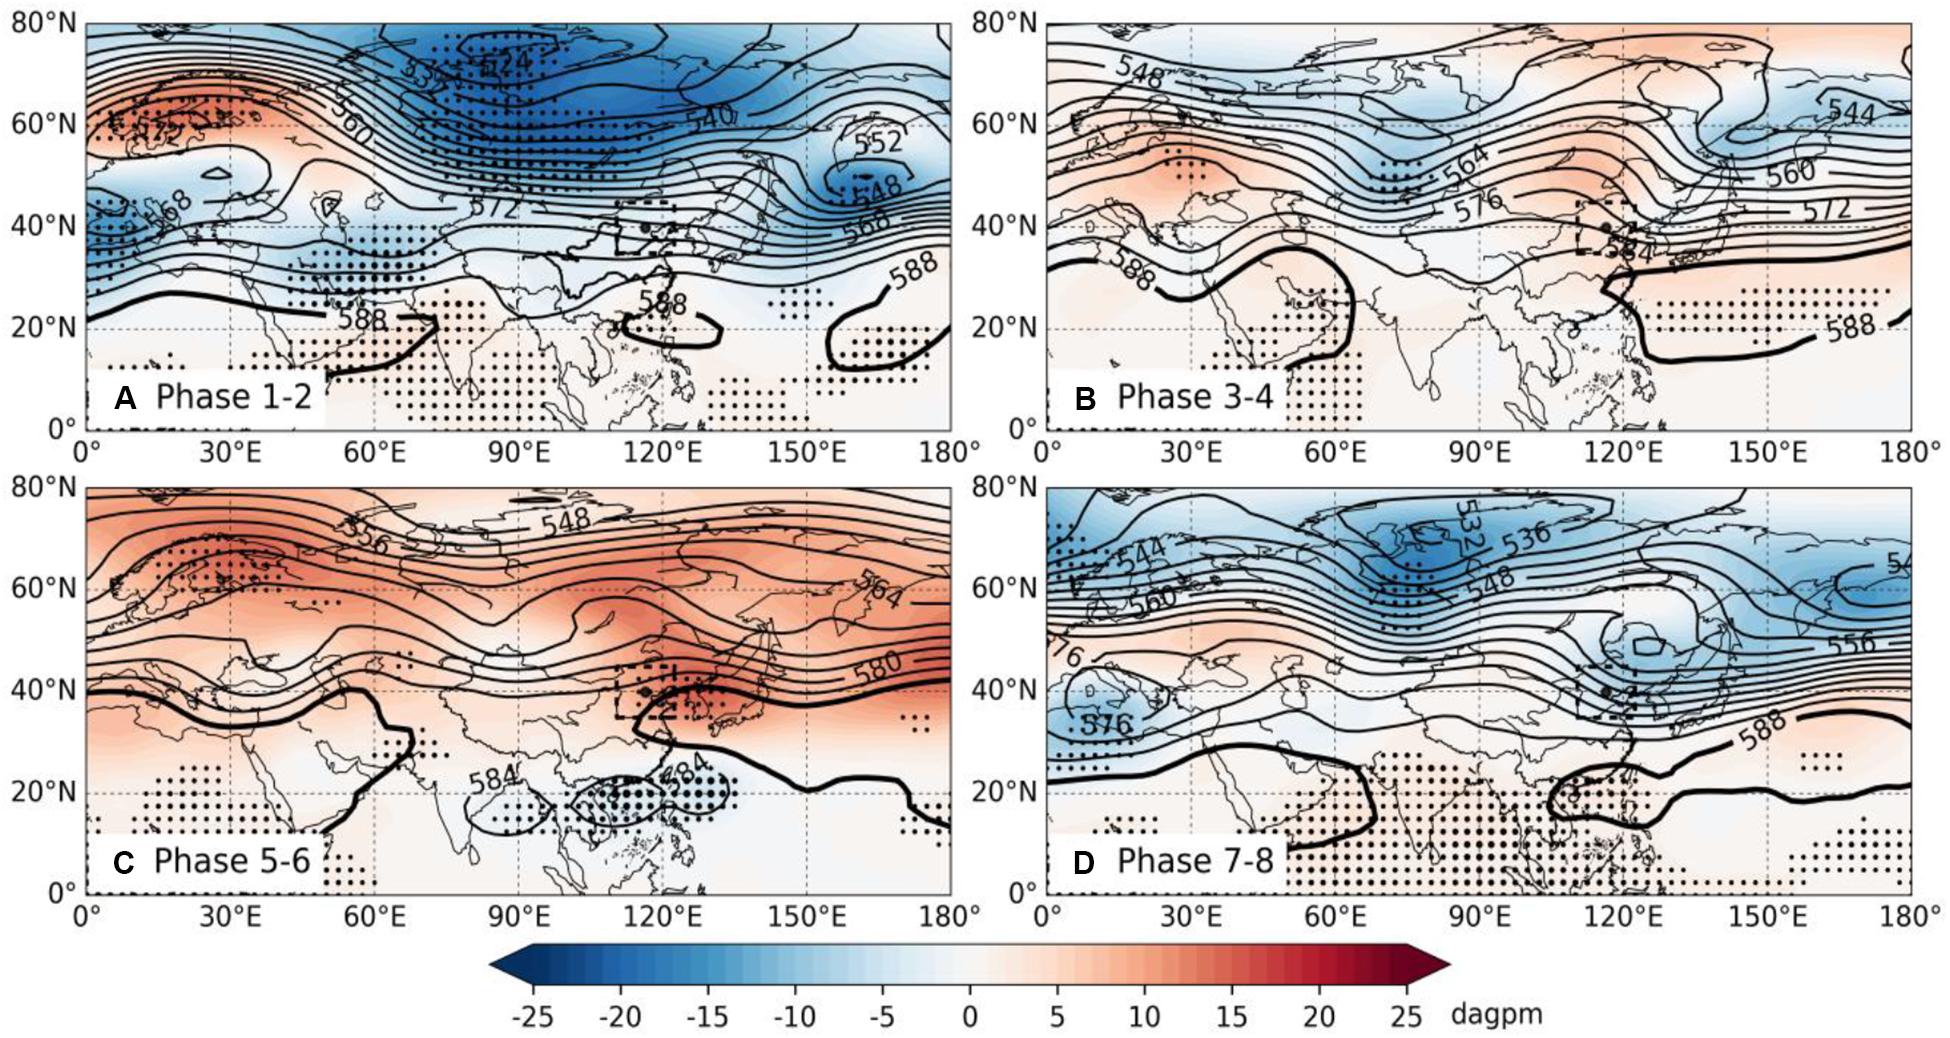
Figure 8. Composites of 500-hPa height (contour line) and its anomalous (the dotted areas exceed 95% confidence level) in each phase of MJO in the summer of 2018. Unit: dagpm. (A) The composite map of 500hPa height field (isoline) and its anomaly (shaded areas, doted areas passed the 95% confidence level) corresponding to the phase 1-2 of MJO. (B–D) The same, but corresponding to the 3-4, 5-6, 7-8 phases of MJO.
Figure 9 shows the height field anomaly at 500 hPa for regression and reconstruction onto the MJO indexes RMM1 and RMM2 (shaded area), and the contours are means of the height fields in the summer over many years. It can be seen that the two diagrams show relatively similar anomaly characteristics, the middle latitude has an obvious low and high disturbance wave train for propagation along the latitude direction, there is a negative anomaly from the west of Lake Baikal to the Xinjiang region of China, and there is an obvious positive anomaly near the Korean Peninsula. This indicates that in the summer of 2018, owing to the influence of MJO, the Lake Baikal trough was further deepened, and the subtropical high was further strengthened near the Korean Peninsula. Because of the blocking effect of the east anticyclone to the west trough, the conditions for ascending motions have been strengthened in North China, thus being favorable for summer precipitation in North China. Therefore, the MJO in the summer influences summer precipitation in North China through the adjustment of the Lake Baikal trough and the subtropical high. When RMM1 and RMM2 are positive values, the Lake Baikal trough is deepened, and the Western Pacific subtropical high moves northward near the Korean Peninsula and is strengthened, thus being favorable for summer precipitation in North China.

Figure 9. The regressed pattern of anomalous height at 500 hPa onto (A) RMM1 and (B) RMM2 in the summer of 2018 (the dotted areas exceed 95% confidence level). The contours are the summer means of 500 hPa height for the years 1981–2010. Unit: dagpm.
Circulation Anomaly at 200 hPa
Madden–Julian Oscillation convection often excites disturbance at the middle and upper troposphere, propagating toward the lower reaches through a westerly jet, thus influencing summer precipitation in North China. Also, 200 hPa circulation is chosen here for key analysis. Figure 10 shows the composites of height anomaly at 200 hPa in different phases of MJO in the summer of 2018 (with the deduction of the summer mean for many years), and the contour lines are the averaged zonal wind velocity u in the summer of 2018. In phases 1–2 of MJO, the disturbance in the mid-high latitude region is basically negative departure, the disturbance propagates eastward along the westerly jet, and North China is situated in a relatively high-value area; when MJO enters phases 3–4, the disturbance in the mid-high latitude region is in the positive–negative phases, propagates eastward along the westerly jet, and North China is situated in a positive departure area; when MJO enters phases 5–6, the disturbance in the mid-high latitude region is basically positive departure, propagates eastward along the westerly jet, and North China is situated in the southwest part of the high-value area of the Korean Peninsula; when MJO enters phases 7–8, the disturbance in the mid-high latitude region is basically negative departure, propagates eastward along the westerly jet, and North China is situated in the relatively low-value area. In summary, this has the following characteristics: MJO will decrease the 200-hPa height field of the mid-high latitude of the Northern Hemisphere in phases 1–2 and phases 7–8; it will raise the height field in phases 5–6, and the positive anomaly of the Korean Peninsula position corresponds to the positive anomaly at 500 hPa; there are the obvious characteristics of barotropic structure, forming a strong blocking effect on the western weather system.

Figure 10. Composites of anomalous height at 200 hPa in each phase of MJO in the summer of 2018 (the dotted areas, exceed 95% confidence level; unit: dagpm). The contour lines are the averaged zonal wind velocity u at 200 hPa in the summer of 2018. Unit: m⋅s–1. (A) The composite map of 200hPa height field anomaly (shaded areas, dotted areas passed 95% confidence level) corresponding to the phase 1-2 of MJO and the isoline is the average 200hPa westerly wind speed in summer of 2018. (B–D) The same, but corresponding to the 3-4, 5-6, 7-8 phases of MJO.
To gain further understanding of the influence exerted by MJO on 200-hPa circulation, 200-hPa height field in the summer of 2018 is used for regression and reconstruction onto the MJO indexes RMM1 and RMM2. Figure 11 shows the 200-hPa height anomaly. It can be seen that the disturbance wave train excited by MJO is situated in the mid-high latitude area, propagates from west to east along the westerly jet, and North China is situated in the front of the Lake Baikal trough and in the rear of the abnormal high pressure position near the Korean Peninsula. The high pressure in the east is similar to the anomaly field of 500 and 200 hPa synthesized in phases 5–6 of MJO, indicating that MJO will cause a high pressure with barotropic structure near the Korean Peninsula, forming a strong blocking effect on the low-pressure trough from the west, and being favorable for summer precipitation in North China.

Figure 11. The regressed pattern of anomalous height at 200 hPa onto (A) RMM1 and (B) RMM2 in the summer of 2018 (the dotted areas exceed 95% confidence level; unit: dagpm). The contour lines are the averaged zonal wind velocity u at 200 hPa in the summer of 2018 (unit: m⋅s–1).
Conclusion and Discussion
There is a close relationship between summer precipitation in North China and MJO. During the times when MJO was in phases 5 and 6, North China had heavy precipitation. The linking mechanism is primarily as follows: at 850 hPa, during the eastward movement of MJO, anticyclonic circulation is excited in the north side of the convection area, thus forming a “cyclone–anticyclone pair.” Although MJO storm clouds cannot move northward to a higher latitude to have direct impact on summer precipitation in North China, the anticyclonic circulation on the north side of cyclones and anticyclones formed during the eastward movement of MJO to phases 5 and 6 can strengthen the water-vapor transfer of the southerly wind (corresponding to RMM1) or that of the southeast wind (corresponding to RMM2) in summer in North China, thus providing favorable water-vapor conditions for precipitation in North China. At 500 hPa, when MJO moves eastward into phases 5 and 6, the western Pacific subtropical high will move northward to the area near the Korean Peninsula and be strengthened, thus blocking the weather systems that come from the west, and facilitating ascending motions in North China. At 200 hPa, MJO-associated convection will generate disturbances at the upper troposphere and transmit the impacts of disturbances to downstream areas along the westerly jet waveguide, thus forming a disturbance wave train. When MJO moves eastward into phases 5 and 6, disturbances at the height of 500 hPa will have a positive anomaly near the Korean Peninsula, forming an obvious barotropic structure with a 500-hPa subtropical high, which strengthens the blocking effect to weather systems that come from the west and is favorable to precipitation in North China.
The conclusion herein is drawn on the basis of analysis of the sample in 2018, which is naturally one sided and requires deeper and more systematic study. In addition, how MJO excites the disturbance wave train at the upper troposphere and how the circulation in North China will be influenced will need further study.
Data Availability Statement
The raw data supporting the conclusions of this article will be made available by the authors, without undue reservation.
Author Contributions
All authors listed have made a substantial, direct and intellectual contribution to the work, and approved it for publication.
Funding
This work was supported by the National Natural Science Foundation of China (41875069 and 41805058).
Conflict of Interest
The authors declare that the research was conducted in the absence of any commercial or financial relationships that could be construed as a potential conflict of interest.
Acknowledgments
The authors would like to thank the reviewers for their comments that helped to improve the manuscript.
Footnotes
References
Bai, X. X., Li, C. Y., and Li, L. (2012). Numerical simulation study of the Madden-Julian oscillation influences on spring precipitation in China. Acta Meteorol. Sin. 70, 986–1003. doi: 10.11676/qxxb2012.083
Bai, X. X., Li, C. Y., Tan, Y., and Guan, Z.-J. (2013). The impacts of Madden-Julian oscillation on spring rainfall in East China. J. Trop. Meteor 19, 214–222. doi: 10.16555/j.1006-8775.2013
Bai, X. X., Li, C. Y., Tan, Y. K., and Guan, Z. J. (2016). Analysis of the Madden–Julian oscillation impacts on the spring rainfall in east China. J. Trop. Meteor 27, 814–822. doi: 10.3969/j.issn.1004-4965.2011.06.004
Barlow, M., Wheeler, M., Lyon, B., and Cullen, H. (2005). Modulation of daily precipitation over Southwest Asia by the Madden–Julian oscillation. Mon. Wea. Rev. 133, 3579–3594. doi: 10.1175/MWR3026.1
Black, J., Johnson, N. C., Baxter, S., Feldstein, S. B., Harnos, D. S., and L’Heureux, M. L. (2017). The predictors and forecast skill of northern hemisphere teleconnection patterns for lead times of 3–4 weeks. Mon. Wea. Rev. 145, 2855–2877. doi: 10.1175/MWR-D-16-0394.1
Bond, N. A., and Vecchi, G. A. (2003). The influence of the Madden–Julian oscillation on precipitation in Oregon and Washington. Wea. Forecas. 18, 600–613. doi: 10.1175/1520-0434(2003)018<0600:tiotmo>2.0.co;2
Chen, G. S., and Wang, B. (2018a). Does the MJO have a westward group velocity? J. Clim. 31, 2435–2443. doi: 10.1175/JCLI-D-17-0446.1
Chen, G. S., and Wang, B. (2018b). Effects of enhanced front walker cell on the westward propagation of the MJO. J. Clim. 31, 7719–7738. doi: 10.1175/JCLI-D-17-0383.1
Chen, L. X., Zhu, C. W., Wang, W., and Zhang, P. (2001). Analysis of the characteristics of 30-60 day low-frequency oscillation over Asia during 1998 SCSMEX. Adv. Atmos. Sci. 18, 623–638. doi: 10.1007/s00376-001-0050-0
Ding, Y. H., and Liang, P. (2010). Extended range forecast basing on MJO. Meteor. Mon. 36, 111–122. doi: 10.7519/j.issn.1000-0526.2010.7.018
Ferranti, L., Palmer, T. N., Molteni, F., and Klinker, K. (1990). Tropical–extratropical interaction associated with the 30–60 day oscillation and its impact on medium and extended range prediction. J. Atmos. Sci. 47, 2177–2199. doi: 10.1175/1520-04691990047<2177:TEIAWT<2.0.CO;2
Fu, C. B., An, Z. S., and Guo, W. D. (2005). Evolution of life-supporting environment in our nation and the predictive study of aridification in northern China (I): main scientific issues and achievements. Adv. Earth Sci. 20, 1157–1167. doi: 10.11867/j.issn.1001-8166.2005.11.1157
Hao, L. S., and Hou, W. (2018). Study on Summer Precipitation Change and Prediction Technology in North China(in Chinese). Beijing: China Meteorological Press, 201.
Hendon, H. H., and Liebmann, B. (1990a). A composite study of onset of the Australian summer monsoon. J. Atmos. Sci. 47, 2227–2240. doi: 10.1175/1520-0469(1990)047<2227:acsooo>2.0.co;2
Hendon, H. H., and Liebmann, B. (1990b). The intraseasonal (30–50 day) oscillation of the Australian summer monsoon. J. Atmos. Sci. 47, 2909–2924. doi: 10.1175/1520-0469(1990)047<2909:tidoot>2.0.co;2
Higgins, R., and Shi, W. (2001). Intercomparison of the principal modes of interannual and intraseasonal variability of the North American monsoon system. J. Clim. 14, 403–417. doi: 10.1175/1520-04422001014<0403:IOTPMO<2.0.CO;2
Hoskins, B. (2013). The potential for skill across the range of the seamless weather-climate prediction problem: A stimulus for our science. Quart. J. R. Meteo. Soc. 139, 573–584. doi: 10.1002/qj.1991
Hsu, P. C., Li, T., You, L., Jianyun, G., and Hong-Li, R. (2015). A spatial–temporal projection model for 10–30 day rainfall forecast in South China. Clim. Dyn. 44, 1227–1244. doi: 10.1007/s00382-014-2215-4
Huang, R. H., Xu, Y. H., and Zhou, L. T. (1999). The interdecadal variation of summer precipitations in china and the drought trend in North China. Plate. Meteorol. 18, 465–476.
Jeong, J. H., Kim, B. M., Ho, C. H., and Noh, Y.-H. (2008). Systematic variation in winter-time precipitation in East Asia by MJO-induced extratropical vertical motion. J. Clim. 21, 788–801. doi: 10.1175/2007JCLI1801.1
Jia, X. L., Chen, L. J., Ren, F. M., and Li, C. (2011). Impacts of the MJO on winter rainfall and circulation in China. Adv. Atmos. Sci. 28, 521–533. doi: 10.1007/s00376-010-9118-z
Jia, X. L., and Liang, X. Y. (2013). Possible impacts of madden-julian oscillation on the severe rain–snow weather in China during November 2009. J. Trop. Meteor. 19, 233–241. doi: 10.16555/j.1006-8775.2013.03.004
Jones, C. (2000). Occurrence of extreme precipitation events in California and relationships with the Madden-Julian oscillation. J. Clim. 13, 3576–3587. doi: 10.1175/1520-04422000013<3576:OOEPEI<2.0.CO;2
Jones, C., Carvalho, L. M. V., Higgins, R. W., Waliser, D. E., and Schemm, J.-K. E. (2004a). A statistical forecast model of tropical intraseasonal convective anomalies. J. Clim. 17, 2078–2095. doi: 10.1175/1520-04422004017<2078:ASFMOT<2.0.CO;2
Jones, C., Duane, E., Waliser, K., Lau, M., and Stern, W. (2004b). The Madden–Julian oscillation and its impact on northern hemisphere weather predictability. Mon. Wea. Rev. 132, 1462–1471. doi: 10.1175/1520-0493(2004)132<1462:tmoaii003E2.0.co;2
Ju, J. H., Liu, Y. L., Li, T., and Bai, Y. J. (2010). A new method for predicting summer intra-seasonal oscillation over the south china sea. J. Trop. Meteor. 26, 521–525. doi: 10.3969/j.issn.1004-4965.2010.05.002
Kalnay, E., Kanamitsu, M., Kistler, R., Collins, W., Deaven, D., and Gandin, L. (1996). The NCEP/NCAR 40-year reanalysis project. Bull. Amer. Meteor. Soc. 77, 437–472. doi: 10.1175/1520-04771996077<0437:TNYRP<2.0.CO;2
Kang, I. S., and Kim, H. M. (2010). Assessment of MJO predictability for boreal winter with various statistical and dynamical models. J. Clim. 23, 2368–2378. doi: 10.1175/2010JCLI3288.1
Lau, K. M., and Chan, P. H. (1986). Aspects of the 40-50 day oscillation during the northern summer as inferred from outgoing longwave radiation. Mon. Wea. Rev. 114, 1354–1367. doi: 10.1175/1520-04931986114<1354:AOTDOD<2.0.CO;2
Lau, K. M., Yang, G. J., and Shen, S. H. (1988). Seasonal and intraseasonal climatology of summer monsoon rainfall over East Asia. Mon. Wea. Rev. 116, 18–37. doi: 10.1175/1520-04931988116<0018:SAICOS<2.0.CO;2
Lawrence, D. M., and Webster, P. J. (2002). The boreal summer intra-seasonal oscillation:Relationship between northward and eastward movement of convection. J. Atmos. Sci. 59, 1593–1606. doi: 10.1175/1520-04692002059<1593:TBSIOR<2.0.CO;2
Leroy, A., and Wheeler, M. C. (2008). Statistical prediction of weekly tropical cyclone activity in the southern hemisphere. Mon. Wea. Rev. 36, 3637–3654. doi: 10.1175/2008MWR2426.1
Li, C. Y., Ling, J., Yuan, Y., Pan, J., Jia, X-L., and Chen, X. (2016). Frontier issues in current MJO studies. J. Trop. Meteor. 32, 797–816. doi: 10.16032/j.issn.1004-4965.2016.06.003
Li, C. Y., Pan, J., and Song, J. (2013). Progress on the MJO research in recent years. Chin. J. Atmos. Sci. 37, 229–252.
Li, T. (2014). Recent advance in understanding the dynamics of the Madden-Julian oscillation. J. Meteo. Res. 28, 1–33. doi: 10.1007/s13351-014-3087-6
Li, T., Ju, J. H., and Gan, W. W. (2012a). The relationship of the preceding winter MJO activities and the summer precipitation in Yangtze– Huaihe River basin of China. J. Trop. Meteor. 18, 32–44.
Li, T., Yan, X., and Ju, J. H. (2012b). Impact of MJO activities on precipitation in May over Yunnan. Chin. J. Atmos. Sci. 36, 1101–1111. doi: 10.3878/j.issn.1006-9895.2012.11152
Li, W. K., He, J. H., Qi, L., and Chen, B. M. (2014). The influence of the Madden-Julian oscillation on annually first rain season precipitation in south china and its possible mechanism. J. Trop. Meteor. 30, 983–989. doi: 10.3969/j.issn.1004-4965.2014.05.019
Li, Y. H., Xiang, B., Lu, C. H., Ju, J. H., and Wang, N. (2016). Impact of Madden-Julian oscillation activities on precipitation in summer over the East of Southwest China and its possible mechanism. Chin. J. Atmos. Sci. 40, 437–450. doi: 10.3878/j.issn.1006-9895.1506.15134
Liang, P., and Ding, Y. H. (2012). Extended range forecast experiment based on intraseasonal oscillation. Chin. J. Atmos. Sci. 36, 102–116. doi: 10.3878/j.issn.1006-9895.2012.01.09
Liang, P., and Lin, H. (2018). Sub-seasonal prediction over East Asia during boreal summer using the ECCC monthly forecasting system. Clim. Dyn. 50, 1007–1022. doi: 10.1007/s00382-017-3658-1
Liebmann, B., Kiladis, G. N., Vera, C. S., Saulo, A. C., and Carvalho, L. M. V. (2004). Sub-seasonal variations of rainfall in the vicinity of the South American low-level jet stream and comparison to those in the South Atlantic Convergence Zone. J. Clim. 17, 3829–3842. doi: 10.1175/1520-04422004017<3829:SVORIS<2.0.CO;2
Lin, A. L., Ji, Z. P., Gu, D. J., Li, C. H., Zhen, B., and He, C. (2016). Application of atmospheric intraseasonal oscillation in precipitation forecast over south china. J. Trop. Meteor. 32, 878–889. doi: 10.16032/j.issn.1004-4965.2016.06.009
Liu, F., Ouyang, Y., Wang, B., Yang, J., Ling, J., and Hsu, P.-C. (2020). Seasonal evolution of the intraseasonal variability of China summer precipitation. Clim. Dyn. 54, 4641–4655. doi: 10.1007/s00382-020-05251-0
Lü, J. M., Ju, J. H., Ren, J. Z., and Gan, W. W. (2012). The influence of the Madden-Julian oscillation activity anomalies on Yunnan’s extreme drought of 2009-2010. Sci. China Earth Sci. 55, 98–112. doi: 10.1007/s11430-011-4348-1
Ma, T. T., Wu, Z. W., Jiang, Z. H., and xie, W. X. (2014). Relationship between the northward propagation of the madden-julian oscillation in April to June and the outbreaks of East Asian monsoon. J. Trop. Meteor. 30, 921–931. doi: 10.3969/j.issn.1004-4965.2014.05.012
Madden, R. A., and Julian, P. R. (1971). Detection of a 40~50 day oscillation in the zonal wind in the tropical Pacific. J. Atmos. Sci. 28, 702–708. doi: 10.1175/1520-04691971028
Madden, R. A., and Julian, P. R. (1972). Description of global-scale circulation cells in the tropics with a 40–50 day period. J. Atmos. Sci. 29, 1109–1123. doi: 10.1175/1520-04691972029<1109:DOGSCC<2.0.CO;2
Madden, R. A., and Julian, P. R. (1994). Observations of the 40–50-day tropical oscillation—a review. Mon. Wea. Rev. 122, 814–837. doi: 10.1175/1520-04931994122<0814:OOTDTO<2.0.CO;2
Maloney, E. D., and Hartmann, D. L. (2000). Modulation of eastern North Pacific hurricanes by the Madden-Julian oscillation. J. Clim. 13, 1451–1460. doi: 10.1175/1520-04422000013<1451:MOENPH<2.0.CO;2
Matthews, A. J., Hoskins, B. J., and Masutani, M. (2004). The global response to tropical heating in the Madden-Julian oscillation during the northern winter. Quart. J. Roy. Meteor. Soc. 130, 1991–2011. doi: 10.1256/qj.02.123
Newman, M., Prashant, D. S., Christopher, R., and Whitaker, J. S. (2003). A study of subseasonal predictability. Mon. Wea. Rev. 131, 1715–1732. doi: 10.1175//2558.1
Qi, Y. J., and Zhang, R. H. (2015). A review of the intraseasonal oscillation associated with rainfall over eastern china and its operational application. J. Trop. Meteor. 31, 566–576. doi: 10.16032/j.issn.1004-4965.2015.04.014
Ren, H. L., and Shen, Y. Y. (2016). A new look at impacts of MJO on weather and climate in China. Adv. Meteo. Sci. Tech. 6, 97–105. doi: 10.3969/j.issn.2095-1973.2016.03.013
Ren, H. L., Wu, J., Zhao, C. Y., Liu, Y., Jia, X. L., and Zhang, P. Q. (2015). Progresses of MJO prediction researches and developments. J. Appl. Meteorol. Sci. 26, 658–668. doi: 10.11898/1001-7313.20150602
Rodney, M., Lin, H., and Derome, J. (2013). Subseasonal prediction of wintertime North American surface air temperature during strong MJO events. Mon. Wea. Rev. 141, 2897–2909. doi: 10.1175/MWR-D-12-00221.1
Sui, C. H., and Lau, K. M. (1992). Multiple phenomena in the tropical atmosphere over the western Pacific. Mon. Wea. Rev. 120, 407–430. doi: 10.1175/1520-04931992120<0407:MPITTA<2.0.CO;2
Takasuka, D., Satoh, M., and Yokoi, S. (2019). Observational evidence of mixed Rossby-gravity waves as a driving force for the MJO convective initiation and propagation. Geophys. Res. Lett. 46, 5546–5555. doi: 10.1029/2019GL083108
Torrence, C., and Compo, G. P. (1998). A practical guide to wavelet analysis. Bull. Amer. Meteor. Soc. 79, 61–78. doi: 10.1175/1520-04771998079<0061:APGTWA<2.0.CO;2
Vitart, F., Ardilouze, C., Bonet, A., Brookshaw, A., Chen, M., and Codorean, C. (2017). The subseasonal to seasonal(S2S) prediction project database. Bull. Amer. Meteor. Soc. 98, 163–173. doi: 10.1175/BAMS-D-16-0017.1
Waliser, D. E., Jones, C., Schemm, J. K., and Graham, N. E. (1999). A statistical extended range tropical forecast model based on the slow evolution of the Madden-Julian oscillation. J. Clim. 12, 1918–1939. doi: 10.1175/1520-0442(1999)012<1918:asertf003E2.0.co;2
Waliser, D. E., Lau, K. M., Stern, W., and Jones, C. (2003). Potential predictability of the madden-julian oscillation. Bull. Amer. Meteor. Soc. 84, 33–50. doi: 10.1175/BAMS-84-1-33
Wang, B., Lee, S. S., Waliser, D. E., Zhang, C. D., Sobel, A., Maloney, E., et al. (2018). Dynamics-oriented diagnostics for the Madden–Julian oscillation. J. Clim. 31, 3117–3135. doi: 10.1175/JCLI-D-17-0332.1
Wang, B., Yang, J., Zhou, T. J., and Wang, B. (2008). Interdecadal changes in the major modes of Asian-Australian monsoon variability:strengthening relationship with ENSO since the late 1970s. J. Clim. 21, 1771–1789. doi: 10.1175/2007JCLI1981.1
Wang, F. Y., Tian, W. S., Xie, F., Zhang, J. K., and Han, Y. Y. (2018). Effect of Madden–Julian oscillation occurrence frequency on the interannual variability of northern hemisphere stratospheric wave activity in winter. J. Clim. 31, 5031–5049. doi: 10.1175/JCLI-D-17-0476.1
Wang, H., Liu, F., Wang, B., and Li, T. (2018). Effect of intraseasonal oscillation on south china sea summer monsoon onset. Clim. Dyn. 51, 2543–2558. doi: 10.1007/s00382-017-4027-9
Webster, P. J., and Hoyos, C. (2004). Prediction of monsoon rainfall and river discharge on 15 30- day time scales. Bull. Amer. Meteor. Soc. 85, 1745–1765. doi: 10.1175/BAMS-85-11-1745
Wei, F. Y. (2007). Modern Climate Statistical Analysis and Prediction Techniques, 2nd edn. Beijing: China Meteorological Press, 296.
Wheeler, M. C., and Hendon, H. H. (2004). An all-season real-time multivariate MJO index: development of an index for monitoring and prediction. Mon. Wea. Rev. 132, 1917–1932. doi: 10.1175/1520-0493(2004)132<1917:aarmmi003E2.0.co;2
Wheeler, M. C., Hendon, H. H., and Cleland, S. (2009). Impacts of the Madden-Julian oscillation on Australian rainfall and circulation. J. Clim. 22, 1482–1498. doi: 10.1175/2008JCLI2595.1
World Meteorological Organization [WMO] (2018). WWRP/WCRP Sub-seasonal to Seasonal Prediction Project (S2S) Phase II Proposal. Geneva: WMO.
Wu, J., Ren, H. L., Xu, X. F., and Gao, L. (2018). Seasonal modulation of MJO’s impact on precipitation in China and its dynamical-statistical downscaling prediction. Meteor. Mon. 44, 737–751. doi: 10.7519/j.issn.1000-0526.2018.06.002
Wu, J., Ren, H. L., Zuo, J., Zhao, C., Chen, L., and Li, Q. (2016). MJO prediction skill, predictability, and teleconnection impacts in the Beijing Climate Center atmospheric general circulation model. Dyn. Atmos. Oceans 75, 78–90. doi: 10.1016/j.dynatmoce.2016.06.001
Yan, X., and Ju, J. H. (2016). Analysis of the major characteristics of persistent MJO anomalies in the summer. Chin. J. Atmos. Sci. 40, 1048–1058. doi: 10.3878/j.issn.1006-9895.1601.15248
Yang, Q. M. (2015). Prospects and progresses in the research of the methods for 10-30 days extended-range weather forecast. Adv. Earth Sci. 30, 970–984.
Yang, Q. M., Li, Y., Song, J., and Huang, S. C. (2012). Study of the extended range forecast of the principal 20-30 day oscillation pattern of the circulation over East Asia in the summer of 2002. Acta Meteorol. Sin. 70, 1045–1054. doi: 10.11676/qxxb2012.087
Yuan, Y., Gao, H., Li, W. J., Liu, Y. J., Chen, L. J., Zhou, B., et al. (2017). Analysis and comparison of summer precipitation features and physical mechanisms between 2016 and 1998. Acta Meteorol. Sin. 75, 19–38. doi: 10.11676/qxxb2017.019
Zhang, C. D. (2013). Madden–Julian oscillation: bridging weather and climate. Bull. Amer. Meteor. Soc. 94, 1849–1870. doi: 10.1175/BAMS-D-12-00026.1
Zhang, D. Q., Zheng, Z. H., Chen, L. J., and Zhang, P. Q. (2019). Advances on the predictability and prediction methods of 10-30d extended range forecast. J. Appl. Meteorol. Sci. 30, 416–430. doi: 10.11898/1001-7313.20190403
Zhang, L. N., Wang, B. Z., and Zeng, C. Q. (2009). Impacts of the Madden–Julian oscillation on summer rainfall in Southeast China. J. Clim. 22, 201–216. doi: 10.1175/2008JCLI1959.1
Zhang, L. P., and Zhang, L. F. (2013). Research on forecasting monthly rainfall over the Yangtze River Valley using Madden-Julian oscillation. Meteor. Mon. 39, 1217–1220. doi: 10.7519/j.issn.1000-0526.2013.09.019
Zhang, Q. Y., Tao, S. Y., and Zhang, S. L. (2003). The persistent heavy rainfall over the Yangtze River Valley and its associations with the circulations over East Asian during Summer. Chin. J. Atmos. Sci. 27, 1018–1030. doi: 10.3878/j.issn.1006-9895.2003.06.06
Zhao, J. Y., Ma, Z. F., and Fan, G. Z. (2016). Impact of the madden-julian oscillation on Autumn rainfall in West China. Plate. Meteorol. 35, 1487–1497. doi: 10.7522/j.issn.1000-0534.2015.00089
Zhao, Z. J., Eric, C. J., Oliver, D. B., Jose, M. V. H., and Holbrook, N. J. (2019). Influence of the madden-julian oscillation on costa rican mid-summer drought timing. Int. J. Climatol. 39, 292–301. doi: 10.1002/joc.5806
Zheng, C., and Chang, E. K. M. (2019). The role of MJO propagation, lifetime, and intensity on modulating the temporal evolution of the MJO extratropical response. J. Geo. Res. Atmos. 124, 5352–5378. doi: 10.1029/2019JD030258
Keywords: North China, summer precipitation, Madden–Julian Oscillation, relationship, extended-range forecast
Citation: Hao L, He L, Ma N, Liang S and Xie J (2020) Relationship Between Summer Precipitation in North China and Madden–Julian Oscillation During the Boreal Summer of 2018. Front. Earth Sci. 8:269. doi: 10.3389/feart.2020.00269
Received: 27 April 2020; Accepted: 15 June 2020;
Published: 14 July 2020.
Edited by:
Zhiwei Zhu, Nanjing University of Information Science and Technology, ChinaReviewed by:
Fei Liu, Nanjing University of Information Science and Technology, ChinaPing Liang, Shanghai Meteorological Bureau, China
Copyright © 2020 Hao, He, Ma, Liang and Xie. This is an open-access article distributed under the terms of the Creative Commons Attribution License (CC BY). The use, distribution or reproduction in other forums is permitted, provided the original author(s) and the copyright owner(s) are credited and that the original publication in this journal is cited, in accordance with accepted academic practice. No use, distribution or reproduction is permitted which does not comply with these terms.
*Correspondence: Lisheng Hao, aGxzNTQ1MTVAMTYzLmNvbQ==