 Luca Lanci
 Barbara Delmonte
 Maria Cristina Salvatore
 Carlo Baroni
95% of researchers rate our articles as excellent or good
Learn more about the work of our research integrity team to safeguard the quality of each article we publish.
Find out more
ORIGINAL RESEARCH article
Front. Earth Sci. , 30 June 2020
Sec. Geomagnetism and Paleomagnetism
Volume 8 - 2020 | https://doi.org/10.3389/feart.2020.00258
This article is part of the Research Topic Advances in Magnetism of Soils and Sediments View all 15 articles
We measured saturation isothermal remanent magnetization (SIRM), coercivity of remanence (Hcr), and insoluble dust mass concentration (IDC) of 49 ice samples from Vostok and EPICA Dome-C ice cores (Antarctica) as a measure of magnetic properties of the aerosol dust trapped in the ice. Samples range in age from marine isotopic stage (MIS) 7 to 19 in EPICA Dome-C ice core and from MIS 1 to 11 in Vostok ice core. Data from ice samples were compared with 86 samples from possible source areas (PSA) from East Antarctica, including 11 samples from South America and New Zealand. Previous results from MIS 1 to MIS 6 found that magnetic properties of aerosol dust could be divided in two distinct groups characterized by high-Hcr and low-SIRMdust for glacial samples, and low-Hcr and high-SIRMdust, for interglacial samples. The new data from older ice samples highlighted several discrepancies from this expectation with significant differences between Vostok and Dome-C sites. Magnetic properties of Antarctic PSA sample show a large variability, however, PSA samples from Victoria Land and few other, have magnetic properties compatible with that of the glacial dust, or more precisely with samples characterized by high dust flux. The new data from Pleistocene ice and from PSA samples confirm South American and Antarctic provenance of the largest atmospheric dust load typical of glacial stages. On the other hand, we did not found any PSA sample with properties compatible with the highly magnetic samples (mostly from interglacial stages), which are characterized by low IDC. These samples from the oldest and deepest part of the cores revealed a more complex picture than previously outlined from the analysis of MIS 1–6, and show unusual magnetic properties which can be tentatively attributed to post-depositional alteration occurring into the ice.
The provenance of wind-blown dust and its characteristics are key issues to understand climate, atmospheric and environmental changes. Vostok (VK) and EPICA Dome-C (EDC) ice cores, drilled in the interior of the Antarctic ice sheet (Figure 1), provide the best known and longest dust records from Antarctica. VK gave the first dust record of the last 420,000 years (Petit et al., 1999) and revealed that the dust input to Antarctica was highest during glacial periods, lower during stadial and interstadial stages, and lowest in interglacial stages. The EDC ice core confirmed earlier findings from Vostok and, extended the dust record into the last ca. 800,000 years (Community Members EPICA, 2004; Jouzel et al., 2007), the longest polar ice core record.
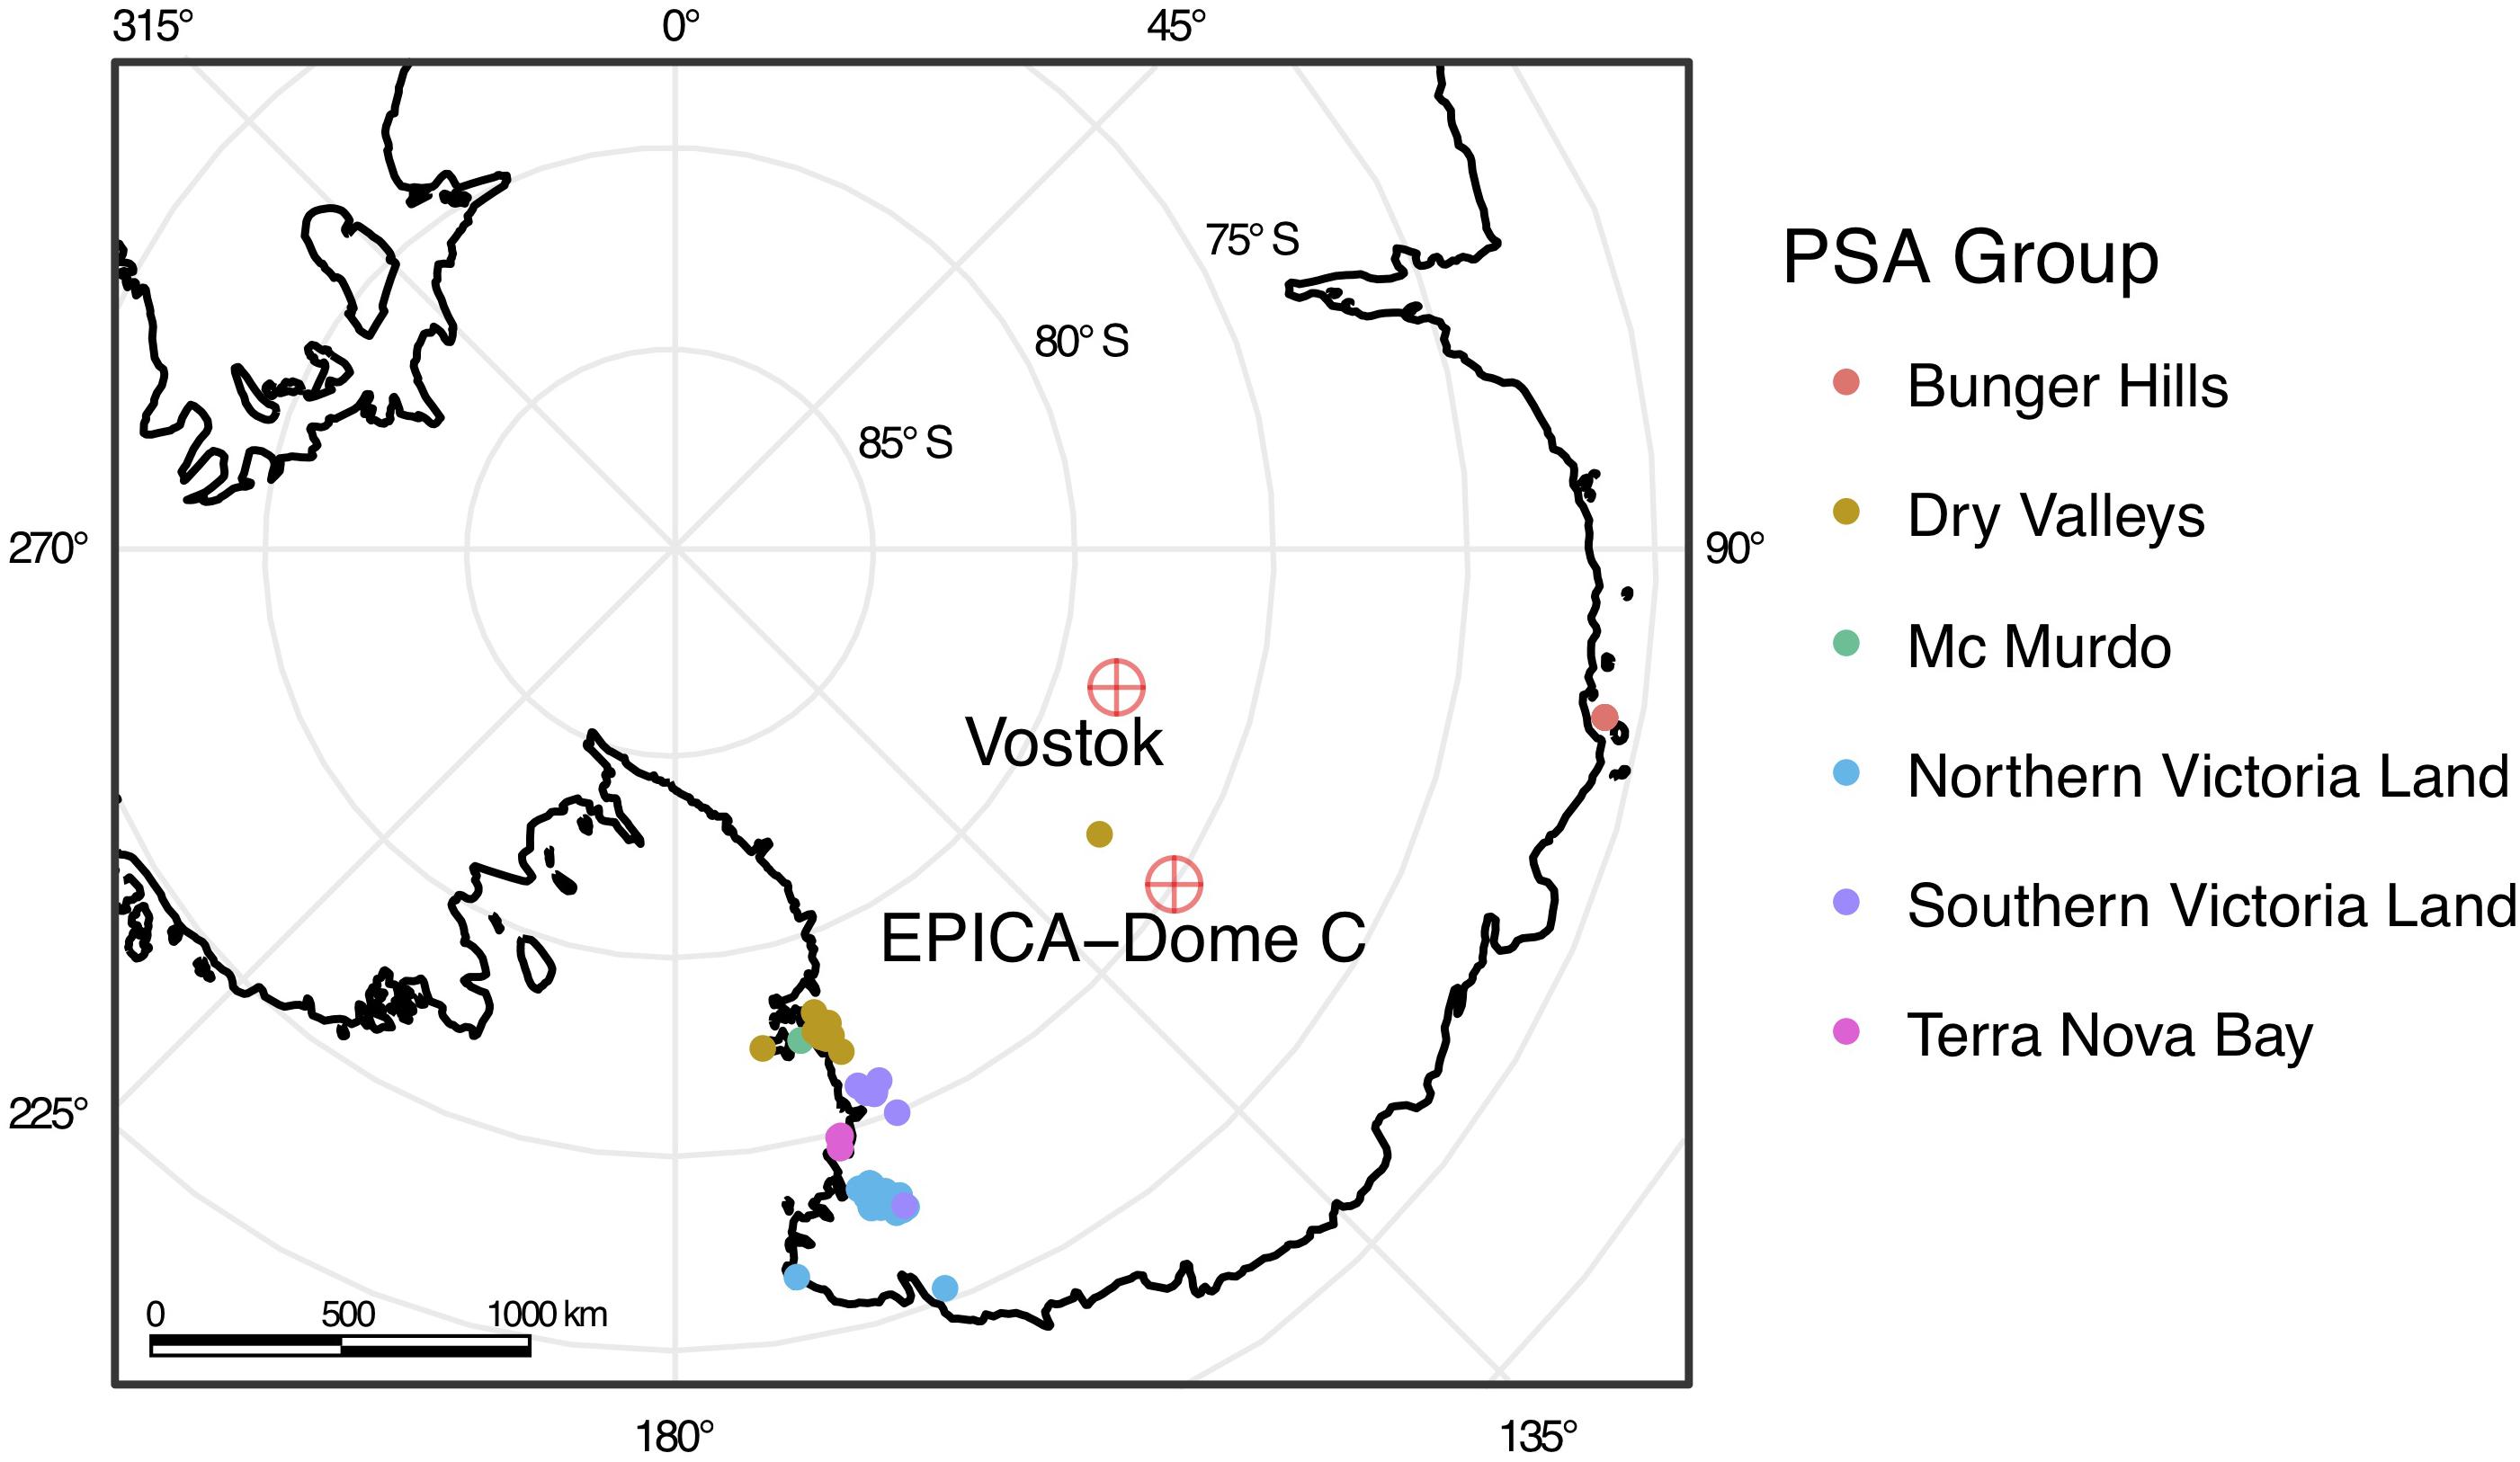
Figure 1. Location map of the Vostok and EPICA Dome-C ice cores sites and PSA samples studied for magnetic properties (see Supplementary Material for details on PSA).
The concentration of dust trapped in polar ice, its grain size and physical properties are modulated by synergistic factors related to climatic conditions and vary over orbital timescales. Therefore, the identification of dust provenance and its characteristics are important for understanding climate, atmospheric and environmental changes, and potentially provides key constraints to dust transport processes.
Many traditional geochemical methods for dust source tracking are not relevant to Antarctic ice cores because of their low dust concentration, spanning from a few ng/g during warm interglacial periods to a few hundreds of ng/g during relatively dustier glacial periods. The Sr-Nd and Pb radiogenic isotope composition of mineral dust in ice cores are the most widely-used technique for dust source tracking, however, the intrinsic limitations related to the extremely low dust abundance during interglacial stages restrict the geochemical data availability for interglacial stages to the Holocene and marine isotopic stage (MIS) 5. Magnetic measurements are not subject to this limitation since extremely low values of remanent magnetization can be precisely measured using SQUIDs magnetometers. The high sensitivity makes it possible to measure rock-magnetic properties of mineral dust directly in small ice samples (30–40 g mass) even for typical interglacial dust concentrations, overcoming the intrinsic limitations of traditional geochemical methods related to dust abundance. The intensity of isothermal remanent magnetization (IRM) and coercivity of remanence (Hcr) give information about remanence-carrying minerals in the dust. They generally consist of iron oxides and in particular hematite (γ–Fe2O3), maghemite (α–Fe2O3), and magnetite (Fe3O4), which are the most common and chemically stable natural iron oxides. Hence, magnetic properties of natural ice reflect the concentration and the type of iron oxides entrapped in the dust (e.g., Lanci et al., 2012).
Eolian dust from VK, EDC, and other sites from the interior of the East Antarctic plateau have been extensively studied for dust concentration (e.g., Lambert et al., 2008; Petit and Delmonte, 2009) and radiogenic isotope composition (Grousset et al., 1992; Basile et al., 1997; Delmonte et al., 2008, 2010a), which was compared with that of samples from possible source areas (PSA) in the Southern hemisphere to gather information on dust provenance (Revel-Rolland et al., 2006; Gaiero, 2007; Gaiero et al., 2007). Geographic provenance of aeolian mineral dust during the last climate cycle, suggests a dominant source from southern South America during glacials with an open question for the Holocene, which displays signatures and properties that are somewhat different wih respect to the glacial and variable in time. In central East Antarctica there is a general consensus on a significant contribution from different dust sources during the Holocene (Gabrielli et al., 2010) including Fe-rich local (Antarctic) sources as well (Wegner et al., 2012; Vallelonga et al., 2013). However, Paleari et al. (2019) on the basis of dust mineralogy suggested that South America is the primary dust source to Antarctica during both glacial and interglacial stages and that an additional Antarctic contribution is not required, coherently with conclusions based on Pb isotopic data from Gili et al. (2016). Sr and Nd isotope data from different ice cores confirmed a broadly uniform isotopic signature during all glacial periods of Pleistocene. Some minor differences, apparently correlated to the dust influx onto the Plateau, have been observed and interpreted as related to the activation of a secondary, still unidentified, dust source during dustier glacial stages (Delmonte et al., 2010a).
Geochemical data from interglacial ice are rather scarce. Gabrielli et al. (2010) studied aeolian dust composition using Rare Earth Elements concentration in EDC from 2.9 to 33.7 kyr BP, measuring a large number of samples from both climate stages. They found a homogeneous crustal-like composition during the last glacial stage consistent with dust from heterogeneous sources located in different areas or within the same region (e.g., South America). Starting at about 15 kyr BP, they found a major change in dust composition, which was characterized by a larger variability, and that persisted throughout the Holocene. They interpreted this variable character as the alternation of different dust sources during the Holocene.
Magnetic measurements on Antarctic ice cores from MIS 1–6 in EDC and MIS 1–2 in VK (Lanci et al., 2004, 2007, 2008b, 2012), found that ice magnetic properties show a significant difference between glacial and interglacial stages, with the notable exception of MIS 1 (Holocene) in VK, which shows magnetic properties very similar to MIS 2. According to its magnetic properties the aerosol dust was divided into two distinct groups characterized by high-Hcr and low-SIRMdust for glacial samples, and low-Hcr and high-SIRMdust, for interglacial samples. It is also been observed that the glacial/interglacial difference is more pronounced at EDC compared to VK, and it is even larger at the external site of Talos dome (Lanci and Delmonte, 2013). To explain the above-mentioned differences between VK, EDC, and Talos Dome it has been hypothesized that the presence of local sources, active during interglacials, distribute the dust unevenly. Furthermore, these local sources had to be highly magnetic in order to explain the observed data, which suggested a volcanic origin. All these observations were found in general good agreement with geochemical data.
In this paper we extend the investigation of the magnetic properties of glacial and interglacial ice from EDC and VK ice cores to the late Pleistocene and compare ice measurements with magnetic measurements of PSA samples. They provide, for the first time, insights of dust origin during interglacial stages prior than MIS 6.
We analyzed ice samples from EDC and VK ice cores taken from glacial and interglacial stages in MIS 7 to MIS 19, corresponding to core depth from 2,289 m to 3,180 m, in EDC core, and from Holocene to MIS 11, corresponding to core depth from 183 m to 3,300 m, in VK core. A total of 28 ice samples from EDC and 21 samples from VK were measured. Samples consisted of approximately cubic pieces of ice weighting from ca. 30 g to 40 g. The standard preparation of the samples that includes the core cutting, decontamination, and measurement procedures, are equivalent to that described in previous papers (e.g., Lanci et al., 2012). Samples were decontaminated with ultra-pure water in a class 10,000 clean room using standard procedures and IRMs were induced in whole-ice samples at low temperature (∼100 K). Cooling at low temperature before IRM acquisition is necessary to avoid physical reorientation of magnetic grains in the ice matrix (Lanci et al., 2001; Dash et al., 2006). IRM was induced with a pulse magnetizer and measured using a 2G superconducting magnetometer with DC-SQUID sensors at the ALP laboratory. The measurements were performed quickly to avoid significant re-warming of the samples and their temperature was set back to 100 K after each measurement. IRM acquisition curves for most ice samples from both sites, are shown in Figure 2.
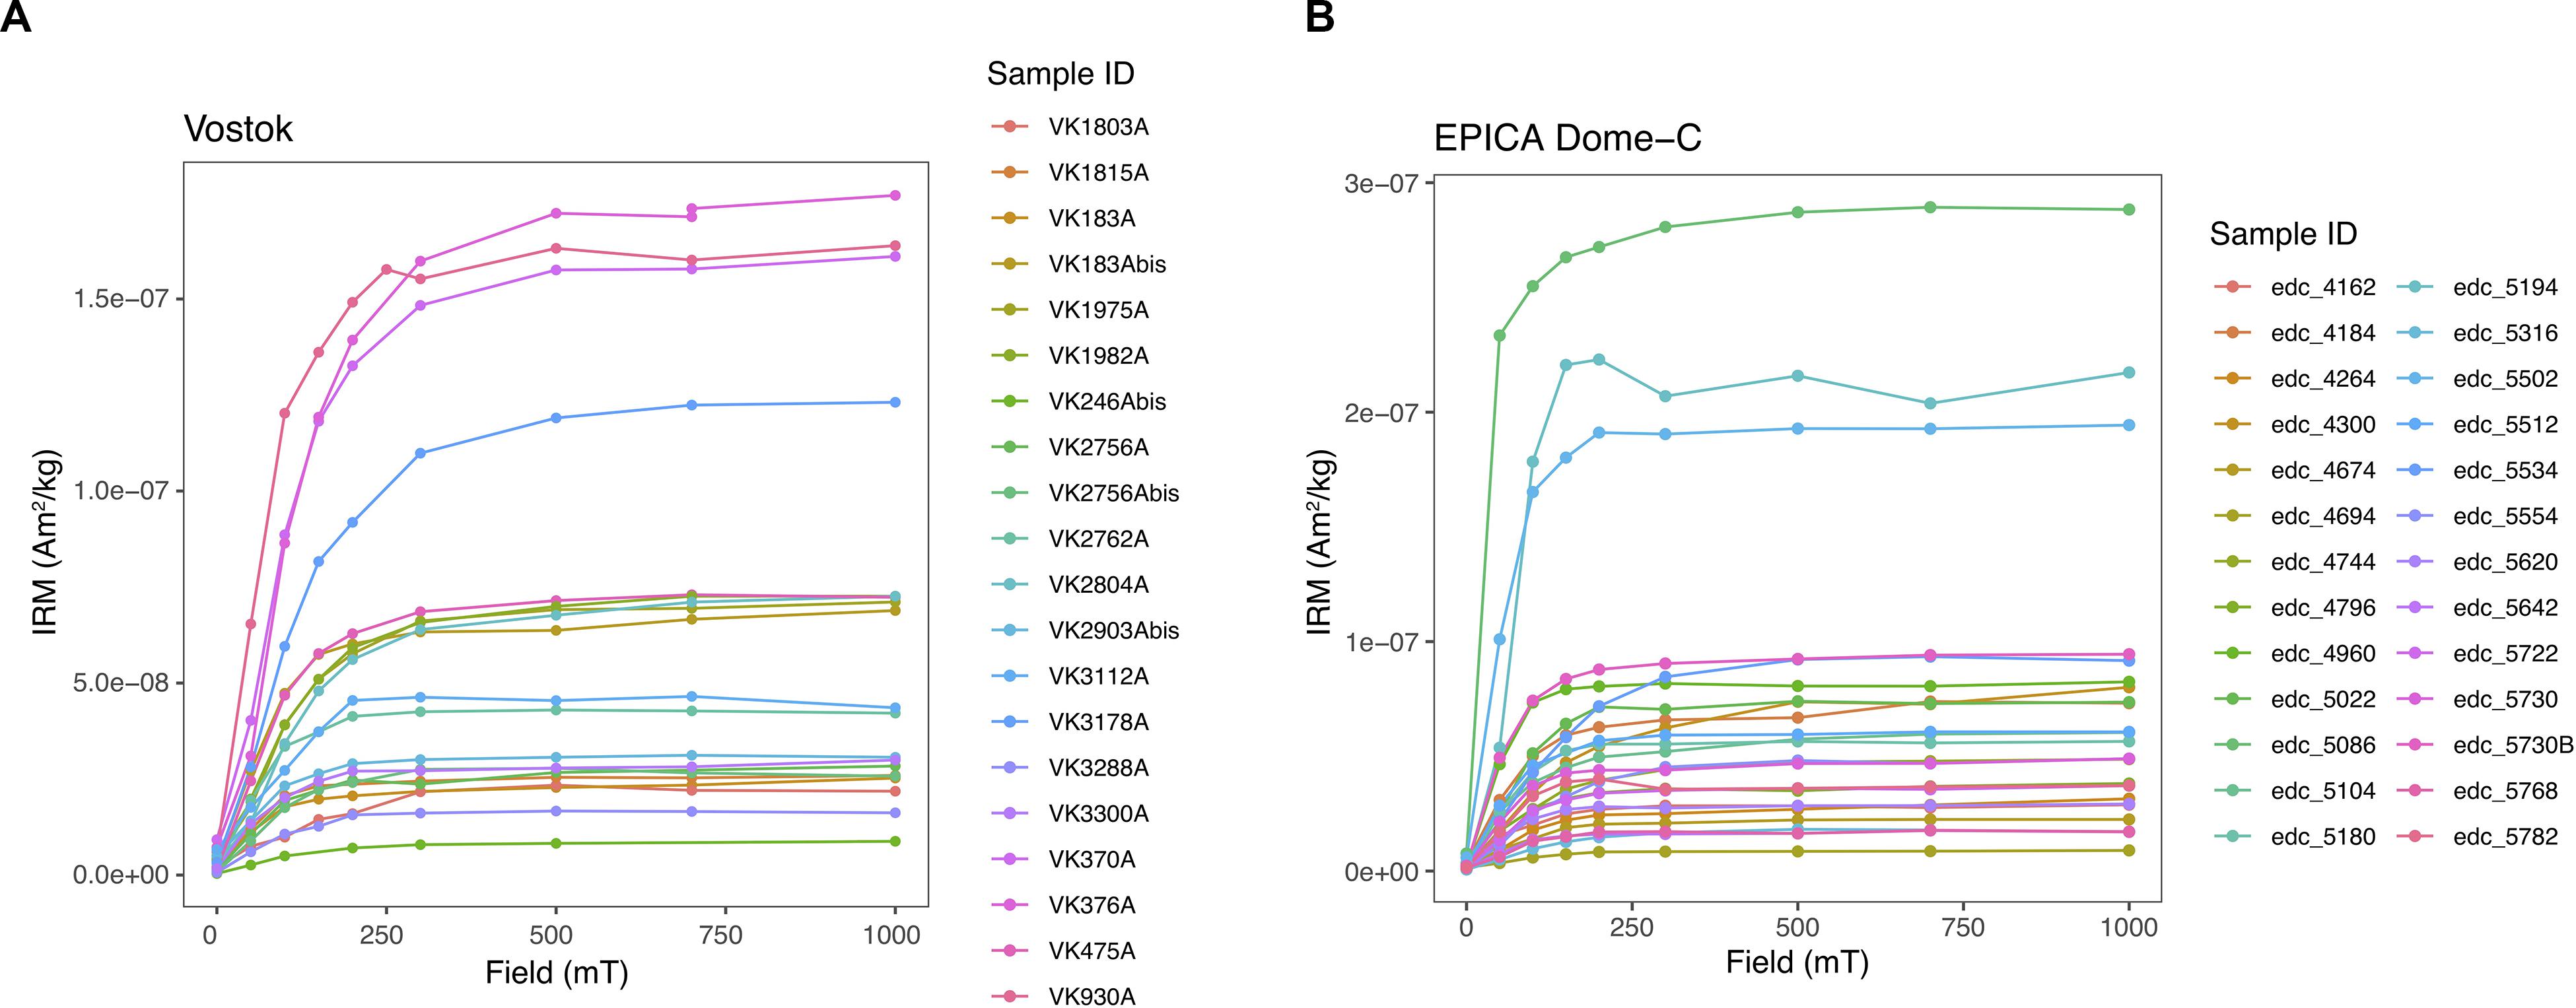
Figure 2. IRM acquisition of ice samples from (A) Vostok and (B) EPICA Dome-C ice cores. IRM is measured at 100 K and expressed as magnetic moment per unit of mass of the whole ice samples. Therefore this is the magnetization of the dust diluted within the ice. IRM acquisition curves are of good quality considering the extremely low intensity of the ice magnetization and testify to the reliability of the measurements.
Since all ice samples were saturated, or nearly saturated, at the maximum field of 1 T we consider the IRM at 1 T equivalent to the saturation IRM (SIRM). Backfield demagnetization of the SIRM was performed at 100 K using 10 mT steps, and was used to compute Hcr and the exact field value of Hcr was linearly interpolated between zero-crossing IRM magnetizations. The SIRM that was first measured at ∼100 K was then remeasured after allowing the samples to re-equilibrate to the freezer temperature (∼255 K) for several hours in order to remove the remanent magnetization due to superparamagnetic particles (Lanci and Kent, 2006). We refer to the SIRM that remains after warming to ca. 255 K simply as SIRMice meaning that such SIRM is computed with respect to the mass of the ice sample. The SIRM measured at 255 K is generally smaller than that measured at ∼100 K, which includes a superparamagnetic fraction part of which is carried by nanometer-sized particles of extraterrestrial origin (Lanci et al., 2012). The rewarming has the main purpose of discarding this superparamagnetic fraction because of its different origin, but the temperature transit of the samples through the Verwey transition and through the magnetite isotropic point, both around 120 K, could further reduce the remanent magnetization of multi-domain grains. This underestimate the SIRM of the dust trapped in ice compared to an ideal measurement, but this error is balanced out in the comparison with PSA samples since both measurements were performed using the same procedure.
Insoluble dust concentration (IDC) was measured in the same ice samples analyzed for magnetic properties, after additional decontamination in the clean room and melting at room temperature. Insoluble microparticles were measured by Coulter Counter, which detects insoluble particles with equivalent spherical diameters ranging from ca. 1 μm to about 30 μm. The dust mass was then calculated assuming that mineral grains have an average density of 2.5 g/cm3, which is the standard average density for eolian dust used in the literature (e.g., Delmonte et al., 2004, and references therein).
Our IDC data, shown in Figure 3, are generally compatible with the extensive measurements performed on the same cores (Petit et al., 1999; Ruth et al., 2008). However, we notice that some samples, whose stable isotope profile belongs to the full glacial (MIS 8, 10, 12, and 18 in EDC and MIS 4 in VK), show a IDC significantly lower than previous measurements. We assume that the lower IDC of our discrete samples are a consequence of the natural variability of IDC during glacial stages.
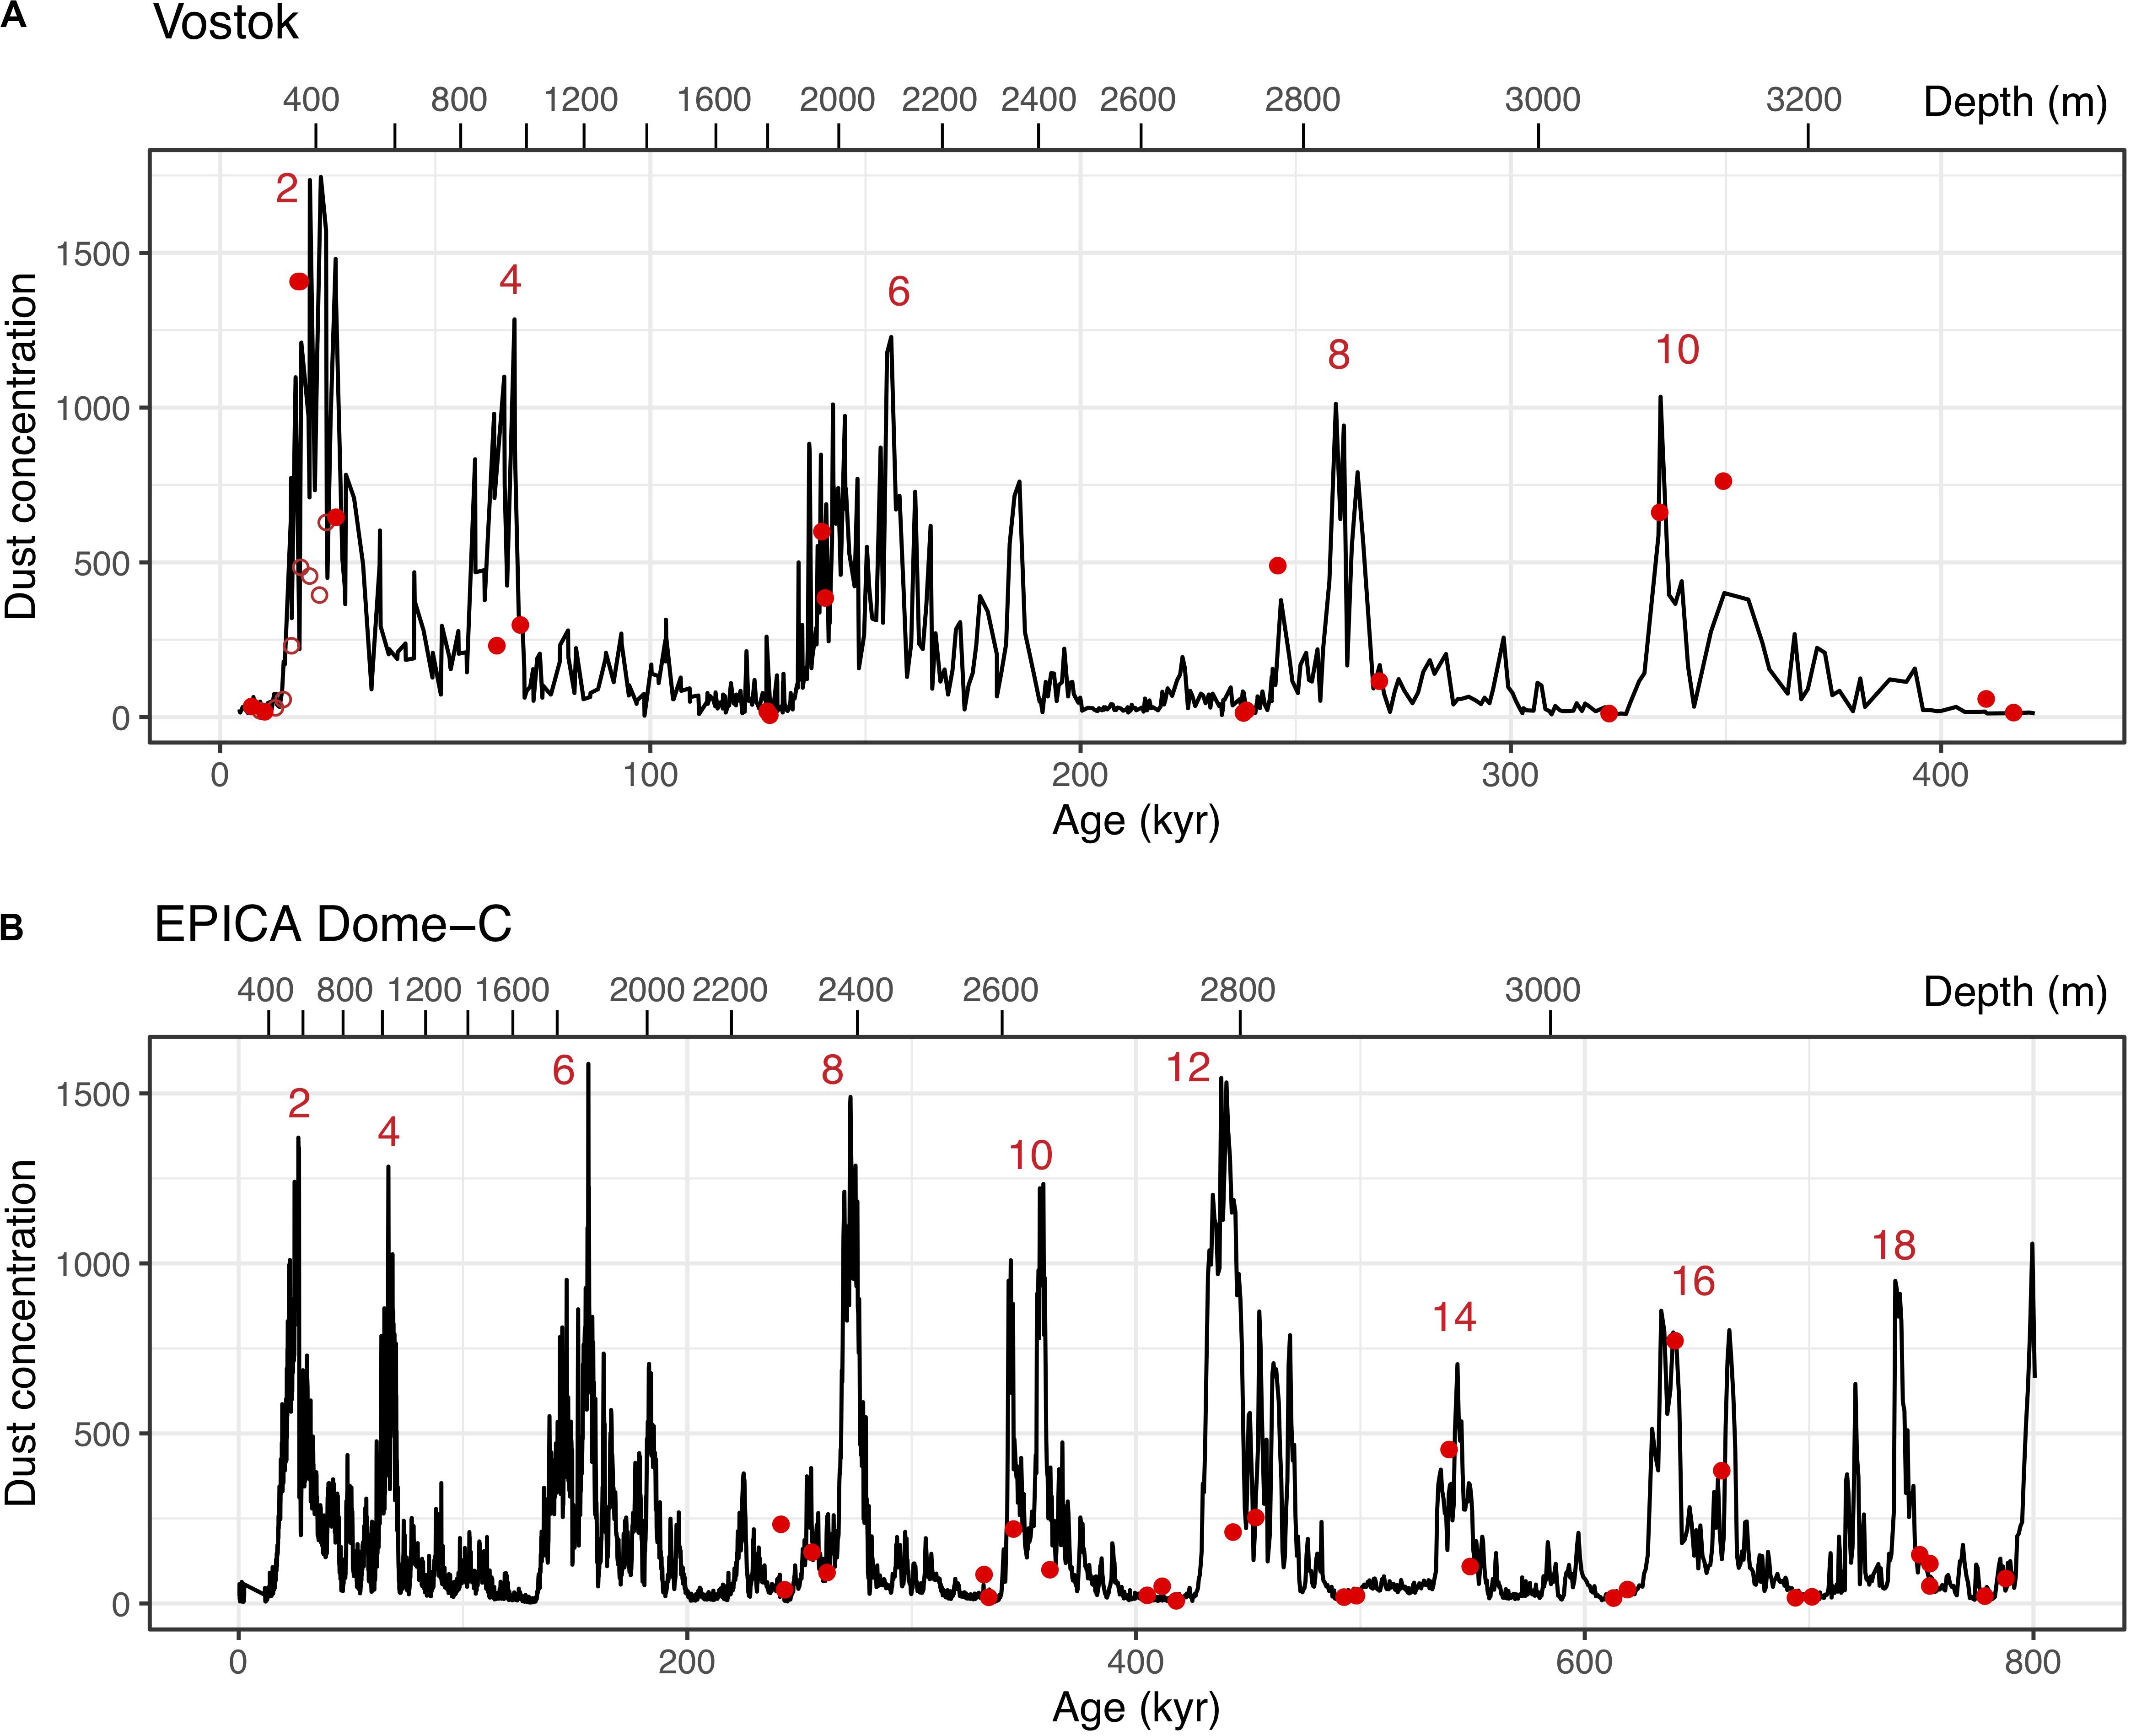
Figure 3. IDC measurements of individual samples (solid red circles) from Vostok and Epica Dome C (A and B, respectively) compared with extensive measurements on the same cores (black line) from Petit et al. (1999) and Ruth et al. (2008). Vostok samples includes additional samples from Lanci et al. (2007) shown with open symbols, see section “Appendix.” Red numbers indicate the glacial marine isotopic stages and scales on the top axis report the core depth. Note that all EDC samples are taken at depth >2,200 m.
The magnetization of the dust trapped in ice samples (SIRMdust) was computed by dividing the samples magnetic moment by the mass of the dust measured in the same samples, or equivalently dividing the SIRMice by the IDC mass. Analytical errors of the combined magnetic and IDC measurements were discussed in Lanci and Delmonte (2013). Probably the most important factor affecting the precision of SIRMdust is the uncertainty of the mass loss of the soluble aerosol fraction during Coulter Counter measurements. We do not have a direct estimate of this error that would result in an overestimate of SIRMdust but we assume that is proportional to the IDC, practically meaning that the SIRMdust could be overestimated by a small constant factor.
We analyzed 86 samples from PSA from Antarctica each one consisting of ca. 3 grams of pristine fine sands and silt, sieved keeping the granulometric fraction <62 μm. Several of these samples have been studied previously (Lanza and Zanella, 1993; Gore et al., 2001; Delmonte et al., 2010b, 2013; Bristow et al., 2011; Blakowski et al., 2016). Antarctic PSA samples were studied to examine the possible influence of local sources of dust and were collected in unconsolidated sediments mostly from the Dry Valley and Victoria Land regions. These samples were integrated with 11 PSA samples from classic source area (South America and New Zealand) previously studied for isotopic analysis (Delmonte et al., 2004). Measurements on PSA samples were performed following the same protocol used for ice samples in order to allow a proper comparison. We decided to use the relatively coarse (<62 μm) granulometric fraction of PSA samples after a pilote experiment made with the fine-grained fraction on a set of 5 Argentinian PSA samples. Measurements on the fine fraction gave inconsistent results suggesting that the sedimentation procedure used for separation introduced relevant artifacts in the magnetic properties. We are aware that the different granulometry could cause some discrepancy in the magnetic properties of the PSA samples and airborne dust, however, the results obtained from a analogous experiment in North GRIP ice core (Lanci et al., 2004) and from laboratory experiments using natural and artificial sediments (Valet et al., 2017) suggest that such a discrepancy can be small compared to the large natural variability of the magnetic properties of PSA samples and of dust trapped in ice.
The study of PSA samples is aimed to constrain the provenance area of aerosol dust. The problem of dust provenance is traditionally addressed using radiogenic isotopes studies, magnetic methods are probably not as selective in detecting the provenance area but they are simpler to perform and have provided a larger amount of data. As for isotopic data, the assumption is that magnetic properties of PSA samples will be similar to that of aerosol dust if they share the same provenance. This reasonable assumption is supported by results from NGRIP ice core where dust magnetization is similar to that of pristine loess samples from Chinese Loess Plateau (Lanci et al., 2004). The PSA location is shown in Figure 1 and a table with their magnetic properties and other available information can be found in the Supplementary Material.
An overview of the magnetization of ice samples, divided in glacial and interglacial stages and by sites, are shown in the log-log diagrams of IDC versus SIRMice (Figures 4A,B). Samples from VK (Figure 4A) suggest a main linear trend indicating a proportionality between IDC and SIRMice. The linear trend can be computed by fitting either a line passing through the origin whose slope represents the average SIRMdust (gray dashed line in Figure 4A) or as a line with an offset (which is not rectilinear in the log-log plot, the green dashed line in Figure 4A). The latter can be interpreted as a linear model with a contribution to SIRMice proportional to IDC plus a constant contribution independent from IDC. Both linear models have a high correlation coefficient (R2 = 0.85 and R2 = 0.78, respectively) and are significant at the 99% confidence level according to a t-test. Prominent outliers belongs to MIS 7, MIS 9 and MIS 11, and are sampled at depth > 2,500 m.
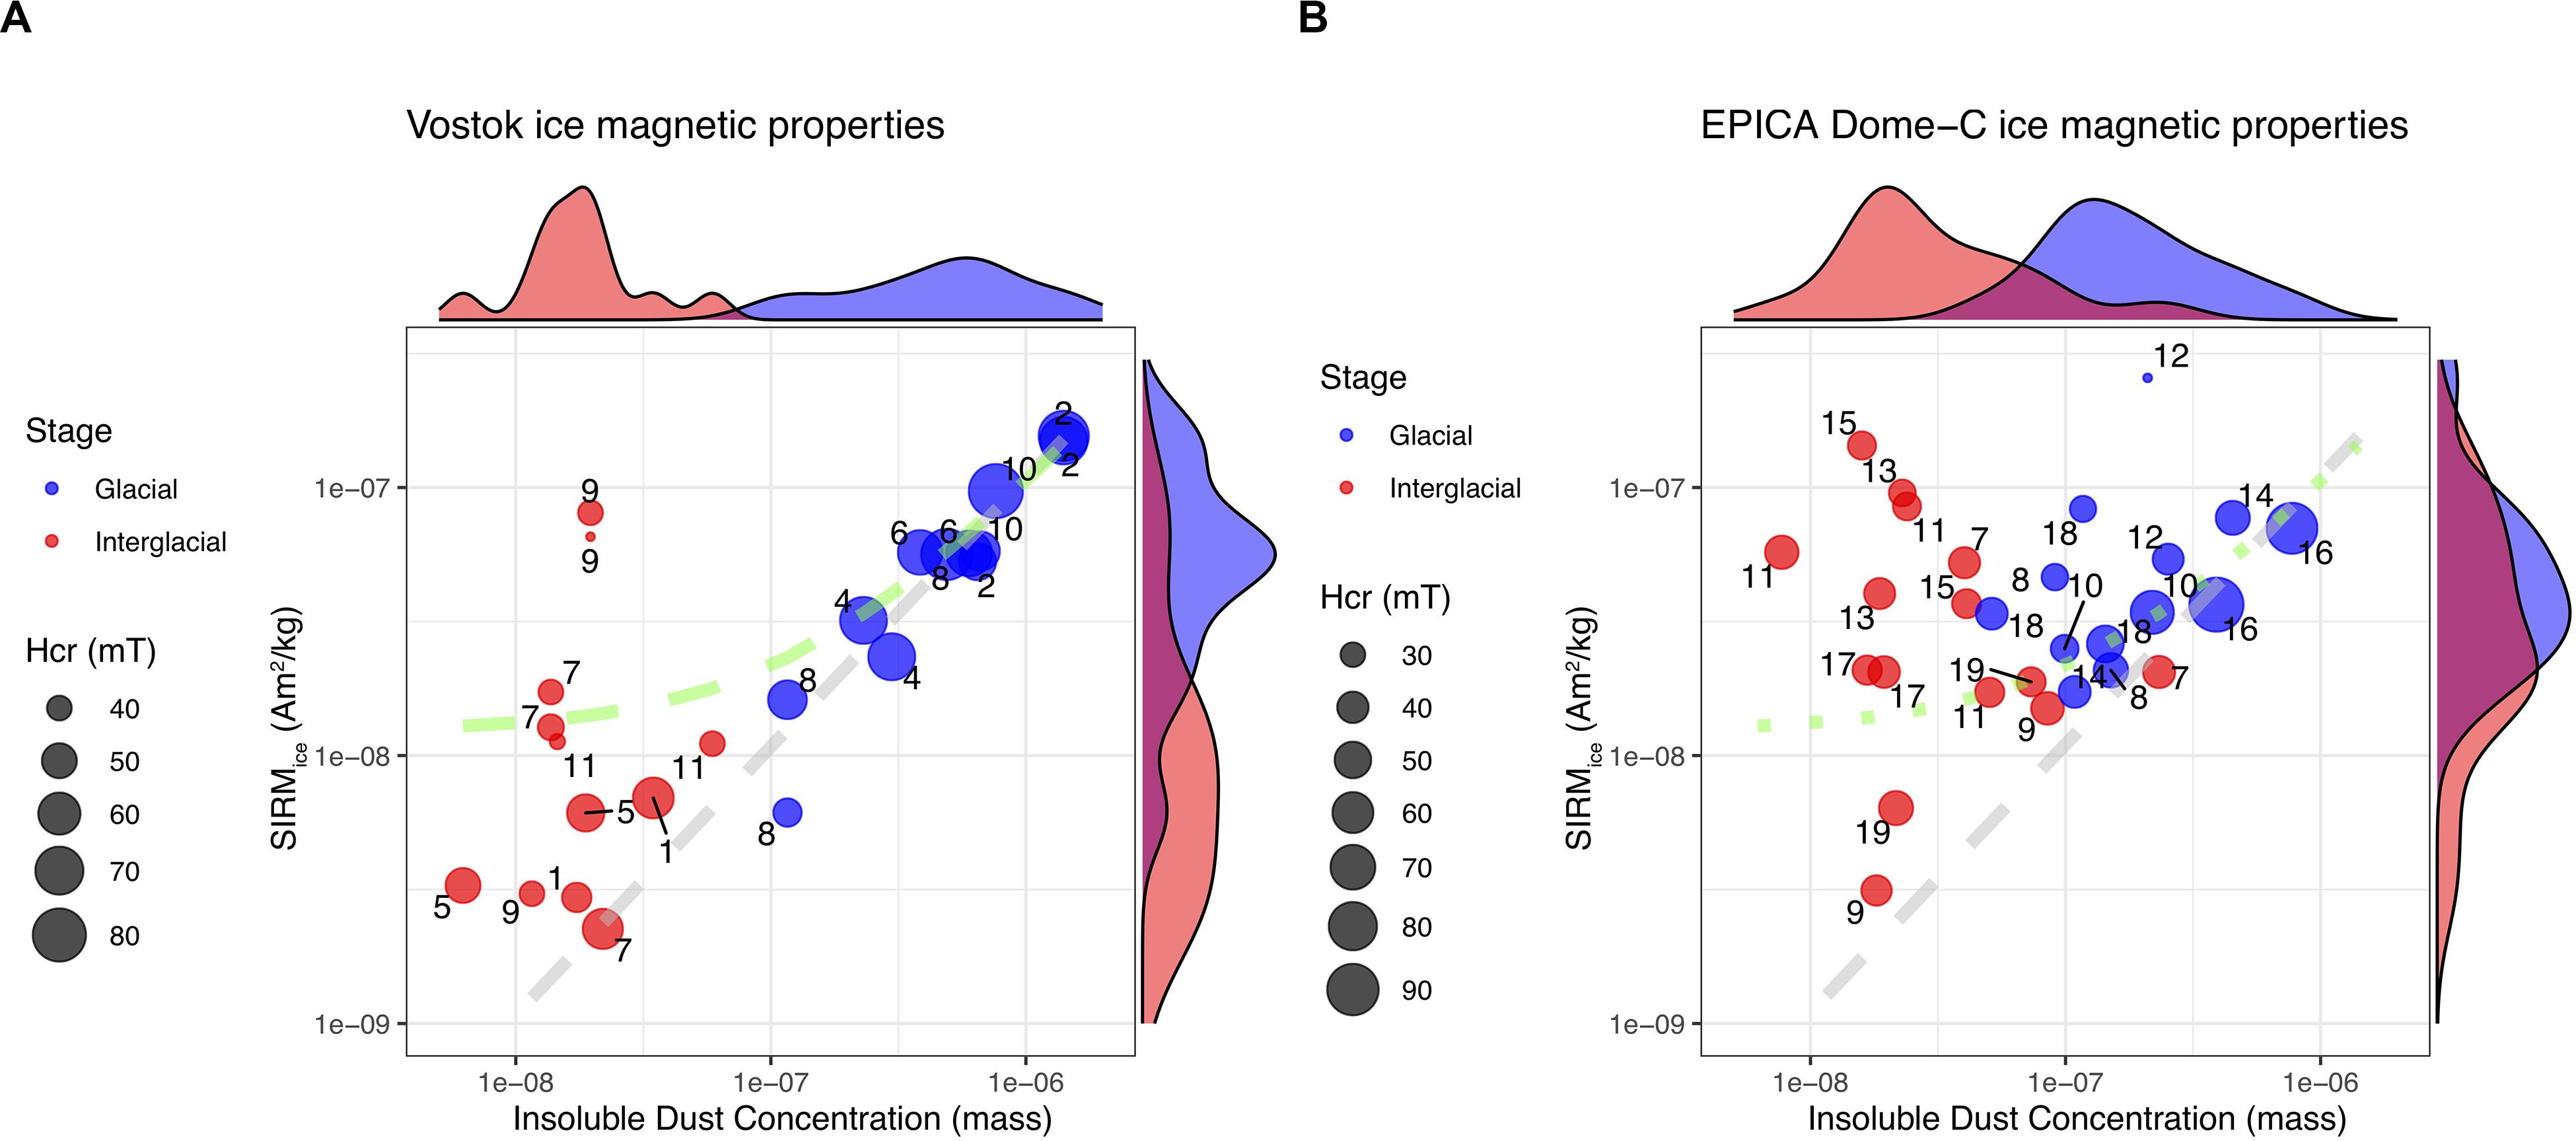
Figure 4. Log-log diagram of IDC and SIRMice of the EDC and VK datasets. Samples are grouped by color in glacial and interglacial stages with numbers indicating the isotopic stage (MIS) of each sample, symbols size is proportional to Hcr. Estimated distribution densities are shown in the marginal plots. (A) In VK samples the distributions of glacial and interglacial SIRMice are distinct and most of the samples do not deviate significantly from a linear relationship between IDC and SIRMice. The best-fit lines (not rectilinear in the log-log diagram) represents the following models: SIRMice = 0.108 × IDC + ei (gray) and SIRMice = 0.0935 × IDC + 1.23 × 10⁻⁸ + ei (green) where ei are random variables representing the deviations of the data from the best-fit line. (B) Compared to VK, EDC samples shows significant differences in the distribution of SIRMice. EDC ice samples from interglacial stages are much more magnetic than VK and the same linear relationship found in VK (here reported for comparison) is not maintained.
EPICA Dome-C samples (Figure 4B), which are all taken in the deepest part of the core (depth > 2,200 m), do not show the same clear linear relationship. Especially samples from interglacial stages deviates significantly from the VK proportionality line because of a much higher magnetization, which suggests a much higher concentration of magnetic minerals. The difference between VK and EDC interglacial SIRMice is evident also in the distribution density estimates shown in the marginal plots. Glacial and interglacial distribution of SIRMice are well distinct in VK and very similar in EDC, to a minor extent also ICD distributions have a larger overlap in EDC.
The semilogarithmic diagram of SIRMdust/Hcr (Figures 5A,B) have been used to characterize the magnetic properties of the dust trapped in the ice (e.g., Lanci et al., 2012). The SIRMdust of glacial samples from VK are well-grouped around an average value of ca. 0.1 A m2/kg corresponding to the slope of the linear models above. The SIRMdust of interglacial samples is generally higher and occasionally extremely high. We further notice that samples with high SIRMdust generally exhibit low Hcr suggesting that their remanent magnetization is carried by low-coercivity ferrimagnetic minerals such as magnetite or maghemite. In samples from EDC the groups of glacial and interglacial samples have a broader overlap and especially the latter displays extremely large SIRMdust values. The natural variability of both SIRMdust and Hcr can be large even within the same MIS.
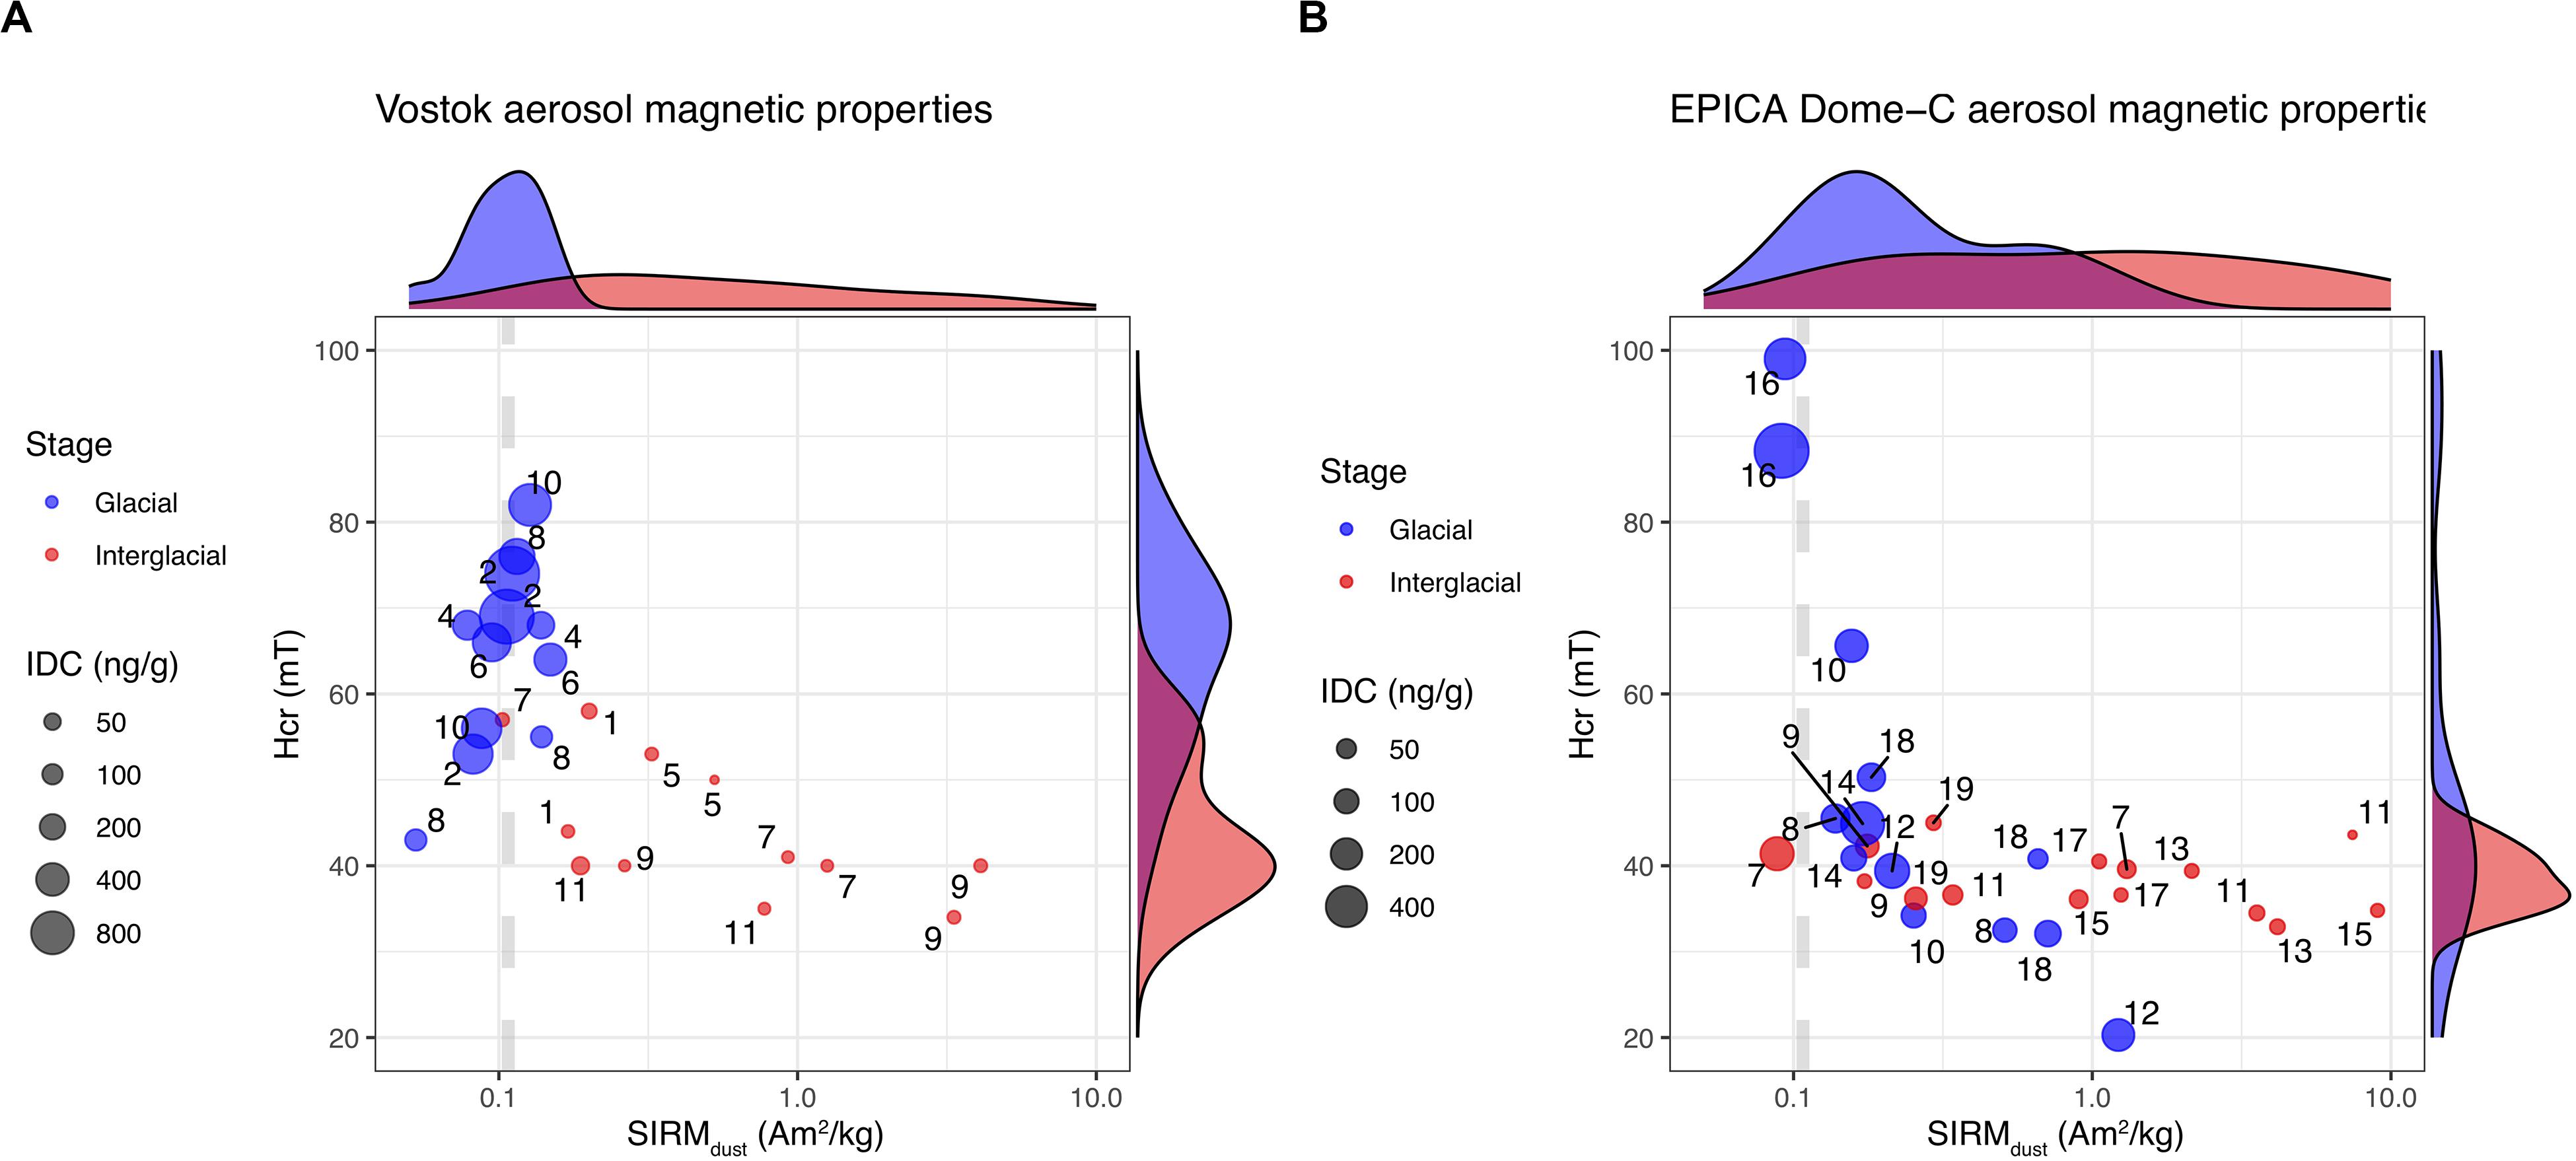
Figure 5. Semi-logaritmic SIRM/Hcr diagram. Samples are grouped by color in glacial and interglacial stages with numbers indicating the isotopic stage (MIS) of each sample, symbols size are proportional to IDC. Vertical line at 0.11 A m2/kg represents the average SIRMdust computed by the best-fit line. (A) The magnetic properties of VK are distributed along the vertical line of constant SIRM. Some low IDC samples from interglacial stages 5, 7, 9, and 11 plot in the lower-right part of the SIRM/Hcr diagram. (B) Only two EDC samples from MIS 16 exhibit true glacial magnetic properties and plots in the upper-left portion of the SIRM/Hcr diagram. Most samples are characterized by low Hcr and high SIRM irrespective of climatic stage. Note, however, that no EDC samples prior to MIS 6 are present in this dataset.
Extremely high SIRMdust values (>1 A m2/kg), were occasionally observed in some interglacial samples from the previous EDC dataset (Lanci et al., 2008b) and Talos Dome (Lanci and Delmonte, 2013). In the new dataset they are much more frequent and, in EDC, not limited to interglacial stages; in fact only samples from MIS 16 have shown “typical” glacial magnetic properties similar to that previously observed in MIS 2, MIS 4, and MIS 6 (Lanci et al., 2008b). In Table 1 we have summarized the data from VK and EDC ice cores listing the averaged values (within each MIS) of all the available magnetic data, including this study, the amended Vostok dataset from Lanci et al. (2007); see section “Appendix”, and the EDC dataset from Lanci et al. (2008b).
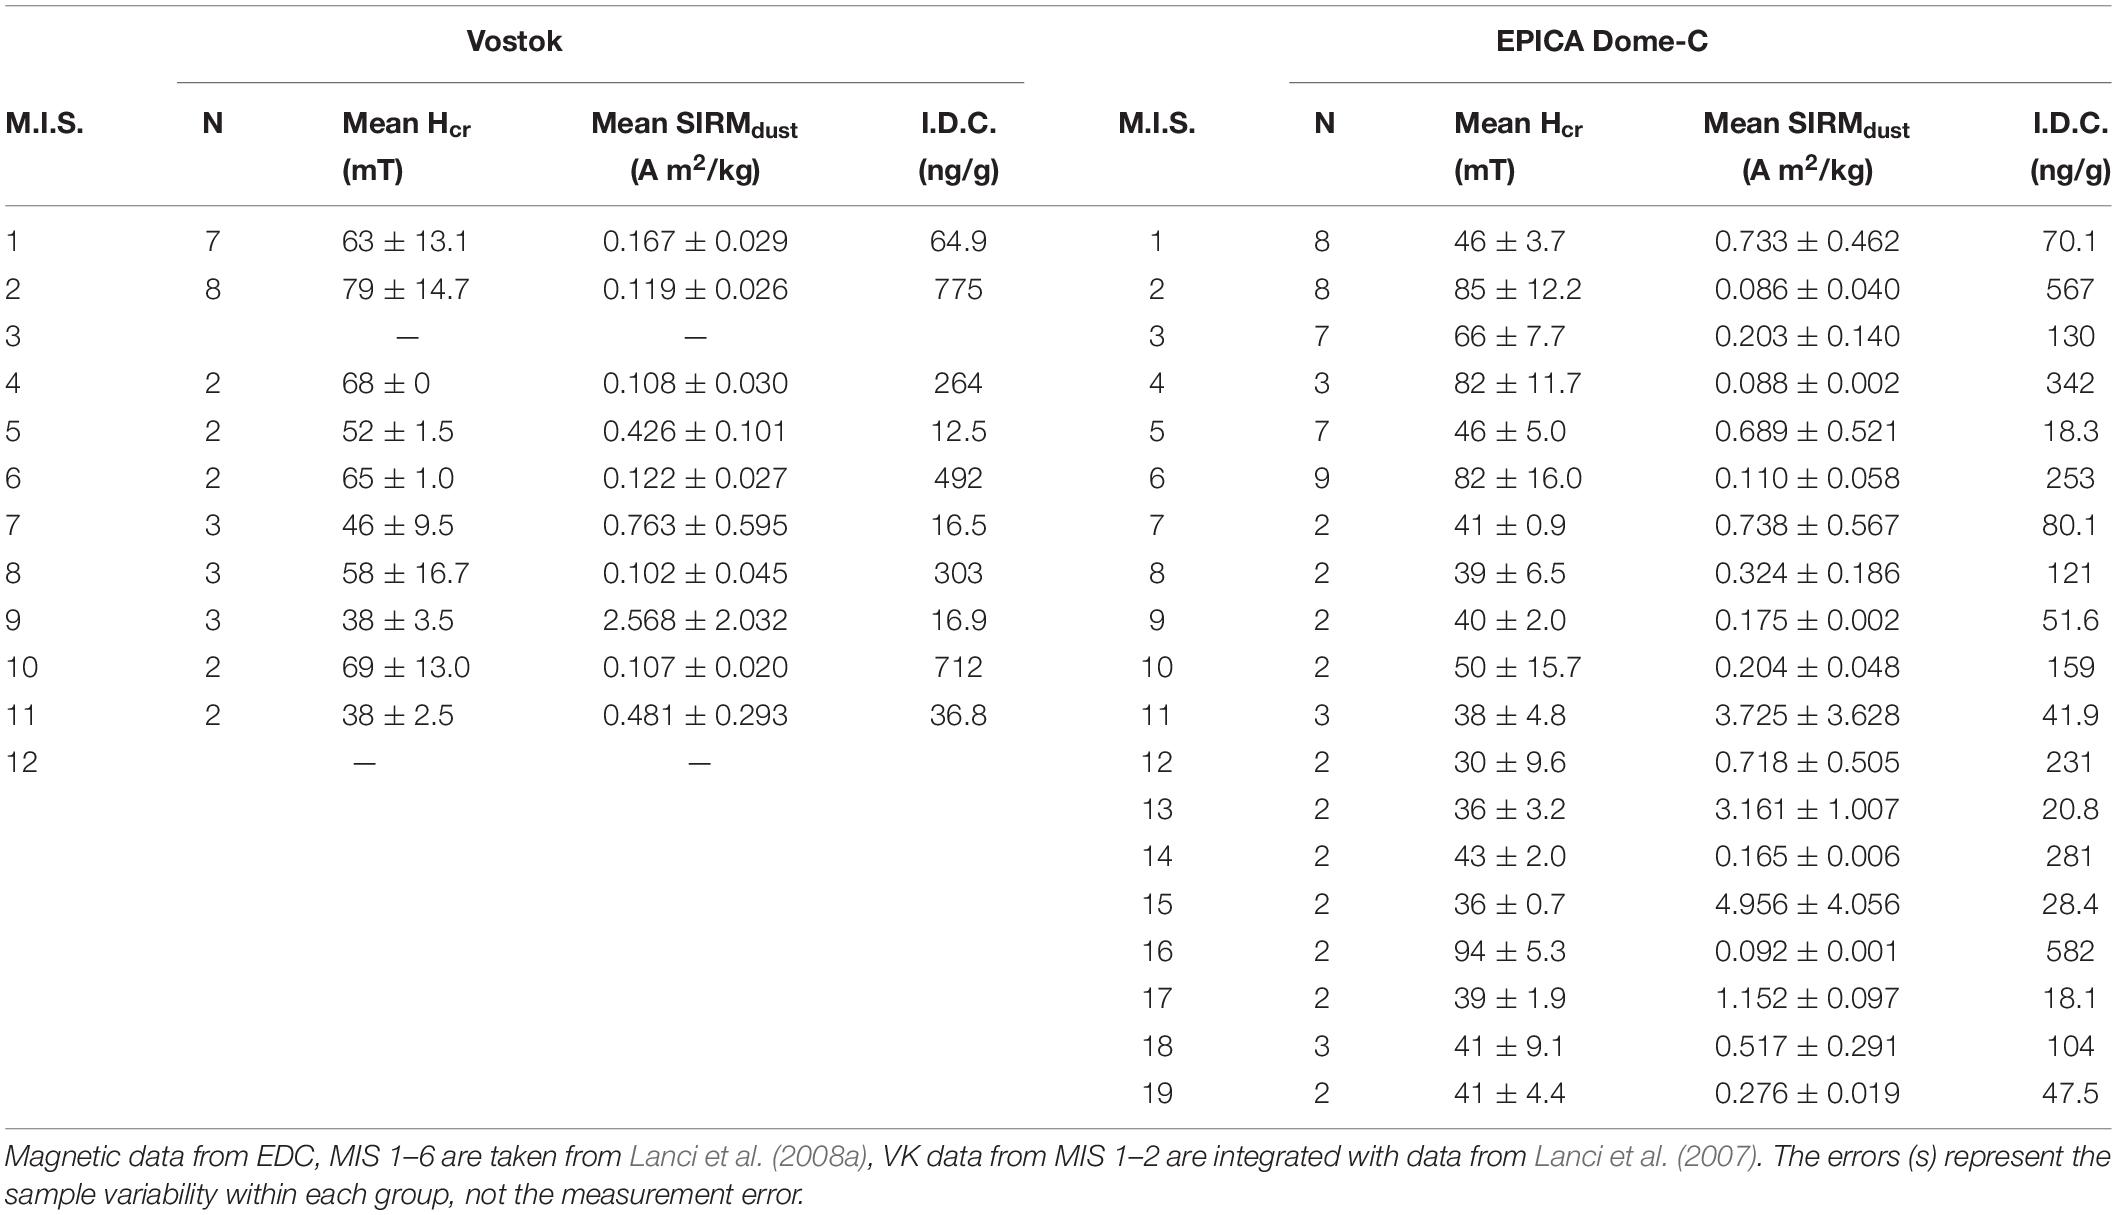
Table 1. Summary of available magnetic data from Vostok and EPICA Dome-C, averaged over their climatic stages.
Magnetic properties of PSA samples, which include Fe-rich magmatic rocks, are summarized in Figures 6A,B using the semilogaritmic SIRM/Hcr diagram. PSA data are compared to all the available aerosol dust data from VK and EDC ice cores, which include data from Lanci et al. (2007) and Lanci et al. (2008b; section “Appendix”); the complete dataset is included in the Supplementary Information Tables. To avoid cluttering the diagram, the aerosol dust data are summarized using their two-dimensions distribution density estimates, computed with the method described in Venables and Ripley (2002). Aerosol distribution density are computed separately for samples with high IDC (IDC ≥ 100 ng/g), which comprise mostly glacial samples, and low IDC (IDC < 100 ng/g) that comprise interglacial samples.
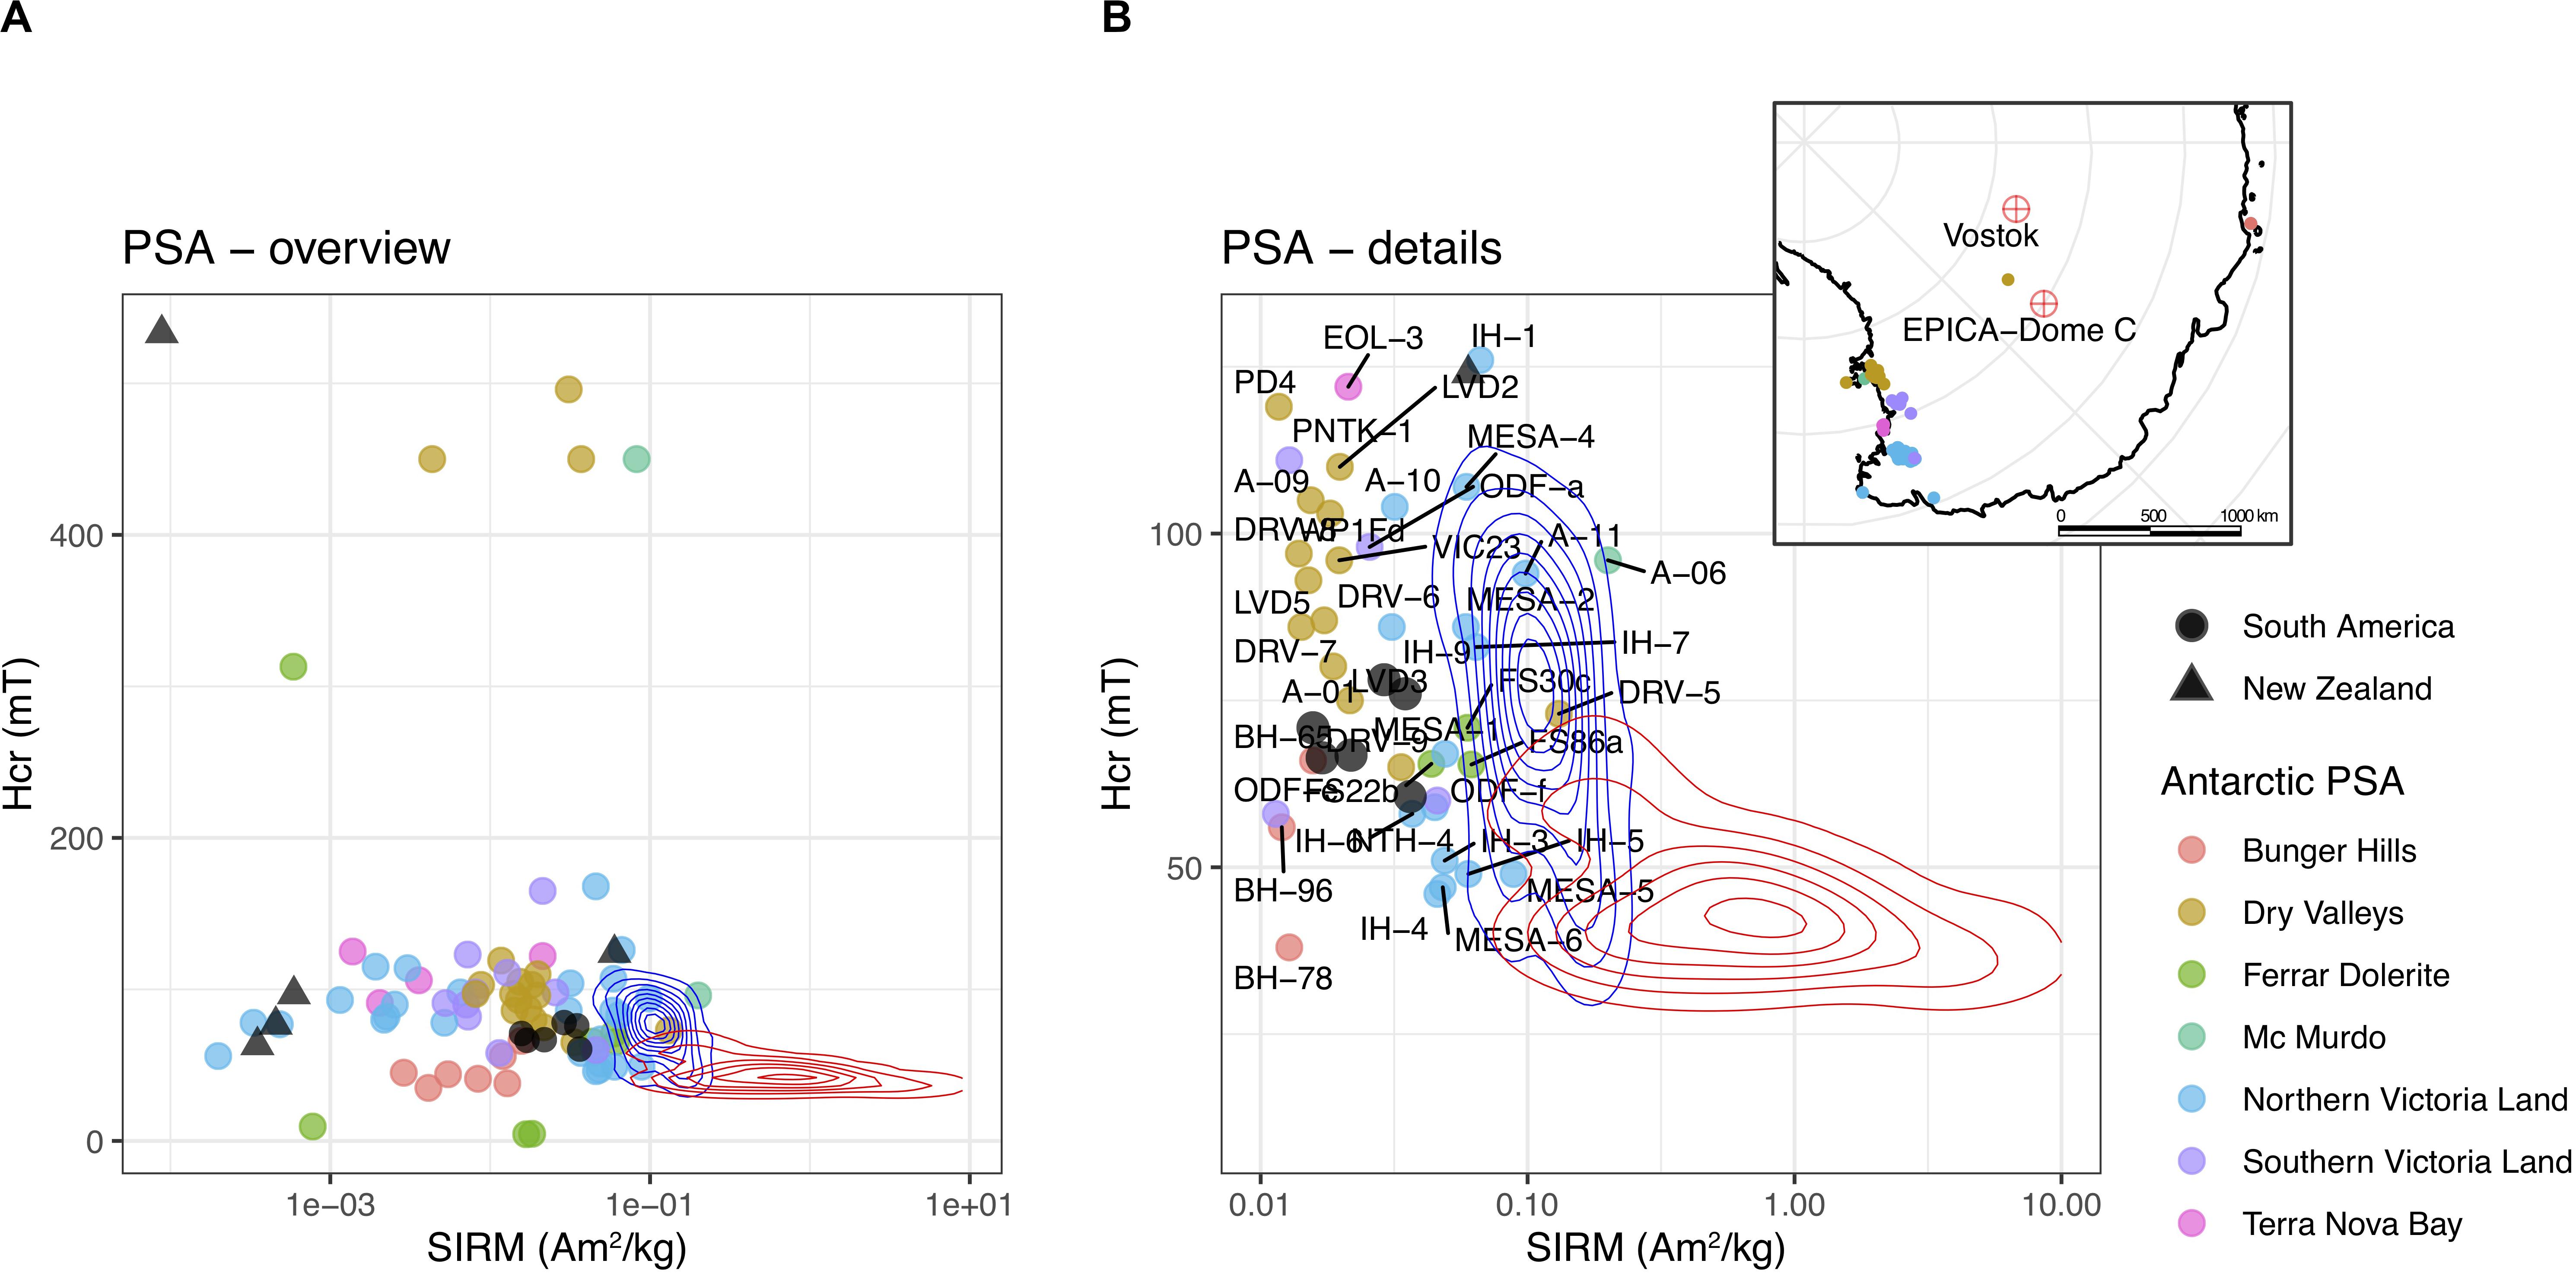
Figure 6. Magnetic properties of PSA samples in the semi-logaritmic SIRM/Hcr diagram. The SIRMdust data from ice cores, including the dataset from Lanci et al. (2008a), are reported for comparison using their distribution density estimates computed according to Venables and Ripley (2002). SIRMdust data are divided in glacial (IDC ≥ 100 ng/g) and interglacial (IDC < 100 ng/g) groups whose distribution is indicated with blue and red lines, respectively. Isolines shows the same level of density of SIRMdust data. The whole dataset used to compute the distribution is available in the Supplementary Material. (A) All available PSA samples divided in groups based on provenance area. (B) Close-up view of the PSA samples that shows properties similar to that of ice dust. Information on individual PSA samples can be found in the Supplementary Information. Despite the large natural variability of magnetic properties of PSA samples, none of them can explain the properties of interglacial aerosol dust.
The complete set of PSA samples (Figure 6A) shows a very large scatter in the magnetic properties. Magnetic properties of Argentinian samples are sufficiently similar to that of interglacial aerosol, although their SIRM is slightly lower. This could be a consequence of the underestimate of IDC due to the soluble dust fraction that result in an overestimate of SIRMdust. Overall we believe that magnetic properties confirm the affinity suggested by isotopic analysis (Gaiero, 2007; Gili et al., 2016) in Argentinian samples while New Zealand PSA samples, instead, are mostly incompatible from the point of view of magnetic properties. Within the set of Antarctic PSA samples the variability of magnetic properties is surprisingly large, however, some of them and in particular the sample group from dry Valleys and Victoria Land, have magnetic properties that are similar to that of glacial dust (Figure 6B). The map inset in Figure 6B shows that compatible PSA samples likely originate all in a restricted area and derived from, the bedrock with a high concentration of magnetic minerals. Our results from PSA samples are in general agreement with magnetic measurements of the rock from the Dry Valleys (Brachfeld et al., 2013), although some caution is needed comparing the two sets because of the different measurement procedures. In particular the difference in Hcr that in the data from Brachfeld et al. (2013) have, on average, lower values, could be a consequence of measurements at room temperature instead of 100 K. In comparing these data lower SIRM in the PSA set can also be expected because of their transition through the Verwey transition or magnetite isotropic point after magnetization. A subset of Brachfeld et al. (2013) data, which falls near the distribution of dust, are presented in Figure 7.
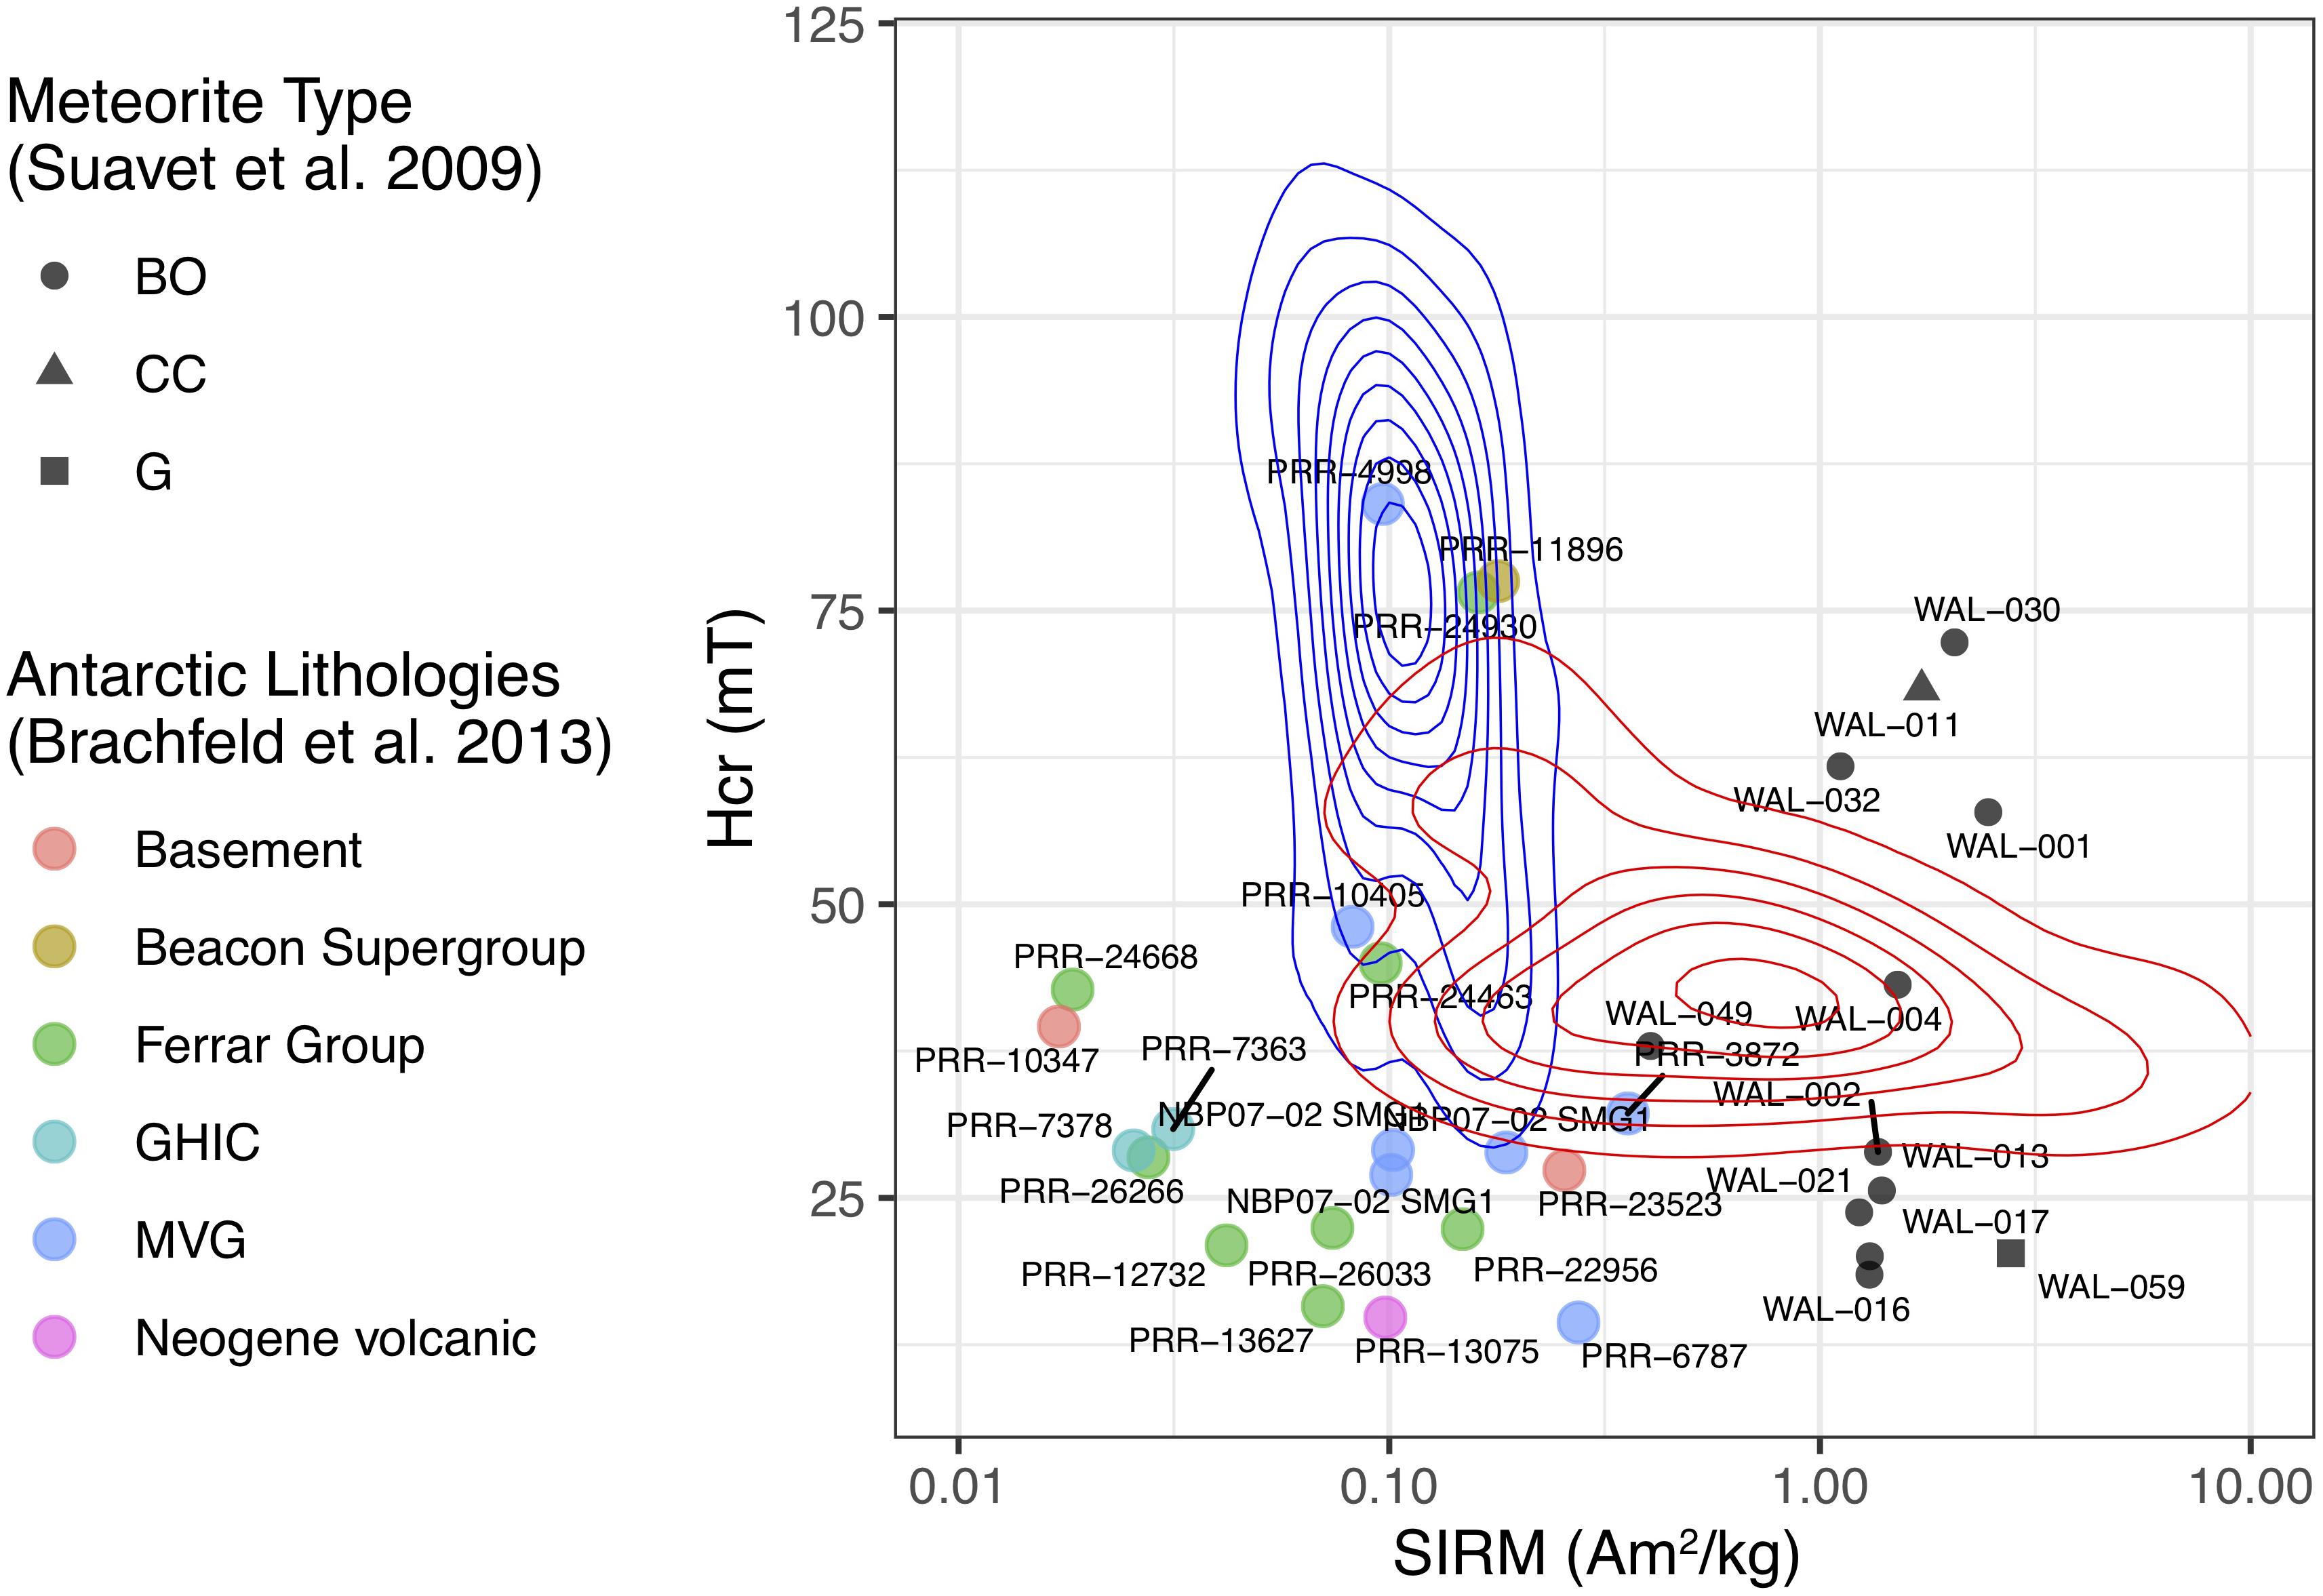
Figure 7. Semi-logaritmic SIRM/Hcr diagram of rock-magnetic data from the Dry Valley (Brachfeld et al., 2013) and of micrometeorite samples from Suavet et al. (2009). Samples labels and groups correspond to that of original data, micrometeorite groups are divided in BO (Barred Olivine), CC (Cryptocrystalline), and G (G-type cosmic spherules). The SIRMdust data from ice cores are reported for comparison as their density estimates as in Figure 6. SIRM of Dry Valley rocks are not significantly different from that of PSA samples from the same area and are compatible with glacial dust but they have, on average, a lower Hcr, Magnetic properties of micrometeorites are compatible with that of interglacial aerosol dust except for the larger variability of Hcr. However, to explain the total amount of magnetic minerals found in the ice would require a micrometeorite flux ranging from 2 × 10⁻⁷ to 2 × 10⁻⁶ (kg/m2 year). Extrapolated to the whole Earth surface (5.1 × 10¹⁴ m2) this corresponds to a total flux from ca. 102 to ca. 1020 (kt/year), which is orders of magnitudes higher than current estimates of ca. 160 ± 60 t/year (Prasad et al., 2013).
The magnetic properties of Pleistocene ice have emphasized the differences between EDC and VK previously observed during the most recent (MIS 1–6) climatic stages (Lanci and Delmonte, 2013). If the aerosol record of Antarctic ice cores were a perfect record of long range atmospheric transport one would expect minimal differences between the two sites, hence Lanci and Delmonte (2013) resorted to short distance (i.e., local) sources to explain the observed data. Regrettably, the even larger differences observed in the new dataset are much more difficult to explain, especially in light of the results from PSA samples.
The analysis of PSA samples gave two main results: first they show that, in general agreement with the literature (Delmonte et al., 2010a), Argentinian PSA samples are similar, hence compatible, with glacial aerosols. They also showed that there is a group of Antarctic PSA samples that are equally compatible with glacial aerosol from the point of view of magnetic properties. This group of samples originates in a relatively restricted area. Based on our results it can be safely concluded that the aerosol dust entrapped in ice samples from glacial periods is compatible with a mixture of South American (Argentinian) and Antarctic contributions.
A second important result is that none of the measured PSA sample has magnetic properties that can explain the distribution density of the interglacial samples (IDC < 100 ng/g), in particular none of them reach the very large SIRMdust observed in these samples. Although our PSA dataset is not exhaustive, this observation is confirmed by the rock magnetic data from the Dry Valleys (Brachfeld et al., 2013) and cast doubts on the existence of a local (i.e., Antarctic) source of highly magnetic dust capable to explain the magnetic properties of these samples and therefore do not support the hypothesis of their origin from a local source. Without a local source capable of supplying enough magnetic minerals to justify the strong magnetization of interglacial dust, the observed differences between EDC and VK are difficult to explain as original depositional features.
The nature of the magnetic particles responsible for the very high SIRMdust values found especially in interglacial samples (IDC < 100 ng/g) and particularly in several EDC samples from MIS 11, 13, and 15 and VK samples from MIS 9 is puzzling. A compatible local source was not found and, more generally, terrestrial rocks with such a large SIRM are not common. In fact, to find similar SIRM we had to resort to the Antarctic micrometeorite collection of Suavet et al. (2009; Figure 7). However, a direct flux of micrometeorites cannot account for the high SIRMdust for two reasons: (i) a uniform micrometeorite flux cannot explain the difference between relatively close sites of EDC and VK, and (ii) more importantly, the required particles flux exceed by at least two orders of magnitude micrometeorites influx estimates (Prasad et al., 2013).
Furthermore, we notice that highly magnetic samples pertain to a part of the core, below 2,500 m depth, where post-depositional physical processes affecting the mineral dust have been observed (Lambert et al., 2008).
These results do not identify the origin of interglacial dust, but they suggest that samples with SIRMdust larger than ca. 1 A m2/kg are unlikely to represent the pristine magnetic properties of natural atmospheric dust. In fact, it seem reasonable to expect that the properties of interglacial airborne dust cannot be too different from those of the PSA samples and therefore, ultimately not very different from the magnetic properties of the glacial dust. This, incidentally, is what had emerged from an earlier study in Holocene samples from VK (Lanci et al., 2007), and suggests that most of the observed glacial/interglacial difference could be the results of post-depositional alteration of the original aerosol. Post-depositional processes in mineral dust are known to occur in the deepest part of Talos Dome ice core (Baccolo et al., 2018), although these results cannot be directly applied to EDC and VK.
Based on these observations we tentatively define an index of alteration of magnetic minerals computed as the absolute value of the difference between the actual SIRMdust and the pristine SIRMdust normalized to unity,
The pristine SIRMdust is not known but based on the above consideration we assume that the magnetic properties of the VK Holocene ice are the best available for pristine interglacial dust. The pristine SIRMdust value is then estimated as the linear fit of SIRMice versus IDC, similar to that shown in Figure 4, but computed using only VK samples from MIS 1 and MIS 2 that are assumed to be the least altered, This set of samples can be extracted from the table “complete set” in the Supplementary Material. The coefficients of this linear fit (intercept = 4.37 × 10⁻⁹ slope = 0.1052), which are highly significant according to a t-test, are used to compute the pristine SIRMdust of other samples using MIS-averaged IDC data listed in Table 1 as SIRMpristine = 4.37×10⁻⁹ + 0.1052 ⋅IDC. The results (Figure 8) show that no glacial stages from VK show relevant alteration and the only large alteration index are obtained in interglacials MIS 7 and MIS 9. High index values are found only at a depth > 2,000 m and MIS > 6 in both sites, with the exception of MIS 5 at EDC. Most of the older MIS from EDC (depth > 2,000 m) have a large index.
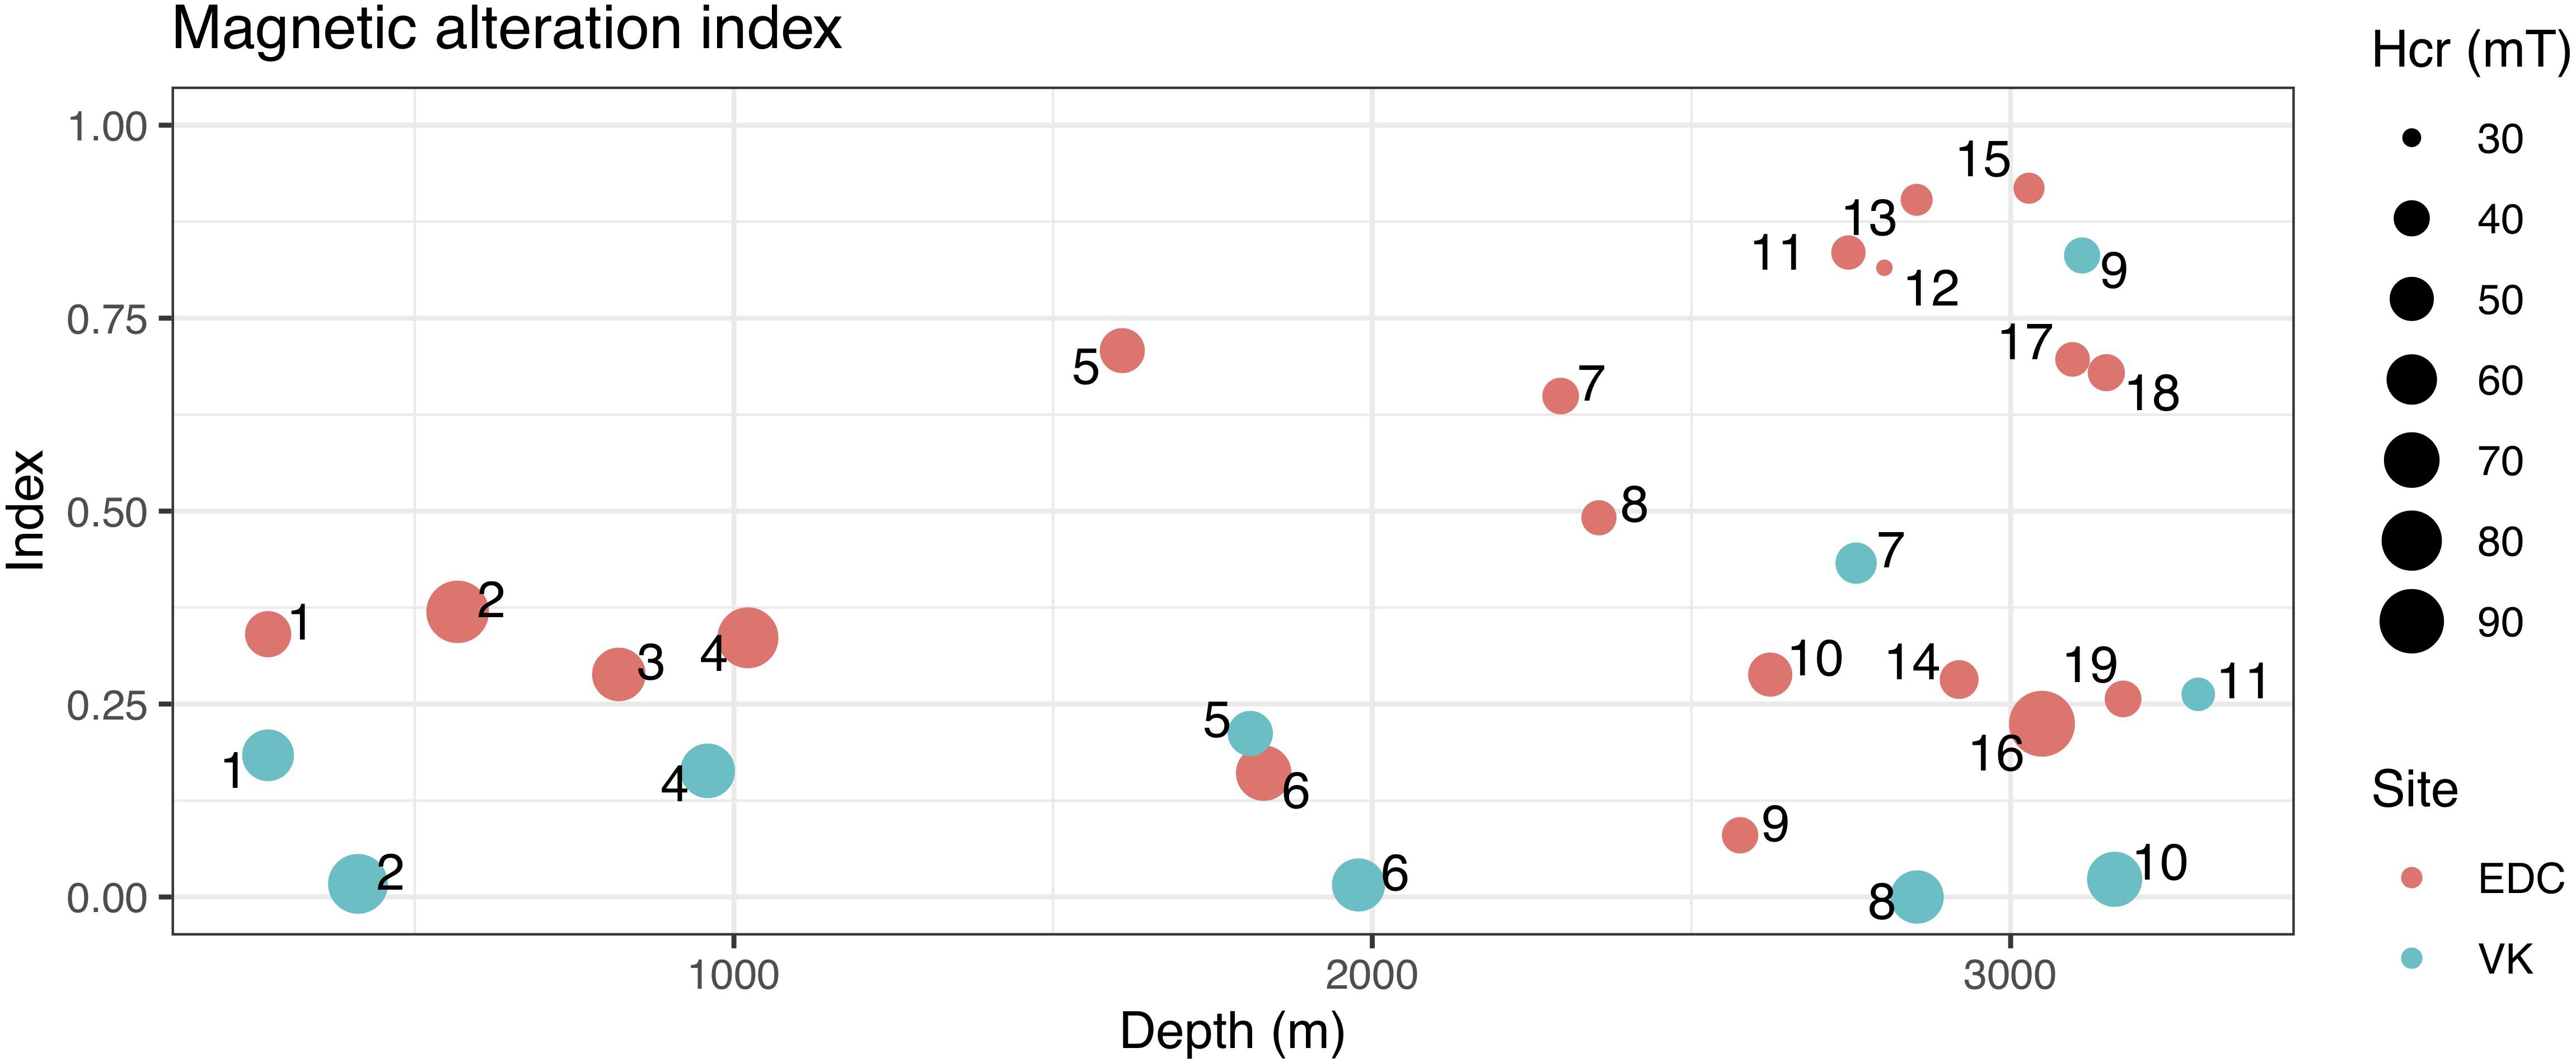
Figure 8. Alteration index representing the normalized absolute difference between SIRMdust and its estimated pristine value, which is computed from IDC data averaged within each MIS (Table 1), see text for details. Alteration index close to zero indicates a SIRMdust similar to that measured in the Holocene and LGM samples at VK. Values close to unity indicates anomalously large SIRMdust that could not be explained by the magnetization of PSA samples. Symbols size is proportional to Hcr and numbers indicate the M.I.S. from which one can deduce the average age of the group of samples (Table 1).
This summarizes previous observations suggesting that: (i) alteration processes are more common in samples deposited during interglacial periods, (ii) large alteration indexes become very frequent below ca. 2,000 m depth, where mineral dust is more likely to be affected by post-depositional processes, (iii) lowest Hcr (smaller symbols in Figure 8) are often associated with higher indexes suggesting that alteration affects the magnetic mineralogy, and (iv) regardless of other factors, the alteration is more pronounced at EDC than at VK.
According to a widely accepted interpretation of the Antarctic dust record based on the study of the lasted climatic stages, during glacial conditions dust deposition is dominated by a large load of long-distance transported dust, while during interglacial conditions other, unknown, contributions became significantly large compared to the much smaller atmospheric dust load. In this conceptual model the magnetic properties of wind-blown dust in Antarctica are expected to oscillate between two clusters which were identified with the interglacial cluster dominated by dust with low-Hcr and high-SIRMdust and glacial cluster characterized by high-Hcr and low-SIRMdust. Our result, instead, shows that this model does not hold very well when older climatic stages of VK and EDC are analyzed. Moreover, the difference between VK and EDC sites, which could be considered minor during MIS 1–6, became larger in older stages during both glacial and interglacial periods.
Results from PSA samples support the provenance of glacial aerosols from Argentina and found compatible Antarctic samples from Victoria Land. However, magnetic properties of PSA samples are incompatible with that of interglacial aerosol, hence, the origin of the source responsible for the low-Hcr and high-SIRMdust measured in interglacial samples remains enigmatic. The properties of these samples, and in particular their SIRMdust are unusual in terrestrial rocks and we had to resource to data from Antarctic micrometeorites to find similar SIRM. Nonetheless the required micrometeorite flux exceed the current estimates by orders of magnitude and this mechanism would not explain the difference between VK and EDC.
With the lack of plausible sources for the low-Hcr and high-SIRMdust aerosol, the differences observed between EDC and VK ice cores are difficult to explain as original depositional features and it is suggested that they could originate from post-depositional alteration occurring in the deepest part of the Antarctic ice sheet. In any case our results indicate that the properties of interglacial Antarctic dust from the deepest layers of ice cores, do not represent a reliable sample of the pristine atmospheric aerosol composition. In this respect VK dust record seems to provide a less biased record than EDC.
The raw data supporting the conclusions of this article will be made available by the authors, without undue reservation.
LL contributed to conception and design of the study, performed laboratory measurements and data analysis, wrote the first draft of the manuscript. BD contributed to conception and design of the study, performed laboratory measurements, provided ice sample, and contributed to data analysis and interpretation. MS and CB provided PSA samples and contributed to data interpretation. All authors contributed to manuscript revision, read and approved the submitted version.
This work is a contribution to the PRIN 2009 research project “Variability and geographic provenance of eolian dust in Antarctica during the late Quaternary: a multi-parametric approach with the use of cutting-edge techniques” and partial supported by University of Urbino and DiSPeA research project 2019.
The authors declare that the research was conducted in the absence of any commercial or financial relationships that could be construed as a potential conflict of interest.
The handling editor declared a past co-authorship with one of the authors LL.
The reviews from SS and SB, as well as the discussion with Dennis V. Kent helped to improve the manuscript. Jean-Robert Petit is acknowledged for kindly providing ice samples and some PSA samples, Paul Augustinus kindly provided PSA samples from Bunger Hills, and Roberto Lanza provided PSA samples of Ferrar dolerite.
The Supplementary Material for this article can be found online at: https://www.frontiersin.org/articles/10.3389/feart.2020.00258/full#supplementary-material
Baccolo, G., Cibin, G., Delmonte, B., Hampai, D., Marcelli, A., Di Stefano, E., et al. (2018). The contribution of synchrotron light for the characterization of atmospheric mineral dust in deep ice cores: preliminary results from the talos dome ice core (East Antarctica). Condens. Matter. 3:25. doi: 10.3390/condmat3030025
Basile, I., Grousset, F. E., Revel, M., Petit, J.-R., Biscaye, P. E., and Barkov, N. I. (1997). Patagonian origin of glacial dust deposited in East Antarctica (Vostok and Dome C) during glacial stages 2, 4 and 6. Earth Planet. Sci. Lett. 146, 573–589. doi: 10.1016/s0012-821x(96)00255-5
Blakowski, M. A., Aciego, S. M., Delmonte, B., Baroni, C., Salvatore, M. C., and Simms, K. W. W. (2016). A Sr-Nd- Hf isotope characterization of dust source areas in Victoria Land and the McMurdo Sound sector of Antarctica. Quat. Sci. Rev. 141, 26–37. doi: 10.1016/j.quascirev.2016.03.023
Brachfeld, S., Pinzon, J., Darley, J., Sagnotti, L., Kuhn, G., Florindo, F., et al. (2013). Magnetic tracers of ice sheet extent and sediment provenance in the ANDRILL AND-1B drill core, Ross Sea, Antarctica. Glob. Planet. Chang. 110, 420–433. doi: 10.1016/j.gloplacha.2013.09.015
Bristow, C. S., Augustinus, P., Rhodes, E. J., Wallis, I. C., and Jol, M. H. (2011). Is climate change affecting rates of dune migration in Antarctica? Geology 39, 831–834. doi: 10.1130/G32212.1
Community Members EPICA (2004). Eight glacial cycles from an antarctic ice core. Nature 429, 623–628. doi: 10.1038/nature02599
Dash, J. G., Rempel, A. W., and Wettlaufer, J. S. (2006). The physics of premelted ice and its geophysical consequences. Rev. Mod. Phys. 78:695. doi: 10.1103/RevModPhys.78.695
Delmonte, B., Andersson, P. S., Hansson, M., Schoberg, H., Petit, J.-R., Basile-Doelsch, I., et al. (2008). Aeolian dust in East Antarctica (EPICA-Dome C and Vostok): provenance during glacial ages over the last 800 Kyr. Geophys. Res. Lett. 35:L07703.
Delmonte, B., Andersson, P. S., Schöberg, H., Hansson, M., Petit, J.-R., Delmas, R., et al. (2010a). Geographic provenance of aeolian dust in East Antarctica during pleistocene glaciations: preliminary results from talos dome and comparison with East Antarctic and New Andean Ice core data. Quat. Sci. Rev. 29, 256–264. doi: 10.1016/j.quascirev.2009.05.010
Delmonte, B., Baroni, C., Andersson, P. S., Narcisi, B., Salvatore, M. C., Petit, J. R., et al. (2010b). Aeolian dust in the Talos Dome ice core (East Antarctica, Pacific/Ross Sea sector): Victoria Land versus remote sources over the last two climate cycles. J. Quat. Sci. 25, 1327–1337. doi: 10.1002/jqs.1418
Delmonte, B., Baroni, C., Andersson, P. S., Narcisi, B., Salvatore, M. C., Petit, J. R., et al. (2013). Modern and Holocene aeolian dust variability from Talos Dome (Northern Victoria Land) to the interior of the Antarctic ice sheet. Quat. Sci. Rev. 64, 76–89. doi: 10.1016/j.quascirev.2012.11.033
Delmonte, B., Basile-Doelsch, I., Petit, J. R., Maggi, V., Revel-Rolland, M., Michard, A., et al. (2004). Comparing the Epica and Vostok dust records during the last 220,000 years: stratigraphical correlation and provenance in glacial periods. Earth Sci. Rev. 66, 63–87. doi: 10.1016/j.earscirev.2003.10.004
Gabrielli, P., Wegner, A., Petit, J.-R., Delmonte, B., De Deckker, P., Gaspari, V., et al. (2010). A major glacial-interglacial change in Aeolian dust composition inferred from rare earth elements in Antarctic Ice. Quat. Sci. Rev. 29, 265–273. doi: 10.1016/j.quascirev.2009.09.002
Gaiero, D. M. (2007). Dust provenance in Antarctic Ice during glacial periods: from where in Southern South America? Geophys. Res. Lett. 34:L17707. doi: 10.1029/2007GL030520
Gaiero, D. M., Brunet, F., Probst, J.-L., and Depetris, P. J. (2007). A uniform isotopic and chemical signature of dust exported from patagonia: rock sources and occurrence in southern environment. Chem. Geol. 238, 107–120. doi: 10.1016/j.chemgeo.2006.11.003
Gili, S., Gaiero, D. M., Goldstein, S. L., Chemale, F., Koester, E., Jweda, J., et al. (2016). Provenance of dust to antarctica: a lead isotopic perspective. Geophys. Res. Lett. 43, 2291–2298. doi: 10.1002/2016GL068244
Gore, D. B., Rhodes, E. J., Augustinus, P. C., Leishman, M. R., Colhoun, E. A., and Rees-Jones, J. (2001). Bunger Hills, East Antarctica: ice free at the last glacial maximum. Geology 29, 1103–1106.
Grousset, F. E., Biscaye, P. E., Revel, M., Petit, J.-R., Pye, K., Joussaume, S., et al. (1992). Antarctic (Dome C) ice core dusts at 18ky B.P.: isotopic constraints on origins and atmospheric circulation. Earth Planet. Sci. Lett. 111, 175–182. doi: 10.1016/0012-821x(92)90177-w
Jouzel, J., Masson-Delmotte, V., Cattani, O., Dreyfus, G., Falourd, S., Hoffmann, G., et al. (2007). Orbital and millennial Antarctic climate variability over the past 800,000 Years. Science 317, 793–796.
Lambert, F., Delmonte, B., Petit, J.-R., Bigler, M., Kaufmann, P. R., Hutterli, M. A., et al. (2008). New constraints on the Aeolian dust cycle from an 800,000-year Antarctic Ice core record. Nature 452, 616–619.
Lanci, L., and Delmonte, B. (2013). Magnetic properties of Aerosol dust in peripheral and inner Antarctic ice cores as a proxy for dust provenance. Glob. Planet. Chang. 110, 414–419. doi: 10.1016/j.gloplacha.2013.05.003
Lanci, L., Delmonte, B., Kent, D. V., Maggi, V., Biscaye, P. E., and Petit, J.-R. (2012). Magnetization of Polar Ice: a measurement of terrestrial dust and extraterrestrial fallout. Quat. Sci. Rev. 33, 20–31. doi: 10.1016/j.quascirev.2011.11.023
Lanci, L., Delmonte, B., Maggi, V., Petit, J.-R., and Kent, D. V. (2008a). Ice magnetization in the EPICA-dome C Ice core: implication for dust sources during glacial and interglacial periods. J. Geophys. Res. Atmos. 113:D14207. doi: 10.1029/2007JD009678
Lanci, L., Delmonte, B., Maggi, V., Petit, J. R., and Kent, D. V. (2008b). Ice magnetization in the EPICA-dome C Ice core: preliminary results. Terra Antartica Rep. 14, 83–88.
Lanci, L., and Kent, D. V. (2006). Meteoric smoke fallout revealed by superparamagnetism in Greenland Ice. Geophys. Res. Lett. 33:L13308. doi: 10.1029/2006GL026480
Lanci, L., Kent, D. V., and Biscaye, P. E. (2007). Meteoric smoke concentration in the Vostok Ice core estimated from superparamagnetic relaxation and some consequences for estimates of earth accretion rate. Geophys. Res. Lett. 34:L10803. doi: 10.1029/2007GL029811
Lanci, L., Kent, D. V., Biscaye, P. E., and Bory, A. (2001). Isothermal remanent magnetization of Greenland Ice: preliminary results. Geophys. Res. Lett. 28, 1639–1642. doi: 10.1029/2000GL012594
Lanci, L., Kent, D. V., Biscaye, P. E., and Steffensen, J. P. (2004). Magnetization of Greenland Ice and its relationship with dust content. J. Geophys. Res. D Atmos. 34:L10803. doi: 10.1029/2003JD004433
Lanza, R., and Zanella, E. (1993). Palaeomagnetism of the Ferrar dolerite in the northern Prince Albert Mountains (Victoria Land, Antarctica). Geophys. J. Int. 114, 501–511. doi: 10.1111/j.1365-246X.1993.tb06983.x
Paleari, C. I., Delmonte, B., Andò, S., Garzanti, E., Petit, J.-R., and Maggi, V. (2019). Aeolian dust provenance in central East Antarctica during the holocene: environmental constraints from single-grain raman spectroscopy. Geophys. Res. Lett. 46, 9968–9979. doi: 10.1029/2019GL083402
Petit, J.-R., and Delmonte, B. (2009). A model for large glacial–interglacial climate-induced changes in dust and sea salt concentrations in deep ice cores (Central Antarctica): palaeoclimatic implications and prospects for refining ice core chronologies. Tellus 61, 768–790. doi: 10.1111/j.1600-0889.2009.00437.x
Petit, J.-R., Jouzel, J., Raynaud, D., Barkov, N. I., Barnola, J.-M., Basile, I., et al. (1999). Climate and atmospheric history of the past 420,000 years from the Vostok Ice Core, Antarctica. Nature 399, 429–436. doi: 10.1038/20859
Prasad, M. S., Rudraswami, N. G., and Panda, D. K. (2013). Micrometeorite flux on earth during the last ~50,000 years. J. Geophys. Res. E Planet. 118, 2381–2399. doi: 10.1002/2013JE004460
Revel-Rolland, M., De Deckker, P., Delmonte, B., Hesse, P. P., Magee, J. W., Basile-Doelsch, I., et al. (2006). Eastern Australia: a possible source of dust in East Antarctica interglacial ice. Earth Planet. Sci. Lett. 249, 1–13. doi: 10.1016/j.epsl.2006.06.028
Ruth, U., Barbante, C., Bigler, M., Delmonte, B., Fischer, H., Gabrielli, P., et al. (2008). Proxies and measurement techniques for mineral dust in Antarctic ice cores. Environ. Sci. Technol. 42, 5675–5681. doi: 10.1021/es703078z
Suavet, C. P., Gattaceca, J., Rochette, P., Perchiazzi, N., Folco, L., Duprat, J., et al. (2009). Magnetic properties of micrometeorites. J. Geophys. Res. 114:B04102.
Valet, J. P., Tanty, C., and Carlut, J. (2017). Detrital magnetization of laboratory-redeposited sediments. Geophys. J. Int. 210, 34–41. doi: 10.1093/gji/ggx139
Vallelonga, P., Barbante, C., Cozzi, G., Gabrieli, J., Schüpbach, S., Spolaor, A., et al. (2013). Iron fluxes to talos dome, Antarctica, over the Past 200 Kyr. Clim. Past 9, 597–604. doi: 10.5194/cp-9-597-2013
Venables, W. N., and Ripley, B. D. (2002). Modern Applied Statistics with S, 4th Edn. New York, NY: Springer, doi: 10.2307/2685660
Wegner, A., Gabrielli, P., Wilhelms-Dick, D., Ruth, U., Kriews, M., De Deckker, P., et al. (2012). Change in dust variability in the Atlantic sector of Antarctica at the end of the last deglaciation. Clim. Past 8, 135–147. doi: 10.5194/cp-8-135-2012
The new measurements were integrated with unpublished Hcr data from VK ice core, based on measurements performed during a previous study (Lanci et al., 2007).
This dataset consisted in 10 groups of specimens from Vostok ice core published in Lanci et al. (2007), taken at depth from ∼144 m to ∼481 m belonging to MIS 1 and MIS 2. In each group of samples the mean SIRMice and SIRMdust was computed in order to average out the imprecision in the IDC data, which were taken from the literature. Here we processed the unpublished backfield IRM demagnetization measurements and computed the mean Hcr for each group. IRM demagnetizations were not available for all samples and the mean values were computed on a different number of specimens, as summarized in Table A1.
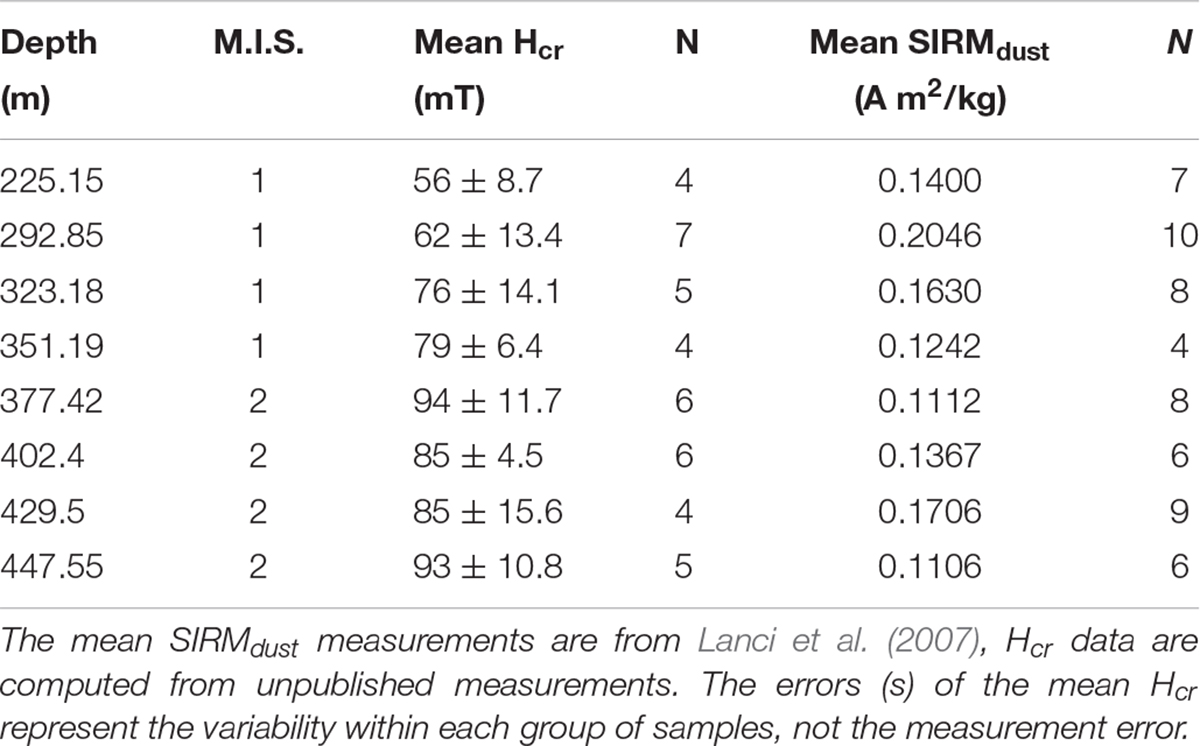
TABLE A1. Integrated dataset from Lanci et al. (2007).
In 8 groups of samples out of 10, we have a minimum of 4 Hcr measurements that allowed to compute reliable mean Hcr values.
Keywords: isothermal remanent magnetization, magnetic properties, Atmospheric dust concentration, Antarctic ice cores, dust source area
Citation: Lanci L, Delmonte B, Salvatore MC and Baroni C (2020) Insight Into Provenance and Variability of Atmospheric Dust in Antarctic Ice Cores During the Late Pleistocene From Magnetic Measurements. Front. Earth Sci. 8:258. doi: 10.3389/feart.2020.00258
Received: 04 April 2020; Accepted: 09 June 2020;
Published: 30 June 2020.
Edited by:
Sara Satolli, G. d’Annunzio University of Chieti and Pescara, ItalyReviewed by:
Simo Spassov, Royal Meteorological Institute of Belgium, BelgiumCopyright © 2020 Lanci, Delmonte, Salvatore and Baroni. This is an open-access article distributed under the terms of the Creative Commons Attribution License (CC BY). The use, distribution or reproduction in other forums is permitted, provided the original author(s) and the copyright owner(s) are credited and that the original publication in this journal is cited, in accordance with accepted academic practice. No use, distribution or reproduction is permitted which does not comply with these terms.
*Correspondence: Luca Lanci, bHVjYS5sYW5jaUB1bml1cmIuaXQ=
Disclaimer: All claims expressed in this article are solely those of the authors and do not necessarily represent those of their affiliated organizations, or those of the publisher, the editors and the reviewers. Any product that may be evaluated in this article or claim that may be made by its manufacturer is not guaranteed or endorsed by the publisher.
Research integrity at Frontiers
Learn more about the work of our research integrity team to safeguard the quality of each article we publish.