 Paul-Ross Thomson
 Rory Ellis
 Domenico Chiarella
 Saswata Hier-Majumder
- Department of Earth Sciences, Royal Holloway University of London, Egham, United Kingdom
During deposition and subsequent diagenesis, reservoir rocks develop sediment texture and cement phases are formed during the precipitation of secondary minerals such as microcrystalline quartz, calcite and clay fibrous over-growths that contain secondary porosity. The grain size distribution and presence of secondary microporous material can influence the reservoir porosity and permeability. Using 3D X-ray microtomographic images we analyze the grains and pore space in Brae Formation sandstones from the South Viking Graben in the North Sea. The samples—derived from two cored wells (16/7b-20 and 16/7b-23), and located within the depth interval between 4,040 m and 4,064 m—display mean grain sizes between 315 and 524 microns (1.78–1.05 ϕ units), classifying them as predominantly medium-grained sands, with moderate to well-sorting (0.51–0.7 ϕ units). From our models we calculate the upper and lower bounds of the micropores on the pore connectivity and permeability. Our samples show total porosities between 10 and 18% of which 6 and 13% are effective, leading to a permeability range between 1 and 400 mD through the effective macropore network. We found that the fraction of effective porosity and effective permeability shows a non-linear reduction with increase in microporous cement volume fraction. Above a threshold cement volume of approximately 5.5% the effective pore network is disconnected and percolation is no longer possible. Based on our observations and modeling results we propose that cement precipitation can be a positive consequence of mineral trapping from sequestered CO2, which can be important for reducing reservoir quality and ensuring efficient long term storage.
1. Introduction
The South Viking Graben is an important hydrocarbon bearing region in the North Sea. One of the several oil fields in this region is the Miller field, located within the UK sector of the North Sea. The main hydrocarbon bearing reservoir in the Miller field is the Jurassic Brae Formation sandstone (Rooksby, 1991; Maast et al., 2011). Consisting primarily of submarine fan deposits, the Brae Formation sandstones are characterized by relatively high porosity (Rooksby, 1991) with secondary mineral phases such as microcrystalline quartz and calcite occupying grain surfaces and pore spaces (Aase and Walderhaug, 2005; Lu et al., 2011; Maast et al., 2011). These secondary phases contain microporosity, which can influence the effective permeability of the rock. While the oil production in the Miller Oil field ceased in 2007, due to the high porosity and existing infrastructure, this field can be potentially used as a future location for deep geological carbon sequestration (Lu et al., 2009). For such future applications, it is important to identify the factors that control the reservoir qualities such as porosity and permeability of the Brae Formation sandstones.
While a number of previous studies looked into the large scale reservoir properties of the Brae Formation sandstone (Rooksby, 1991; Maast et al., 2011) or the nature of secondary phases (Aase and Walderhaug, 2005; Lu et al., 2011; Maast et al., 2011), quantitative, 3 dimensional grain scale analysis of the Brae Formation sandstones remain relatively scarce. We aim to bridge this gap in this article and a companion article (Thomson et al., 2020) by studying core samples from two wells within the western sector (16/7b) of the Miller field. In the companion article, we reported the characteristics of 3D pore network and identified the connection threshold of the macroporous network in the Brae Formation and a suite of other similar sandstones. In this study, we focus on the grain size distribution and the influence of microporosity on the permeability of the Brae Formation rocks.
The reservoir quality (porosity and permeability) of sandstones is strongly influenced by sediment texture (i.e., grain size and sorting; Beard and Weyl, 1973; Scherer, 1987a,b) and diagenetic features such as secondary cementation (Worden, 1998). One component of texture, grain size distribution, defined as the distribution of the grain diameters and their sorting, is an important variable in classifying sedimentary rocks. Grain size distribution provides useful information about the depositional history and the sediment source supply (Klovan, 1966; Visher, 1969; Joseph et al., 1998; Browne et al., 2005), as well as influencing the permeability of the rock. While traditional measurements of grain size from microstructures were carried out on two-dimensional optical or electron microscopic images (Maast et al., 2011), the availability of microtomographic imaging provides an opportunity to measure grain shape attributes in three dimensions. In addition, measurements of porosity and permeability from the same images allows direct correlations between grain size distribution and reservoir properties.
The Brae Formation sandstone is characterized by a distal submarine-fan setting, fine to coarse grained quartzitic composition and diagenetic overprint, with calcite concretions, pyrite precipitates and quartz overgrowth (Rooksby, 1991; Turner and Allen, 1991; Garland, 1993; Gluyas et al., 2000; Marchand et al., 2000). While the previous studies of the secondary phases in the Brae Formation sandstone provide a wealth of information regarding the nature of the deposits and their relation with the primary pore space, relatively little attention has been paid on the influence of the secondary or microporosity on the permeability of the Brae Formation.
Microporosity can exert a significant influence on the effective permeability of reservoir rocks (Bultreys et al., 2016b; Thomson et al., 2019). Traditionally, estimates of permeability can be achieved by several methods. Well flow tests can provide useful information at reservoir scale, while gas or liquid permeability experiments in the laboratory provide estimates at core scale. Although physical experiments can likely access microporosity and provide measurements of fluid flow in a dual-porosity system, these techniques do not provide quantitative data on the volume of micropores or how much these pores contribute to fluid flow within reservoir rocks. Over the last two decades, the use of micro CT techniques has increased in popularity within pore scale research. These methods have provided better understanding for pore scale physics and the technology continues to develop quickly. However, the image resolution and selection of an appropriate representative elementary volume from which both pore types (macro and micro) can be sampled, remains challenging (Mehmani and Prodanović, 2014; Bultreys et al., 2016b; Thomson et al., 2019).
In the absence of 3D images of the micropore network, we establish the upper and lower bounds on the influence of the micropores on the permeability. Following the method outlined by Thomson et al. (2019), we treat the microporous secondary phase as two end members, one consisting entirely of void space, and the other entirely solid. This approach, commonly employed in determining effective elastic properties of porous media (Mavko et al., 2009), allows the establishment of a framework for future, high resolution microtomographic studies of direct determination of micropore network characteristics and the resultant permeability. We segment and analyze the micro CT images of eight sandstone samples from these two wells to quantify the volume fraction and connectivity of the macro and micropore spaces, measure the 3D grain size characteristics, and explore the relationship between grain size and reservoir properties.
2. Methods
For this work, we chose four different sample intervals from two cores from two wells originating from the Brae/Miller field area. From each sample interval, we drilled one 5 mm diameter core plug to acquire X-ray micro-CT images at the Imaging and Analysis Centre at The London Natural History Museum. For more information on this process, we refer the reader to the companion article, Thomson et al. (2020). The stacked raw images obtained from the acquisition process are filtered and segmented to separate the key phases using the software PerGeos from Thermo Fisher Scientific. We outline further details of each of these steps in the following text.
2.1. Image Processing
The image acquisition process can result in a variety of unwanted features in the final stack of tiff images. The most prevalent artifact is beam hardening, which creates edges of the samples that appear brighter than the center, even when the material remains the same. Another common feature of the scanning process is the presence of ring artifacts centered on the rotational axis of the sample (Ketcham and Carlson, 2001; Wildenschild et al., 2002).
The first step to reduce the impact of such features in the samples, was to extract a sub-volume from the raw data. We set the region of interest (ROI) to 1,300 × 1,300 × 1,850 voxels (2.6 × 2.6 × 3.7 mm) and 730 × 630 × 930 voxels (2.8 × 2.5 × 3.6 mm) for samples with voxel dimensions of 2.0 and 3.9 μm3, respectively. This permitted a large sample area for grain size analysis. However, smaller ROIs were required during permeability simulation in order to reduce the computational time constraints. Further information on each sample can be found in Table 1.
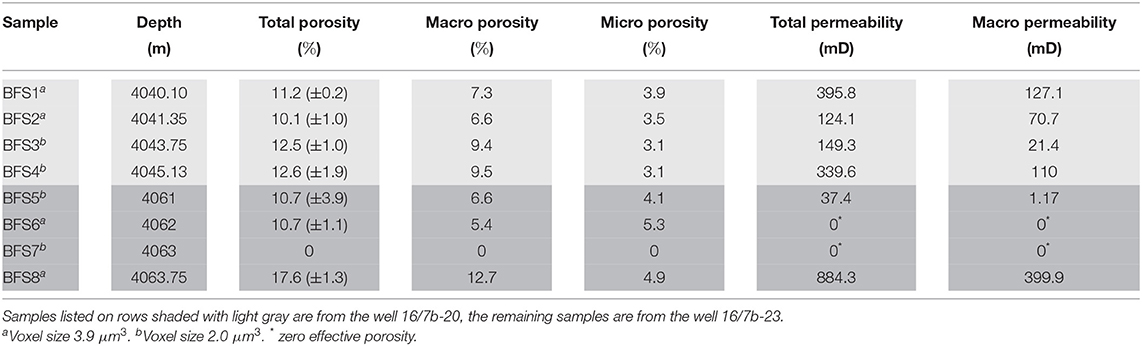
Table 1. Summary of sample data used in this study, including sample name, depth interval, total porosity, macro and microporosity, permeability, associated well and voxel resolution.
The next step, image filtering, aims to smooth gray scale intensities of the voxels and enhance the contrast between key phases in the micro-CT images. There are a variety of image filtering techniques that deploy many different methods to efficiently remove artifacts, reduce noise and increase edges (Schlüter et al., 2014). In this work, we used the non-local means filter to effectively despeckle and maintain contrast between grains and pores (Buades et al., 2008, 2010). Unlike many other linear methods (e.g., Gaussian, mean filter, etc.), this filter is not limited by a small sized kernel, meaning that the entire image may be used as a search window in the final weighting stage for gray scale determination of each voxel. A large search window dramatically increases the computational time for the filtering process and can lead to the removal of key features as a result of excessive smoothing. We used the default search window size to maintain a balance between processing time and quality image filtering.
The final stage of image processing is segmentation, the individual separation of each phase. During this process, the different phases are separated based on their gray scale intensity values, which are related to material density, atomic number and the energy of the X-rays. The process of image segmentation can be either automated (Ridler and Calvard, 1978; Otsu, 1979) or manual, based on gray scale histogram evaluation alone. The process is most commonly completed manually due to small but consistent over or underestimated values from automated schemes (Iassonov et al., 2009; Wildenschild and Sheppard, 2013; Bultreys et al., 2016a). Inconsistent results from automated techniques arise from samples that have multiple phases with similar gray scale intensity and/or significant image noise (Thomson et al., 2018). We chose to use a manual thresholding technique, assigning voxels in the 3D ROI to labels that we interpreted the material belong to (e.g., pore or grain). Figure 1A shows the contrast between the grain phase (dark gray) and the cement phase (light gray) in one of the samples.
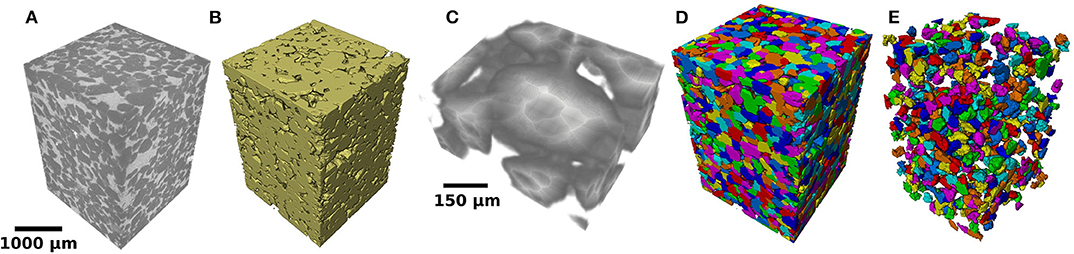
Figure 1. Volume rendering visualization showing (A) the raw 3D data, (B) the segmented quartz grain phase, (C) a sub-volume section showing the distance map used for regional maxima computation for individual grains, (D) the separated quartz grains in the whole volume, and (E) the mean grain size ± 10% for sample BFS7.
Volume fraction measurements for different materials in the samples are obtained from the 3D volumes generated as a result of the segmentation process. In total, we generated four label fields from the four key materials that are present within each sample. Phases with the lowest gray scale intensity through to those with the highest gray scale intensity, are identified as macroporosity, microporosity, quartz grain and other minor mineral grains. Each of these phases have a proportion of the total voxels in the volume assigned to their designated label field. While the identification of macroporosity, quartz grain and other less abundant minerals is fairly straightforward, establishing an accurate representation of the microporosity remains challenging. To work around this complication, we adopted the approach already used in previous works (Bultreys et al., 2016b; Thomson et al., 2019), where microporosity is identified and assigned as an intermediate gray scale phase between macroporosity and quartz grain. To calculate the representative proportion of each phase, the number of voxels assigned to one label field (e.g., macroporosity) is divided by the total number of voxels in the entire sample volume.
2.2. Porosity Characterization
One key limitation of micro CT analysis is the inability to accurately determine the role of microporous material in porous geological media. There is a conflict between sample size and image resolution which prevents the quantification of both macro and micropores in a sample. We overcome this using an end-member approach to quantify the effect of microporosity hosted by microcrystalline precipitations in these rocks. We generate simple models to assess the influence of the microporous phase on the connectivity of the pore network and the control on permeability. Two extremes of pore network connectivity are assessed. At one end of the scale we assume that the microporosity is void space, and on the other, it is an impermeable solid. In reality, porosity of the microporous phase lies between these two extremes. In the absence of the information about the micropore geometry, the two end members provide us the upper and lower bounds of effective porosity and permeability. We calculate the fraction of effective macroporosity by dividing the effective macroporosity by the total macroporosity to assess the influence of the cement phase (microporous material) on the connectivity of the pore network. Similarly, we test our permeability models to assess how the ratio of permeability is controlled by the cement volume fraction. In addition, treating the microporosity in terms of the two end member cases, can also serve as a temporal analog. If the microporosity is derived from secondary cement phases, the two end members provide the geometry of the pore space before and after cementation.
2.3. Permeability Simulation
Following the segmentation of the pore space phase in each sample, the pore network is further processed to remove any isolated voxels that do not form part of the interconnected pore system between two planes of the volume. This process was performed on the long axis (Z) of each sample to provide a network of effective porespace where possible. The effective 3D pore volume was then used to simulate the absolute permeability through each of the samples. Using a finite volume solver from the Pergeos petrophysics module, we calculated the single phase flow of water by solving Stokes equation,
where u is the fluid velocity vector, P is the pressure and μ = 1 × 10⁻³ Pa.s is the viscosity of water. With the exception of the 3D pore volume of the effective network, all boundary conditions (as described in Thomson et al., 2018) and parameters were kept constant. Similarly to previous work by Thomson et al. (2019) we ensured that the convergence criterion or error, ϵ, was set to a predetermined value for ϵ ≤ 10−6. This parameter is particularly important as it determines the computational cost and accuracy of permeability results.
2.4. Grain Size Measurements
Following the process of segmentation of the quartz grain phase (Figure 1B), 3D grain volumes are obtained for further analysis. The goal of this analysis is to obtain quantitative data on the grain size. To achieve this goal, the 3D grain volume has to be handled using a number of image processing steps. The watershed algorithm is key to this analysis and is a powerful method that allows automated separation of the grains and/or pores (Youssef et al., 2007). The process of grain separation is described in the following steps:
• The 3D label field for the grain phase, generated during segmentation described in section 2.1, is used to compute a distance map (e.g., Figure 1C). The distance map is created by assigning a value to each voxel within a grain. The value for each voxel corresponds to its distance to the background, which in this case, is the pore space. The distance map provides the “input priority map” for the watershed process.
• Next, the distance map is used to compute the regional maxima, located at the most inner region of the grains. A new label field is created containing markers at the center of the grains. These marker regions are used as seed areas for flooding during the watershed.
• The watershed algorithm then expands the marker regions toward increasing values of the input priority map, so the distance map has to be inverted first. The marker-based watershed algorithm is applied, ensuring that the inverted distance map and maxima labels are connected.
• Finally, the watershed image is used to generate separation lines. These separation lines are subtracted from the original 3D label field for the grain phase to produce a new 3D image containing individual separated grains. The 3D separated grain image is converted to a label image (Figure 1D) and processed using the label analysis tool to provide 3D Feret diameters of the grains.
• The 3D grain label images can be filtered to show the proportion of a particular grain size in the sample. Figure 1E shows the mean grain size ± 10% for sample BFS7.
The grain size measurements obtained from the grain separation algorithm are used to quantify the degree of sorting and classify the samples. Due to the sensitivity of the algorithm, the data is not completely free from errors. Some measurements, arising from small scale noise in the gray scale intensity of the images, are present in the data that do not fall within the expected range for sandstone sediments. Since the primary focus of this study is the analysis of quartz grains, we remove small scale noise in our data by filtering the results based on the Wentworth (1922) grain size classification for sediments, to exclude grain size measurements <63 μm. This provided us with data that displayed characteristics for very fine sands and above.
The grain size statistics are calculated using the 3D measurement for grain length. We report some of the grain size analysis and graphical representations using phi (ϕ) units. To obtain phi units we applied a logarithmic transformation of millimeters to whole integers, using the formula:
where d is grain diameter (3D grain length) in millimeters, and d0 = 1 mm. To calculate the median grain size we use the 50 percentile where half the grains are larger and half are smaller than the median. We report the median grain size in both microns and phi units. In addition, we use the following formula from Folk (1980) to calculate the mean (average) grain size in phi units:
where ϕ16, ϕ50, and ϕ84 represent the grain size at 16, 50, and 84 percentiles in the data.
The grain size variation between samples can provide useful information for sediment source, transportation and comparison of petrophysical properties. Folk (1980) introduced the “inclusive graphic standard deviation” which includes 90% of the distribution and provides the best overall measure of sediment sorting. To calculate the sorting in ϕ units, the following equation is used:
where ϕ95 and ϕ5 represent the ϕ values at 95 and 5 percentiles. We classify the sorting of the samples based on the discrete classification scale for sorting (Folk, 1980): ϕ1 < 0.35: very well-sorted; 0.35–0.5: well-sorted; 0.5–0.71: moderately well sorted; 0.71–1.0: moderately sorted; 1.0–2.0: poorly sorted; 2.0–4.0: very poorly sorted; and > 4.0: extremely poorly sorted.
The skewness is used to describe the degree of asymmetry of a distribution. Samples may have similar average grain size and sorting but their degrees of symmetry may be quite different. We use the inclusive skewness equation (Folk, 1980):
which provides a much better statistic and includes 90% of the curve compared to other methods (e.g., Inman, 1952).
3. Results
For each sample we compare the grain size characteristics, porosity and permeability. The total porosity, the proportions of macroporosity and microporosity, and the permeability are showed in Table 1. The mean and median grain size, sorting, and skewness statistics for each sample is displayed in Table 2.
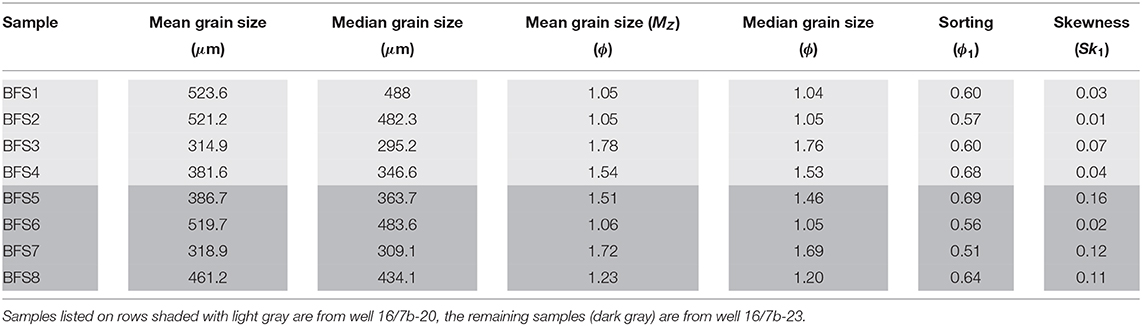
Table 2. Summary of grain size analysis, including mean and median grain size, sorting, and skewness.
3.1. Grain Size Characteristics
Our results from the 3D grain length analysis, obtained from Equation (4) show that most of the samples have a mean grain size between 2 and 1 ϕ units (250 and 500 μm). This suggests that they are typically medium-grained sandstone (Wentworth, 1922). The sample BFS1 has a mean grain size outside of this range (523.6 μm), classifying it as a coarse grained sandstone. Sorting is obtained from Equation (5). All samples are moderately to well-sorted, characterized by the narrow range of ϕ1 values between 0.5 and 0.7. Within this small range, BFS7 has the best sorting of quartz grains, while BFS5 is the least well-sorted. The distribution of grain size is shown graphically in Figure 2 for the four samples from conventional core from the Brae interval in exploration wells 16/7b-20 (Figure 2A) and 16/7b-23 (Figure 2B), respectively. These plots highlight that all samples have an asymmetrical distribution with a positive skewness and an apparent excess of more fine grained material. The results of the skewness analysis obtained from Equation (6) shows that all samples have values between 0.01 and 0.12, indicating near symmetrical through to fine skewed preference.
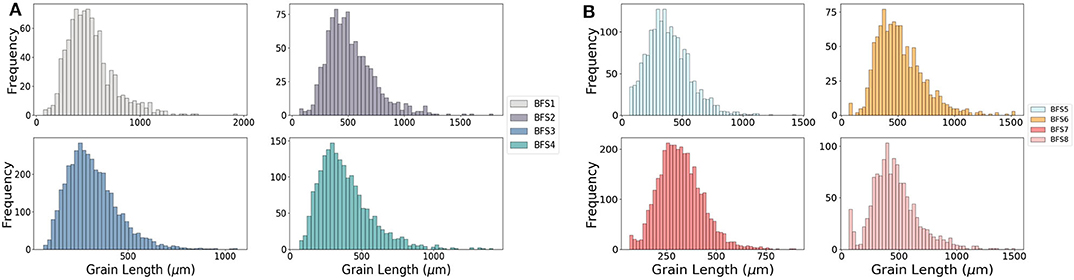
Figure 2. Grain size distribution plots for samples BFS1-BFS4 from well 16/7b-23 (A) and samples BFS5-BFS8 from well 16/7b-20 (B).
3.2. Porosity and Pore Network Analysis
A detailed analysis of the macropore network of these samples is presented in Thomson et al. (2020). In this article, we focus on the geometry of the microporosity determined by image analysis and the total porosity, calculated by adding the micro and macropore spaces. Samples from well 16/7b-20 (BFS1 through to BFS4) have total porosities of 11.2, 10.1, 12.5, and 12.6%, respectively. The average total porosity from the samples in this well is 11.6%. Samples from well 16/7b-23 show a wider range in total porosity, with one sample (BFS7), completely devoid of detectable porosity. The calculated total porosity for sample BFS5, BFS6, and BFS8 is 10.7, 10.7, and 17.6%, respectively. The average total porosity is also higher in the samples from this well with a value of 13%.
Macroporosity is the dominant void space in most of the samples. The proportion of microporosity is generally much smaller than the macroporosity, with the exception of sample BFS6, which contains almost equal amounts of macro and microporosity. Figure 3A demonstrates the poorly connected network of macropores in BFS6. The relative proportion of macro (green) and microporosity (red) in sample BFS6 is shown in Figure 3B. The influence of microporous pore-filling cements can be observed in Figure 3C, where larger clusters of porespace appears to become disconnected. The samples BFS3 and BFS4 have the largest share of macroporosity out of all the samples, with 75% of void space in the macropores. The sample BFS8 also has a high proportion of macroporosity, with a value of 72%. Samples BFS1 and BFS2 have a 65% proportion of macroporosity, while BFS5 has 62%.
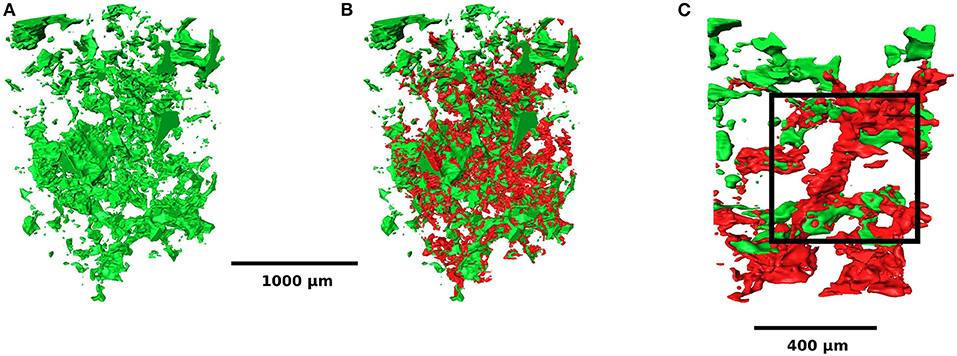
Figure 3. Volume rendering visualization of the influence of cement on the pore network. Shown in sample BFS6 where green is macroporosity and red is microporosity. The poorly connected macroporosity is shown in isolation in (A). The proportion of both macro and microporosity is shown in (B). The microporous cement phase can effectively fill some channels between larger clusters of macropores (C).
3.3. Results From Permeability Simulations
In this article, we compare and contrast the two end member cases of permeability. In the first case, we assume that the micropore space is impermeable, and the fluid flow takes place only through the connected macropores. In the second end member case, we assume that the microporosity is void, and fluid flow takes place through the connected fraction of the total pore space. In a companion publication (Thomson et al., 2020), we reported the results of only the first end member case. While the true permeability of the rocks falls somewhere between these two limits, in the absence of higher resolution microtomographic images of the micropore space, these two limits allow us to quantify the upper and lower bounds on permeability of these microporous, cement-bearing rocks.
The results of our permeability simulations highlight the impacts of cementation on the ability of pore networks to permit fluid flow. Figure 4 shows the volume rendering visualization of absolute permeability though BFS1: (A) total pore network, where macro and microporosity form a single network; and (B) through the macropore network only. As the figure highlights, there is a greater abundance of flow pathways in the total pore network (a) compared to that of the macropore network (b). The reduced frequency of channels and diminished connectivity of the pore network has a negative impact on the rocks ability to permit fluid flow and hence the permeability measurements. Table 1 shows the results of total and macro only permeability simulations. The total permeability (flow through the effective total pore space, the second case described above) measurements varied by one order of magnitude between 37.4 and 884.3 mD, in samples BFS5 and BFS8, respectively. The permeability measurements through effective macropores varied by two orders of magnitude between 1.17 and 399.9 mD, once again in samples BFS5 and BFS8. The maximum variation in permeability within a single sample between the total pore network and the macro only network is by one order of magnitude.
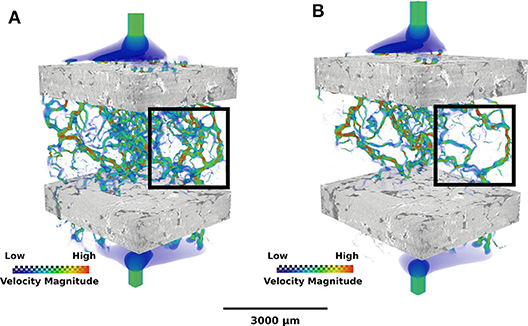
Figure 4. Volume rendering visualization of the effect of microporosity on permeability in sample BFS1. (A) The upper limit: in this case the micropore space is considered to be completely void. The streamlines, colored by dimensionless fluid velocity, illustrate the flow pathways before cementation. (B) The lower limit: in this case, we consider the macropore space to be impermeable, leading to a more sparse distribution of streamlines. See Table 1 for the permeability values for these two limits in each sample.
4. Discussion
4.1. Comparison With Previous Measurements
The results from our measured grain size and permeability compares well with previous measurements from Brae Formation and similar rocks. As the plot in Figure 5 displays, the grain size from our measurements agrees well with the grain size range obtained for the Brae Formation from traditional point-count analysis (Maast et al., 2011) highlighted as the gray shaded region. The variations in permeability arise from porosity variations in the samples. Despite these variations, our data does show good agreement with grain size and permeability values approximated from previous well log analysis (Maher, 1980). As the plot shows, the shaded orange and blue regions correspond to fine to medium and medium to coarse grained intervals and their relevant permeability ranges of the Piper Formation, respectively. These samples, also originating from sandstone reservoirs at depth (≈ 2,800 m) in the North Sea, overlay the results of our Brae Formation data similarly and shows a positive relation between grain size and permeability. While the narrow range of grain sizes in our data precludes establishment of a trend between grain size and permeability, our measurements compare well with the permeability and median grain diameter trend of hydrate free core sediments (plotted as triangles) (Konno et al., 2015). We also compare data from petrophysical analysis on tight gas sandstone analog rocks (Becker et al., 2017), which fall within the same range of grain size but are substantially less permeable due to high volumes of microporosity (up to 80%) in those rocks. Our results indicate that 3D grain size analysis and permeability simulation can be used as a reliable alternative to more classical and time consuming methods. As this technique continues to evolve, further work is required to assess the petrophysical properties of more sandstones with a greater range of grain shape and sizes.
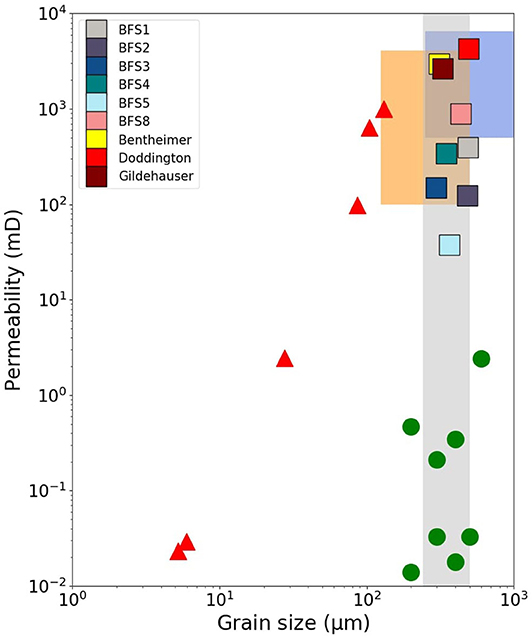
Figure 5. Comparison between our data and previous studies of permeability as a function of grain size. The red triangles represent data from hydrate-free sediments (Konno et al., 2015), while the green circles represent data from tight gas sandstones (Becker et al., 2017). The shaded orange and blue regions correspond to fine to medium and medium to coarse grained intervals of the Piper Formation, respectively (Maher, 1980). The shaded gray interval is the range of grain size measurements obtained by point-count analysis for the Brae Formation (Maast et al., 2011).
4.2. Influence of Cement on Reservoir Properties
The Brae Formation, along with many other North Sea reservoirs, has quartz and calcite cements that are considered one of the main porosity reducing factors (Bjørlykke et al., 1992; Giles et al., 1992; Gluyas et al., 2000; Marcussen et al., 2010), with quartz overgrowth ranging from 3 to 15%, while calcite ranges from 20 to 40%, in concretion centers (Lu et al., 2011). Concretions exist as volumes of sandstone where almost all pore space is infilled between sand grains (e.g., sample BFS7), and these can exist in bed units ranging from 2 to 11 m thickness. Concretions are believed to be the consequence of the earliest diagenesis following deposition (Marchand et al., 2000). In the samples, we observe microquartz cement and fibrous over-growths, associated with a later phase of diagenesis and the presence of clay minerals (see Thomson et al., 2020 for SEM images). We observe the presence and quantify the relative proportion of these microporous phases using our X-ray CT images in this study, however the challenge remains to accurately model the influence of microporosity on reservoir properties (e.g., Mehmani and Prodanović, 2014; Bultreys et al., 2016b; Soulaine et al., 2016; Mehmani et al., 2019). In this work, we find agreement with previous studies of the Brae Formation, that the samples contain microporous cements, and their abundance falls within similar proportions as those reported by Lu et al. (2011), Marchand et al. (2000), and Thomson et al. (2020). The proportions of microporosity reported from image analysis in this study (Table 1) are slightly lower than those reported by Thomson et al. (2020) from Helium porosimetry measurements on the same samples.
The relationship between the volume of cement and the fraction of effective (connected) macroporosity shows an interesting trend in our data. We plot the cement volume fraction along the x-axis and the fraction of effective macroporosity along the y-axis. As Figure 6A shows, the proportion of effective macroporosity is increased with low volumes of the cement phase. As the cement phase increases, at volumes between 3 and 5%, the effective macroporosity decreases to around 50 to 80% efficiency. The majority of our data from the Brae Formation fall in this range, indicated by a cluster in the plot. As the cement volume fraction exceeds a volume of approximately 5.5% the connectivity of the pore network is lost with an effective macroporosity value of zero.
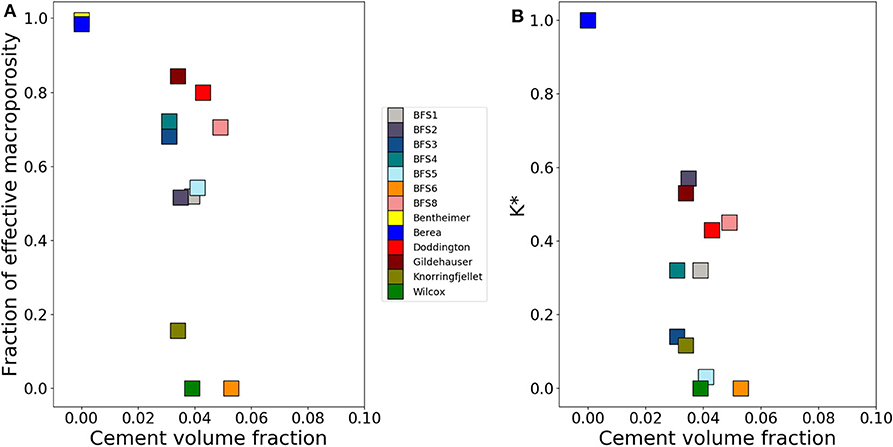
Figure 6. Plots displaying the fraction of effective macroporosity (A) and the ratio of macro permeability and total permeability (B) as a function of cement volume fraction.
In Figure 6B, we display the ratio of as function of cement volume fraction, where kM is macro permeability and kT is total permeability. From this plot it is possible to observe the direct effect of cementation on fluid flow. Our two end-member models allow us to assess the pore space before (total porosity) and after (macroporosity) cementation. Similarly to the effects of cementation on pore network connectivity, we observe a trend that shows as the cement volume increases, the permeability declines quickly, finally becoming zero when cement volume fractions reach approximately 5.5%. The ratio of k* in the samples ranges between 3 and 57%. Despite having one of the largest volumes of cement, sample BFS2 has the highest ratio of k*. Sample BFS8 has the highest proportion of the cement phase and yet still shows good ability to permit fluid flow with a ratio of 45%. The lowest k* ratio is found in sample BFS5 with a cement volume fraction of 5.1%, the third greatest in the samples.
The injection of CO2 into deep saline aquifers has been practiced in the oil and gas industry for many years as a means of improving the efficiency of oil recovery from the reservoir. In more recent years, the storage of CO2 in depleted reservoirs is being considered a possible long term method to reduce emissions to the atmosphere (Chadwick et al., 2004; Haszeldine et al., 2005; Holloway et al., 2006). One of the most notable projects includes the injection of CO2 into the Utsira Formation of the Sleipner field (Furre et al., 2017). The Brae formation sandstone reservoir rocks of the Miller field have also been listed as a potential CO2 storage target in the past due to a widespread seal rock and apparent natural system capable of storing accumulations of CO2 for many millions of years (Lu et al., 2009). Three key processes of CO2 trapping have been established (Hitchon, 1996): structural trapping, dissolution trapping, and mineral trapping. The potential of mineral trapping is greatest, due to residence times on the order of geologic timescales (Bachu et al., 1994). As discussed previously, one might expect with the injection of CO2, the reaction and precipitation of minerals during porous flow, and the eventual cementation of pore space, the connectivity and ability of the reservoir becomes diminished. These processes are indeed welcome, as more CO2 is sequestered in the mineral form and the overall quality of the reservoir decreases, there is an increasing likelihood that the CO2 remains trapped deep in the subsurface.
5. Conclusions
• We analyzed 8 samples from the Brae Formation, originating from the Miller oil field in the North Sea. We performed micro-structural analysis using 3D models obtained through X-ray CT images.
• We consider the grain size characteristics, porosity and permeability of the samples and assessed the relationships between those properties.
• Our grain size analysis indicates the samples are medium grained (250 μm to 500 μm length), moderately well-sorted and have a near symmetrical to fine skewed graphic distribution.
• No strict trend is observed between average grain size and both porosity and permeability in our data. However, grain size and permeability results do agree well with those from previous studies of other subsurface reservoir rocks.
• Within the samples analyzed in this study, an increase in cement volume has a negative influence on the porosity and permeability. Above a threshold cement volume of approximately 5.5% the connectivity of the pore network is disabled and porous flow is non-existent.
Data Availability Statement
The datasets generated for this study are available on request to the corresponding author. Grain Size Data is available through figshare (Thomson et al., 2019).
Author Contributions
P-RT carried out the image processing, grain separation and permeability simulations in all samples. RE carried out the preliminary grain size analysis. SH-M and P-RT jointly carried out the final grain size modeling and statistical analysis. All authors contributed to writing and revision of the manuscript.
Conflict of Interest
The authors declare that the research was conducted in the absence of any commercial or financial relationships that could be construed as a potential conflict of interest.
Acknowledgments
P-RT acknowledges support from the NERC Oil and Gas CDT graduate fellowship (grant number NE/M00578X/1). This research was also supported by the grant EAR125880 from the US National Science Foundation.
References
Aase, N. E., and Walderhaug, O. (2005). The effect of hydrocarbons on quartz cementation: diagenesis in the upper Jurassic sandstones of the miller field, north sea, revisited. Petrol. Geosci. 11, 215–223. doi: 10.1144/1354-079304-648
Bachu, S., Gunter, W., and Perkins, E. (1994). Aquifer disposal of CO2: hydrodynamic and mineral trapping. Energy Convers. Manag. 35, 269–279. doi: 10.1016/0196-8904(94)90060-4
Beard, D., and Weyl, P. (1973). Influence of texture on porosity and permeability of unconsolidated sand. AAPG Bull. 57, 349–369. doi: 10.1306/819A4272-16C5-11D7-8645000102C1865D
Becker, I., Wüstefeld, P., Koehrer, B., Felder, M., and Hilgers, C. (2017). Porosity and permeability variations in a tight gas sandstone reservoir analogue, Westphalian D, Lower Saxony basin, NW Germany: influence of depositional setting and diagenesis. J. Petrol. Geol. 40, 363–389. doi: 10.1111/jpg.12685
Bjørlykke, K., Nedkvitne, T., Ramm, M., and Saigal, G. C. (1992). Diagenetic processes in the brent group (middle Jurassic) reservoirs of the north sea: an overview. Geol. Soc. Lond. Spcl Publ. 61, 263–287. doi: 10.1144/GSL.SP.1992.061.01.15
Browne, G. H., King, P. R., Higgs, K. E., and Slatt, R. M. (2005). Grain-size characteristics for distinguishing basin floor fan and slope fan depositional settings: outcrop and subsurface examples from the late miocene mount messenger formation, new zealand. N. Zeal. J. Geol. Geophys. 48, 213–227. doi: 10.1080/00288306.2005.9515111
Buades, A., Coll, B., and Morel, J.-M. (2008). Nonlocal image and movie denoising. Int. J. Comput. Vis. 76, 123–139. doi: 10.1007/s11263-007-0052-1
Buades, A., Coll, B., and Morel, J. M. (2010). Image denoising methods. a new nonlocal principle. SIAM Rev. 52, 113–147. doi: 10.1137/090773908
Bultreys, T., De Boever, W., and Cnudde, V. (2016a). Imaging and image-based fluid transport modeling at the pore scale in geological materials: a practical introduction to the current state-of-the-art. Earth Sci. Rev. 155, 93–128. doi: 10.1016/j.earscirev.2016.02.001
Bultreys, T., Stappen, J. V., Kock, T. D., Boever, W. D., Boone, M. A., Hoorebeke, L. V., et al. (2016b). Investigating the relative permeability behavior of microporosity-rich carbonates and tight sandstones with multiscale pore network models. J. Geophys. Res. Solid Earth 121, 7929–7945. doi: 10.1002/2016JB013328
Chadwick, R., Zweigel, P., Gregersen, U., Kirby, G., Holloway, S., and Johannessen, P. (2004). Geological reservoir characterization of a CO2 storage site: The Utsira sand, Sleipner, northern north sea. Energy 29, 1371–1381. doi: 10.1016/j.energy.2004.03.071
Folk, R. L. (1980). Petrology of Sedimentary Rocks. Austin, TX: Hemphill Publishing Company. Available online at: https://books.google.co.uk/books?id=e-cKAQAAIAAJ
Furre, A.-K., Eiken, O., Alnes, H., Vevatne, J. N., and Kiær, A. F. (2017). 20 years of monitoring CO2-injection at sleipner. Energy Proc. 114, 3916–3926. doi: 10.1016/j.egypro.2017.03.1523
Garland, C. (1993). “Miller field: reservoir stratigraphy and its impact on development, in Geological Society, Petroleum Geology Conference Series, Vol. 4 (London: Geological Society of London), 401–414. doi: 10.1144/0040401
Giles, M., Stevenson, S., Martin, S., Cannon, S., Hamilton, P., Marshall, J., et al. (1992). The reservoir properties and diagenesis of the brent group: a regional perspective. Geol. Soc. Lond. Spcl. Publ. 61, 289–327. doi: 10.1144/GSL.SP.1992.061.01.16
Gluyas, J., Garland, C., Oxtoby, N., Hogg, A., Worden, R., and Morad, S. (2000). Quartz cement: the miller's tale. Spcl. Publ. Int. Assoc. Sedimentol. 29, 199–218. doi: 10.1002/9781444304237.ch14
Haszeldine, R., Quinn, O., England, G., Wilkinson, M., Shipton, Z., Evans, J. P., et al. (2005). Natural geochemical analogues for carbon dioxide storage in deep geological porous reservoirs, a United Kingdom perspective. Oil Gas Sci. Technol. 60, 33–49. doi: 10.2516/ogst:2005004
Hitchon, B. (1996). Aquifer Disposal of Carbon Dioxide: Hydrodynamic and Mineral Trapping - Proof of Concept. Devon, AB: Geoscience Publishing Ltd.
Holloway, S., Vincent, C. J., Bentham, M. S., and Kirk, K. L. (2006). Top-down and bottom-up estimates of CO2 storage capacity in the United Kingdom sector of the southern north sea basin. Environ. Geosci. 13, 71–84. doi: 10.1306/eg.11080505015
Iassonov, P., Gebrenegus, T., and Tuller, M. (2009). Segmentation of X-ray computed tomography images of porous materials: A crucial step for characterization and quantitative analysis of pore structures. Water Resourc. Res. 45:8087. doi: 10.1029/2009WR008087
Inman, D. L. (1952). Measures for describing the size distribution of sediments. J. Sediment. Res. 22, 125–145. doi: 10.1306/D42694DB-2B26-11D7-8648000102C1865D
Joseph, L. H., Rea, D. K., and Van der Pluijm, B. A. (1998). Use of grain size and magnetic fabric analyses to distinguish among depositional environments. Paleoceanography 13, 491–501. doi: 10.1029/98PA01939
Ketcham, R. A., and Carlson, W. D. (2001). Acquisition, optimization and interpretation of X-ray computed tomographic imagery: applications to the geosciences. Comp. Geosci. 27, 381–400. doi: 10.1016/S0098-3004(00)00116-3
Klovan, J. (1966). The use of factor analysis in determining depositional environments from grain-size distributions. J. Sediment. Res. 36, 115–125. doi: 10.1306/74D7141A-2B21-11D7-8648000102C1865D
Konno, Y., Yoneda, J., Egawa, K., Ito, T., Jin, Y., Kida, M., et al. (2015). Permeability of sediment cores from methane hydrate deposit in the eastern Nankai trough. Mar. Petrol. Geol. 66, 487–495. doi: 10.1016/j.marpetgeo.2015.02.020
Lu, J., Wilkinson, M., Haszeldine, R. S., and Boyce, A. J. (2011). Carbonate cements in Miller field of the UK North Sea: a natural analog for mineral trapping in CO2 geological storage. Environ. Earth Sci, 62, 507–517. doi: 10.1007/s12665-010-0543-1
Lu, J., Wilkinson, M., Haszeldine, R. S., and Fallick, A. E. (2009). Long-term performance of a mudrock seal in natural CO2 storage. Geology 37, 35–38. doi: 10.1130/G25412A.1
Maast, T. E., Jahren, J., and Bjørlykke, K. (2011). Diagenetic controls on reservoir quality in middle to upper Jurassic sandstones in the south Viking Graben, north Seadiagenetic controls on reservoir quality in the south Viking Graben sandstones. AAPG Bull. 95, 1883–1905. doi: 10.1306/03071110122
Marchand, A., Haszeldine, R., Macaulay, C., Swennen, R., and Fallick, A. (2000). Quartz cementation inhibited by crestal oil charge: Miller deep water sandstone, UK north sea. Clay Minerals 35, 201–210. doi: 10.1180/000985500546585
Marcussen, Ø., Maast, T. E., Mondol, N. H., Jahren, J., and Bjørlykke, K. (2010). Changes in physical properties of a reservoir sandstone as a function of burial depth-the etive formation, northern north sea. Mar. Petrol. Geol. 27, 1725–1735. doi: 10.1016/j.marpetgeo.2009.11.007
Mavko, G., Mukerji, T., and Dvorkin, J. (2009). The Rock Physics Handbook: Tools for Seismic Analysis of Porous Media, 2nd Edn. Cambridge: Cambridge University Press. doi: 10.1017/CBO9780511626753
Mehmani, A., Milliken, K., and Prodanović, M. (2019). Predicting flow properties in diagenetically-altered media with multi-scale process-based modeling: a wilcox formation case study. Mar. Petrol. Geol. 100, 179–194. doi: 10.1016/j.marpetgeo.2018.09.001
Mehmani, A., and Prodanović, M. (2014). The effect of microporosity on transport properties in porous media. Adv. Water Resour. 63, 104–119. doi: 10.1016/j.advwatres.2013.10.009
Otsu, N. (1979). A threshold selection method from gray-level histograms. IEEE Trans. Syst. Man Cybernet. 9, 62–66. doi: 10.1109/TSMC.1979.4310076
Ridler, T., and Calvard, S. (1978). Picture thresholding using. IEEE Trans. Syst. Man Cybernet. 8, 630–632. doi: 10.1109/TSMC.1978.4310039
Rooksby, S. (1991). The miller field, blocks 16/7b, 16/8b, UK north sea. Geol. Soc. Lond. Memoirs 14, 159–164. doi: 10.1144/GSL.MEM.1991.014.01.20
Scherer, M. (1987a). Erratum to “parameters influencing porosity in sandstones: a model for sandstone porosity prediction. AAPG Bull. 71:1508. doi: 10.1306/94886ED9-1704-11D7-8645000102C1865D
Scherer, M. (1987b). Parameters influencing porosity in sandstones: a model for sandstone porosity prediction. AAPG Bull. 71, 485–491. doi: 10.1306/703C80FB-1707-11D7-8645000102C1865D
Schlüter, S., Sheppard, A., Brown, K., and Wildenschild, D. (2014). Image processing of multiphase images obtained via X-ray microtomography: a review. Water Resourc. Res. 50, 3615–3639. doi: 10.1002/2014WR015256
Soulaine, C., Gjetvaj, F., Garing, C., Roman, S., Russian, A., Gouze, P., et al. (2016). The impact of sub-resolution porosity of x-ray microtomography images on the permeability. Transport in Porous Media 113, 227–243. doi: 10.1007/s11242-016-0690-2
Thomson, P.-R., Aituar-zhakupova, A., and Hier-majumder, S. (2018). Image segmentation and analysis of pore network geometry in two natural sandstones. Front. Earth Sci. 6:58. doi: 10.3389/feart.2018.00058
Thomson, P.-R., Ellis, R., Chiarella, D., and Hier-Majumder, S. (2019). Brae Formation Grain Size Data. Royal Holloway; University of London [Dataset]. doi: 10.17637/rh.11312816.v1
Thomson, P.-R., Hazel, A., and Hier-Majumder, S. (2019). The influence of microporous cements on the pore network geometry of natural sedimentary rocks. Front. Earth Sci. 7:48. doi: 10.3389/feart.2019.00048
Thomson, P.-R., Jefferd, M., Clark, B., Chiarella, D., Mitchell, T., and Hier-Majumder, S. (2020). Pore network analysis of brae formation sandstone, North Sea. Marine Petrol. Geol.
Turner, C. C., and Allen, P. J. (1991). The central brae field, block 16/7a, UK north sea. Geol. Soc. Lond. Memoirs 14, 49–54. doi: 10.1144/GSL.MEM.1991.014.01.06
Visher, G. S. (1969). Grain size distributions and depositional processes. J. Sed. Res. 39, 1074–1106. doi: 10.1306/74D71D9D-2B21-11D7-8648000102C1865D
Wentworth, C. K. (1922). A scale of grade and class terms for clastic sediments. J. Geol. 30, 377–392. doi: 10.1086/622910
Wildenschild, D., and Sheppard, A. P. (2013). X-ray imaging and analysis techniques for quantifying pore-scale structure and processes in subsurface porous medium systems. Adv. Water Resour. 51, 217–246. doi: 10.1016/j.advwatres.2012.07.018
Wildenschild, D., Vaz, C., Rivers, M., Rikard, D., and Christensen, B. (2002). Using x-ray computed tomography in hydrology: systems, resolutions, and limitations. J. Hydrol. 267, 285–297. doi: 10.1016/S0022-1694(02)00157-9
Worden, R. (1998). Dolomite cement distribution in a sandstone from core and wireline data: the triassic fluvial chaunoy formation, Paris basin. Geol. Soc. Lond. Spcl. Publ. 136, 197–211. doi: 10.1144/GSL.SP.1998.136.01.17
Keywords: digital rock physics, 3D grain size, porosity, microporosity, cementation, Brae Formation sandstone, permeability, petrophysics
Citation: Thomson P-R, Ellis R, Chiarella D and Hier-Majumder S (2020) Microstructural Analysis From X-Ray CT Images of the Brae Formation Sandstone, North Sea. Front. Earth Sci. 8:246. doi: 10.3389/feart.2020.00246
Received: 15 January 2020; Accepted: 04 June 2020;
Published: 02 July 2020.
Edited by:
Alejandro Fernandez-Martinez, Centre National de la Recherche Scientifique (CNRS), FranceReviewed by:
Matthew Louis Whitaker, Stony Brook University, United StatesMartin Charles Wilding, Sheffield Hallam University, United Kingdom
Copyright © 2020 Thomson, Ellis, Chiarella and Hier-Majumder. This is an open-access article distributed under the terms of the Creative Commons Attribution License (CC BY). The use, distribution or reproduction in other forums is permitted, provided the original author(s) and the copyright owner(s) are credited and that the original publication in this journal is cited, in accordance with accepted academic practice. No use, distribution or reproduction is permitted which does not comply with these terms.
*Correspondence: Saswata Hier-Majumder, cHIudGhvbXNvbi4yMDEzQGdtYWlsLmNvbQ==; cGF1bC1yb3NzLnRob21zb24uMjAxNkByaHVsLmFjLnVr