 Simon Richards
94% of researchers rate our articles as excellent or good
Learn more about the work of our research integrity team to safeguard the quality of each article we publish.
Find out more
ORIGINAL RESEARCH article
Front. Earth Sci. , 18 May 2020
Sec. Structural Geology and Tectonics
Volume 8 - 2020 | https://doi.org/10.3389/feart.2020.00151
This article is part of the Research Topic Achievements and New Frontiers in Research Oriented to Earthquake Forecasting View all 28 articles
The trench-parallel distribution of aftershocks generated after a major subduction-related earthquake does not conform to a fractal or normal distribution as expected but does appear to be spatially constrained by fractures on the subducting oceanic crust. Newly developed and very detailed 3D models of subducting plates (slabs) are combined with high-resolution topographic and bathymetric models of the crustal upper-plate and subducting lower-plate respectively to show how irregularities such as transform faults, spreading centers, fossil subduction zones and vertical tears form structural barriers to the spatial distribution of subduction zone aftershocks. When correctly constructed, slab models can now be used to better forecast the lateral (along-arc) extent of damaging aftershock swarms following large magnitude subduction-related earthquakes. Two earthquakes, [magnitude MW 7.8 in Vanuatu, 7th October 2009 (UTC) and magnitude MW 8.8 in southern Chile, 27th February 2010 (UTC)] were followed by hundreds of aftershocks, with many recording magnitudes over MW 6.5. Closer examination of these aftershocks and their spatial distribution indicate that they were unexpectedly confined to discrete sections of the subducting plate. It is revealed here that lithospheric-scale structures including fossil oceanic transform faults represent crustal and lithosphere-scale fractures in the crust that terminates the lateral spread of aftershocks. This contrasts with the predicted decrease in aftershock size and number with increasing distance from the epicenter referred to as the Omori (power law) distribution. This hypothesis addresses the paradigm that oceanic crust is a single, semi-continuous and uniform section of crust where the lateral distribution of earthquakes is described in terms of uniform rock mechanics. Additional research on the MW 9.0 earthquake in Japan [11th March 2011 (UTC)] and the MW 8.0 earthquake in the eastern Solomon Islands [6th February 2013 (UTC)] supports the aforementioned hypothesis. Using new techniques to help define the location of sub-plate boundaries, it is now possible to generate aftershock probability maps for some of the most seismically active subduction margins around the world.
The impact of a large magnitude earthquakes (MW > 7.0) and associated aftershocks can be devastating, for example, the 2011 Japan earthquake and Tsunami (Norio et al., 2011) or the Mw 7.0 earthquake in Haiti, 2010 (Hayes et al., 2010; Shan et al., 2011 and references therein]. Large earthquakes are always associated with a swarm of aftershocks with individual events attaining magnitudes almost as large as that of the original event and often over MW 6.5. In many cases, these aftershocks can be just as damaging as the primary event (Thorvald, 1997; Spencer et al., 2004). The spatial distribution of aftershocks around a single event means that areas often located hundreds of kilometers from the principal earthquake may be affected and the aftershocks may persist for over a month after the initial event. If the spatial extent of these aftershocks can be more accurately constrained and defined, then accurate forecasting and advanced warning systems can also be developed. This paper presents detailed evidence from two locations where large earthquakes have recently occurred: in the northern New Hebrides Trench near Vanuatu and near the city of Concepción in Southern Chile. The Vanuatu area was initially selected due to the abundance of structural and tectonic information in the area. In order to investigate the hypothesis at a global-scale, these two earthquakes are compared with four other historical earthquakes; (1) a magnitude MW 8.3 earthquake in the Kuril Islands in November of 2006, (2) a magnitude MW 8.0 earthquake in the western Aleutians in May of 1986, (3) the more recent Mw 9.0 earthquake in Japan [11th March 2011 (UTC)] and finally, (4) a Mw 8.0 earthquake in the eastern Solomon Islands [6th February 2008 (UTC)]. The earthquakes have been selected from subduction zones around the world in order to test the hypothesis in different subduction systems.
The following assessment of several large (Mw > 7.0), subduction-related earthquakes builds on existing evidence that the presence of geological irregularities such as seamounts or other bathymetric highs on the subducting plate typically focus the trigger point of a major subduction-related earthquake (Kelleher and McCann, 1976; Nishizawa et al., 2009; Das and Watts, 2009; Watts et al., 2010). Resent research by Sparkes et al. (2010) has shown that the northern limit of rupture propagation after the Mw 8.8 earthquake on the west coast of Chile (Maule, February, 2010) was terminated by the presence of the Juan Fernandez Ridge which is a bathymetric high on the subducting Nazca Oceanic Plate. Accordingly, bathymetric anomalies such as bathymetric highs appear to stop the lateral rupture propagation of aftershocks because they are areas where discernible changes in the strength, thickness and temperature of the subducting crust exist. Here evidence is presented to demonstrate that the lateral boundaries of the domain of rupture and subsequent aftershocks is not confined by bathymetric highs but appear to be very well-constrained to within major fracture zones in the subducting oceanic crust.
Transform faults are laterally extensive, vertical fractures that develop at oceanic spreading center and propagate from the surface of the crust to the base of the lithosphere (e.g., Abercrombie and Ekström, 2001). The fractures initially form at oceanic spreading centers (Wilson, 1965); however, due to divergent plate motion, these faults and the sections of oceanic crust that they separate essentially migrate away (perpendicular) from the spreading center. At the point where the oceanic crust moves beyond the limits of the spreading, the two adjacent sections of oceanic crust continue to migrate laterally but at the same velocity which in turn causes the fault to become mostly inactive and likely only accommodate very small amounts of displacement. At this point, the adjacent sections of oceanic crust are considered semi-coupled and seismicity is dramatically reduced. Another significant feature of these oceanic fractures is the high proportion of serpentinized crust that they may contain relative to adjacent oceanic crust (Rona et al., 1987) thereby making them mechanically very different to the adjacent oceanic crust (e.g., Lowrie et al., 1986; Behn et al., 2002; Kuna et al., 2019).
Both the oceanic crust and the fractures that they develop at the spreading center are subducted at convergent plate boundaries. Subduction zones exhibit complex geometries, variable plate convergent directions and most are arc-like in shape. In order to accommodate the subduction of generally flat oceanic crust into irregularly shaped subduction zones, the subducting plate must deform (e.g., Schellart and Lister, 2004). Recent mapping of subducting slabs in three dimensions has demonstrated that this deformation is accommodated by large- and small-scale displacements along existing zones of weakness such as oceanic fracture zones that, in some instances are interpreted to have developed into vertical tears of the subducting plate (Pesce, 1996; Burkett and Billen, 2010; Richards and Holm, 2013). Other features that can also sub-divide the oceanic crust into smaller segments may include fossil plate boundaries including subduction zones, spreading centers or strike-slip plate boundaries (Burkett and Billen, 2010). Regardless, these features all represent regions where the plate exhibits an existing break that extends from the surface to the base of the lithosphere.
In an attempt to better resolve how structures on the seafloor influence subduction zone morphologies and the distribution of earthquake aftershocks, a method of accurately defining the slab geometry has been developed. The methods and some results of this work are published in Richards et al. (2007). The same techniques have been used to construct accurate models of slab geometries presented in this paper. In subduction zone settings, earthquakes primarily occur at or near to the interface between the overriding and subducting plate but also within the subducting slab; this is the Wadati-Benioff zone. A 3-dimensional map of the slab can be developed by accurately mapping out the limits of the seismogenic zone (Richards et al., 2007). Variations in the dip and the strike of the Wadati-Benioff zone reflect variations in the geometry of the subducting plate. Results so far show that subducting slabs are not smooth sheets as often depicted, rather they are highly irregular, folded and often exhibit vertical and horizontal tears. Like folds and faults preserved in crustal rocks exposed at the Earth’s surface, these variations in slab geometry reflect processes such as changes in the rate or angle of subduction, changes in the shape of the trench or even the arrival of buoyant oceanic or continental crust or, most importantly, the subduction of oceanic fracture zones (Richards et al., 2007; Billen, 2008).
The hypothesis presented here is that subducted oceanic crust is divided into sub-plates and that these boundaries (i.e., oceanic fractures) limit the distribution of aftershocks; this can be demonstrated for the magnitude MW 7.8 earthquake in the central part of the northern New Hebrides Trench in October of 2009 (Figure 1; Cleveland et al., 2014). Oceanic crust entering the trench is extremely irregular and characterized by major structures including the West Torres Plateau and the South Renell Trough. The crust and associated subducted plate is segmented into two discrete sections, a northern and southern section separated by two prominent vertical tears (Figure 2). The principal vertical tear separating the two sections is the extinct New Caledonia Fracture Zone (NCFZ) or also referred to as the d’Entrecasteaux Ridge which is a strike-slip fault that formed the northern margin to the 48–25 Ma old New Caledonian arc (Schellart et al., 2002). The NE-trending fracture system is an ancient strike-slip plate margin that formed in response to NE-directed subduction of the Australian plate (Figure 1) below the New Caledonian Arc (Schellart, 2007). The southern limit to the southernmost slab section is the Hunter Fracture Zone. This is a curvi-planar ENE-trending left-lateral fault and series of connected spreading centers that formed during asymmetric rollback of the New Hebrides Trench (Schellart et al., 2002). Like the NCFZ, this fracture also extends to the base of the lithosphere. The second of the two slab sections is bound to the north by the Renell Trough (also spelled Rennell) and to the south by the subducted NCFZ. The geometry of the subducted slab is shown in detail to a depth of 500 km in Figure 2.
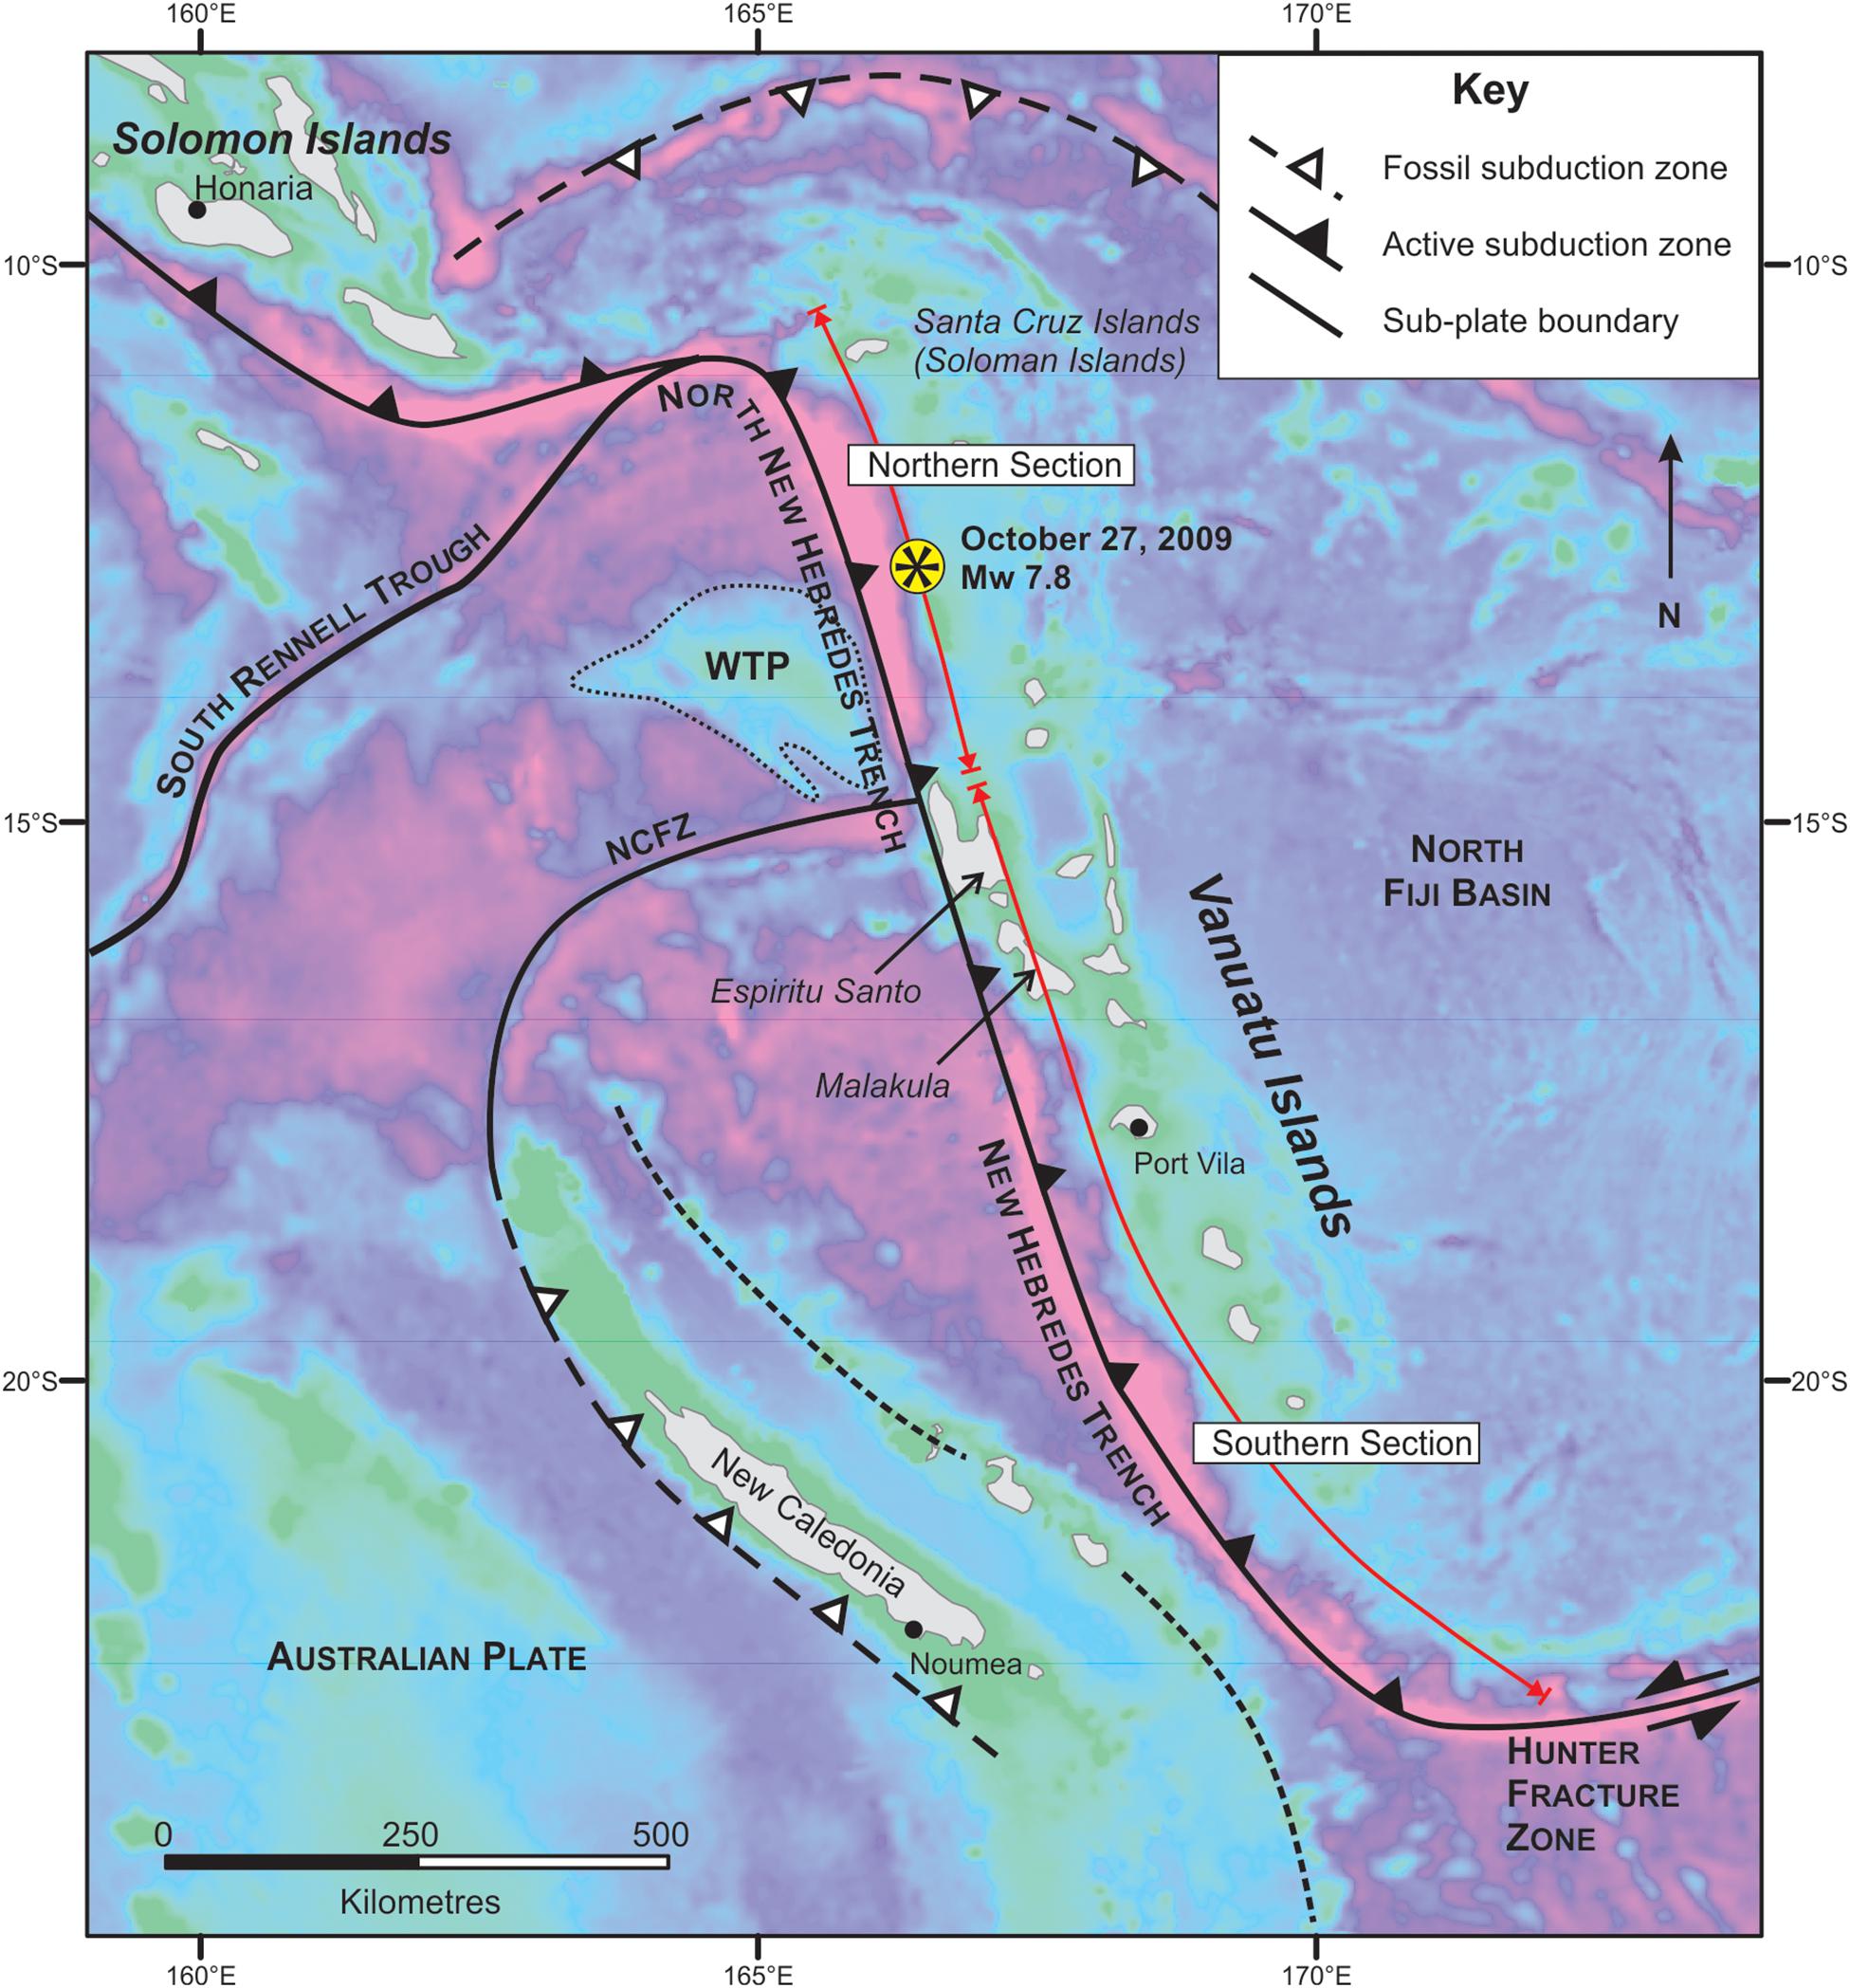
Figure 1. Map of the southeastern Solomon Islands and the Vanuatu Arc showing the major tectonic features of the region as well as the location of the magnitude 7.8 earthquake in 2009. The subduction margin is divided into northern and southern sections by the major structures; the South Renell Trough and the New Hebrides Trench.
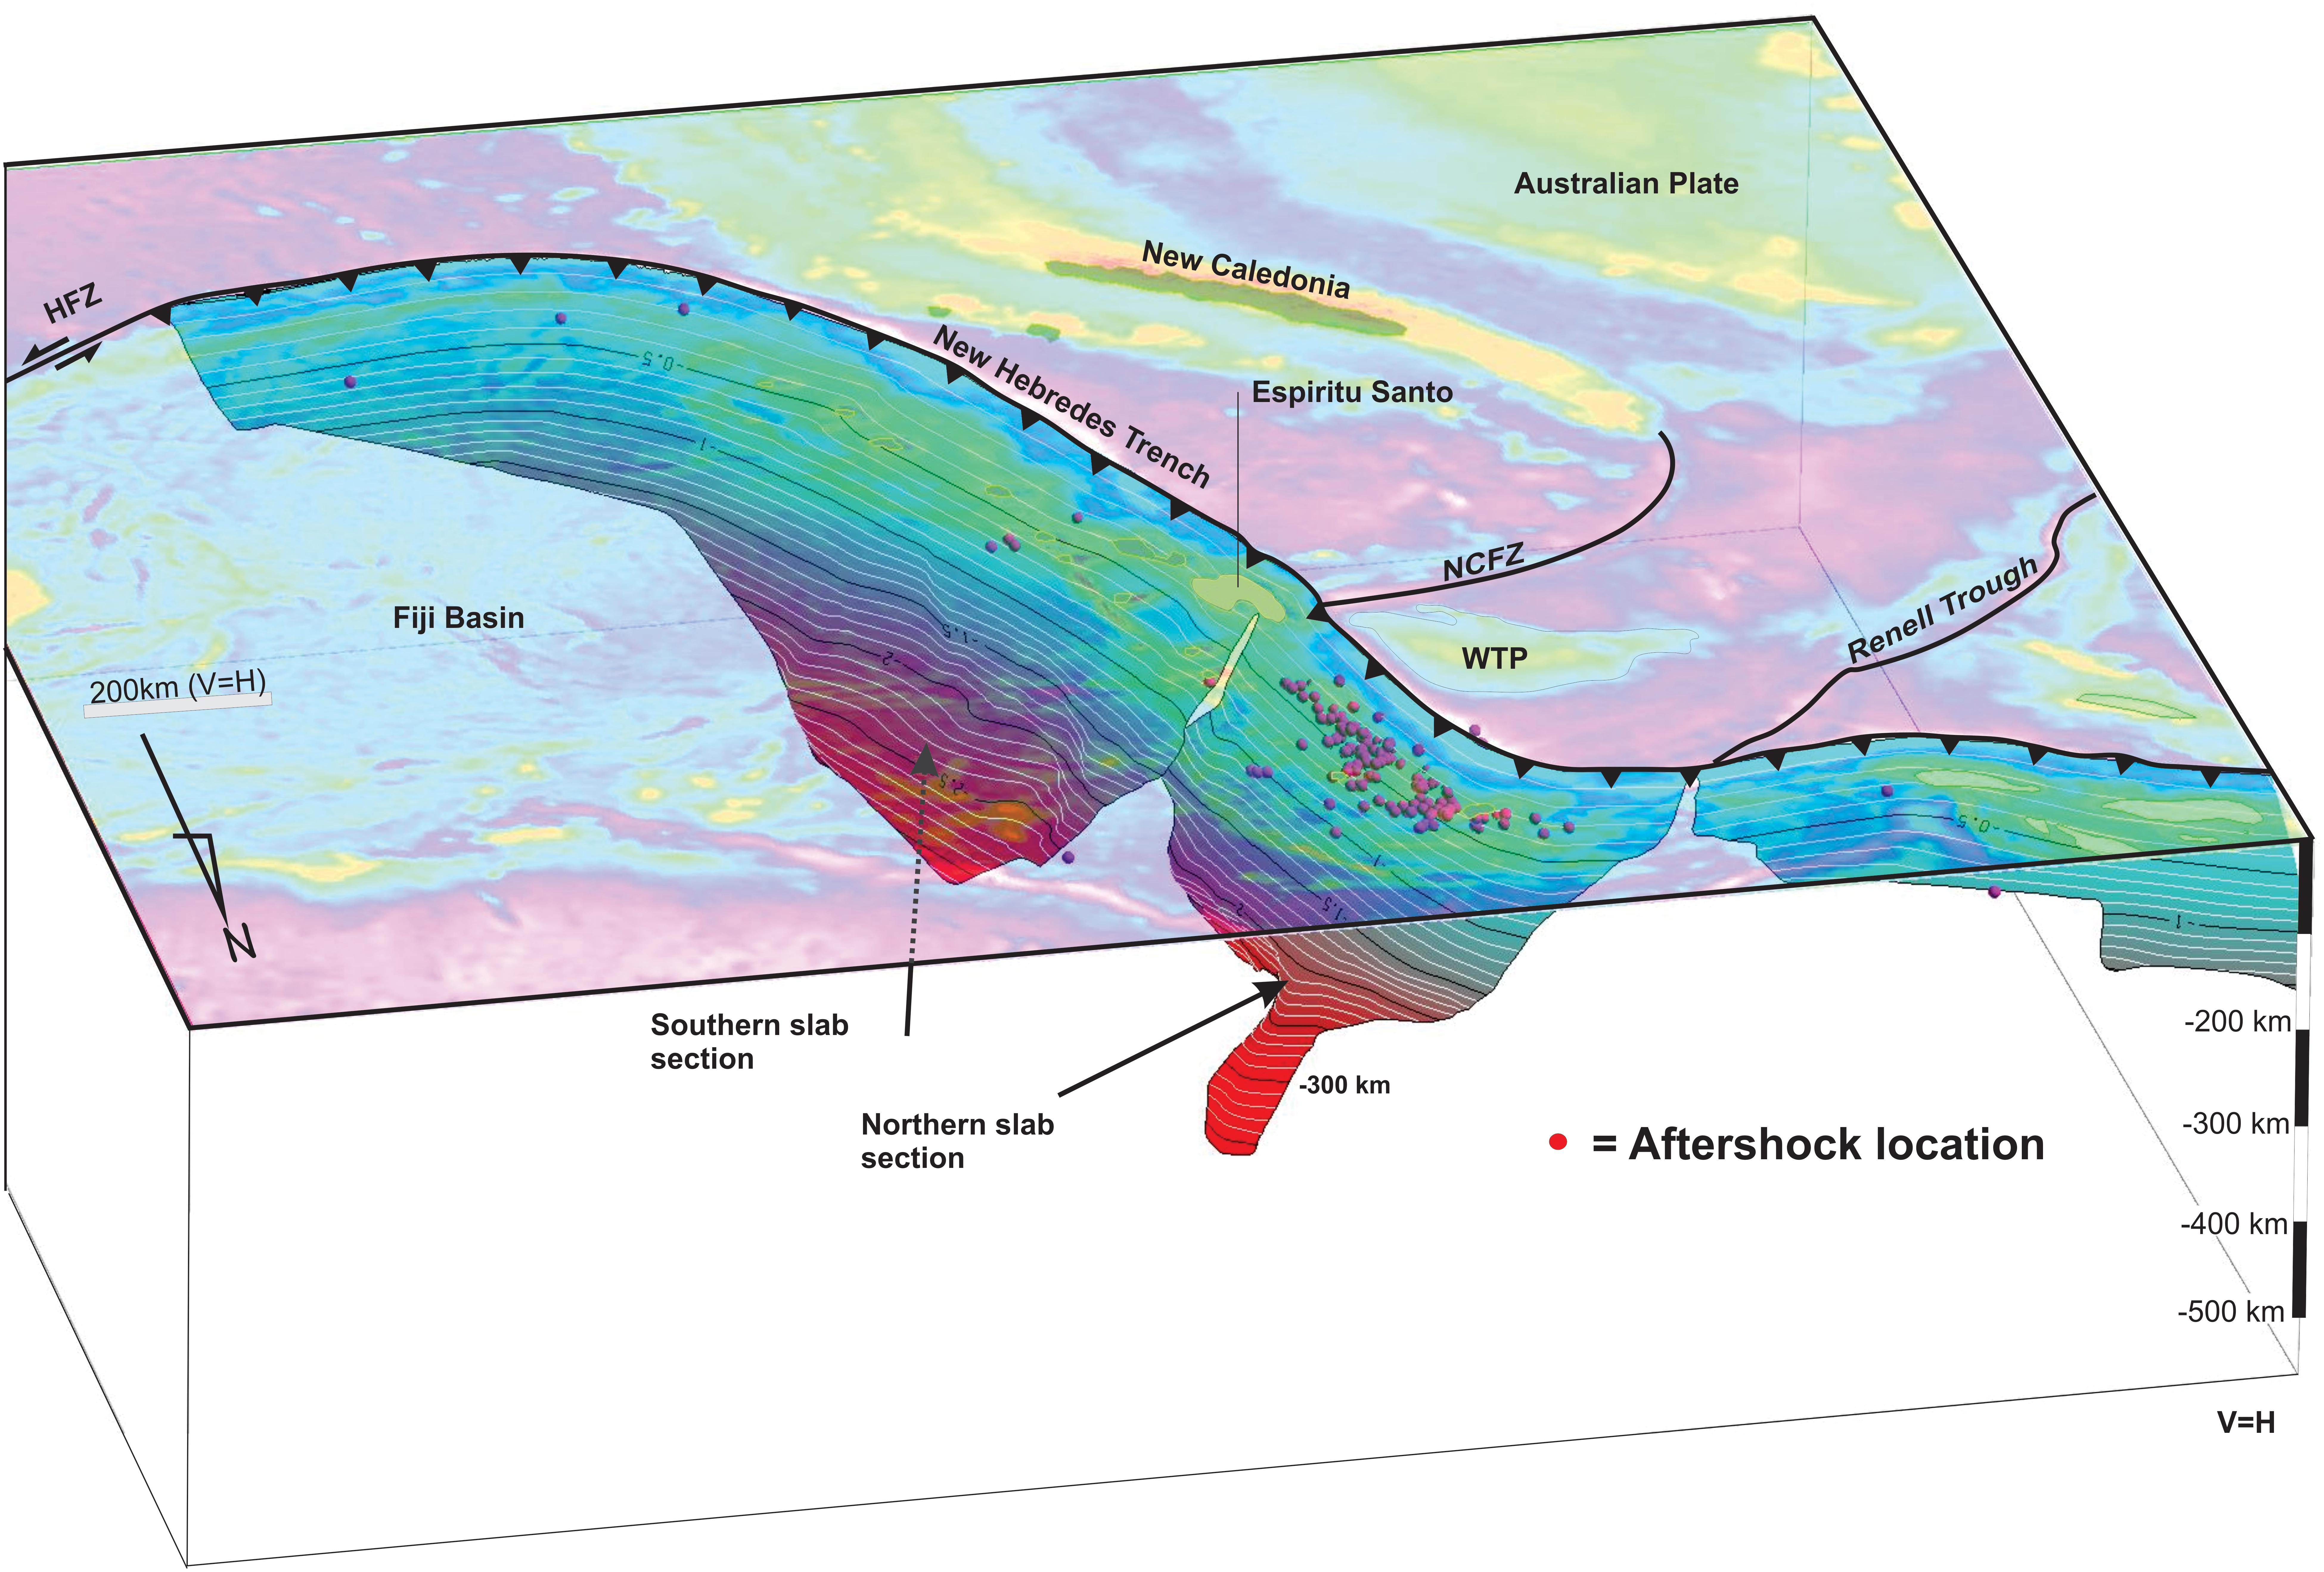
Figure 2. Oblique view of the subducting Vanuatu Slab and adjacent seafloor viewed looking to the South East. Shown here is a 3D map of the subducted plate highlighting the shape of the slab but also the location of the sub-plate and respective slab boundaries as the two major slab tears located down-dip from the New Caledonia Fault Zone (NCFZ) and the Renell Trough. Aftershock seismicity is represented by the cluster of red spheres and is spatially limited to within the northern section of the subducting plate. The slab is shaded cyan to red to represent increasing depth of the subducted plate. HFZ, Hunter Fracture Zone.
The magnitude MW 7.8 earthquake on the 7th of October 2009 occurred approximately midway between the NCFZ and the Renell Trough where the oceanic crust entering the northern New Hebrides Trench is characterized by the prominent West Torres Plateau (Figure 1). The top of the plateau rises over 1,000 m above the adjacent seafloor and is impeding subduction there. This impeded subduction combined with the northeast-directed motion of the Australian plate is a likely trigger for the magnitude MW 7.8 earthquake in 2009 and the three subsequent magnitude MW 7 earthquakes in the same region. Seamounts and uncharacteristic seafloor structures have been shown in many studies, including Bilek et al. (2003), to act as a point of rupture in subduction zone earthquakes. Some 263 aftershocks (NEIC earthquake catalog MW > 4) occurred within the 30 days after the first rupture in late October and all earthquakes are located within the interpreted upper and lower boundaries of the subducting plate. Aftershocks, however, continued for weeks after the main event and were limited in their southern extent by the Wharton Fossil Ridge, a major fracture in the subducting Indo-Australian plate. In the Vanuatu region, the swarm of aftershocks was confined to a well-defined zone that was limited to the north by the Renell Trough, a fossil spreading center (Larue et al., 1977), and to the south by the NCFZ (Figures 2, 5B). Evidence presented here suggests that the two major lithospheric-scale fractures inherited by the subducting slab limited the lateral distribution of the aftershocks. In all cases presented, there are likely to be earthquakes that occur outside these zones as a result of dynamically triggered events away from the rupture zone (Figure 5), nevertheless, the bulk of the seismicity remains confined to domains that are limited in lateral extent by the presence of major structures on the subducting slab. Finally, some earthquakes may be triggered further from the rupture by processes such as viscoelastic relaxation but demonstrating whether or not such earthquakes are related to the initial rupture or part of a new event is difficult to demonstrate, especially in dynamic subduction zone settings. Furthermore, many of the earthquakes (aftershocks) occur in the upper plate and may be the result of rupture triggered by seismicity in the underlying lower plate. Many variables do exist, however, the possibility that structures on the seafloor represent physical barriers to the lateral migration of aftershocks must be explored.
The same structural controls can be demonstrated for major earthquakes along the subduction margin of central and southern Chile. Here, the Nazca Slab is subducting to the ENE below the overriding South American continent (Figure 3). The Nazca oceanic plate is not unusual in that it contains a number of key geomorphologic and geological features that, after subduction, may form the nucleation point for the development of vertical tears. Major structures on the seafloor are illustrated in Figure 3 and include the Valdiva and Mocha Fracture Zones, the Challenger Fracture Zone and the Juan Fernandez volcanic chain. Whether or not such features develop into tears after entering the mantle is dependant on the conditions operating at each location, nevertheless, these features do represent major structural breaks in the subducting plate. The research presented here focuses on the section of southern Chile in the vicinity of Bao Bao and Concepción approximately mid-way between the Challenger Fracture zone to the north and the Valdiva and Mocha Fracture Zones to the south. The magnitude MW 8.8 earthquake occurred on the 27th of February in 2010 and was associated with over 1,370 aftershocks in the month following the main rupture with some of these aftershocks reaching magnitudes greater than MW 6.5. The aftershocks were almost exclusively constrained to a section of the subducting plate between two major lithospheric-scale fracture systems.
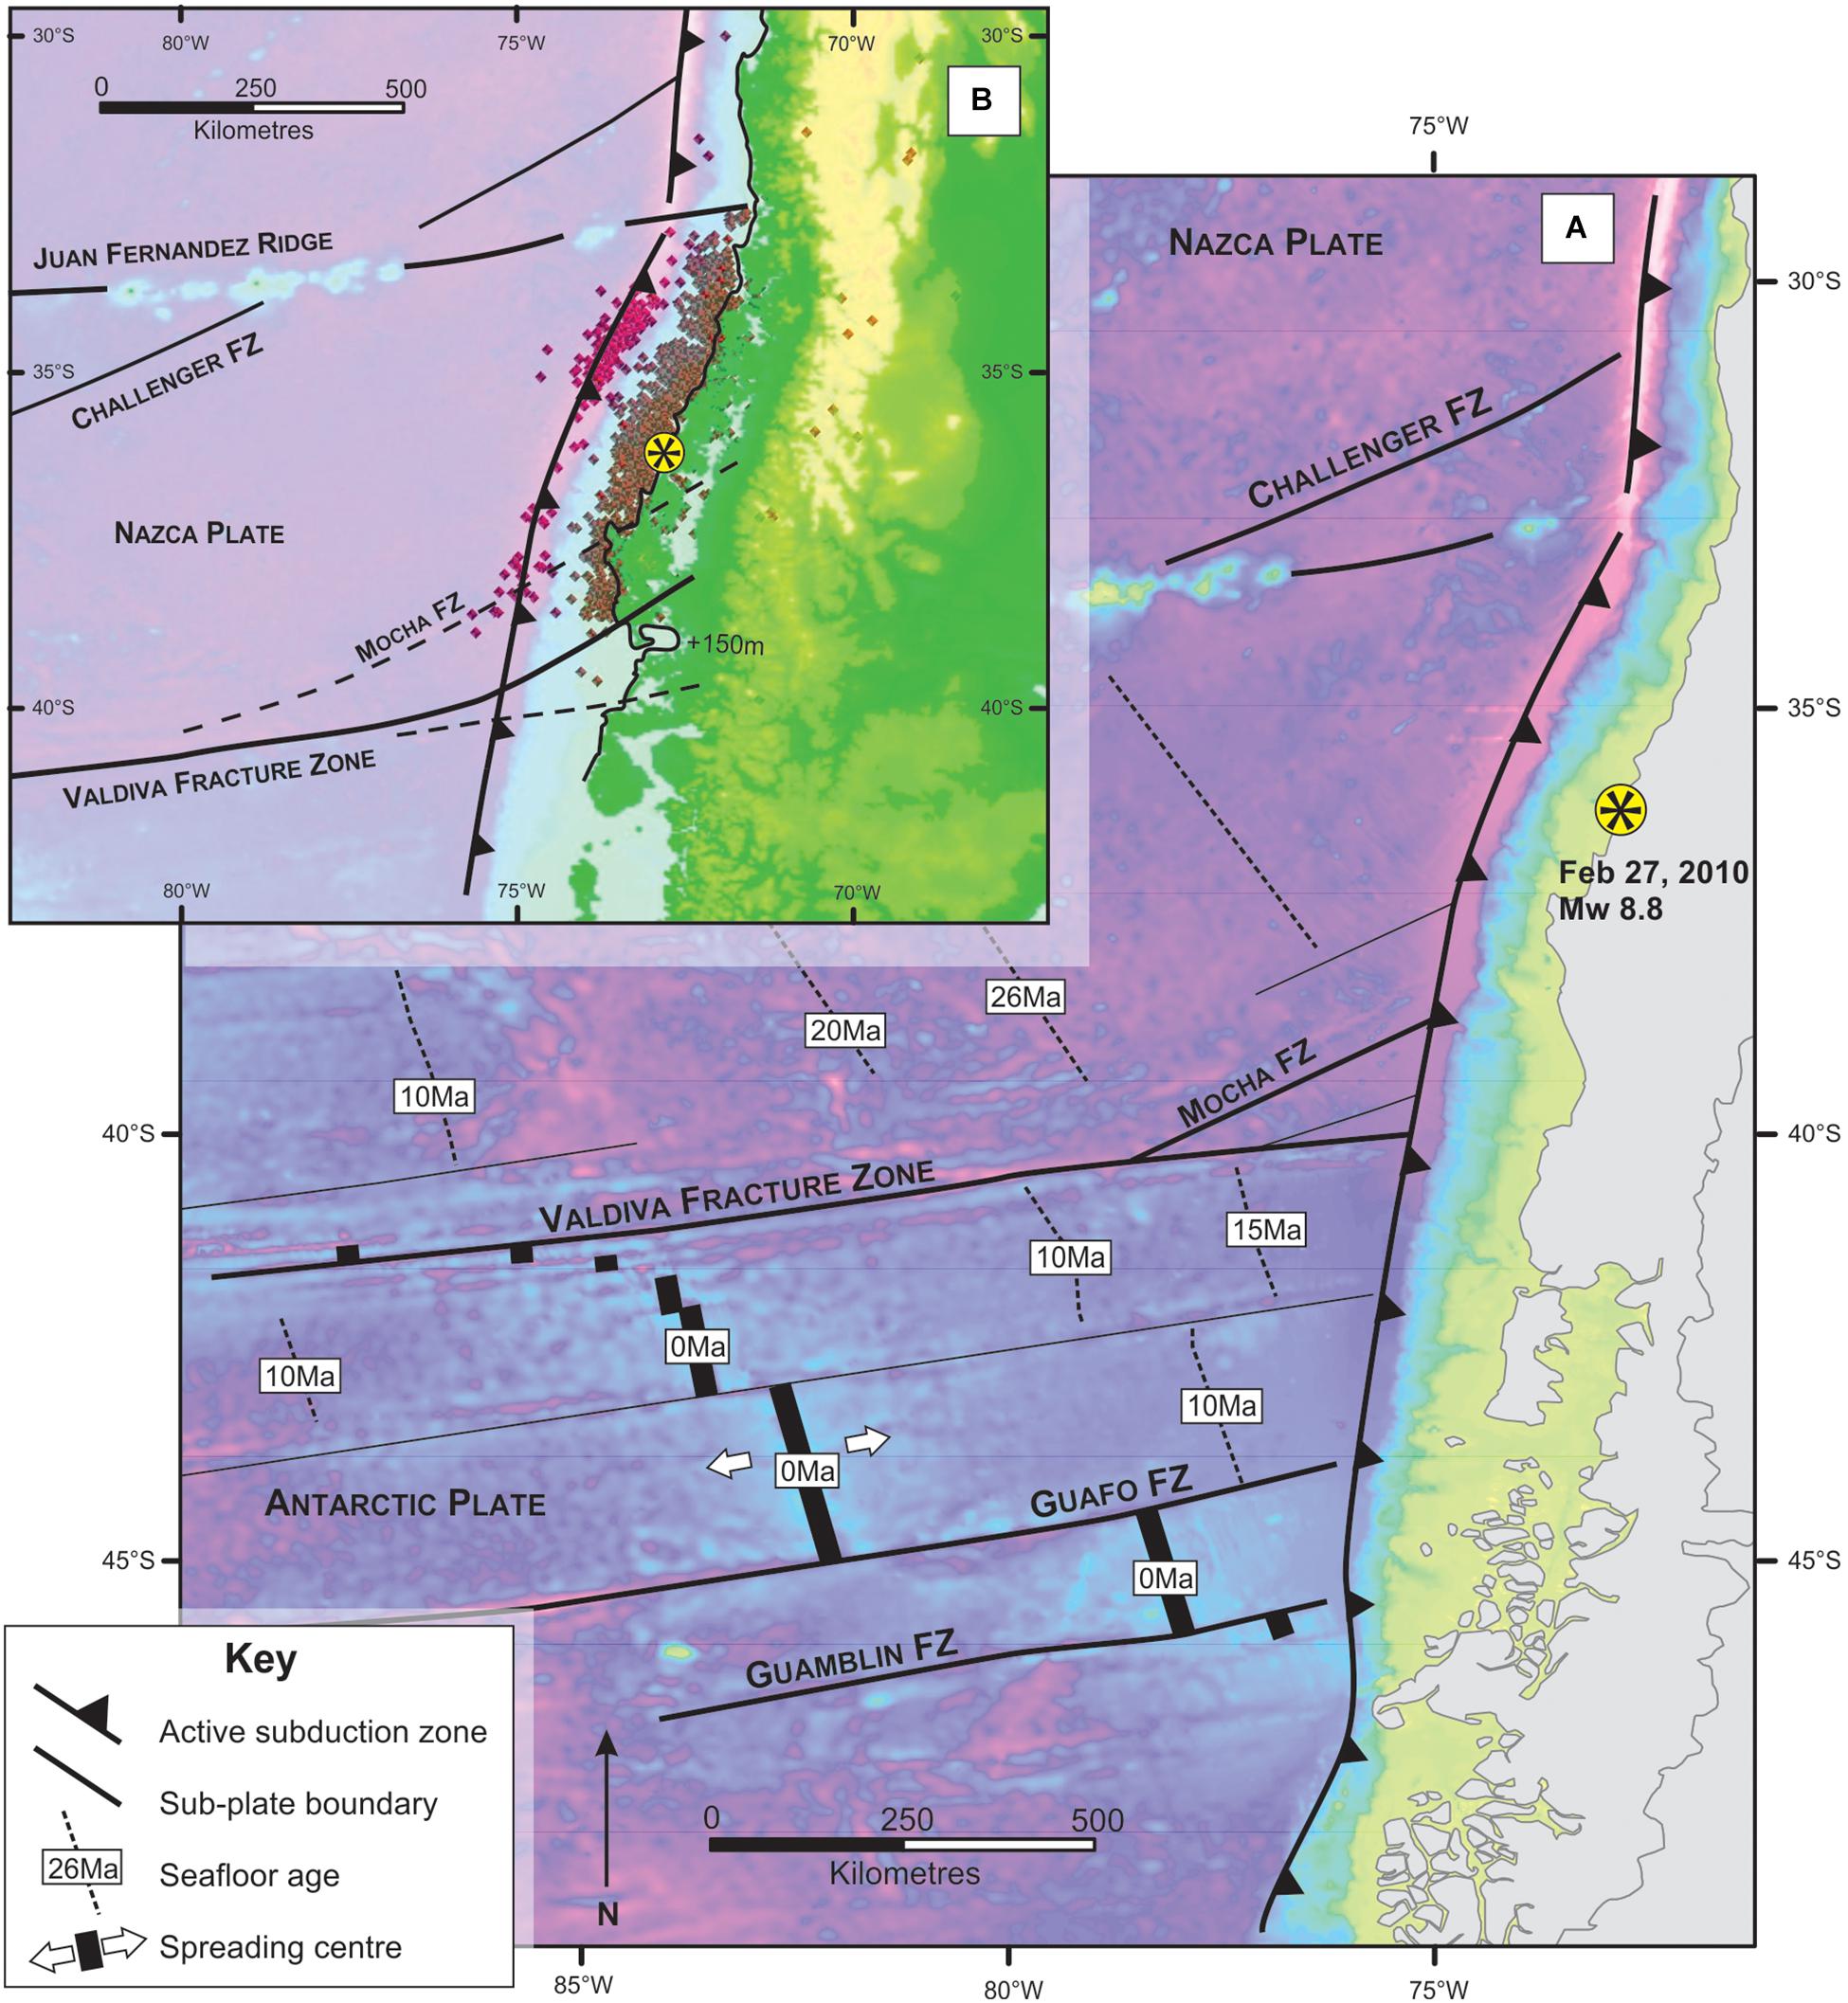
Figure 3. (A) Map of southern Chile and the adjacent seafloor showing major structures including fault zones, spreading centers, the Juan Fernendez Ridge and associated lithospheric boundary and the Valdiva Fracture Zone. The location of the magnitude 8.8 earthquake in 2010 is also shown relative to geological and topographic features including aftershock distribution (B). The southern limit of the aftershocks also corresponds with a dramatic change in the topography of the South American Continent as shown by the 150 m contour.
The spatial distribution of aftershocks following the magnitude MW 8.8 earthquake is limited to the north and south by two major fractures that are evident in bathymetric data. The two structural features on the Nazca Plate are the Juan Fernandez Ridge to the north and the Valdiva and Mocha fracture zones to the south. The latter two structures represent transform faults formed at the Nazca Ridge (Figure 3). The subducted Mocha fracture zone is also interpreted to be a vertical tear in the subducted Nazca Plate (Pesce, 1996). These two transforms divide the Nazca Plate into multiple sub-plates. The Juan Fernandez Ridge trends approximately east-west and enters the subduction zone near Santiago at 32° south (Figure 3). To the north of this ridge, the subducting slab is undergoing relatively shallow slab subduction but to the south, the oceanic crust is characterized by very few buoyant structures so the dip of the slab is ∼45°.
To the north of the Juan Fernandez Ridge, for example, the Nazca slab exhibits a shallow angle of subduction. On the southern side of the ridge, the slab is dipping moderately at 45–50 degrees. A vertical zone of displacement or a developing vertical slab tear accommodates this change in slab dip. Thus, although the Juan Fernandez island chain is not specifically a transform fracture, its presence imposes a dramatic change in the slab structure, which in turn acts to develop the types of structures necessary for the termination of aftershock migration. Further south, the Nazca oceanic plate is characterized by the Valdiva Fracture Zone (VFZ) and the associated, but NE-trending Mocha Fracture Zone (MFZ) (Figure 3). The MFZ and VFZ separate older oceanic plate to the north from the younger oceanic plate to the south. The fracture offsets crust that differs in age by ∼12–15 million years (Figure 3). The fracture also separates colder, older and less buoyant oceanic crust to the north from the younger, hotter and more buoyant crust on the southern side of the VFZ. The Bao Bao/Concepción earthquake (Maule, Chile, February 2010 Mw 8.8; Pulido et al., 2010) occurred ~400 km north of the VFZ and some 350 km south of the Juan Fernandez island chain (Figure 3). Over 1,300 aftershocks were tightly constrained to within these two fracture zones (Figure 3). As shown for Vanuatu, these major crustal and lithospheric fracture zones, which separate and decouple adjacent sub-plates, appear to limit to the lateral distribution of aftershock seismicity at shallow levels (<100 km) in active subduction zone systems.
Recent seismicity in Japan also demonstrates the structural control on aftershock distribution. The magnitude 9.0 (MW) earthquake (11th March 2011 32 km depth) occurred in the upper crustal plate above the west-dipping subducted Pacific oceanic crust (e.g., Zhao et al., 2011; Huang and Zhao, 2013). The initial Mw 9.0 earthquake occurred at a depth of only 32 km, which should imply that structures exhibited by the seafloor have little influence on the distribution of aftershocks in the upper plate. However, a plot of aftershocks between 11th and 21st of March reveal a well-constrained distribution. The southern limit of the earthquakes is bound by the location of the Kashima South fracture zone on the Pacific Plate. The southeastern limit of aftershocks is the NE-trending chain of seamounts including Daiyon-Kashima, Basei, Futaba and Iwaki Seamounts, which supports the interpretations of Sparkes et al. (2010). The northern limit of aftershocks terminates abruptly, however, the seafloor the specific limiting the northern extent of the aftershocks is less defined. The orientation or strike of the northern limit (Figure 4) is exactly parallel to the direction of motion of the Pacific plate implying some structural control. Furthermore, the location of the northern boundary is coincident with the change in orientation of crustal structures between Hokkaido in the north and Honshu in the south. The limit of seismicity is also parallel to the geographic ridge and NW-trending line of volcanoes that includes the famous Mt Komaga-Dake and Mt Yokotsu-Dake which suggests a possible link between the limit of seismicity and a major crustal- to lithosphere-scale fracture there. As in the south, earthquakes here are distributed between the upper and lower plates so it is interpreted that the structure is likely to be an upper plate crustal structure developed as a consequence of NW-directed subduction of the Pacific plate. Further work on this area is required before conclusions on the aftershock distribution can be made.
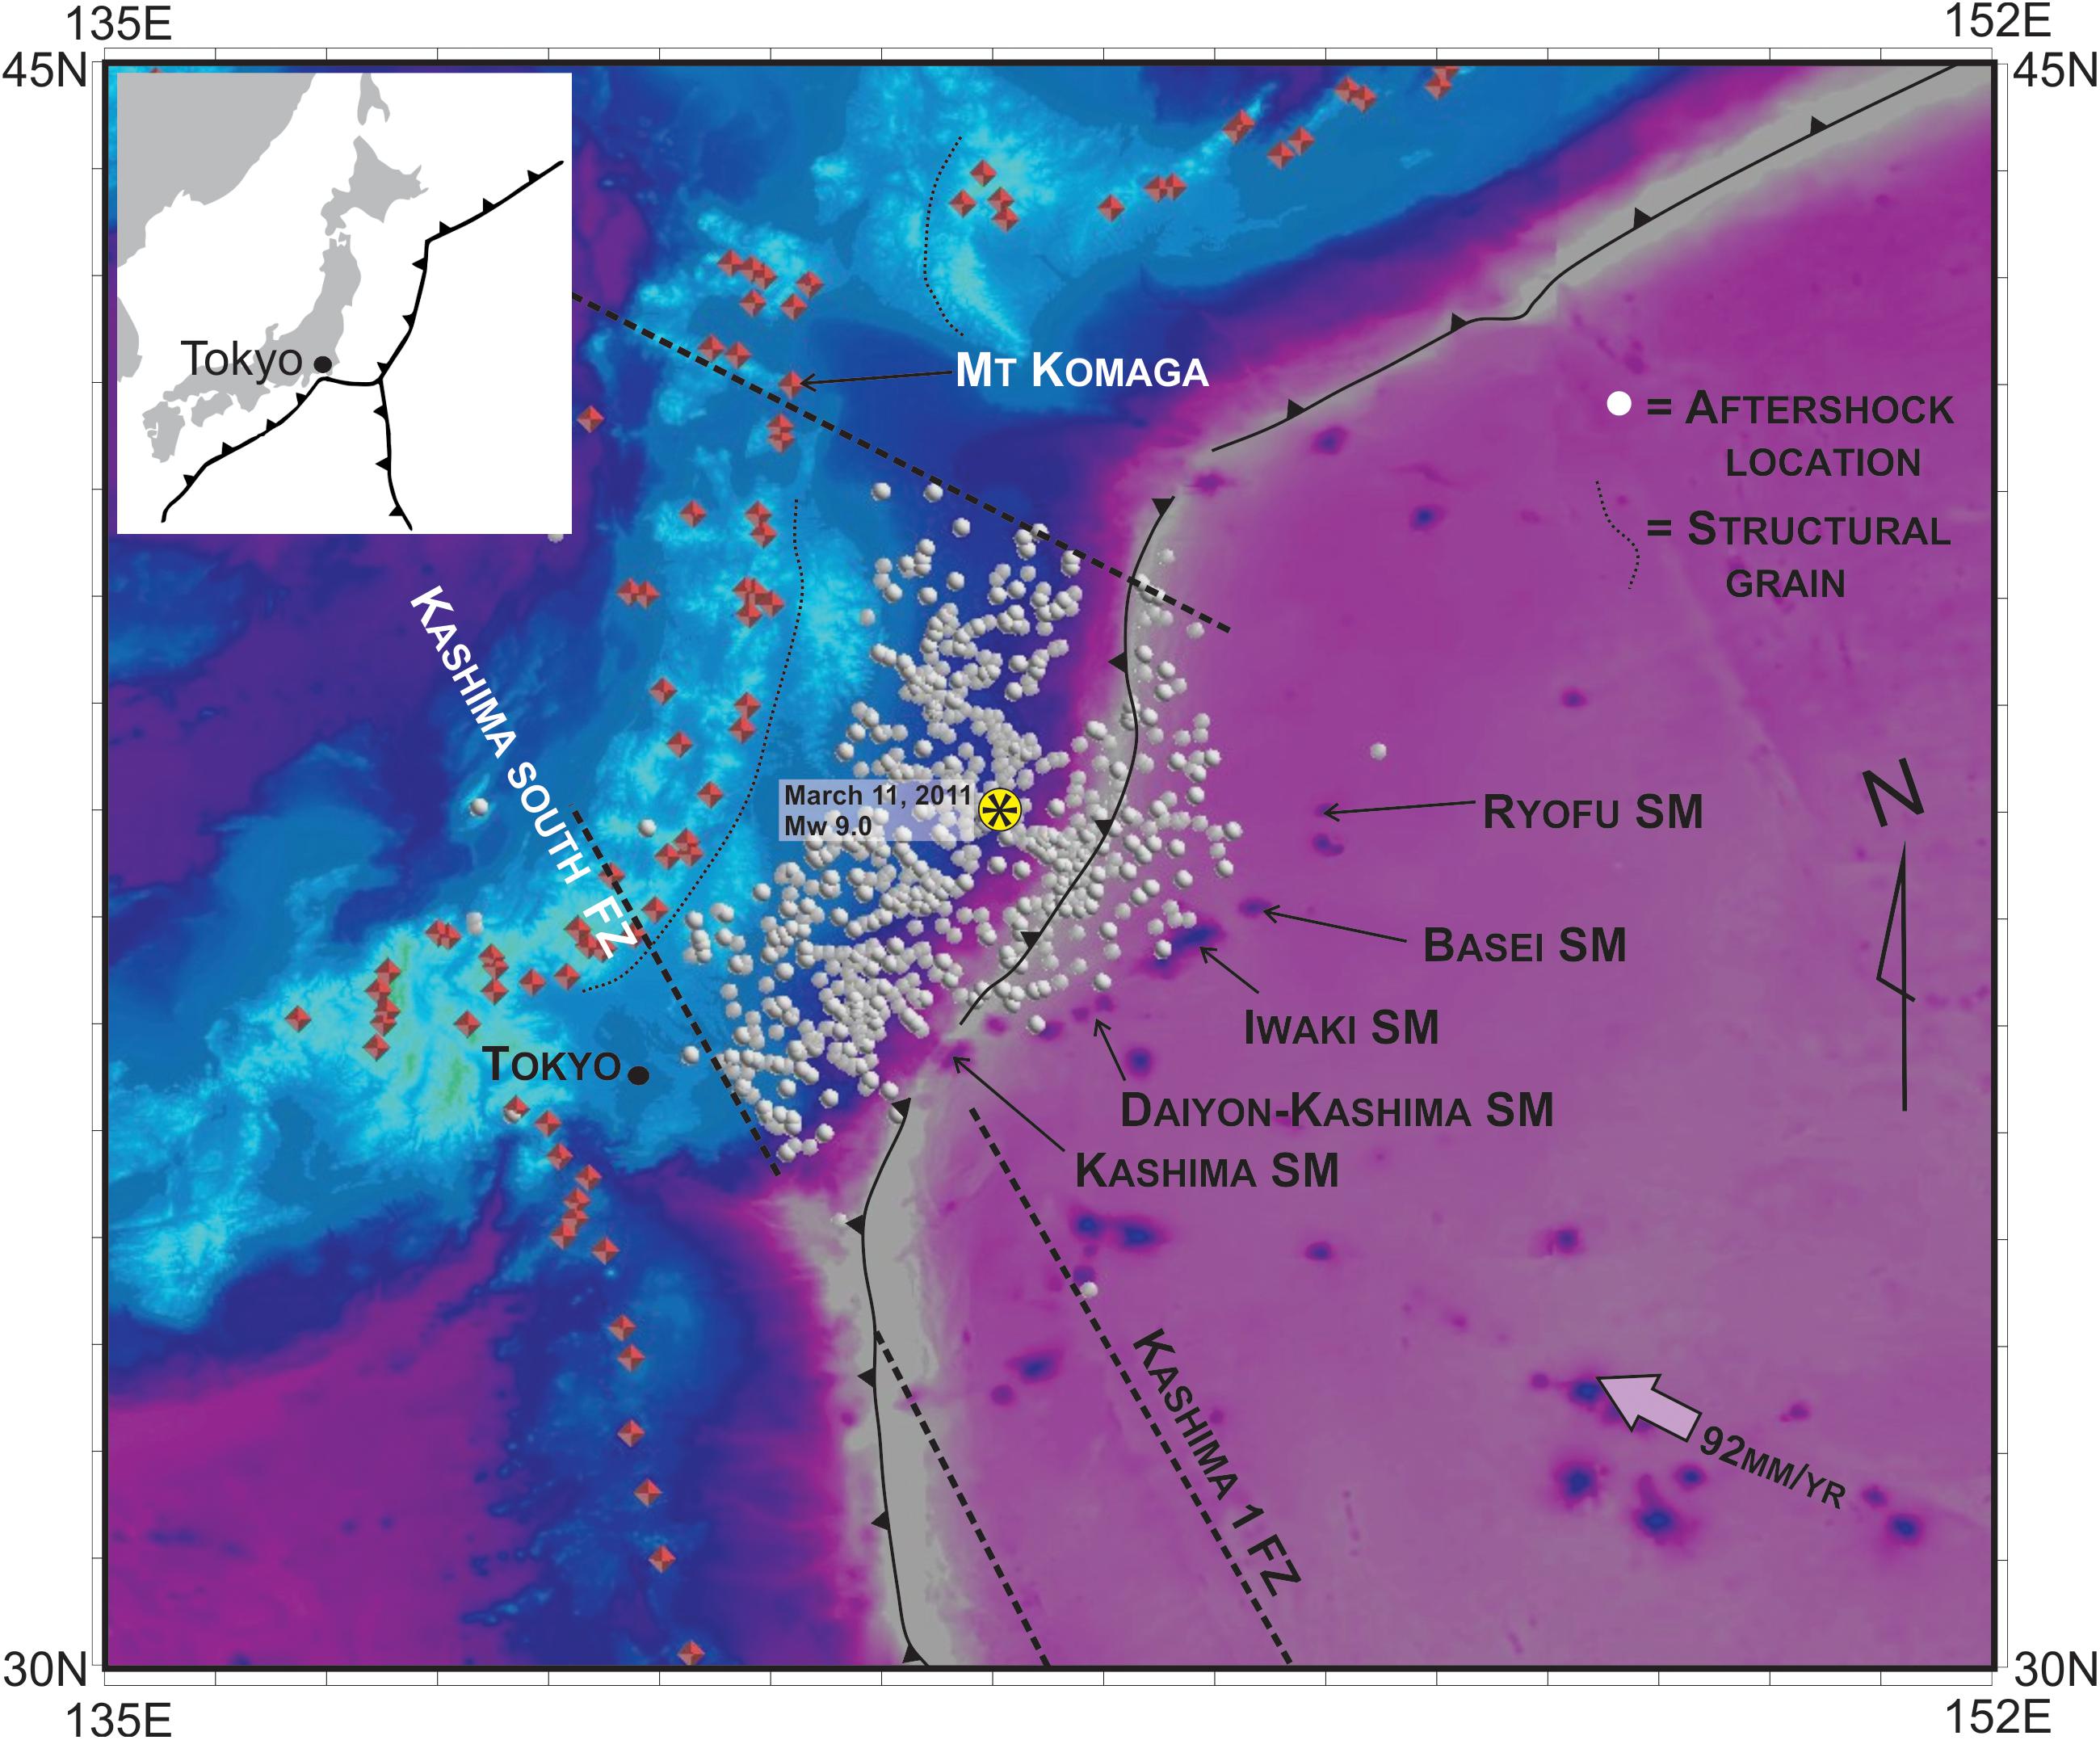
Figure 4. Map showing the distribution of aftershocks following the Mw 9.0 earthquake in Japan on March 11, 2011. Aftershocks are shown as small white spheres superimposed onto a composite topographic and bathymetric map of the region surrounding the earthquake epicenter. The distribution of aftershocks is structurally controlled and does not gradually decrease in number and intensity with increasing distance from the principal Mw 9.0 epicenter. The eastern limit of aftershocks is controlled by the location of the Ryofu-Kashima seamount chain. Red points to the west of the earthquakes are volcanoes in the Japan Island arc chan.
The hypothesis was also tested for the magnitude MW 8.3 earthquake in the Kuril Islands (15th of November, 2006; Lay et al., 2009). There, the seafloor is characterized by several oceanic structures, but the major earthquake occurred between the Onekotan Fracture zone to the North and the Bussol Fracture Zone to the south. The plot of distance vs. magnitude in Figure 5C shows that the primary MW 8.3 earthquake occurred closer to the Bussol Fracture, however, of the 960 aftershocks that occurred for the 30 days after the main event, almost all were limited to within these two fractures. Similarly, for the magnitude MW 8.0 earthquake in the western Aleutians on the 7th of May in 1986 (Hwang and Kanamori, 1986), only four of the 285 aftershocks occurred outside the limits of the two major bounding structures, the Amlia Fault Zone to the east and the Adak Fracture Zone to the west (Figure 5D).
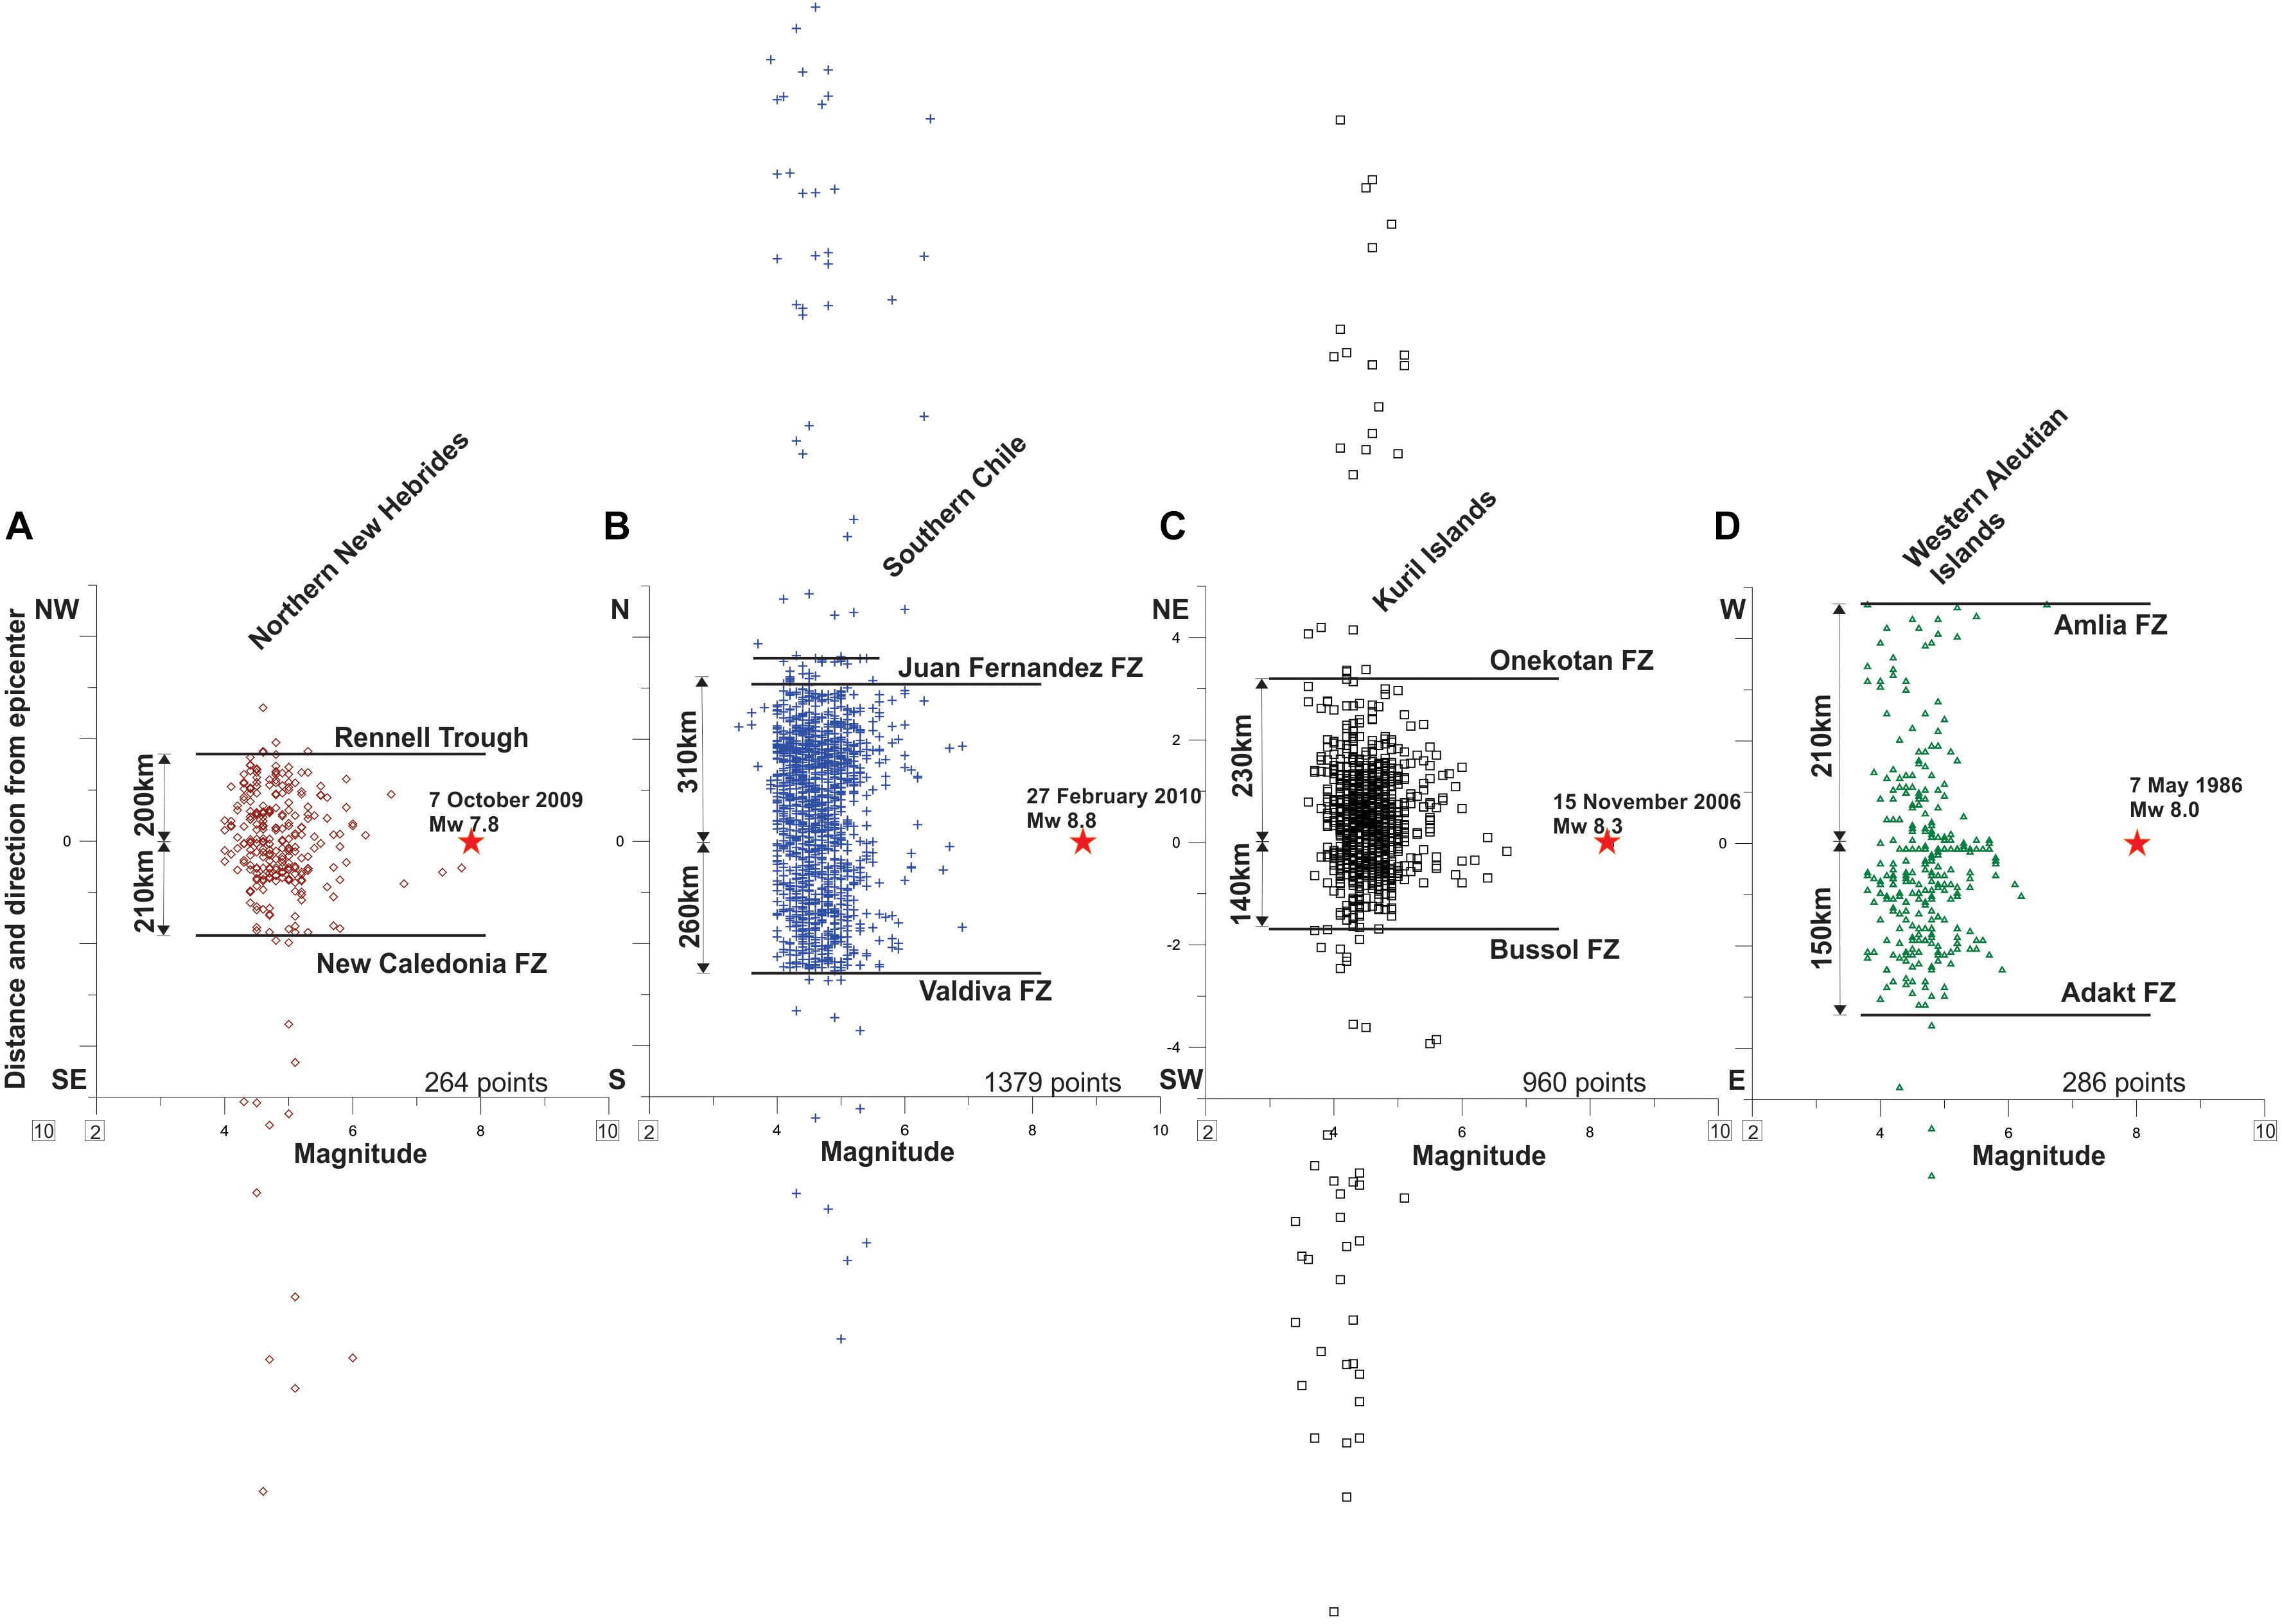
Figure 5. Plot showing the lateral extent of aftershocks relative to magnitude after the main rupture event in four locations. (A) Shows the concentration of aftershocks limited to within the two sub-plate boundaries of the northern New Hebrides. (B) Shows the concentration of aftershocks between the accurately located Juan Fernandez and Valdiva fracture zones on the Nazca Plate. (C) shows the concentration of aftershocks in the Kuril Islands and (D) shows the distribution of aftershocks in the Aleutians. The distance and direction away from the main rupture event is also shown for each location.
The data presented in Figure 5 also suggest that the size and location of the earthquake does not determine the distribution of the aftershocks. The aftershocks following the magnitude 8.0 earthquake in the Aleutian Islands were distributed over a lateral distance of 270 km while the less intense magnitude MW 7.8 earthquake in the northern New Hebrides exhibited aftershocks over a distance of 440 km (Figure 5). Furthermore, the distribution of aftershocks is not symmetrically distributed about the initial rupture. Aftershocks from the Kuril Islands earthquake extended some 200 km to the northeast but only 120 km to the southwest (Figure 5C) implying that the identified sub-plate boundaries formed a barrier to the lateral migration of aftershocks.
Finally, preliminary data from the Mw 8.0 earthquake in the eastern Solomon Islands in February 2013 (Lay et al., 2013) reveal that the distribution of aftershocks is highly irregular but nevertheless constrained to the north by the northern limit of the subducting Australian plate. The point where the Renell trough enters the subduction zone, a major inverted, “V-shaped” tear has developed. The northern limit of the seismicity corresponds with the northern limit of this slab edge (Figure 6).
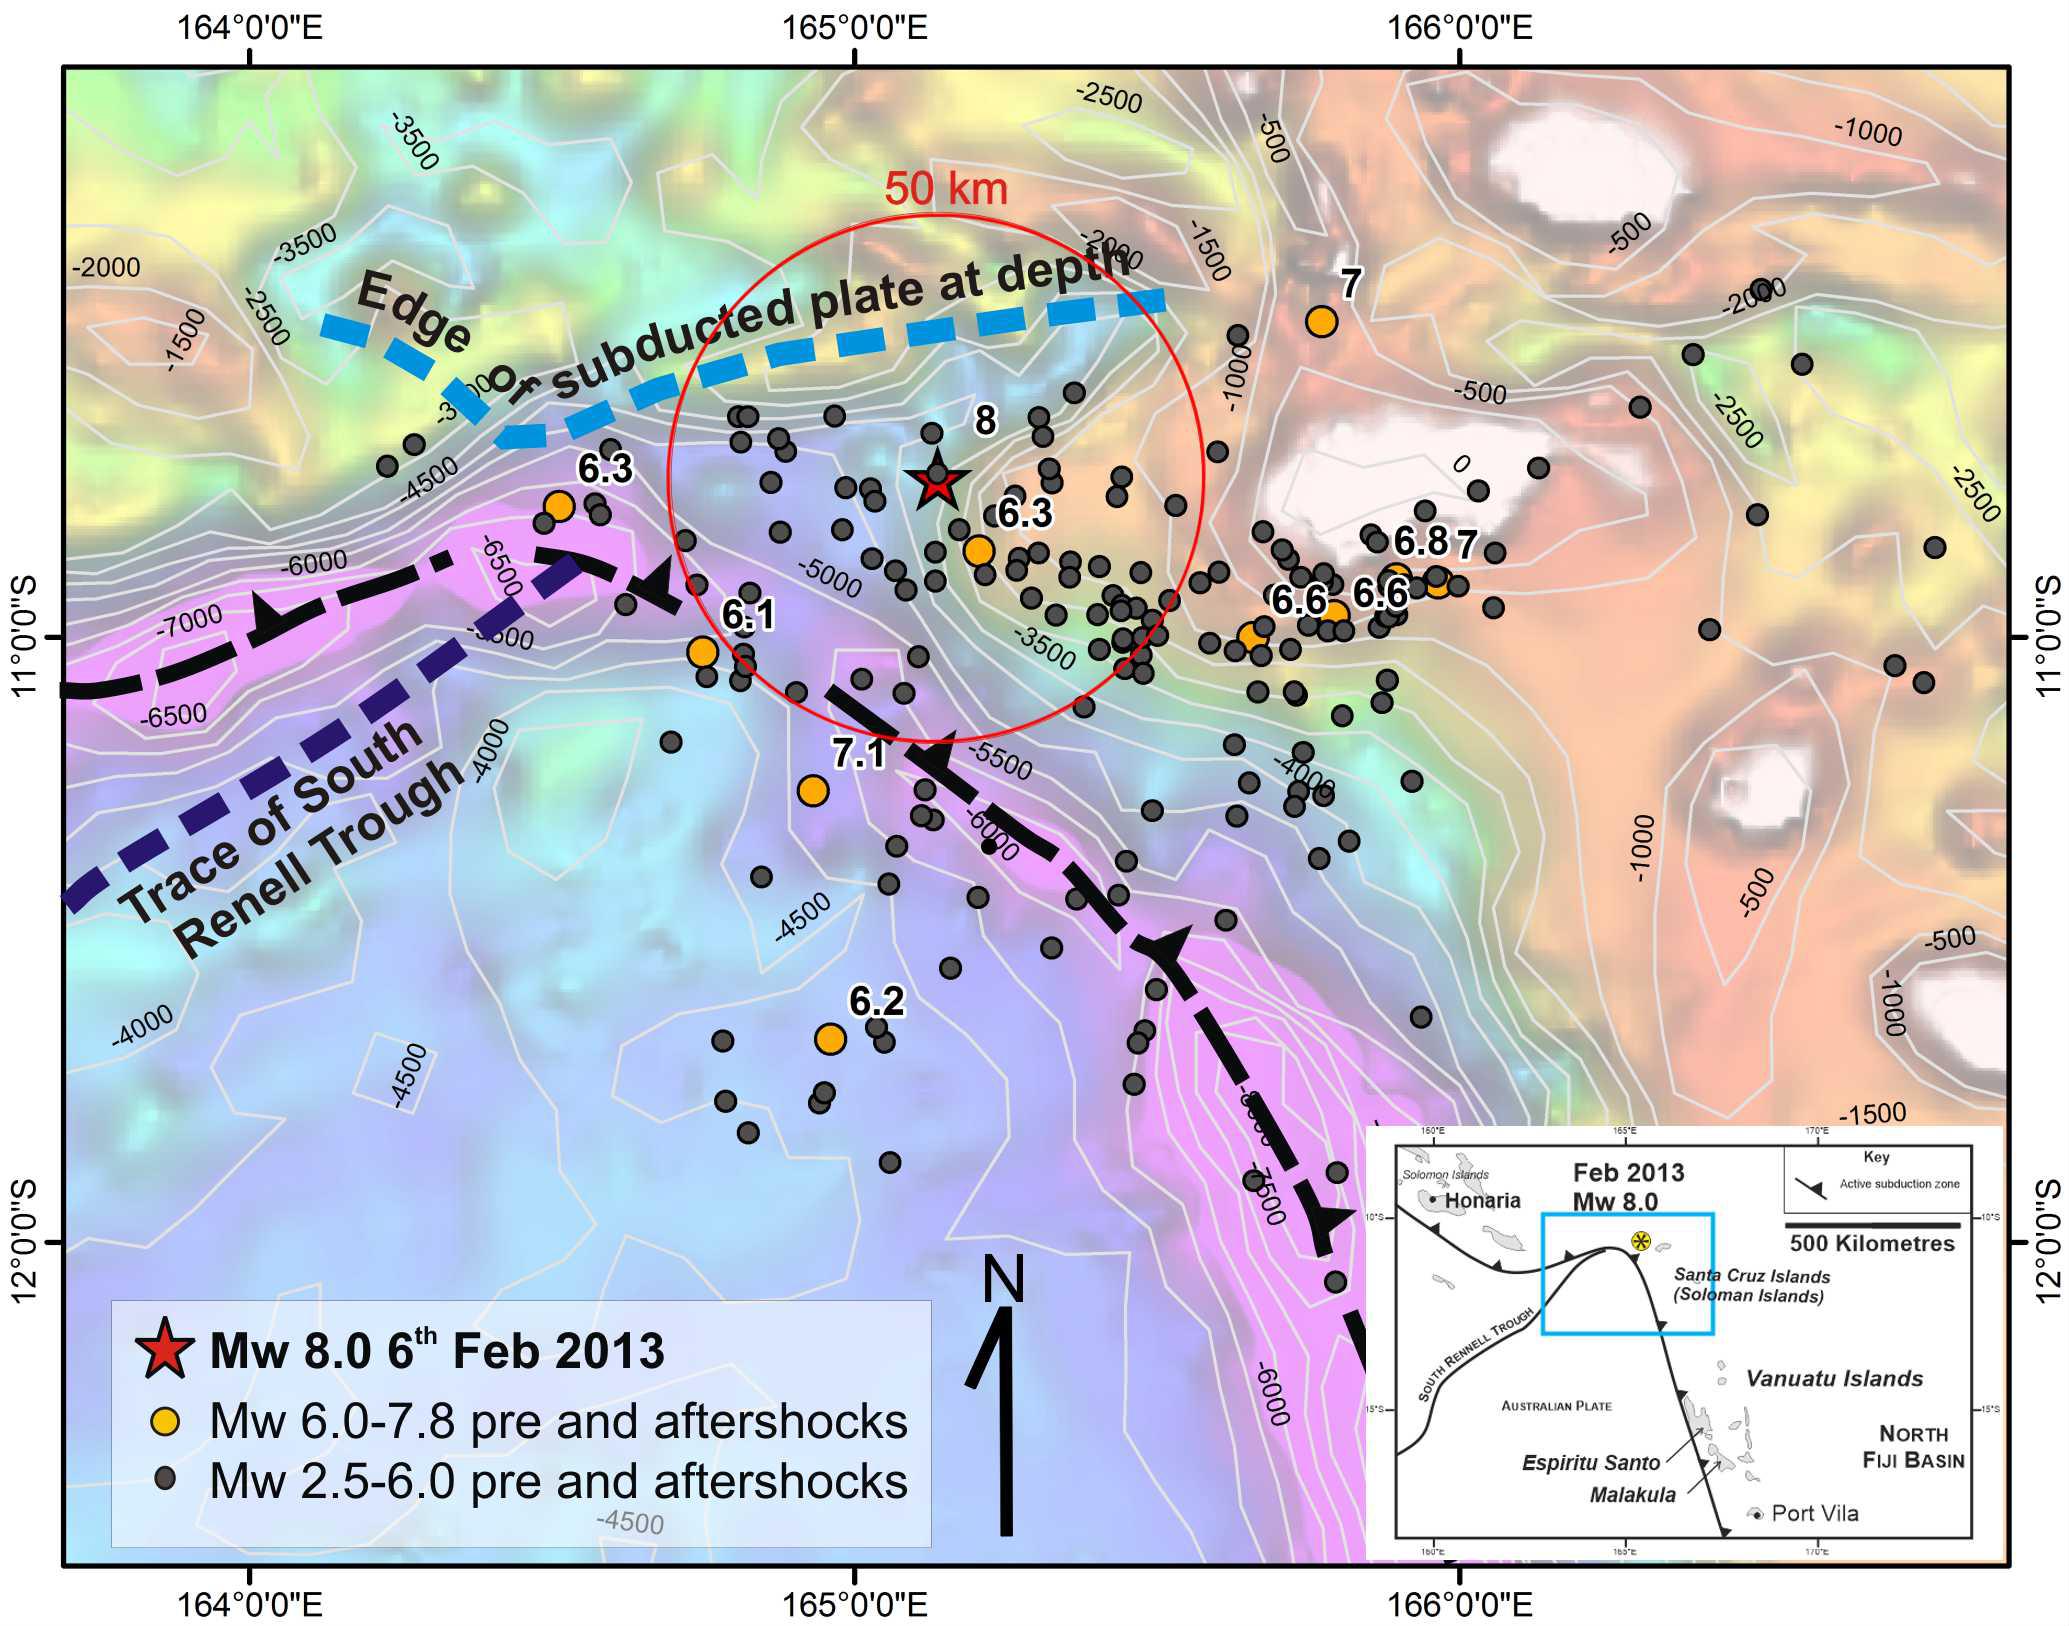
Figure 6. Image showing the location of the Mw 8.0 earthquake in the eastern Solomon Islands on the 6th of February 2013. The main rupture and associated aftershocks represent a collation of seismic data from the USGS records spanning the time interval from the 3rd February 2013 to the 10th of February 2013 (UTC). Only 4 days of aftershocks are shown here, yet the clustering and the lack of aftershocks north of the principal Mw 8.0 epicenter is already apparent. The location of major structural features is shown. 500 m bathymetry contours are superimposed on color contoured ETOPO v1 bathymetric data. The northern limit of the subducted slab is highlighted for on the map as it would appear at the surface, however, the reader is directed to Figure 2 for a 3D image of the slab surface.
Although many examples of earthquakes with magnitudes greater than Mw 7.0 have occurred within subduction zone settings in recent history, not all can be presented here. The research presented is a test case of four major earthquakes where close examination of the seafloor structure and 3D slab geometry has assisted in recognizing major structural weaknesses in the subducting plate that also appears to limit the spatial distribution of aftershocks. Thus, four cases were presented where the lateral extent of aftershocks post-dating a major rupture event were limited by the presence of sub-plate boundaries including major transform faults and fossil plate boundaries. Some of these boundaries were identified as vertical tears in the adjacent subducted slab. Combining detailed maps of the seafloor adjacent to active subduction zones with accurate 3D models of subducted slabs may lead to the development of a global map of subduction zones highlighting domains of aftershock susceptibility following major earthquake events.
The raw data supporting the conclusions of this article will be made available by the author, upon reasonable request, to any qualified researcher.
The following research was carried out in full by SR. All results and interpretations were generated by SR. SR produced all figures and prepared all aspects of the manuscript.
The author declares that the research was conducted in the absence of any commercial or financial relationships that could be construed as a potential conflict of interest.
Abercrombie, R., and Ekström, G. (2001). Earthquake slip on oceanic transform faults. Nature 410, 74–77. doi: 10.1038/35065064
Behn, M. D., Lin, J., and Zuber, M. T. (2002). Evidence for weak oceanic transform faults. Geophys. Res. Lett. 29, 60–61.
Bilek, S., Schwartz, S., and DeShon, H. (2003). Control of seafloor roughness on earthquake rupture behavior. Geology 31, 455–458.
Billen, M. I. (2008). Modeling the dynamics of subducting slabs. Annu. Rev. Earth Planet. Sci. 36, 325–356. doi: 10.1073/pnas.1616216114
Burkett, E. R., and Billen, M. I. (2010). Three-dimensionality of slab detachment due to ridge-trench collision: laterally simultaneous boudinage versus tear propagation. Geochem. Geophys. Geosyst. 11:Q11012. doi: 10.1029/2010GC003286
Cleveland, K. M., Ammon, C., and Lay, T. (2014). Large earthquake processes in the Northern Vanuatu subduction zone. J. Geophys. Res. Solid Earth 119, 8866–8883.
Das, S., and Watts, A. B. (2009). “Effect of subducting seafloor topography on the rupture characteristics of great subduction zone earthquakes,” in Subduction Zone Geodynamics, eds S. Lallemand, and F. Funiceillo, (Berlin: Springer-Verlag), 103–118.
Hayes, G., Briggs, R., Sladen, A., Fielding, E. J., Prentice, C., Hudnut, K. W., et al. (2010). Complex rupture during the 12 January 2010 Haiti earthquake. Nat. Geosci. 3, 800–805.
Huang, Z., and Zhao, D. (2013). Mechanism of the 2011 Tohoku-oki earthquake (Mw 9.0) and tsunami: insight from seismic tomography. J. Asian Earth Sci. 7, 160–168.
Hwang, L. J., and Kanamori, H. (1986). Source parameters of the May 7, 1986 andrean of Islands earthquake. Geophys. Res. Lett. 13, 1426–1429.
Kelleher, J., and McCann, W. (1976). Buoyant zones, great earthquakes, and some predictions. J. Geophys. Res. 81, 4885–4896.
Kuna, V. M., Nábělek, J. L., and Braunmiller, J. (2019). Mode of slip and crust–mantle interaction at oceanic transform faults. Nat. Geosci. 12, 138–142.
Larue, B., Daniel, J., Jouannic, C., and Recy, J. (1977). “The south renell trough: evidence for a fossil spreading zone,” in Proceedings of the International Symposium on the Geodynamics of the South-West Pacific (Paris: Editions Technip), 51–61.
Lay, T., Kanamori, H., Ammon, A., Hutko, A., Furlong, K., and Rivera, L. (2009). The 2006–2007 Kuril Islands great earthquake sequence. J. Geophys. Res. Solid Earth 114:B11308.
Lay, T., Ye, L., Kanamori, H., Yamazaki, Y., Cheung, K. F., and Ammon, C. J. (2013). The February 6, 2013 Mw 8.0 Santa Cruz Islands earthquake and tsunami. Tectonophysics 608, 1109–1121.
Lowrie, A., Smoot, C., and Batiza, R. (1986). Are oceanic fracture zones locked and strong or weak? New evidence for volcanic activity and weakness. Geology 14, 242–245.
Nishizawa, A., Kaneda, K., Watanabe, N., and Oikawa, M. (2009). Seismic structure of the subducting seamounts on the trench axis: Erimo Seamount and Daiichi-Kashima Seamount, northern and southern ends of the Japan Trench. Earth Planets Space 61, e5–e8.
Norio, O., Ye, T., Kajitani, Y., Shi, P., and Tatano, H. (2011). The 2011 eastern Japan great earthquake disaster: overview and comments. Int. J. Disaster Risk Sci. 2, 34–42.
Pesce, A. H. (1996). “The Plio-Holocene magmatic arc between 36°-39°S: controls of the Benioff geometry,” in Proceedings of the Third ISAG Sr Malo (France), 17-19/9/1996, St Malo.
Pulido, N., Sekiguchi, T., Shoji, G., Alba, J., Lazares, F., and Saito, T. (2010). Earthquake Source Process and Strong Ground Motions of the 2010 Chile Mega-Earthquake. Tsukuba: National Research Institute for Earth Science and Disaster Prevention.
Richards, S., and Holm, R. (2013). “Tectonic preconditioning and the formation of giant porphyry deposits,” in Tectonics, Metallogeny, and Discovery: the North American Cordillera and Similar Accretionary Settings, Vol. 17, eds M. Colpron, T. Bissig, B. G. Rusk, and J. F. H. Thompson, (Littleton, CO: SEG Special Publication), 265–276.
Richards, S., Lister, G., and Kennett, B. (2007). A slab in depth: three-dimensional geometry and evolution of the Indo-Australian plate. Geochem. Geophys. Geosyst. 8:Q12003.
Rona, P. A., Widenfalk, L., and Bostrom, K. (1987). Serpentinized ultramafics and hydrothermal activity at the Mid-Atlantic Ridge crest near 15°N. J. Geophys. Res. 92, 1417–1427.
Schellart, W. P. (2007). Northeastward subduction followed by slab detachment to explain ophiolite obduction and late Miocene volcanism in Northland, New Zealand. Terra Nova 19, 211–218.
Schellart, W. P., and Lister, G. S. (2004). “Tectonic models for the formation of arc-shaped convergent zones and backarc basins,” in Orogenic Curvature: Integrating Paleomagnetic and Structural Analyses, Vol. 383, eds A. J. Sussman, and A. B. Weil, (Boulder, CO: Geological Society of America Special Publications), 237–258.
Schellart, W. P., Lister, G. S., and Jessell, M. W. (2002). Analogue modeling of arc and backarc deformation in the New Hebrides arc and North Fiji Basin. Geology 30, 311–314.
Shan, J., Eguchi, R., and Jones, B. (2011). Haiti 2010 earthquake. Photogr. Eng. Remote Sensing 77, 995–996.
Sparkes, R., Tilmann, F., Hovius, N., and Hillier, J. K. (2010). Subducted seafloor relief stops rupture in South American great earthquakes: implications for rupture behavior in the 2010 Maule, Chile earthquake. Earth Planet. Sci. Lett. 298, 89–94.
Spencer, B. F. Jr., Ruiz-Sandoval, M. E., and Kurata, N. (2004). Smart sensing technology: opportunities and challenges. Struct. Control Health Monitor. 11, 349–368.
Thorvald, S. (1997). Architectural and engineering issues in disasters: the collapse-prone building. Ren. Fail. 19, 607–610. doi: 10.3109/08860229709109026
Watts, A. B., Koppers, A. A. P., and Robinson, D. P. (2010). Seamount subduction and earthquakes. Oceanography 23, 166–173.
Wilson, J. T. (1965). A new class of faults and their bearing on continental drift. Nature 207, 343–347.
Keywords: subduction, tectonics, earthquakes, aftershocks, structural geology, Vanuatu, South America
Citation: Richards S (2020) Structural Controls on Aftershock Distribution in Subduction Zones. Front. Earth Sci. 8:151. doi: 10.3389/feart.2020.00151
Received: 25 March 2020; Accepted: 21 April 2020;
Published: 18 May 2020.
Edited by:
Giovanni Martinelli, National Institute of Geophysics and Volcanology, ItalyReviewed by:
Masanao Shinohara, The University of Tokyo, JapanCopyright © 2020 Richards. This is an open-access article distributed under the terms of the Creative Commons Attribution License (CC BY). The use, distribution or reproduction in other forums is permitted, provided the original author(s) and the copyright owner(s) are credited and that the original publication in this journal is cited, in accordance with accepted academic practice. No use, distribution or reproduction is permitted which does not comply with these terms.
*Correspondence: Simon Richards, YXVzZmxhdHNAZ21haWwuY29t
Disclaimer: All claims expressed in this article are solely those of the authors and do not necessarily represent those of their affiliated organizations, or those of the publisher, the editors and the reviewers. Any product that may be evaluated in this article or claim that may be made by its manufacturer is not guaranteed or endorsed by the publisher.
Research integrity at Frontiers
Learn more about the work of our research integrity team to safeguard the quality of each article we publish.