 Kendra J. Lynn
 Michael O. Garcia
 Thomas Shea
- 1Department of Earth Sciences, University of Delaware, Newark, DE, United States
- 2Department of Earth Sciences, University of Hawai‘i at Mānoa, Honolulu, HI, United States
Lithium zoning in zircon and olivine provides a powerful record of crystal histories and magmatic processes in volcanic systems. Characterizing Li behavior in olivine is important because it is one of the few elements in basaltic systems that track short-duration magmatic processes (e.g., less than a few days). However, the potential for trace element coupling and the competing effects of crystal growth and subsequent diffusion obfuscate interpretations of Li zoning patterns and their use for geospeedometry. Here, we use diverse analytical techniques (EPMA, LA-ICPMS, nanoSIMS) to untangle records of growth and diffusion in carefully oriented olivine crystals from Kīlauea (Hawai‘i). Li, P, and Al are targeted because they show correlations despite contrasting behaviors during growth and diffusion. Lithium zoning exhibits two styles: (1) non-coupled, wherein Li (1–3 ppm) shows diffuse zoning over 10s–100s of μm between the crystal core and rim with low (10s of ppm) and homogeneous P, and (2) coupled, wherein sub-ppm Li enrichments <40 μm wide are correlated with P-rich zones (100s of ppm) that preserve a blueprint of crystal growth. Non-coupled Li zoning modeled for diffusive re-equilibration yields hours–days timescales, reflecting magma-mixing events that primed the system for eruption. Coupled Li peaks consistently occur where analyses traverse the dendritic framework of P zoning that reflects rapid crystal growth. This correlation results from Li+ ions partially satisfying charge balancing requirements of P5+ ions in the olivine lattice. Aluminum balances most of the P budget in olivine but has non-systematic correlations with Li peaks. Transects can exhibit both non-coupled and coupled Li behaviors, preserving histories of both crystal growth and diffusive re-equilibration. Modeling a near-rim Li enrichment peak with the Li diffusion coefficient yields a timescale of <3 min, too short to represent the time elapsed following crystallization. If the near-rim Li and P peaks are modeled using the diffusion coefficient for P, congruent timescales of 5–11 days suggest that they have the potential to record magmatic processes. Several caveats such as poorly constrained initial conditions and analytical challenges limit the practicality of enrichment peak geospeedometry. Only broad zoning of non-coupled Li should be modeled for timescales of magmatic processes.
Introduction
Lithium is an increasingly popular element for investigating diverse processes in volcanic systems, including volatile partitioning and degassing (e.g., Vlastélic et al., 2011; Edmonds, 2015), magmatic differentiation (Weyer and Seitz, 2012), and diffusive re-equilibration (e.g., Beck et al., 2006; Parkinson et al., 2007; Gallagher and Elliott, 2009; Ellis et al., 2018). As a fast-diffusing cation, Li re-equilibrates faster than all major and minor elements in olivine and is a potentially powerful geospeedometer for characterizing the sub-solidus histories of magma storage (Rubin et al., 2017), rapidly occurring volcanic processes (Charlier et al., 2012; Lynn et al., 2018), and the post-eruptive cooling of volcanic deposits (Ellis et al., 2018). However, trace element crystal chemical effects such as charge balancing requirements and element coupling may obfuscate Li geospeedometry. Coupling with other elements leads to multi-component diffusion, where the mobility of an element is also dependent on the concentration and mobility of other elements (e.g., Zhang, 2010).
Lithium diffusion in zircon exemplifies these complexities despite its usage to infer the timescales of magmatic processes in silicic magmas (e.g., Ushikubo et al., 2008; Cooper et al., 2017; Tang et al., 2017; Wilson et al., 2017). Retention of Li in zircon despite crystal ages spanning 10s of thousands of years (Rubin et al., 2017) sparked debate over apparently “slow” diffusion when Li is coupled with rare earth elements (REE) vs. “fast” when it is not coupled (Ushikubo et al., 2008; Cooper et al., 2017; Tang et al., 2017; Wilson et al., 2017). Trace element zoning in zircon is also strongly dependent on the 3D crystal structure during growth (Trail et al., 2016), making clear distinctions between non-coupled vs. coupled Li diffusion challenging. As a result, timescales and magmatic process interpretations drawn from Li zoning in zircon are currently vigorously debated (Cooper et al., 2017; Rubin et al., 2017; Wilson et al., 2017; Sliwinski et al., 2018).
Trace element zoning in olivine, the dominant phenocryst phase in most basaltic systems, is also complicated by charge coupling effects. Numerous studies have proposed that Li in olivine is subject to charge balancing requirements of other trace elements that are incorporated during rapid crystal growth (e.g., P, Al, Cr; Woodland et al., 2004; Milman-Barris et al., 2008; Mallmann et al., 2009; Grant and Wood, 2010; Spandler and O’Neill, 2010; Tomascak et al., 2016). Monovalent cations (e.g., Li+, Na+, H+) are thought to occupy octahedrally coordinated sites to charge balance P5+ substitution in tetrahedrally coordinated sites (Woodland et al., 2004; Milman-Barris et al., 2008; Mallmann et al., 2009) based on the following reaction:
where IV denotes coordination in a tetrahedral site and VI denotes that for the octahedral site. Phosphorus, a normally highly incompatible element, is enriched in a skeletal olivine framework during early rapid growth (Milman-Barris et al., 2008; Welsch et al., 2013, 2014; Shea et al., 2019). The above mechanism (Eq. 1) would allow rapidly growing olivine to incorporate monovalent cations like Li+. Phosphorus is also one of the slowest diffusing elements in olivine (Watson et al., 2015), meaning that the mobility of faster diffusing Li (Dohmen et al., 2010) may be subsequently hindered by the charge coupling conditions in Eq. 1. Alternatively, Li may exhibit “inter-site reaction” diffusion behavior analogous to H+ decorating pre-existing defects associated with trace elements like Ti (Jollands et al., 2016). In this case, Li would diffuse through P-rich regions by hopping between site vacancies or interstitial sites and vacancies associated with trace element charge balancing.
Phosphorus enrichments are probably also balanced by a combination of other substitution reactions, including vacancies and/or 3 + ions in octahedral sites (Agrell et al., 1998; Boesenberg et al., 2004; Milman-Barris et al., 2008; Mallmann et al., 2009; Boesenberg and Hewins, 2010):
where VIM2+ refers to a divalent cation in an octahedral site (e.g., Fe2+, Mg2+), VIR3+ refers to a trivalent cation in an octahedral site (e.g., Al3+, Cr3+, Fe3+), and VI[] represents an octahedral site vacancy. Aluminum also frequently shows fine-scale zoning inferred to preserve rapid crystal growth and may partially charge balance P5+ via tetrahedral or octahedral substitutions outlined in Eqs 3 and/or 4 (Evans et al., 2008; Milman-Barris et al., 2008; Welsch et al., 2013, 2014; Zhukova et al., 2017; Shea et al., 2019).
Here, we document the distribution of Li, P, and Al in magmatic olivine to distinguish the signatures of growth- and diffusion-induced zoning for these trace elements in natural basalts. Pumice from explosive Keanakāko‘i Tephra (KT, 1500–1820 C.E.; Swanson et al., 2012) eruptions at Kīlauea Volcano are ideal for this study because of the following reasons: (a) the tephra contains euhedral olivine that was easily extracted and oriented perpendicular to a crystallographic axis for sectioning; (b) samples were quenched very rapidly, avoiding complications of post-eruptive Li diffusion (e.g., Ellis et al., 2018); and (c) the magmatic histories of many of the tephra units are well characterized based on previous studies of glass and olivine compositions (Lynn et al., 2017, 2018; Garcia et al., 2018). We combine backscattered images and X-ray element maps of P and Al by EPMA; laser ablation ICPMS measurements of Li, P, and Al; and nanoscale secondary ion mass spectrometry (nanoSIMS) measurements of Li and P in linear core-to-rim transects and ion element maps and to document the distribution and correlation of Li and P. These data are used to identify coupled vs. non-coupled Li zoning and provide recommendations on selecting Li profiles for geospeedometry.
Materials and Methods
Sample Preparation and Previous Work
Samples used in this study were previously examined for major and minor elements in olivine (see Lynn et al., 2017, 2018) and major, minor, and trace element geochemistry in glasses (Garcia et al., 2018). The euhedral olivine phenocrysts (>0.5 mm) examined in this study had core forsterite [Fo mol%; (Mg/(Mg + Fe) × 100)] contents of 83.9–88.5, with one crystal at 79.2 (Supplementary Material). Each crystal was oriented perpendicular to a crystallographic axis, confirmed via electron backscatter diffraction (EBSD) analyses (see below) and/or recognizable euhedral crystal faces (Lynn et al., 2017). Well-oriented crystals allow analytical profiles to be made parallel to principal crystallographic axes and minimize oblique sectioning through complex 3D distributions of elements like P (Welsch et al., 2014).
Electron Probe Micro Analysis (EPMA)
X-ray maps of Al and P in olivine were obtained using the JEOL JXA-8500F Hyperprobe at the University of Hawai‘i. Maps were collected using a 15-kV accelerating voltage and a 300- to 500-nA beam current, with dwell times between 100 and 200 ms/pixel.
Electron Backscatter Diffraction
Crystal orientations were confirmed using the HKL Nordlys EBSD detector on the JEOL JSM-5900LV scanning electron microscope at the University of Hawai‘i (UH). Final polishing with a 50- to 70-nm colloidal silica suspension for 4 h on a vibratory polisher improved the quality of electron backscatter patterns (EBSPs). Measurements were made using a 70° sample tilt, 25-kV accelerating voltage, and a working distance of 16–17 mm. Grids of 10 × 10 individual analysis spaced at least 10 μm apart achieved average mean angular deviation values of <1°. The EBSPs were processed using the HKL Technology Channel 5 software package, and axis locations were output into lower hemisphere stereographic projections.
Laser Ablation Inductively Coupled Plasma Mass Spectrometry
Trace element analyses for 10 transects in 7 olivine crystals were acquired by laser ablation inductively coupled plasma mass spectrometry (LA-ICPMS) using the same methodology of Lynn et al. (2018). Only seven elements were analyzed in our routine (7Li, 23Na, 27Al, 29Si, 31P, 52Cr, and 60Ni), which allowed significantly longer dwell times on Li (65 ms) than typical for multi-element (e.g., 20+) routines (<10 ms per element). The Ni abundances were measured here to compare with previous EPMA analyses (Lynn et al., 2017) and are not discussed further. Both Na and Cr showed inconsistent relationships with Li and P zoning and are not discussed here. Measurements were made with a Photon Machines Analyte G2 excimer laser connected to an iCAP Q ICPMS in an Ar–He atmosphere at the Earth Observatory of Singapore (Nanyang Technological University). Machine settings were optimized to reduce oxide production and interferences by achieving a ThO+ signal intensity of <0.6% of the Th+ signal. The laser was run at 70% output, 5.9 J cm–2 fluence, and frequency of 8 Hz with constant voltage. Twenty seconds of background signal (laser off) was acquired followed by 40 s sample ablation.
Measurements utilized 10 × 50-μm spots oriented with the 50-μm length parallel to the crystal-melt boundary (Supplementary Figure S1). An 11-μm spacing was used to avoid overlap and to create a 1-μm separation between individual spot analyses. Data reduction in Iolite© (Paton et al., 2011) removed the first and last 3 s of counts for each analysis before converting counts to concentrations. Analyses with fluctuations or spikes in the counts that might represent ablation of Cr-spinel, glass, or fluid inclusions were removed from the dataset before processing. The internal reference isotope 29Si was used to convert raw counts to concentrations based on the EPMA measurements of SiO2 in olivine (data from Lynn et al., 2017). The NIST 612 silicate glass was used to calibrate relative sensitivities for Li (40.2 ppm), P (46.6 ppm), and Al (10746 ppm). NIST 610 and USGS BCR-2G were run as unknowns (see Supplementary Material). The three reference materials were analyzed in between each olivine transect to monitor instrumental drift. Analytical precision (2σ) values for repeated measurements of NIST 612 glass are 0.83 ppm for Li (compared with 1.3 ppm given error on preferred GeoReM value), 206 ppm for Al (GeoReM error 212 ppm), and 6.3 ppm for P (GeoReM error 6.9 ppm; Supplementary Material). Measured values were compared with the GeoReM database preferred values (Jochum et al., 2011, 2016) to assess data quality. Average 2σ errors for Li measurements of KT olivine crystals were calculated by Iolite© (Paton et al., 2011) and are typically ±0.08 ppm for Li abundances of 1–3, ±6 ppm for Al abundances of 100s of ppm, and ±10 ppm for P abundances of 10s to 100s of ppm.
Nanoscale Secondary Ion Mass Spectrometry
High-resolution nanoSIMS analyses of Li and P zoning were collected for two crystals based on coupled increases of Li and P concentrations observed in LA-ICPMS profiles. The isotopes of 31P and 7Li were measured using different beam sources on the Cameca Ametek nanoSIMS 50L at Arizona State University. Samples were sputtered with a 133Cs+ primary beam of 100 pA to measure P and a 16O– primary beam of 100 pA to measure Li. An electron gun was used to compensate sample charge. Both trace elements were normalized to 30Si, measured in each routine, in order to monitor possible instrumental drift. Point analyses were collected to identify zones of interest before high-resolution line scans were made. Areas 50 × 50 μm (256 × 256 px) were pre-sputtered to acquire ion images that were used to precisely orient line scans perpendicular to bands of P and Li enrichment. Line scans were collected using a 0.5-μm beam (3 × 3 px) for 500 cycles with a dwell time of 10–20 ms/px and are reported as accumulated counts. Line scans were run past the crystal-melt boundary into regions of adhering glass to isolate mixed signals and remove possible edge effects. The San Carlos olivine standard (NMNH 111312-42; a split specifically characterized for its trace element composition; E. Hauri, personal communication, 2017) was measured with a 5 × 5-μm raster (128 × 128 px) with a dwell time of 1 ms/px for 10 blocks and 10 cycles/block. Phosphorus (23.4 ± 1.2 ppm) and Li concentrations (1.63 ± 0.08 ppm; E. Hauri, unpublished) were used to convert count ratios of 31P/30Si and 7Li/30Si to concentrations. There is excellent correlation between the 31P/30Si ratio and 31P counts (R2 = 0.9762) and the 7Li/30Si ratio and 7Li counts (R2 = 0.9998), demonstrating that the ratios depend primarily on their trace element concentrations and were not strongly affected by 30Si variations or instrument drift (Supplementary Figure S2).
Results
Lithium and P zoning in the Kīlauea olivine crystals follow two systematic and distinct behaviors: non-coupled and coupled. Non-coupled behavior usually shows a smooth gradient in Li with 1–2 ppm variation over 10s to 100s of μm between the crystal core and rim (Figure 1A), which is amenable to diffusion modeling. Diffuse, non-coupled Li zoning always occurs in transects where P concentrations are low (a few 10s of ppm) and homogeneous within LA-ICPMS error (typically ∼10 ppm; Figure 1A). We chose to use the term “non-coupled” because it indicates simply that the P and Li concentrations are not correlated. The term “uncoupled” (used by Tang et al., 2017) or “decoupled” implies that the trace elements may have been coupled originally. Non-coupled profiles occur in olivine crystals with both normal (Licore > Lirim; Figure 1) and reverse zoning (Licore < Lirim). These profiles from Kīlauea olivine were previously interpreted to represent diffusive re-equilibration initiated by late-stage magmatic intrusions and were modeled to extract the timing and duration of magma mixing and transport (Lynn et al., 2018).
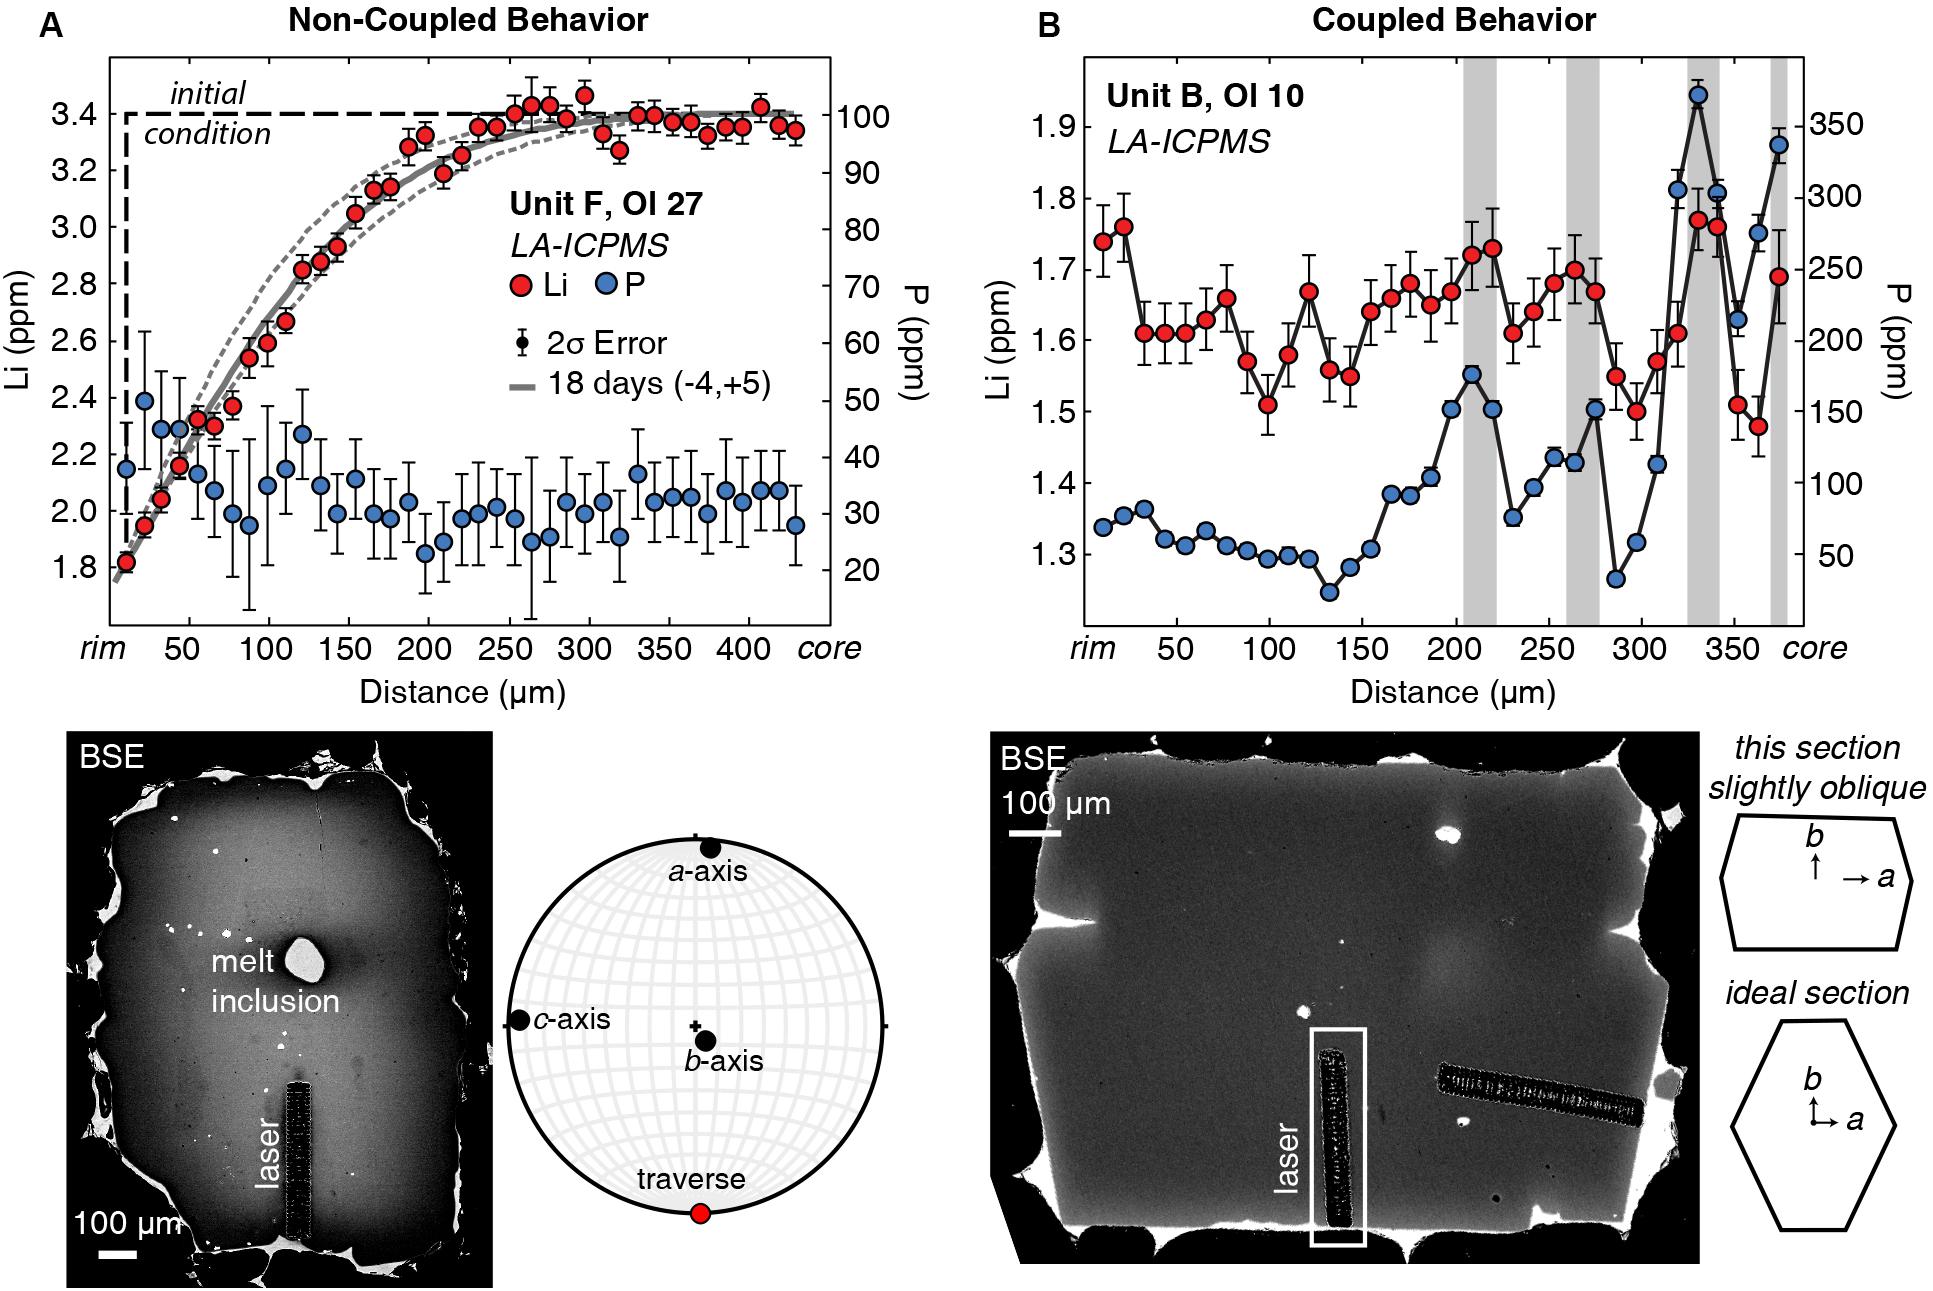
Figure 1. Examples of non-coupled and coupled Li behaviors in Kīlauea olivine. (A) Non-coupled behavior of Li. Diffuse Li is strongly zoned, whereas P concentrations are low and essentially non-zoned outside the error bars. The gray line through the Li data is the 1D diffusion model best fit of 18 days, and the dashed lines represent model uncertainties of –4 and +5 days (Lynn et al., 2018) that reflect the 2σ analytical error and spacing of analyses (1 spot per 11 μm) Additional timescale uncertainties related to temperature calculations (±10°C; Helz and Thornber, 1987) are on average 10% of the timescales calculated for a given profile. The BSE image (lower left) and EBSD lower hemisphere stereonet projection show that the traverse was done parallel to the a-axis. (B) Coupled behavior of Li. Regions of high P marked by gray bars also correspond to regions of high Li, produced by elemental charge balancing requirements imposed during crystal growth. The orientation of this crystal was estimated by comparing the 2D section with an ideal olivine section taken perpendicular to the c-axis (e.g., Shea et al., 2015a). The traverse was collected roughly parallel to the b-axis.
In “coupled” Li and P zoning profiles, abrupt changes in Li concentration are positively correlated with variations in P (Figure 1B). Zoning of Li typically increases on the order of 15–80% (0.3–1.6 ppm), compared with P variations that can be up to 2,800% (10s to 100s of ppm) across an entire profile. Six of the analytical profiles (4 of 7 crystals) have coupled Li + P zoning. Coupled Li does not systematically correlate with Al.
Both non-coupled and coupled behaviors of Li + P are observed in some olivine crystals (Figure 2). The core-to-rim transects in these crystals have broad regions of diffuse Li zoning (occurring at P concentrations of only a few 10s of ppm) and 10- to 30-μm-wide regions of elevated Li + P. In such complex profiles, coupled Li + P usually occurs as abrupt increases in concentration relative to adjacent portions of the crystal. These locally coupled regions are herein referred to as “enrichment peaks.” LA-ICPMS profiles reveal peaks with a 10–20% (0.1–0.6 ppm) increase of Li and a 300–900% (10s to 100s of ppm) increase of P compared with adjacent analyses (Figure 2). Where present, Li enrichment peaks are always correlated with P enrichments. Aluminum, another trace element in olivine that is commonly but not always positively correlated with P, is not systematically correlated with Li enrichment peaks.
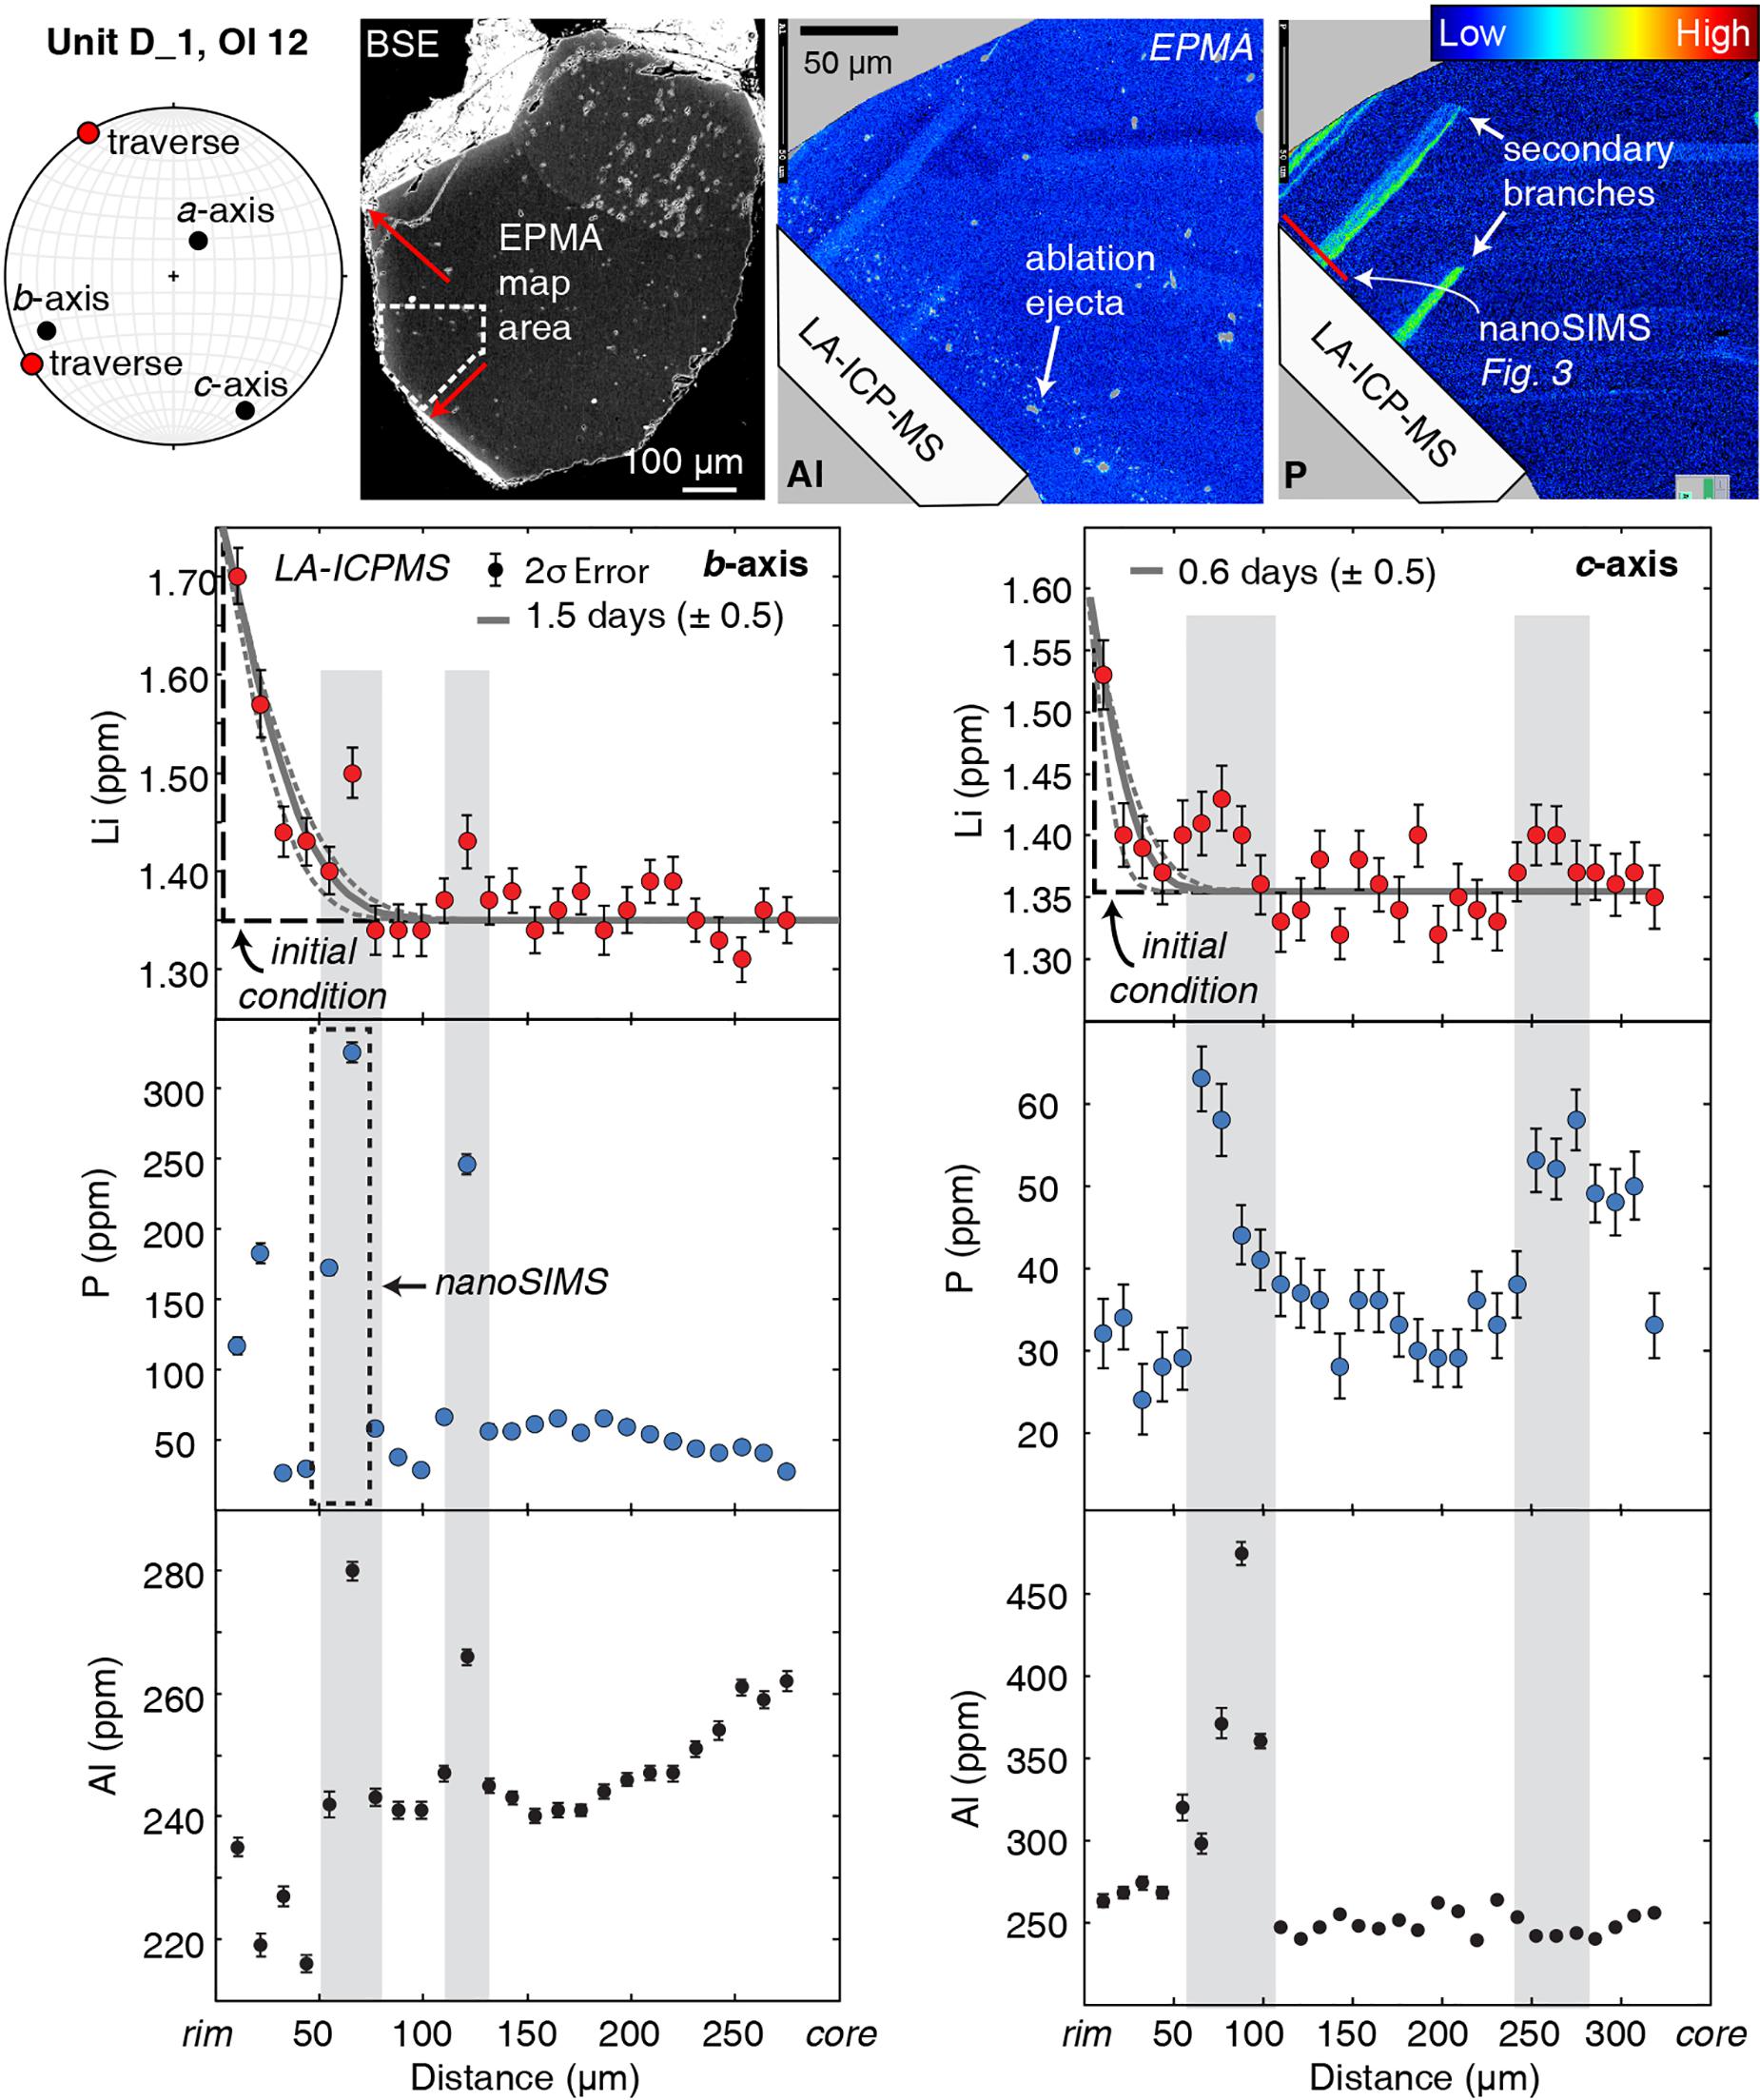
Figure 2. Two transects that show both non-coupled and coupled behaviors of Li and P. The two profiles (marked by red arrows on BSE image) from the same olivine crystal parallel to the b- and c-axes have diffuse zoning of lithium that can be fit with 1D diffusion models. The gray line through the Li data is the model best fit, and the dashed lines represent model uncertainties that reflect the 2σ analytical error and spacing of analyses (1 spot per 11 μm; Lynn et al., 2018). Additional timescale uncertainties related to temperature calculations (±10°C; Helz and Thornber, 1987) are on average 10% of the timescales calculated for a given profile. These profiles also contain enrichment peaks (marked by gray bars) that have correlated Li and P enrichments. In this example, Al is also positively correlated with Li and P. The EPMA X-ray maps for Al and P show correlations in enrichment peak regions. The red line on the P X-ray map indicates the location of the nanoSIMS profile shown in Figure 3, which measured the enrichment peak outlined in the dashed black box.
Measurements by nanoSIMS show that enrichment peaks have much higher concentrations (e.g., 550 vs. 340 ppm; b-axis profile in Figure 2 vs. Figure 3) than measured by LA-ICPMS because of the much smaller analytical spot size (e.g., <1 μm vs. 10 μm, respectively). The shape of this peak is better defined in the nanoSIMS profile, which shows a doublet in P zoning (Figure 3) that is not resolved by LA-ICPMS (Figure 2). Another enrichment peak that is 15 μm wide in a Unit K1 olivine has 700 ppm P measured by nanoSIMS, but the peak is absent in the LA-ICPMS profile from the same crystal (Figure 4).
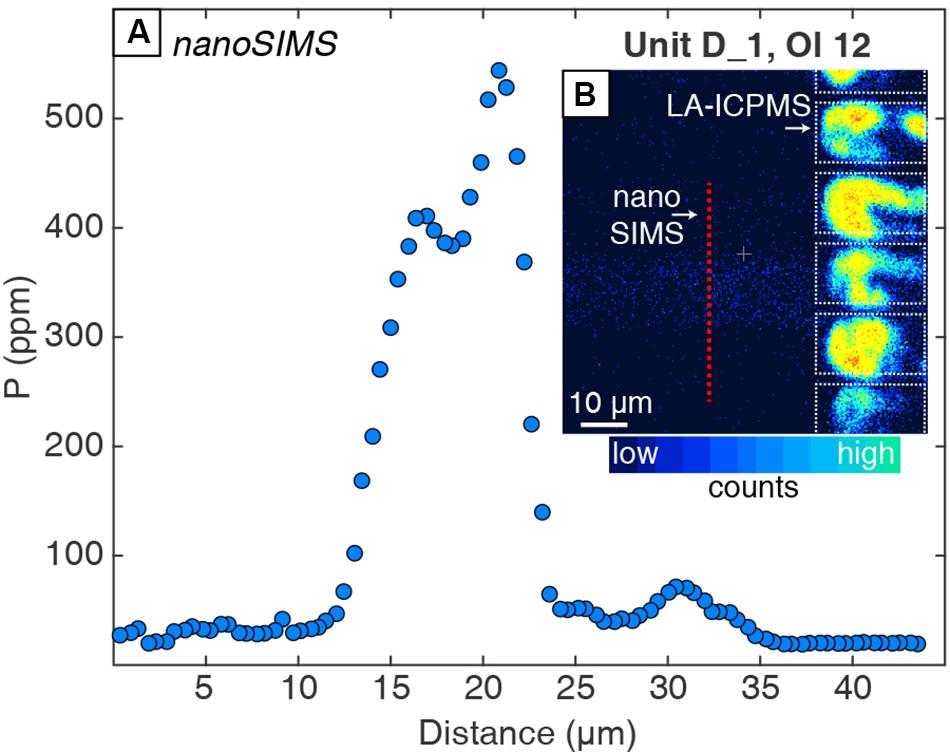
Figure 3. (A) NanoSIMS profile across an enrichment peak in Unit D_1 Ol 12 (dashed black box from Figure 2). (B) The nanoSIMS ion image shows that the enrichment peak (∼15 μm wide in blue on nanoSIMS image) is straddled by two laser ablation pits, demonstrating how small enrichment features can be distorted or homogenized by coarser beam size analytical routines. LA-ICPMS pits (dotted white boxes) appear to have high counts because the ablated crystal in those regions is poorly polished (e.g., not a true reflection of counts or concentration). Analytical error is smaller than the symbol size.
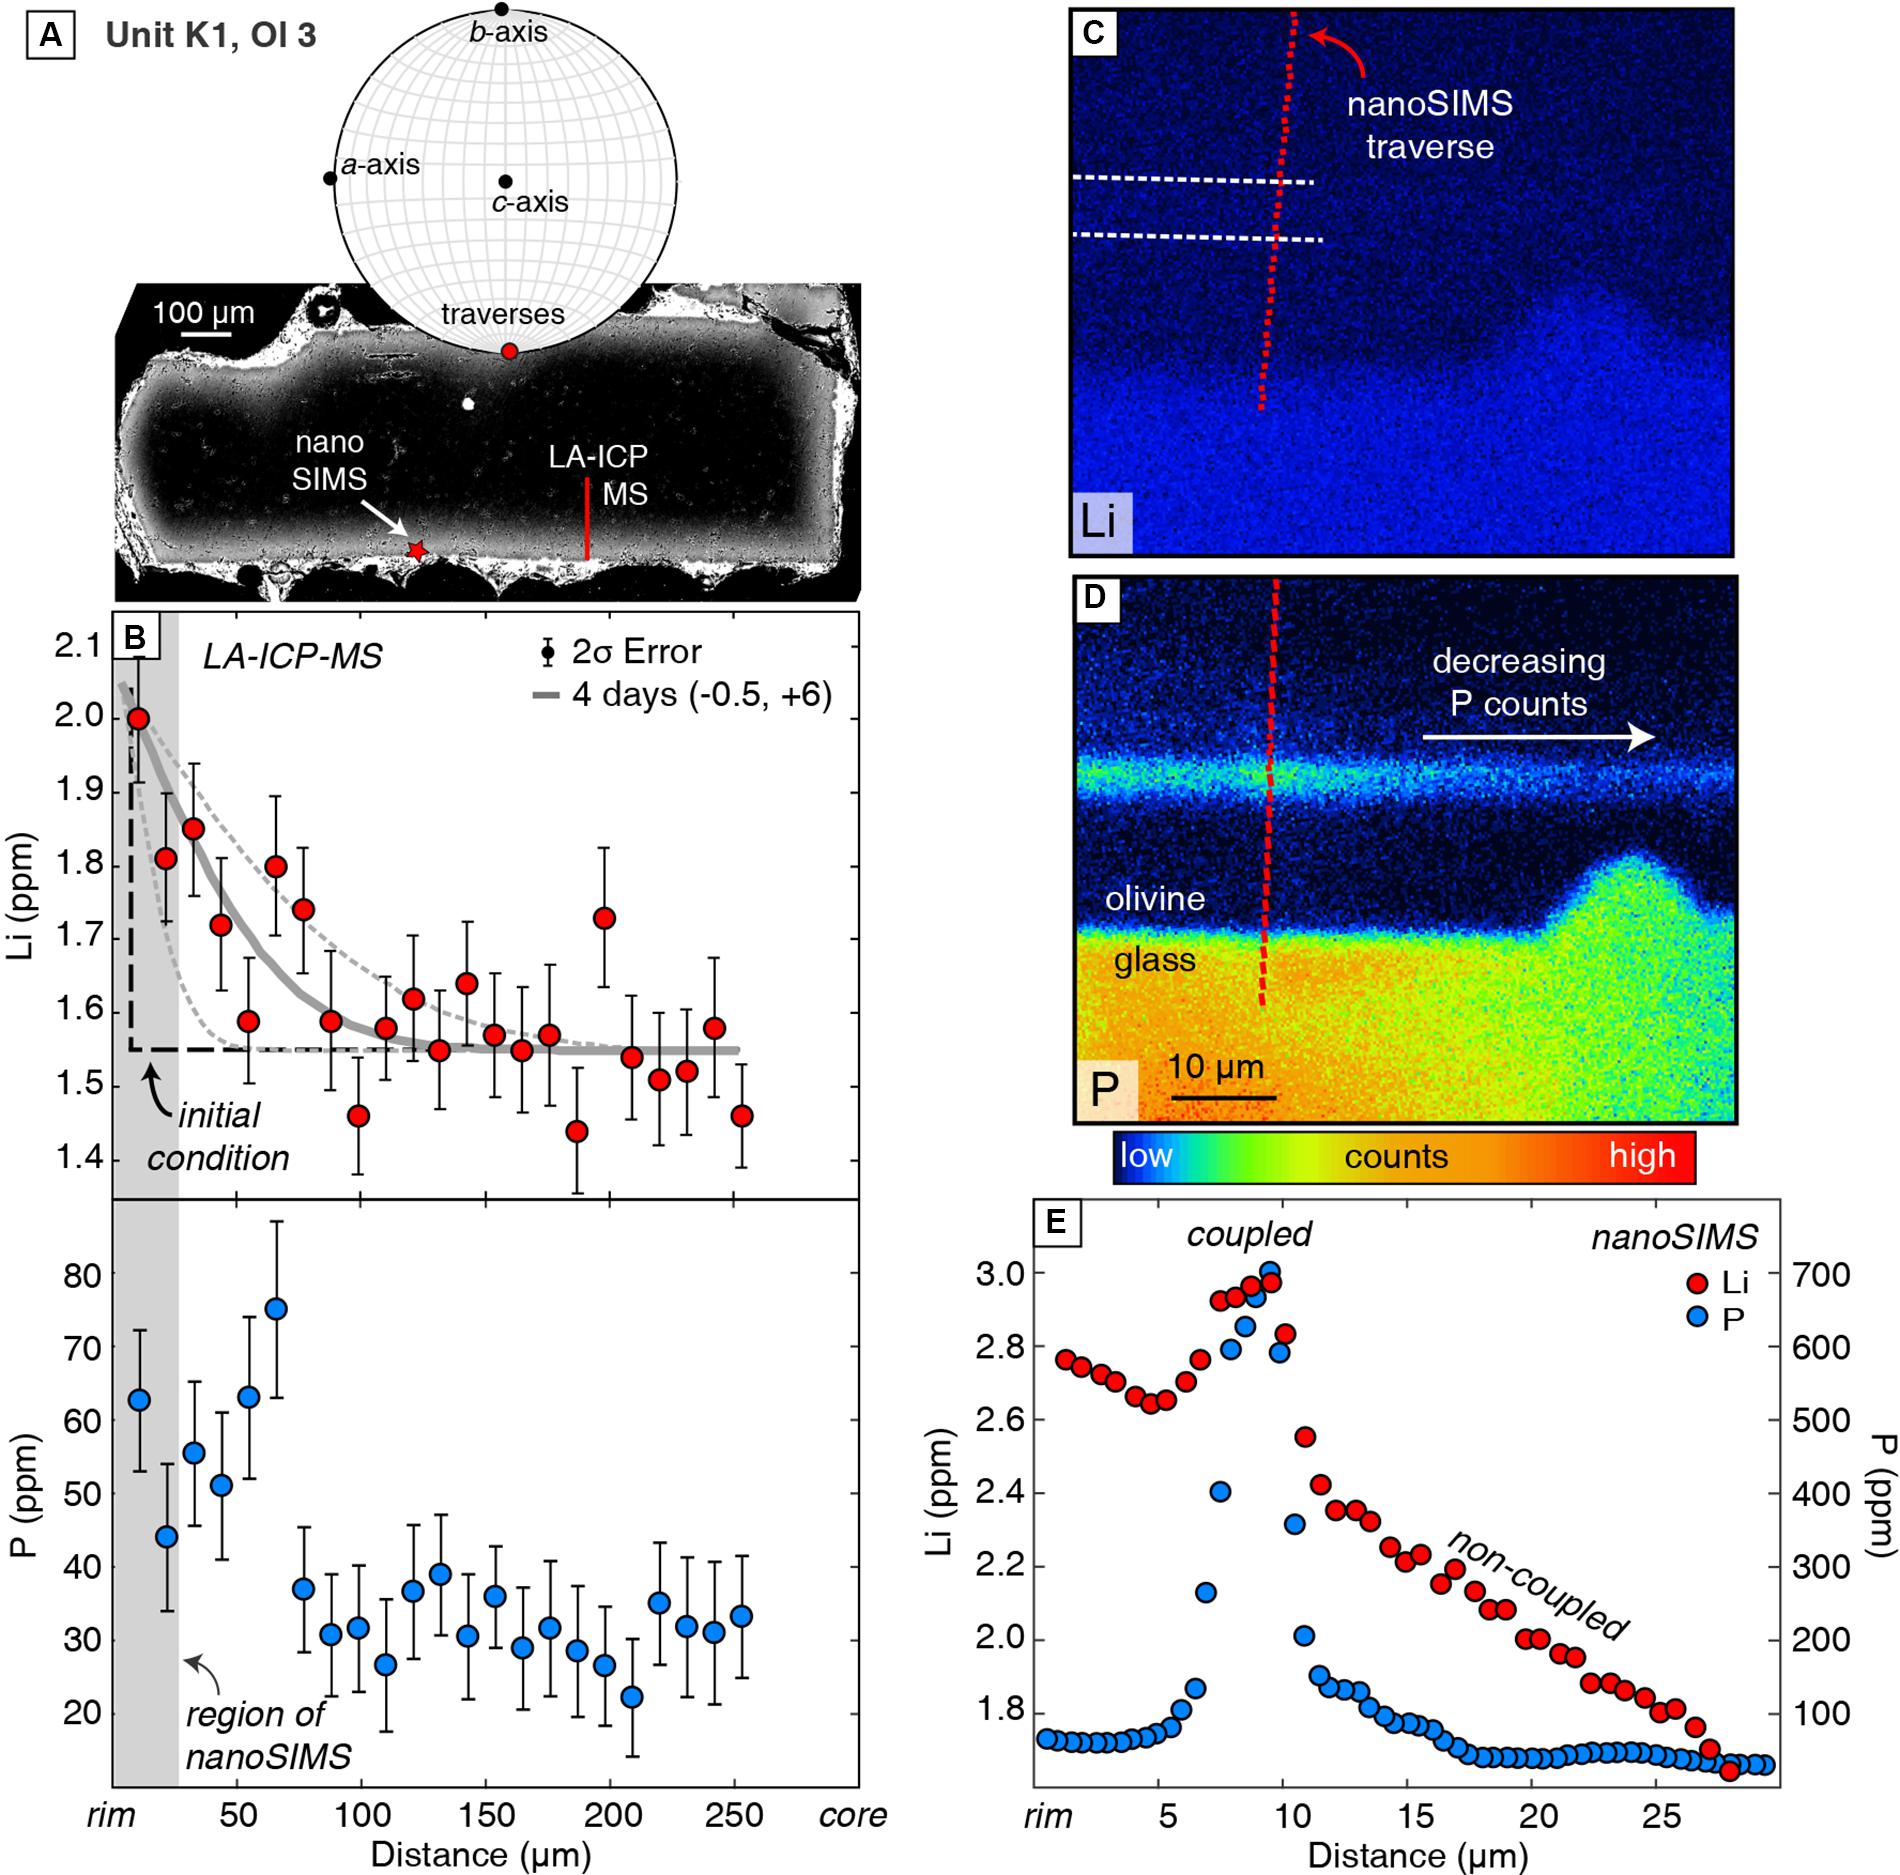
Figure 4. LA-ICPMS and nanoSIMS data for traverses parallel to the b-axis in Unit K1, Ol 3. (A) The BSE image (upper left) and EBSD lower hemisphere stereonet projection show that this crystal is elongated along the a-axis and was sectioned perpendicular to the c-axis. (B) Overall diffuse zoning of Li and low P concentrations, as measured by LA-ICPMS with modeled timescale and uncertainties associated with analytical error and spatial resolution (described above). (C,D) NanoSIMS ion images show that proximal to the olivine–melt boundary, there is a <10-μm enrichment peak with coupled Li and P. (E) NanoSIMS measurements across the enrichment peak, showing coupled P and Li in the peak region and steadily increasing, non-coupled Li surrounding it. Analytical error on all nanoSIMS data is smaller than the symbol size.
The coupled vs. non-coupled behaviors can be distinguished by distinct trends in P vs. Li expressed as cations per four oxygens (atoms per formula unit; Figure 5). Non-coupled behavior shows a near-vertical trend with variable Li at relatively constant P. Coupled Li and P covary positively with a shallow slope and relatively high R2 values (Figure 5). Analytical profiles that exhibit both behaviors can be divided into two groups of data with either a near-vertical trend or a shallow positive trend (Figure 5C).
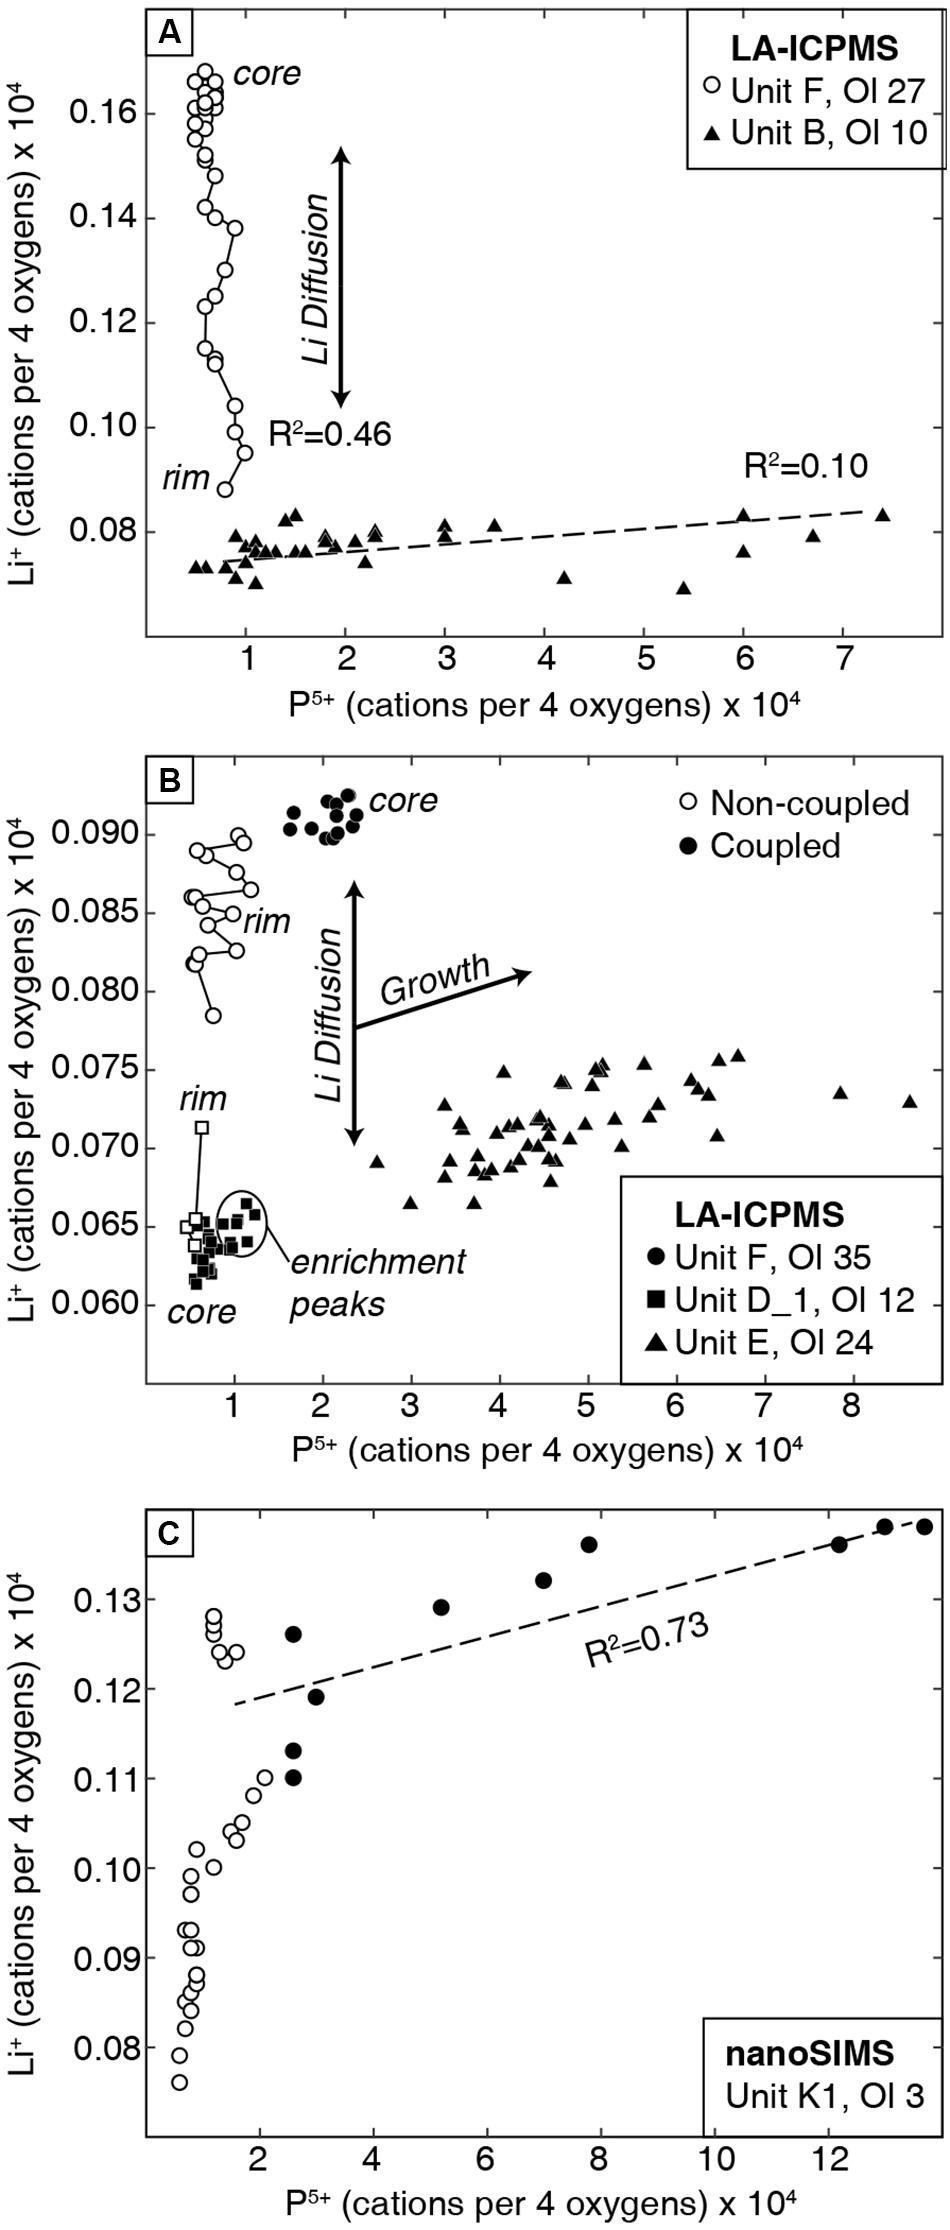
Figure 5. P5+ vs. Li+ for olivine transects, as cations per formula unit of four oxygens, measured by (A,B) LA-ICPMS and (C) nanoSIMS. Non-coupled (open symbols) and coupled (filled symbols) data have different slopes that represent either diffusive re-equilibration or crystal growth. Solid lines connect non-coupled Li profiles that are generated via diffusive re-equilibration. Non-coupled data have variable Li content with minimal variation in P. These trends are clearer in the nanoSIMS data (bottom panel), which show distinct differences in slope for coupled vs. non-coupled Li and P.
Discussion
Coupled and non-coupled behaviors of Li with P zoning in olivine clearly distinguish signatures of crystal growth and diffusive re-equilibration. These features provide a framework for applying Li geospeedometry in olivine. The abundances, zoning styles, and spatial variations in Li and P correlations are used in the following sections to (a) examine the value of high-resolution analytical methods for discerning and interpreting small-scale zoning features to understand trace element behavior in minerals; (b) provide insights into the mechanisms controlling non-coupled and coupled Li zoning; (c) illustrate the complex, 3D distribution of these elements; (d) test diffusion models on coupled Li and P enrichment peaks; and (e) provide guidelines for applying and interpreting Li geospeedometry in olivine.
High-Resolution Is Needed to Characterize Enrichment Peak Features
The spatial resolution of trace element analyses affects the magnitude of apparent enrichment relative to non-zoned portions of crystals (e.g., Bouvet de Maisonneuve et al., 2016; Shea et al., 2019). Trace element enrichment peaks in olivine that reflect rapid crystal growth are typically less than a few 10s of μm wide (e.g., Welsch et al., 2013, 2014; Shea et al., 2015b, 2019; Manzini et al., 2017). Analytical methods with large beam sizes (e.g., this LA-ICPMS method with 10-μm-wide spots) or continuous scanning (e.g., raster method; Bouvet de Maisonneuve et al., 2016) smear fine-scale trace element zoning and yield reduced concentrations in these peaks. Finer beam size methods such as nanoSIMS (<1 μm beam size) allow details of the enrichment peaks to be revealed (Figures 2, 3; see also Manzini et al., 2017). Two olivine crystals were analyzed with LA-ICPMS and nanoSIMS methods to assess the loss of information that occurs when using coarse analytical methods such as laser ablation. The LA-ICPMS profile shows a 20-μm-wide Li + P enrichment peak near the crystal rim with P concentrations of 340 ppm (Figure 2), enriched by about a factor of ∼7 compared with the nearby non-zoned regions characterized by ∼50 ppm P. The nanoSIMS analyses of the same peak revealed a P doublet ∼10 μm wide with up to 550 ppm (Figure 3). The 60% higher concentration of P and presence of a doublet in the nanoSIMS profile illustrate the superiority of this method for resolving fine-scale details about trace element zoning in olivine as well as other minerals (e.g., Manzini et al., 2017; Tang et al., 2017; Seitz et al., 2018). Thus, coarse-resolution methods such as laser ablation are not suitable for characterizing and subsequently modeling the enrichment peak features.
Mechanisms Controlling Non-coupled and Coupled Li Zoning
Diffusion Generates Broad Non-coupled Lithium Zoning
The majority of Li profiles are dominantly non-coupled and amenable to diffusion modeling. In these profiles, P concentrations are low, a few 10s of ppm, and there is no correlation of P with Li content (Figure 5). Thus, we propose here that Li is not charge balancing P or other elements at such low concentrations (typically <50 ppm) and is able to diffuse readily. Charge balancing for P substitution in the tetrahedral site is balanced by other ionic species (Al, Cr, Fe3+) and/or vacancies (Eqs 2–4). Aluminum charge balances most or all of the P budget in low-P regions of both natural and experimental olivine (Shea et al., 2019). Regions of both low P and Al (e.g., <100 molar ppm) have an approximately 1:1 correlation (region “3” on Figure 10b in Shea et al., 2019). Thus, P is balanced by Al in low-P regions, and Li is unaffected by charge balance requirements.
In the absence of charge balancing requirements, we propose that Li atoms diffuse within the olivine lattice via the slower vacancy diffusion mechanism of 7Li inferred for low-Li basaltic systems (Dohmen et al., 2010; Lynn et al., 2018). This interpretation is supported by our previous documentation of both normally and reversely zoned Li profiles in diverse olivine populations within these samples (Lynn et al., 2018). This indicates a common origin for the non-coupled Li profiles via re-equilibration after magma mixing, yielding timescales that range from hours to days that were interpreted to reflect late-stage magma mixing and ascent.
Charge Coupling of Li and P in Enrichment Peaks Record Crystal Growth
Lithium enrichment peaks are always positively correlated with P enrichments that are 10s to 100s of ppm higher than in regions of low P (e.g., Figures 2, 4). This coupled behavior is consistent with the charge balancing substitution reaction in Eq. 1 and therefore reflects growth, not diffusion. The high-resolution nanoSIMS measurements show systematic and positive correlation between P and Li within an enrichment peak (Figure 5C), indicating that Li in these regions is likely utilized for charge balancing. The similar widths of the Li and P peaks support this interpretation (Figure 4E). Lithium is also two orders of magnitude less abundant than P measured in the enrichment peaks (1–3 ppm vs. 100s of ppm; Figure 5), indicating that charge coupling will dominate the behavior of Li in these regions. This is consistent with interpretations of ppb level Li contents charge coupling with 102–104 ppm concentrations of Y + REE in zircon (Rubin et al., 2017; Tang et al., 2017; Wilson et al., 2017). Thus, we interpret that Li enrichment peaks are generated during crystal growth as Li+ ions in octahedrally coordinated Mg sites in olivine charge balance P5+ ions occupying tetrahedral sites (Woodland et al., 2004; Mallmann et al., 2009).
Lithium enrichments are inconsistently correlated with Al, another trace element that is commonly but not always associated with P zoning (Evans et al., 2008; Milman-Barris et al., 2008; Welsch et al., 2013, 2014; Zhukova et al., 2017; Shea et al., 2019). Uncommon correlations of Li and Al are likely a consequence of multiple charge balancing relationships that share P as a common element (e.g., Eqs 1, 3, and 4). Aluminum charge balances most of the P budget, the behavior of Al during crystal growth is different from P, and Al is frequently a marker for sector zoning in olivine, contrary to P zoning (Pack and Palme, 2003; Milman-Barris et al., 2008; Shea et al., 2019). Thus, the non-systematic correlation of Li with Al in enrichment peaks probably results from several charge balancing equations accommodating most of the budget of P-rich zones.
A Model of Coexisting Growth and Diffusion Signatures
Interpreting non-coupled vs. coupled Li signatures in olivine—and subsequently extracting timescales of magmatic processes from Li zoning—requires careful consideration of zoning variations in individual transects and distributions across 2D olivine sections. Current models of P zoning in olivine (e.g., Welsch et al., 2014) demonstrate how coupled and non-coupled (i.e., growth and diffusion) Li zoning patterns may occur within individual transects and single olivine crystals (Figure 6).
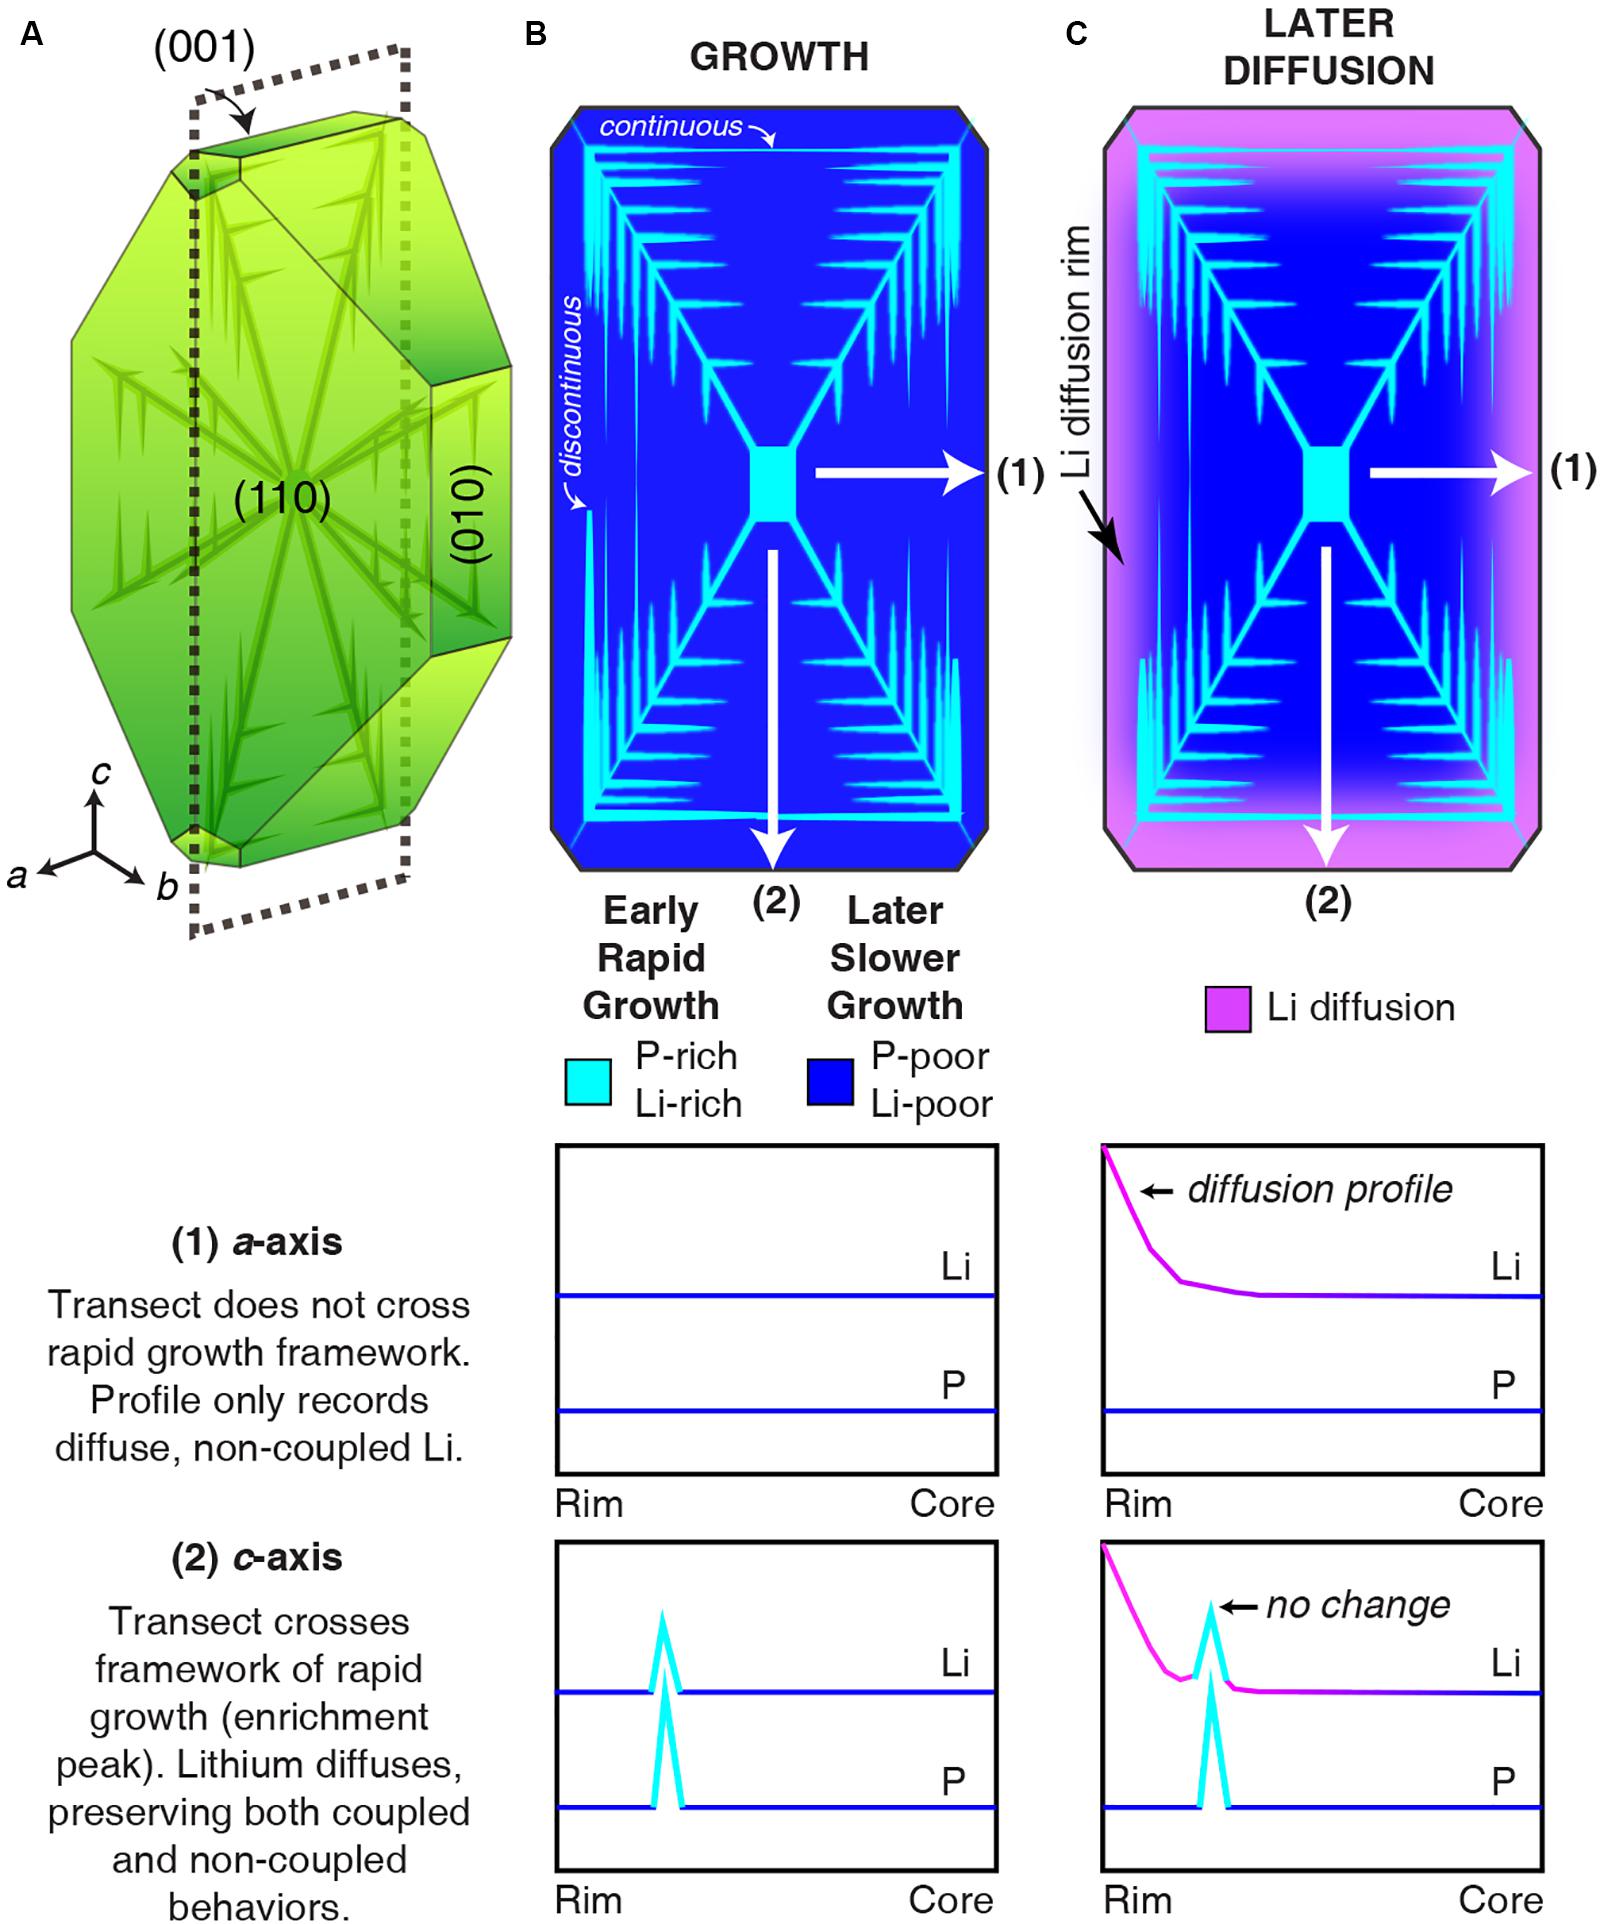
Figure 6. Illustration of Li and P zoning resulting from growth and diffusion. (A) Euhedral olivine crystal with volumetrically small P-rich skeletal structure (e.g., Welsch et al., 2014). Dashed line marks the plane of the section perpendicular to the b-axis. (B) Zoning of Li + P rich skeleton (light blue) from rapid growth surrounded by Li- and P-poor compositions from later slow growth during crystal maturation (dark blue). Li- and P-rich zones in secondary branches may be discontinuous or continuous. White lines mark the locations of compositional profiles presented below the section. (C) Zoning generated by subsequent diffusion of Li (pink rim). Transect 1 has a diffusive rim with no change to the Li enrichment peak. Transect 2 shows Li diffusion in the absence of growth-related enrichment peak zoning. P is unchanged throughout the diffusion process due to its slow diffusivity (Watson et al., 2015) and short time elapsed (hours to days) in this scenario.
The initial dendritic or hopper morphology of rapidly growing olivine (Donaldson, 1976) is recorded by P-rich (and by extension, Li-rich) zones (Figure 6A). Phosphorus zoning is concentrated during rapid crystal growth in both primary and secondary branches that are usually <10 μm wide; they represent a minor fraction of the olivine volume (Figure 6B, following Welsch et al., 2014). Most of the olivine volume has low P, as maturation of an initially skeletal crystal leads to in-filling under slower growth conditions. Thus, most of the area in 2D sections will have low P concentrations (a few 10s of ppm; Figure 6B). Because Li is interpreted to not charge balance low-P regions, non-coupled Li throughout most of the olivine volume permits diffusive re-equilibration as a dominant signature for zoning (Figure 6C, a-axis profile). Due to the complex distribution of P zoning in 3D, analytical traverses within a single 2D section may sample both fine-scale P-rich zones and low-P regions (Figure 6C, c-axis profile). Thus, individual profiles that exhibit both non-coupled and coupled Li behaviors record both crystal growth and subsequent diffusion processes.
Multiple transects collected within a single olivine crystal in this study record different Li and P zoning patterns as a result of this complex 3D distribution of trace elements. Within the olivine crystal in Figure 4, LA-ICPMS and nanoSIMS profiles located 100s of μm apart from each other record different trace element zoning patterns. Lithium exhibits dominantly non-coupled behavior in the LA-ICPMS profile where maximum P concentrations are up to ∼80 ppm. In contrast, the nanoSIMS profile reveals a clear enrichment peak of 700 ppm P and 3 ppm Li about 8 μm away from the crystal rim (Figure 4E). Differences in zoning between these profiles may be due to the loss of information from the 10-μm-wide LA-ICPMS analyses traverse (as discussed above). However, 2D sectioning through complex 3D distributions of trace elements likely also plays a role. The nanoSIMS ion image of P zoning in Figure 4E shows clearly decreasing counts along the length of the secondary branch toward the direction of the LA-ICPMS profile (Figure 4A). Thus, the Li- and P-rich zone sampled by the nanoSIMS traverse in Figure 4 is likely not continuous along the crystal face and was not sampled by the LA-ICPMS traverse. This example underscores the complexities of interpreting 1D transects that sample complex 3D distributions of trace elements in olivine. Collecting multiple traverses from well-oriented crystals is essential for using trace element zoning for robust interpretations of geologic processes.
Lithium Enrichment Peak Chronometry
Diffusion Models of Enrichment Peaks
Transects exhibiting both coupled and non-coupled Li behaviors (Figure 2) contradict the notion that rapid diffusion of Li in olivine should homogenize zoning over hours to days within basaltic systems. Here we apply diffusion models to the highly resolved nanoSIMS enrichment peaks of Li and P, as has been done for Li in zircon (e.g., Rubin et al., 2017), to assess the potential impacts of coupled diffusion on Li timescales. The results are used to determine whether these fine-scale features can be used to extract meaningful information about magmatic processes.
Coupled Li in enrichment peaks is likely controlled by the slower diffusion of P (Watson et al., 2015) because charge balanced elements within the olivine lattice are susceptible to sharing coupled fluxes during diffusive re-equilibration (Lasaga, 1979; Ganguly, 2002). Several diffusion models for the nanoSIMS Li profiles were run assuming either non-coupled or coupled behavior to test whether coupled fluxes influence Li diffusion in enrichment peaks. Non-coupled Li diffusion proceeds at the expected “slow” rate for Li in basaltic systems following the vacancy mechanism of Dohmen et al. (2010). Coupled Li diffusion is assumed to be slowed to the rate of phosphorus diffusion (DP; Watson et al., 2015) due to charge coupling. These assumptions yield radically different diffusion timescales because the diffusion coefficient for phosphorus at 1,200°C is 3.5 orders of magnitude slower than Li (DP = 10–18.1 m2/s vs. D7Li = 10–14.6 m2; Watson et al., 2015; Dohmen et al., 2010).
Finite difference diffusion models were applied to the coupled nanoSIMS peaks in Figure 4 to evaluate whether one or both of these diffusion coefficients are viable for applying Li geospeedometry in enrichment peaks. We used the non-concentration dependent one-dimensional form of Fick’s second law (Crank, 1975):
where C is concentration (ppm), t is time (s), D is the diffusion coefficient (m2/s), and x is distance (m). The diffusion coefficient of Li (D7Li) parallel to the c-axis can be calculated using the Arrhenius relation (Dohmen et al., 2010):
where T is temperature. This expression is appropriate for diffusion in olivine containing 1–10 ppm Li and temperatures 800–1,200°C (Dohmen et al., 2010). The diffusion coefficient of P in olivine can be calculated using the Arrhenius relation (Watson et al., 2015):
where R is the ideal gas constant (8.314 J/mol K). The Li enrichment peak was modeled using both D7Li and DP to assess potential timescales of non-coupled and coupled diffusion, respectively.
The model temperature was assumed to be constant at 1,237°C (taken from Li diffusion models in Lynn et al., 2018) and was calculated using the Kīlauea glass MgO thermometer (uncertainty of ±10°C; Helz and Thornber, 1987) and the inferred melt Mg# in equilibrium with olivine rim Fo contents (; Matzen et al., 2011). This value is akin to the magma temperature for mixing and diffusion recorded in the near-rim olivine composition (Lynn et al., 2017, 2018). This approach is suitable for our modeling here because the nanoSIMS enrichment peak is located very near to the crystal-melt boundary (Figure 4).
Initial conditions (C0; the composition of the enrichment peak prior to diffusion) have a high degree of uncertainty, and several were estimated due to the absence of a compositional plateau in the enrichment peak. We assessed this effect on retrieved timescales by testing four assumptions: (1) the initial peak had a flat plateau near the maximum measured concentration, (2) the initial peak had a “dipping plateau” akin to sectioning the enrichment peak off-center from its maximum value, (3) the initial peak plateau was higher than maximum measured value, and (4) the initial peak was tapered with a maximum value higher than that measured in the profile (Table 1). An additional model was run to fit the non-coupled region of the profile assuming that Li ions diffused through the enrichment peak without significantly modifying it. This follows the hypothesis of inter-site reaction diffusion, where Li ions may diffuse quickly through P-rich regions by hopping between site vacancies and/or interstitial sites and vacancies associated with P. This is analogous to previous studies of H+ diffusion in olivine, where H+ was decorating pre-existing defects associated with trace elements like Ti (Jollands et al., 2016). Boundary conditions were set to P and Li concentrations in the far field around the enrichment peaks, and Li values were constrained by the core composition measured by LA-ICPMS in Figure 4 and Table 1.
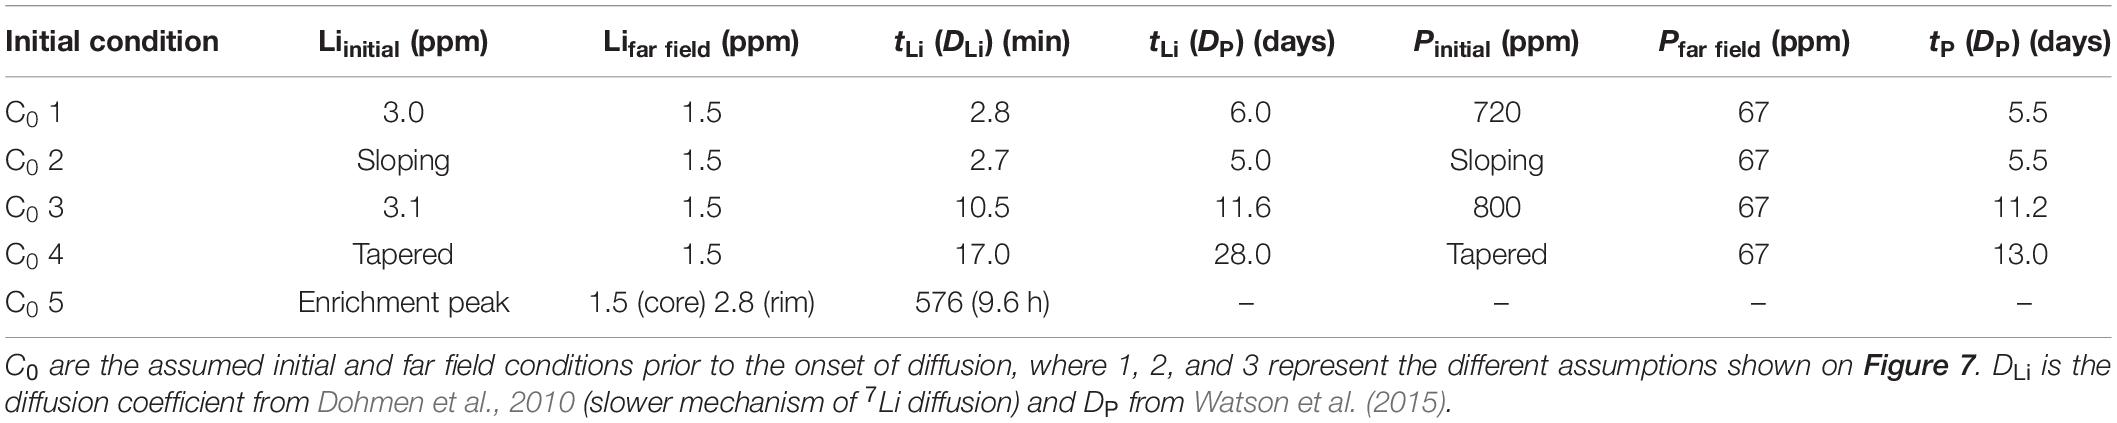
Table 1. Timescales of diffusive re-equilibration for diffusion models using the Unit K1 olivine 3 coupled enrichment peak in Figure 4.
Interpreting Enrichment Peak Timescales
Modeling the Li enrichment peak in Figure 4 using DLi (Dohmen et al., 2010) yields a diffusion timescale of 2.8–17 min depending on the initial condition assumptions (Table 1 and Figure 7). These timescales are far too short to reflect a magma mixing event prior to eruption, and they do not agree with timescales from non-coupled Li profiles (hours to days; Lynn et al., 2018). It is also unlikely that they represent the time elapsed between crystal growth and eruption. The short Li timescales are also inconsistent with diffusion timescales recorded by the P peak (using DP; Watson et al., 2015), which are much longer and range from 5.5 to 13 days (Table 1). Inconsistent Li and P timescales modeled here support the interpretation that Li + P are likely coupled in enrichment peak regions. Thus, Li enrichment peaks should not be modeled using DLi.
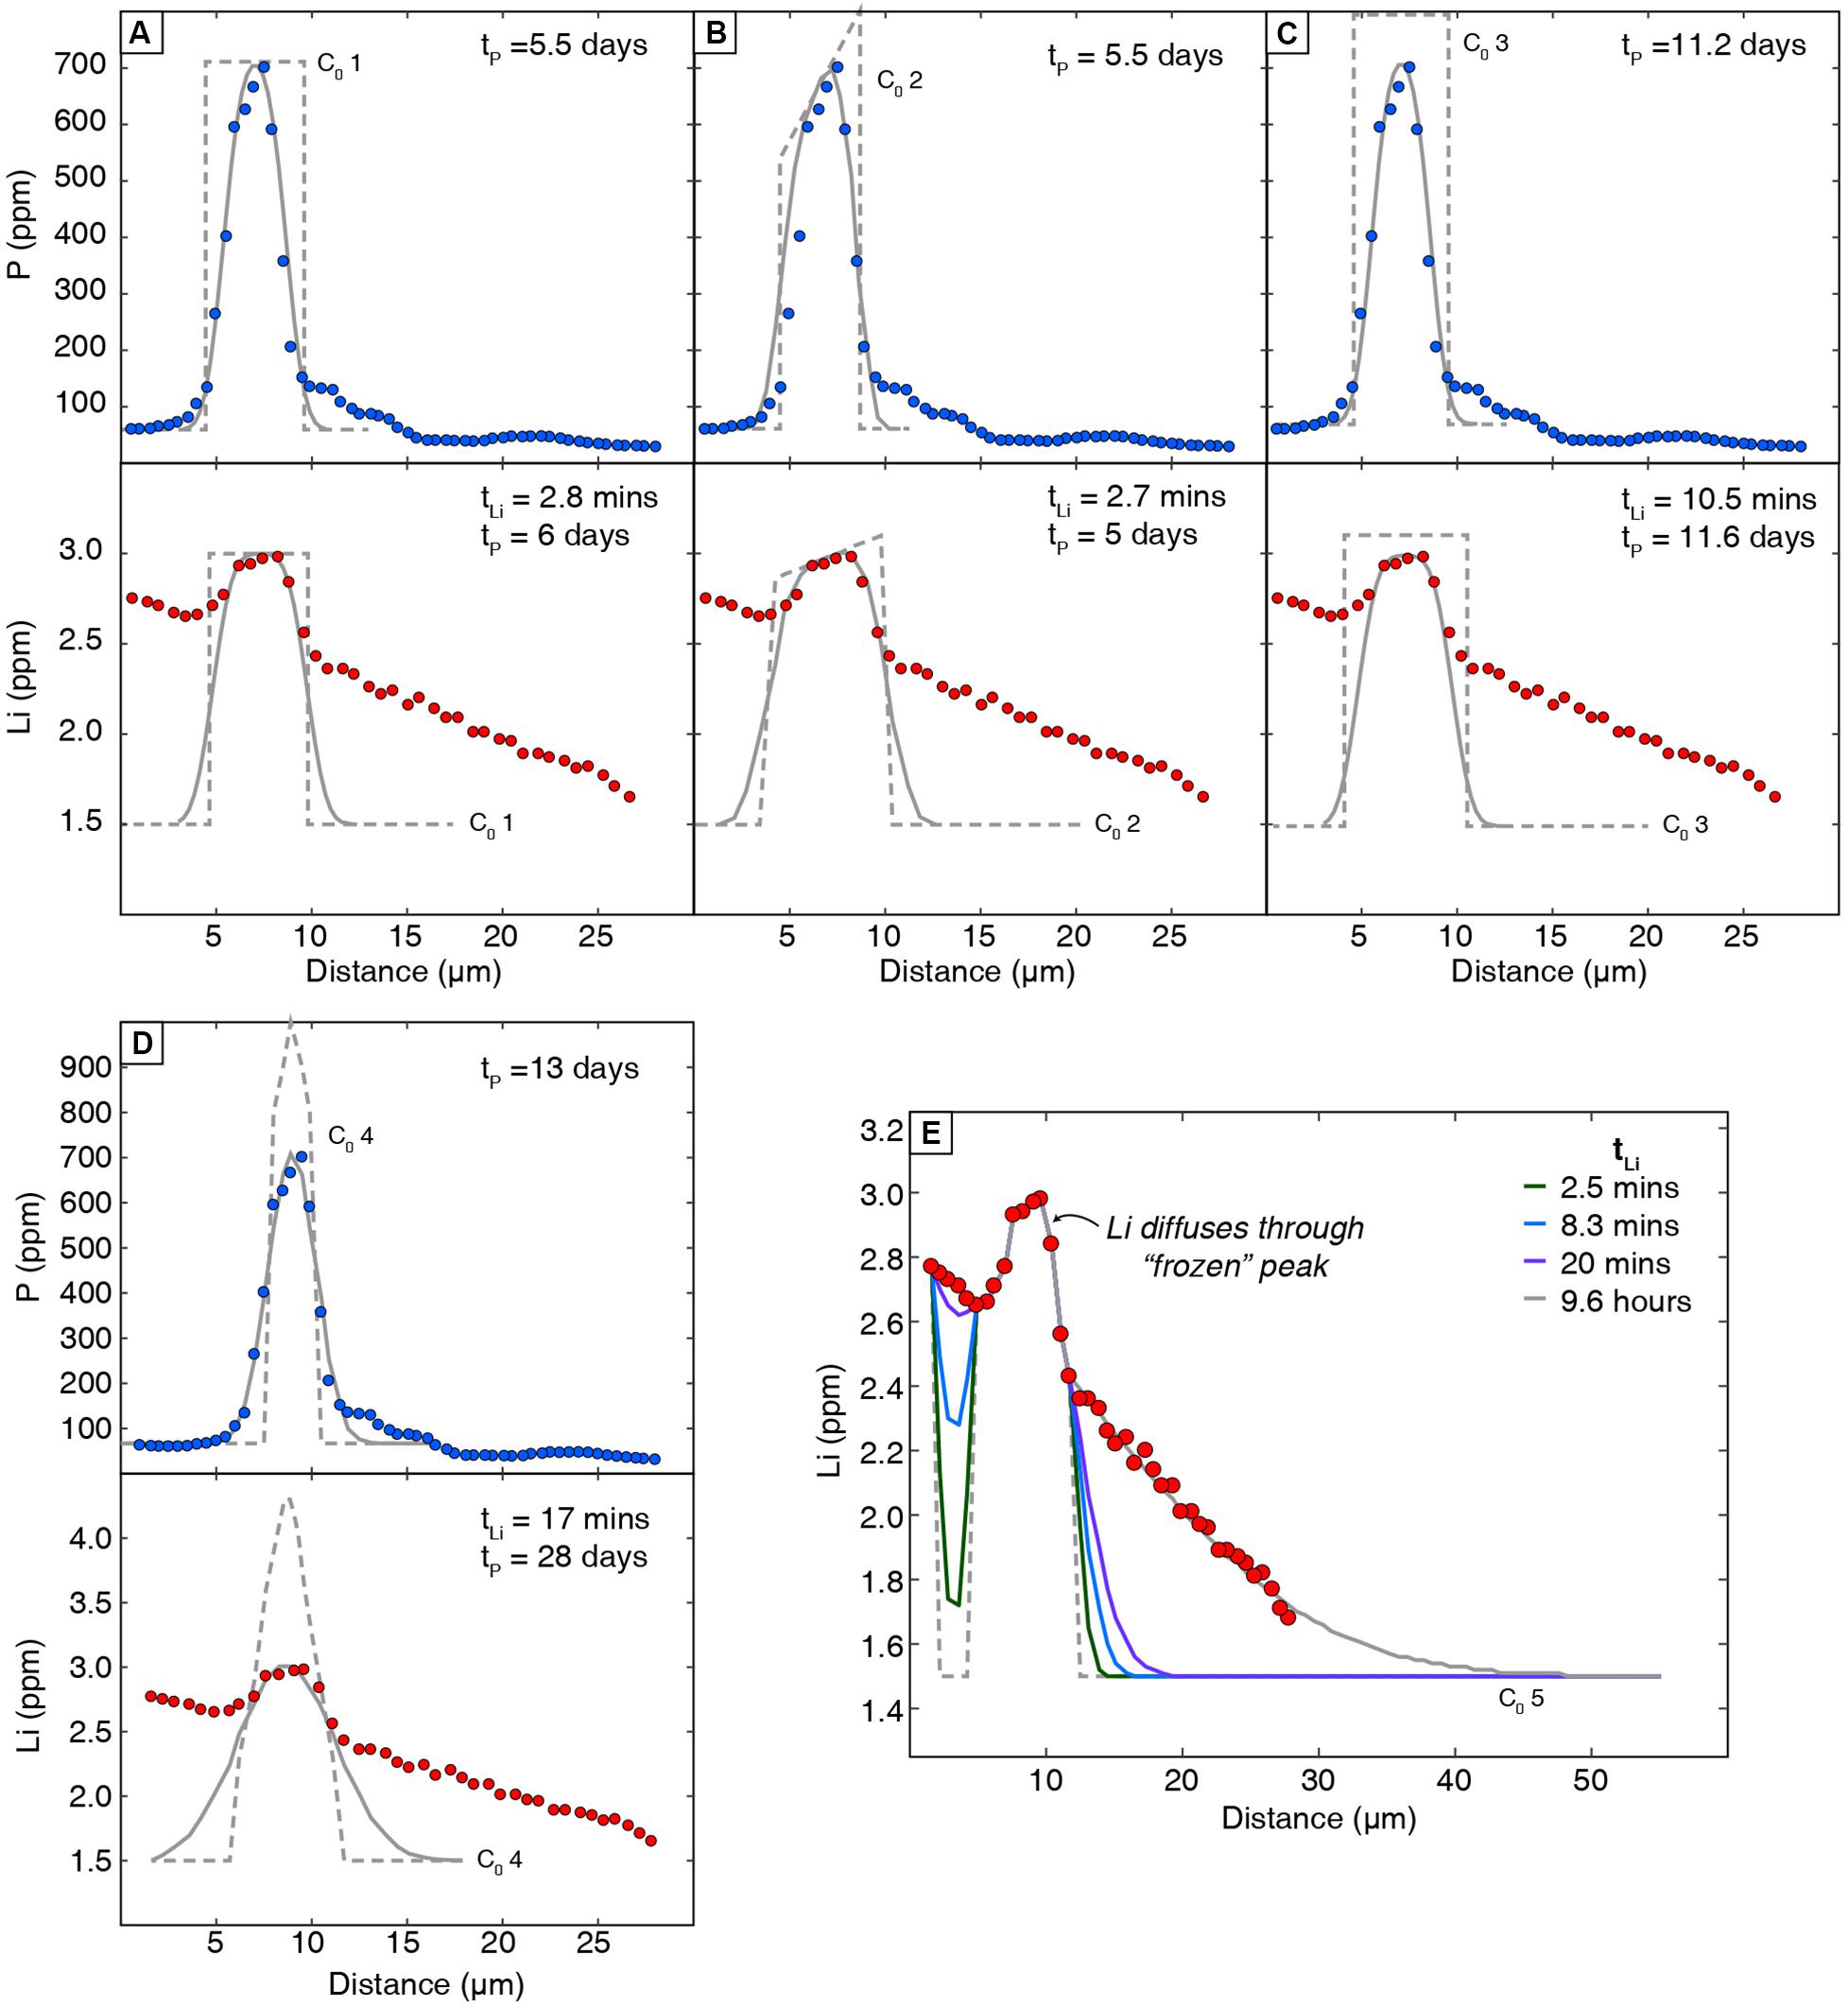
Figure 7. Diffusion models of Li and P enrichment peaks with different assumed initial conditions (C0; dashed lines). Analytical error on all nanoSIMS data is smaller than the symbol size. Model fits are shown in solid gray lines. Lithium peaks were modeled assuming that the sloped region surrounding the enrichment peak was generated by non-coupled Li diffusion and is not fit here. Initial conditions were constrained by the Li content at the core of the olivine crystal (1.5 ppm far field; from LA-ICPMS data in Figure 5) and different assumptions about peak compositions: (A) a flat plateau near the maximum value measured in the profile (C0 1), (B) a “sloping” plateau from a non-ideal section through the enrichment peak (C0 2), (C) a higher plateau than measured (actual value unknown; C0 3), and (D) a tapered initial condition with a maximum value greater than was measured (actual value unknown; C0 4). Li timescales represent models that utilized the diffusion coefficient for Li (tLi; Dohmen et al., 2010) and for P (tP; Watson et al., 2015). (E) Additional model to fit the non-coupled portion of the profile assuming inter-site reactions allows Li ions to diffuse through the enrichment peak without modifying it significantly (after models for H diffusion; Jollands et al., 2019).
If instead the Li peak is fit using the diffusion coefficient for P (Watson et al., 2015), the resulting Li timescales are broadly congruent with P and range from 5.0 to 28 days (Table 1). Regardless of the assumed initial conditions, congruent timescales derived from using DP to model both profiles suggest that Li in enrichment peaks is subject to coupled diffusive fluxes with P. These durations are also generally consistent with the late-stage magma mixing timescales of hours to days obtained from non-coupled Li zoning in other Kīlauea olivine crystals (generally hours to days, but up to a few weeks; Lynn et al., 2018). Thus, diffusion chronometry of enrichment peak features in olivine might need to account for coupled diffusive fluxes by using DP to model coupled Li behavior.
An additional model was run to fit the non-coupled portion of the nanoSIMS profile assuming that Li ions diffuse through the enrichment peak without significantly modifying it. Following this inter-site reaction hypothesis, the enrichment peak does not hinder the movement of Li ions, and the timescale retrieved reflects the non-coupled diffusion of Li from the olivine core to its rim. The retrieved timescale is 9.6 h, but we note that the 25-μm nanoSIMS profile lacks a clear core plateau and only samples a small part of the olivine rim. The 9.6-h duration is shorter than the timescale of several days modeled for the full crystal’s LA-ICP-MS profile in Figure 5, which is likely a symptom of incompletely measuring the full diffusion profile from core to rim.
Caveats and Challenges With Modeling Enrichment Peaks
Several caveats and challenges limit the application of enrichment peak chronometry despite the congruency between Li and P timescales derived from our nanoSIMS profiles. Interpreting timescales from enrichment peaks is made difficult by their 3D distribution within the olivine volume during initial rapid growth (e.g., Welsch et al., 2014). The enrichment peak from Figure 4 is located within 15 μm of the crystal-melt boundary and could plausibly be related to a late-stage process occurring shortly before eruption. However, there is increasing consensus that mineral chemistry from core to rim (following the canonical “tree-ring” approach) does not provide chronological records of the magmatic histories (e.g., Welsch et al., 2014; Shea et al., 2015b, 2019). Phosphorus-rich zones located near crystal rims can be products of early stages of crystal growth, invalidating the geologic interpretation of the timescales retrieved here.
Model temperatures are also uncertain, as the thermal history associated with the early crystal growth is not well recorded and the entire crystal history is likely not isothermal. Temperatures calculated for Kīlauea magmas using the glass MgO thermometer (Helz and Thornber, 1987) and the inferred melt MgO in equilibrium with the olivine forsterite content (using the Fe–Mg partition coefficient KD = 0.343 ± 0.008 of Matzen et al., 2011) likely record a more recent temperature history for the olivine crystals than the early P-rich zones experienced. Thus, a more detailed examination of P zoning in high resolution, the timescales derived from enrichment peaks, and their distribution across 2D sections is needed before using these features to characterize magmatic histories.
The enrichment peak diffusion timescales are also highly uncertain due to the absence of initial plateaus in our nanoSIMS data. Our retrieved timescales are largely insensitive to the shape of our initial conditions (flat vs. dipping plateau) but are strongly affected by the concentration chosen for the plateau (Figure 7). At present, few studies have measured P zoning profiles in high resolution (Bouvet de Maisonneuve et al., 2016; Manzini et al., 2017), and those profiles generally lack clear compositional plateaus. Fewer P profiles have been modeled for diffusive re-equilibration (e.g., Manzini et al., 2017), and uncertainty related to unknown initial conditions was not addressed. Because the P-rich zones introduce an extremely steep compositional contrast with nearby low-P regions (100s vs. 10s of ppm), P may never preserve an initial plateau, and constraining an appropriate initial condition would be impractical. The assumption of a step function across branch may also be inappropriate—growth models of fine-scale P-rich zones show they are subject to micrometer-scale P zoning at their edges instead of sharp boundaries with adjacent low-P regions (Shea et al., 2019). In this case, the measured enrichment peaks may dominantly reflect crystal growth and minimal diffusive re-equilibration.
A remaining challenge with enrichment peaks is understanding how Li ions diffuse within peaks and/or the regions surrounding them. The assumptions of coupled diffusion for the models above follow recent studies on zircon in assuming that Li mobility is dependent on P in these regions and diffusion through the peaks is slowed relative to adjacent regions. However, Li may hop between sites and vacancies in the olivine lattice via an inter-defect site reaction behavior, as has been shown for H+ (e.g., Jollands et al., 2016, 2019). If Li diffusion occurs via site reactions, then the assumption of Li and P diffusive coupling (DLi = DP) is invalid. Inter-defect site reactions would allow Li to diffuse through the peak regions, rather than being slowed within them. Regardless of how Li behaves in/around peak regions, we maintain that enrichment peak features should not be modeled for timescales.
Finally, collecting enough Li and P enrichment peak profiles for accurate timescales modeling is both analytically challenging and potentially expensive. At least 20 profiles are needed to accurately constrain diffusion timescales in a given olivine population, and complex zoning or magmatic histories warrant more (Shea et al., 2015a). Measurements of Li and P by nanoSIMS require different primary beams (16O– and 133Cs+, respectively), so the minimum number of timescales suggested by Shea et al. (2015a) requires at least 40 profiles measured by nanoSIMS to characterize 20 enrichment peaks. Given the caveats, challenges, and analytical difficulty of measuring and modeling nanoSIMS profiles of Li and P, fine-scale enrichment peaks in olivine are unlikely to be viable chronometers for most studies.
Guidelines for Applying Lithium Geospeedometry in Olivine
The dual behavior of both coupled and non-coupled Li zoning within individual olivine crystals provides a framework on how to apply Li geospeedometry in basaltic systems. Diffuse, non-coupled profiles of Li should be modeled using DLi (vacancy mechanism from Dohmen et al., 2010; Lynn et al., 2018). This approach is applicable to both normally and reversely zoned lithium profiles to provide timescales for magma mixing events shortly (hours to days) before eruption in basaltic systems. Lithium enrichment peaks in olivine should only be modeled if high-resolution analyses resolve many peaks well (e.g., with nanoSIMS), an initial plateau can be identified, and better constraints on the diffusion mechanism controlling Li in peak regions (e.g., coupled, inter-defect site reactions) can be defined. Ideally, these coupled Li timescales should also be interpreted in context with other diffusion chronometers.
The complexities arising from coupled Li behavior may be avoided by modeling only non-coupled Li profiles that are greater than a few 10s of μm wide, minimizing the risk of increasing Li at the rim caused by coupled enrichments of P and Li. Coupled Li and P can also be avoided by preferentially selecting and measuring well-oriented olivine crystals. Crystals with obvious skeletal morphologies (Figure 6) should be avoided because they represent the blueprint of crystal growth with pervasive P-rich zones. In the case of thin sections, crystals should be screened for those closest to perpendicular to the a- or b-axis, and 1D traverses should be taken in the center of well-defined crystal faces to take advantage of incomplete secondary branching (e.g., Figure 4).
Ideally, euhedral olivine crystals should be sectioned through crystal cores, perpendicular to a crystallographic axis. Preferential sectioning of olivine crystals perpendicular to the a-axis and traverses parallel to the b-axis would be most likely to yield non-coupled Li profiles for modeling. Olivine crystals are commonly initially elongated along the a-axis, and branches rich in Li and P are concentrated in the a–c plane during rapid growth (Mourey and Shea, 2019). Subsequent maturation and slower olivine growth occur along the b-axis, resulting in low-P regions that allow diffusive re-equilibration of non-coupled Li. Sectioning perpendicular to the b-axis and measuring parallel to the c- or a-axis may reduce the chances of crossing P-rich zones (Welsch et al., 2014; cf. our Figure 1A).
Conclusion
Carefully oriented and sectioned olivine crystals provide a unique opportunity to document trace element zoning and the timescales of processes in basaltic magmas. Profiles using Li zoning are especially important for characterizing magma mixing events just prior to eruption (hours to days). Combining profiles of Li and P zoning using EMPA, LA-ICPMS, and nanoSIMS methods in rapidly quenched olivine from explosive Kīlauea eruptions reveals systematic differences between records of crystal growth and subsequent diffusive re-equilibration.
(1) Lithium and phosphorus have two distinct relationships in olivine: (a) non-coupled, wherein Li diffuses over 10–300 μm of low P concentrations (a few 10s of ppm) and is amenable to diffusion modeling, and (b) coupled, in which Li and P covary positively and reflect a framework of rapid crystal growth.
(2) Both non-coupled and coupled behaviors can be preserved in a single crystal because the dendritic nature of early rapid growth results in trace element enrichments that are volumetrically limited within the olivine. The preservation of Li and P enrichment peaks within diffusion profiles is a consequence of Li maintaining local (e.g., few μm scale) growth-induced charge balancing with P.
(3) Li is always systematically coupled to P enrichments, although P zoning may also be correlated with other trace elements (e.g., Al). We interpret this to reflect crystal growth processes and the role of P in driving the charge balancing requirements in the olivine lattice.
(4) Robust interpretations of trace element zoning documented by 1D analytical transects require knowledge of the 2D and 3D spatial distribution given the complexity of zoning generated during crystal growth.
These observations provide a framework for identifying Li profiles suitable for diffusion modeling. The following practical guidelines are recommended:
• Avoid crystals with skeletal or dendritic morphologies. They probably contain pervasive P-rich zones with coupled Li.
• Euhedral crystals should be preferentially sectioned perpendicular to the a- or b-axis. For randomly sectioned olivine (i.e., thin sections), crystals should be screened to avoid sections highly oblique to the a- or b-axis.
• Analytical traverses should be taken parallel to crystallographic axes and in the center of well-formed faces to maximize potential of sampling between incomplete secondary branches. Two optimal orientations for measuring non-coupled Li are (1) perpendicular to the a-axis with a traverse measured parallel to the b-axis and (2) perpendicular to the b-axis with traverses measured parallel to either the a- or c-axis.
• Collect Li and P data concurrently to discern if profiles are significantly affected by charge coupling. If P data are unavailable, modeling diffuse non-coupled Li that is both normally and reversely zoned within a single eruption (e.g., as a result of magma mixing) is suitable.
• Model only wider non-coupled profiles (many 10s of μm) with a well-defined core plateau delineating the initial conditions.
The complexities documented here for olivine highlight the need for careful geochemical studies using well-oriented crystals to resolve the disparate interpretations drawn from trace element zoning in other silicate minerals such as zircon.
Data Availability Statement
All datasets generated for this study are included in the article/Supplementary Material.
Author Contributions
KL conducted LA-ICPMS, EPMA, and EBSD analyses. KL and MG collected nanoSIMS data. All authors assisted in sample collection, contributed to the interpretations. KL led the writing of the manuscript.
Funding
This work was supported by the Fred M. Bullard Graduate Fellowship at the University of Hawai‘i and the National Science Foundation (NSF) East Asia and Pacific Summer Institutes grant OISE1513668 to KL. Additional support was provided by NSF grants EAR1347915 and EAR1449744 to MG, and EAR1725321 to TS. This is SOEST contribution number 10977.
Conflict of Interest
The authors declare that the research was conducted in the absence of any commercial or financial relationships that could be construed as a potential conflict of interest.
Acknowledgments
We thank the Smithsonian Institution National Museum of Natural History for San Carlos standard NMNH 111312-42 and Erik Hauri for unpublished trace element values for this specific split of the standard. We thank Eileen Chen for support with sample preparations, and for assistance with analytical techniques, we also thank Eric Hellebrand (EPMA), Gareth Fabbro and Fidel Costa (LA-ICPMS), and Zan Peeters and Maitrayee Bose (nanoSIMS). We appreciate editorial handling by DN and constructive reviews from PT and EM, which helped to improve this manuscript.
Supplementary Material
The Supplementary Material for this article can be found online at: https://www.frontiersin.org/articles/10.3389/feart.2020.00135/full#supplementary-material
References
Agrell, S. O., Charnley, N. R., and Ghinner, G. A. (1998). Phosphoran olivine from Pine Canyon, Piute Co., Utah. Miner. Mag. 62, 265–269. doi: 10.1180/002646198547620
Beck, P., Chaussidon, M., Barrat, J. A., Gillet, P. H., and Bohn, M. (2006). Diffusion induced Li isotopic fractionation during the cooling of mafic rocks: the case of pyroxene phenocrysts from nakhlite meteorites. Geochim. Cosmochim. Acta 70, 4813–4825.
Boesenberg, J. S., Ebel, D. S., and Hewins, R. H. (2004). An Experimental Study of Phosphoran Olivine and its Significance in Main Group Pallasites. Houston, TX: Lunar Planet Sci Conf, 1366.
Boesenberg, J. S., and Hewins, R. H. (2010). An experimental investigation into the metastable formation of phosphoran olivine and pyroxene. Geochim. Cosmochim. Acta 74, 1923–1941. doi: 10.1016/j.gca.2009.12.008
Bouvet de Maisonneuve, C., Costa, F., Huber, C., Vonlanthen, P., Bachmann, O., and Dungan, M. A. (2016). How do olivines record magmatic events? Insights from major and trace element zoning. Cont. Min. Petrol. 171:56. doi: 10.1007/s00410-016-1264-6
Charlier, B. L. A., Morgan, D. J., Wilson, C. J. N., Wooden, J. L., Allan, A. S. R., and Baker, J. A. (2012). Lithium concentration gradients in feldspar and quartz record the final minutes of magma ascent in an explosive supereruption. Earth Planet. Sci. Lett. 319-320, 218–227. doi: 10.1016/j.epsl.2011.12.016
Cooper, K. M., Till, C. B., Kent, A. J. R., Costa, F., Rubin, A. E., Gravley, D., et al. (2017). Response to comment on “Rapid cooling and cold storage in a silicic magma reservoir recorded in individual crystals. Science 358, 1–2. doi: 10.1126/science.aam8720
Dohmen, R., Kasemann, S. A., Coogan, L., and Chakraborty, S. (2010). Diffusion of Li in olivine. Part I: experimental observations and a multi species diffusion model. Geochim. Cosmochim. Acta 74, 274–292. doi: 10.1016/j/gca.2009.10.1016
Donaldson, C. H. (1976). An experimental investigation of olivine morphology. Contrib. Miner. Petrol. 57, 187–213. doi: 10.1007/BF00405225
Edmonds, M. (2015). Partitioning of light lithophile elements during basalt eruptions on Earth and application to Martial shergottites. Earth Planet. Sci. Lett. 411, 142–150. doi: 10.1016/j.epsl.2014.11.034
Ellis, B. S., Szymanowski, D., Magna, T., Neukampf, J., Dohmen, R., Bachmann, O., et al. (2018). Post-eruptive mobility of lithium in volcanic rocks. Nat. Commun. 9:3228. doi: 10.1038/s41467-018-05688-2
Evans, T. M., O’Neill, H. S. C., and Tuff, J. (2008). The influence of melt composition on the partitioning of REEs, Y, Sc, Zr, and Al between forsterite and melt in the system CMAS. Geochim. Cosmochim. Acta 72, 5708– 5721.
Gallagher, K., and Elliott, T. (2009). Fractionation of lithium isotopes in magmatic systems as a natural consequence of cooling. Earth Planet. Sci. Lett. 278, 286–296. doi: 10.1016/j.epsl.2008.12.009
Ganguly, J. (2002). Diffusion kinetics in minerals: principles and applications to tectono-metamorphic processes. EMU Notes Miner. 4, 271–309.
Garcia, M. O., Mucek, A. E., Lynn, K. J., Swanson, D. A., and Norman, M. D. (2018). “Geochemical evolution of Keanakako‘i Tephra, Kīlauea Volcano, Hawai‘i,” in Field Volcanology: A Tribute to the Distinguished Career of Don Swanson, eds M. Poland, M. Garcia, V. Camp, and A. Grunder (London: Geol Soc Am Sp Pap), 538.
Grant, K. J., and Wood, B. J. (2010). Experimental study of the incorporation of Li, Sc, Al, and other trace elements into olivine. Geochim. Cosmochim. Acta 74, 2412–2428. doi: 10.1016/j.gca.2010.01.015
Helz, R. T., and Thornber, C. R. (1987). Geothermometry of Kilauea Iki lava lake Hawaii. Bull. Volc. 49, 651–688.
Jochum, K. P., Weis, U., Schwager, B., Stoll, B., Wilson, S. A., Haug, G. H., et al. (2016). Reference values following ISO guidelines for frequently requested rock reference materials. Geostand. Geoanal. Res. 40, 333–350. doi: 10.1111/j.1751-908X.2015.00392.x
Jochum, K. P., Weis, U., Stoll, B., Kuzmin, D., Qichao, Y., Raczek, I., et al. (2011). Determination of reference values for NIST SRM 610-617 glasses following ISO guidelines. Geostand. Geoanal. Res. 35, 397–429. doi: 10.1111/j.1751-908X.2011.00120.x
Jollands, M. C., Hermann, J., O’Neill, H. St. C., Spandler, C., and Padrón-Navarta, J. A. (2016). Diffusion of Ti and some divalent cations in olivine as a function of temperature, oxygen fugacity, chemical potentials and crystal orientation. J. Petrol. 57, 1983–2010. doi: 10.1093/petrology/egw067
Jollands, M. C., Kempf, E., Hermann, J., and Müntener, O. (2019). Coupled inter-site reaction and diffusion: rapid dehydrogenation of silicon vacancies in natural olivine. Geochim. Cosmichim. Acta 262, 220–242. doi: 10.1016/j.gca.2019.07.025
Lasaga, A. C. (1979). Multicomponent exchange and diffusion in silicates. Geochim. Cosmochim. Acta 43, 455–469. doi: 10.1016/0016-7037(79)90158-3
Lynn, K. J., Garcia, M. O., Shea, T., and Costa, F. (2017). Timescales of mixing and storage for Keanakāko‘i Tephra magmas (1500-1823 C.E.), Kīlauea Volcano, Hawai‘i. Contrib. Miner. Petrol. 172:76. doi: 10.1007/s00410-017-1395-4
Lynn, K. J., Shea, T., Garcia, M. O., Costa, F., and Norman, M. D. (2018). Lithium diffusion in olivine records magmatic priming of explosive basaltic eruptions. Earth Planet. Sci. Lett. 500, 127–135. doi: 10.1016/j.epsl.2018.08.002
Mallmann, G., O’Neill, H. S. C., and Klemme, S. (2009). Heterogeneous distribution of phosphorus in olivine from otherwise well-equilibrated spinel peridotite xenoliths and its implications for the mantle geochemistry of lithium. Contrib. Miner. Pet. 158, 485–504. doi: 10.1007/s00410-009-0393-6
Manzini, M., Bouvier, A.-S., Baumgartner, L. P., Müntener, O., Rose-Koga, E. F., Schiano, P., et al. (2017). Weekly to monthly time scale of melt inclusion entrapment prior to eruption recorded by phosphorus distribution in olivine from mid-ocean ridges. Geology 45, 1059–1062. doi: 10.1130/G39463.1
Matzen, A. K., Baker, M. B., Beckett, J. R., and Stolper, E. M. (2011). Fe–Mg partitioning between olivine and high-magnesian melts and the nature of Hawaiian parental liquids. J. Petrol. 52, 1243–1263. doi: 10.1093/petrology/egq089
Milman-Barris, M. S., Beckett, J. R., Backer, M. B., Hofmann, A. E., Morgan, Z., Crowley, M. R., et al. (2008). Zoning of phosphorus in igneous olivine. Contrib. Miner. Pet. 155, 739–765. doi: 10.1007/s00410-007-0268-7
Mourey, A. J., and Shea, T. (2019). Forming olivine phenocrysts in basalt: a 3D characterization of growth rates in laboratory experiments. Front. Earth Sci. 7:300. doi: 10.3389/feart.2019.00300
Pack, A., and Palme, H. (2003). Partitioning of Ca and Al between forsterite and silicate melt in dynamic systems with implications for the origin of Ca, Al-rich forsterites in primitive meteorites. Meteorl. Planet. Sci. 38, 1263–1281.
Parkinson, I. J., Hammond, S. J., James, R. H., and Rogers, N. W. (2007). High-temperature lithium isotope fractionation: insights from lithium isotope fractionation in magmatic systems. Earth Planet. Sci. Lett. 257, 609–621. doi: 10.1016/j.epsl.2007.03.023
Paton, C., Hellstrom, J., Paul, B., Woodhead, J., and Hergt, J. (2011). Iolite: freeware for the visualization and processing of mass spectrometric data. J. Anal. At Spectrom. 26:2508. doi: 10.1039/c1ja10172b
Rubin, A. E., Cooper, K. M., Till, C. B., Kent, A. J. R., Costa, F., Bose, M., et al. (2017). Rapid cooling and cold storage in a silicic magma reservoir recorded in individual crystals. Science 356, 1154–1156.
Seitz, S., Putlitz, B., Baumgartner, L., Meibom, A., Escrig, S., and Bouvier, A.-S. (2018). A nanoSIMS investigation on timescales recorded in volcanic quartz from the silicic Chon Aike Province (Patagonia). Front. Earth Sci. 6:95. doi: 10.3389/feart.2018.00095
Shea, T., Hammer, J., Hellebrand, E., Mourey, A., Costa, F., First, E., et al. (2019). Phosphorus and aluminum zoning in olivine: contrasting behavior of two nominally incompatible trace elements. Contrib. Miner. Petrol. 174:85. doi: 10.1007/s00410-019-1618-7
Shea, T., Costa, F., Krimer, D., and Hammer, J. E. (2015a). Accuracy of timescales retrieved from diffusion modeling in olivine: a 3D perspective. Am. Miner. 100, 2026–2042. doi: 10.2138/am-2015-5163
Shea, T., Lynn, K. J., and Garcia, M. O. (2015b). Cracking the olivine zoning code: distinguishing between crystal growth and diffusion. Geology 43, 935–938. doi: 10.1130/G37082.1
Sliwinski, J. T., Keuter, N., Marxer, F., Ulmer, P., Guillong, M., and Bachmann, O. (2018). Controls on lithium concentration and diffusion in zircon. Chem. Geol. 501, 1–11. doi: 10.1016/jchemgeo.2018.09.038
Spandler, C., and O’Neill, H. S. (2010). Diffusion and partition coefficients of minor and trace elements in San Carlos olivine at 1,300°C with some geochemical implications. Contrib. Miner. Pet. 159, 791–818. doi: 10.1007/s00410-009-0456-8
Swanson, D. A., Rose, T. R., Fiske, R. S., and McGeehin, J. P. (2012). Keanakāko‘i Tephra produced by 300 years of explosive eruptions following collapse of Kīlauea’s caldera in about 1500 C.E. J. Volcanol. Geotherm. Res. 21, 8–25. doi: 10.1016/j.jvolgeores.2011.11.009
Tang, M., Rudnick, R., McDonough, W. F., Bose, M., and Goreva, Y. (2017). Multi-mode Li diffusion in natural zircons: evidence for diffusion in the presence of step-function concentration boundaries. Earth Planet. Sci. Lett. 474, 110–119. doi: 10.1016/j.epsl.2017.06.034
Tomascak, P. B., Magna, T., and Dohmen, R. (2016). Advances in Lithium Isotope Geochemistry. Switzerland: Springer International Publishing.
Trail, D., Cherniak, D. J., Watson, E. B., Harrison, T. M., Weiss, B. P., and Szumila, I. (2016). Li zoning in zircon as a potential geospeedometer and peak temperature indicator. Contrib. Miner. Petrol. 171:25. doi: 10.1007/s00410-016-1238-8
Ushikubo, T., Kita, N. T., Cavosie, A. J., Wilde, S. A., Rudnick, R. L., and Valley, J. W. (2008). Lithium in Jack Hills zircons: evidence for extensive weathering of Earth’s earliest crust. Earth Planet. Sci. Lett. 272, 666–676. doi: 10.1016/j.epsl.2008.05/032
Vlastélic, I., Staudacher, T., Bachélery, P., Télouk, P., Neuville, D., and Benbakkar, M. (2011). Lithium isotope fractionation during magma degassing: constraints from silicic differentiates and natural gas condensates from Piton de la Fournaise volcano (Réunion Island). Chem. Geol. 284, 26–34. doi: 10.1016/j.chemgeo.2011.02.002
Watson, E. B., Cherniak, D. J., and Holycross, M. E. (2015). Diffusion of phosphorus in olivine and molten basalt. Am. Miner. 100, 2053–2065. doi: 10.2138/am-2015-5416
Welsch, B., Faure, F., Famin, V., Baronnet, A., and Bachèlery, P. (2013). Dendritic crystallization: a single process for all textures of olivine in basalts? J. Petrol. 54, 539–574. doi: 10.1093/petrology/egs077
Welsch, B., Hammer, J. E., and Hellebrand, E. (2014). Phosphorus reveals dendritic architecture of olivine. Geology 42, 867–870. doi: 10.1130/G35691.1
Weyer, S., and Seitz, H.-M. (2012). Coupled lithium- and iron isotope fractionation during magmatic differentiation. Chem. Geol. 294-295, 42–50. doi: 10.1016/j.chemgeo.2011.11.020
Wilson, C. J. N., Morgan, D. J., Charlier, B. L. A., and Barker, S. J. (2017). Comment on “Rapid cooling and cold storage in a silicic magma reservoir recorded in individual crystals. Science 8429, 1–2. doi: 10.1126/science.aap8429
Woodland, A. B., Seitz, H. M., and Yaxley, G. M. (2004). Varying behavior of Li in metasomatised spinel peridotite xenoliths from western Victoria, Australia. Lithos 75, 55–66. doi: 10.1016/j.lithos.2003.12.014
Zhang, Y. (2010). Diffusion in minerals and melts: theoretical background. RIMG 72, 5–59. doi: 10.2138/rmg.2010.72.2
Keywords: olivine, diffusion, trace element zoning, crystal growth, Kīlauea, Hawai‘i
Citation: Lynn KJ, Garcia MO and Shea T (2020) Phosphorus Coupling Obfuscates Lithium Geospeedometry in Olivine. Front. Earth Sci. 8:135. doi: 10.3389/feart.2020.00135
Received: 10 January 2020; Accepted: 14 April 2020;
Published: 22 May 2020.
Edited by:
David A. Neave, University of Manchester, United KingdomReviewed by:
Peter Tollan, ETH Zürich, SwitzerlandEuan James Forsyth Mutch, University of Maryland, United States
Copyright © 2020 Lynn, Garcia and Shea. This is an open-access article distributed under the terms of the Creative Commons Attribution License (CC BY). The use, distribution or reproduction in other forums is permitted, provided the original author(s) and the copyright owner(s) are credited and that the original publication in this journal is cited, in accordance with accepted academic practice. No use, distribution or reproduction is permitted which does not comply with these terms.
*Correspondence: Kendra J. Lynn, a2pseW5uQHVkZWwuZWR1