 Tom Sheldrake
 Luca Caricchi
 Marco Scutari
95% of researchers rate our articles as excellent or good
Learn more about the work of our research integrity team to safeguard the quality of each article we publish.
Find out more
ORIGINAL RESEARCH article
Front. Earth Sci. , 05 May 2020
Sec. Volcanology
Volume 8 - 2020 | https://doi.org/10.3389/feart.2020.00127
Linking tectonic setting to eruptive activity in volcanic arcs provides a framework to understand processes that control the production, accumulation and eruption of magma on Earth. We use the Holocene eruptive records of 162 volcanoes, which are selected based on an assessment of recording biases, to calculate the probability of recording large eruptions (between Magnitudes 4 and 7). We quantify regional variability in the sizes of volcanic eruptions and compare it with subduction parameters influencing the generation, transport and storage of magma. Given the tectonic setting of a subduction zone is multidimensional (e.g., age, speed, obliquity of the subducting plate) we use a graphical model to explore the strength of probabilistic relationships between tectonic and volcanic variables. The variable that exhibits the strongest probabilistic relationship with eruption size is convergence obliquity, with larger eruptions favored in settings where convergence is normal. Normal convergence favors the storage and accumulation of larger volumes of magma, whereas oblique convergence favors the transport and eruption of smaller volumes of magma. In low-obliquity arcs where magma storage is promoted, the subduction of older slabs results in higher mantle productivity, which thermally favors the accumulation of eruptible magma and larger eruptions on average. However, the highest mantle productivity also results in more frequent magma injection and pressurization of crustal reservoirs. Consequently, arcs with moderate slab ages and low obliquity produce the highest proportion of larger eruptions. In high-obliquity arcs mantle productivity does not dominantly control eruption sizes. Instead, thinner crust facilitates frequent transport of magma to the surface, resulting in smaller eruptions. For the largest eruptions on Earth (e.g., Magnitude 8), however, accumulation of eruptible magma will be dominantly controlled by thermomechanical modification of the crust and not the frequency of magma intrusion. Despite the importance of convergence obliquity, our results show that variability in the sizes of volcanic eruptions is controlled by complex relationships with other parameters including slab age and crustal thickness. By using a graphical model, we have been able to explore complex volcano-tectonic relationships. We suggest a similar approach could be extremely valuable for exploring other complex multidimensional datasets within the Earth Sciences.
Establishing the connection between large-scale tectonics and volcanic activity requires a conceptualisation of magmatic systems and the identification of potential factors that influence their temporal evolution. At convergent margins, the dehydration of subducting oceanic lithosphere induces partial melting of the mantle wedge, together with a contribution from decompression melting (Grove et al., 2009; England and Katz, 2010; Karlstrom et al., 2014). The thermal structure of the mantle wedge, together with the amount of water supplied by the dehydrating slab are important factors controlling where and how much melting is produced (Syracuse and Abers, 2006; Cagnioncle et al., 2007; van Keken et al., 2008; England and Katz, 2010; Karlstrom et al., 2014; Turner and Langmuir, 2015a, b). Modeling indicates that convergence rate and dip of the subducting slab exert a dominant control on the thermal structure of the mantle wedge (England et al., 2004; van Keken et al., 2008; Grove et al., 2009). Additionally, the age of the slab influences the amount of melting occurring within the mantle wedge. Older oceanic lithosphere is more likely to be affected by hydrothermal alteration, which results in larger amounts of H2O being released during subduction leading to higher degree of partial melting of the mantle wedge (Poli and Schmidt, 2002). The effect of large-scale subduction architecture can be appreciated using the global geochemistry of magmatic rocks, in which incompatible trace elements correlate negatively with the thermal parameter of the slab (a product of the vertical descent rate and age of the subducting slab; Kirby et al., 1991), and positively with the thickness of the arc crust (Turner and Langmuir, 2015a, b). Additionally, a positive correlation has been observed between the arc-normal rate of plate convergence and the density of calderas, which was suggested as an expression of the association between high magma productivity in the mantle (assumed proportional to the convergence rate) and large volcanic eruptions (Hughes and Mahood, 2008).
Large volcanic eruptions are commonly fed by upper crustal reservoirs in which magma may reside for up to several hundreds to thousands of years (Cooper, 2019). The volumes and timescales over which eruptible magma is present depend on the thermal, chemical and physical evolution of magma reservoirs (Marsh, 1981; Jellinek and DePaolo, 2003; Huber et al., 2009; Caricchi and Blundy, 2015), which is intrinsically linked to the flux of magma intruded and rate of heat loss to the surrounding crustal rocks (Annen, 2009; Degruyter and Huber, 2014; Karakas et al., 2017). The ability to accumulate large volumes of eruptible magma in upper crustal reservoirs will depend upon the thermomechanical environment of the surrounding crust, and it’s ability to store rather than erupt magma (Jellinek and DePaolo, 2003; Karlstrom et al., 2017). The thermal maturation of the crust will promote magma storage (e.g., drop of crust viscosity; Jellinek and DePaolo, 2003) and the accumulation of the large volume of magma required to feed the largest eruptions (Magnitude ≥ 8; de Silva and Gosnold, 2007; Paterson and Ducea, 2015). For smaller eruptions, the timescales for eruptible magma accumulation are shorter (Cooper, 2019) and therefore the thermomechanical behavior of the upper crust does not change over time (de Silva, 2008). For these systems the accumulation of eruptible magma depends upon the depth(s) of magma storage and the geometry of magmatic bodies, which can be influenced by the crustal stress regime (Glazner, 1991; Vigneresse, 1995; Cruden, 1998; Menand et al., 2010; Gudmundsson, 2012; Chaussard and Amelung, 2014; Rivalta et al., 2015). The regional stress regime reflects the regional kinematics of subduction (Acocella and Funiciello, 2010), and alongside the thermal structure of the crust will influence the transport and storage of magma. Hence, the interaction between regional tectonics and volcanism extends beyond processes only associated with magma production in the mantle wedge, which is observed when analyzing the time-averaged mass eruption rate in different arcs (Acocella and Funiciello, 2010).
As summarized above, much research has been performed to understand how the dynamics of a subduction zone affect the generation, transport, storage and eruption of magma. However, the influence and importance of each of these processes on the size of eruptions in the volcanic record remains unclear. With the recent development of global databases summarizing both the volcanic eruption record and the kinematics of subduction zones, there is an opportunity to study the link between tectonic setting and the variability in the size of volcanic eruptions. Here we critically examine this link between tectonics and volcanism by using a wide suite of tectonic parameters and the Holocene eruption record of 162 arc volcanoes in convergent settings (Figure 1 and Supplementary Table A1). To perform our analysis we characterize the eruption record by quantifying the probability of recording eruptions of different magnitude. Because of the complex nature of magmatic plumbing systems and the multiple links between tectonics and volcanic activity, no clear relationships can be identified between distribution of eruption magnitudes and any single tectonic parameter (Acocella and Funiciello, 2010). Consequently, we employ a structured learning method that enables us to assess the strength of the probabilistic relationships between all the tectonic and volcanic parameters under consideration.
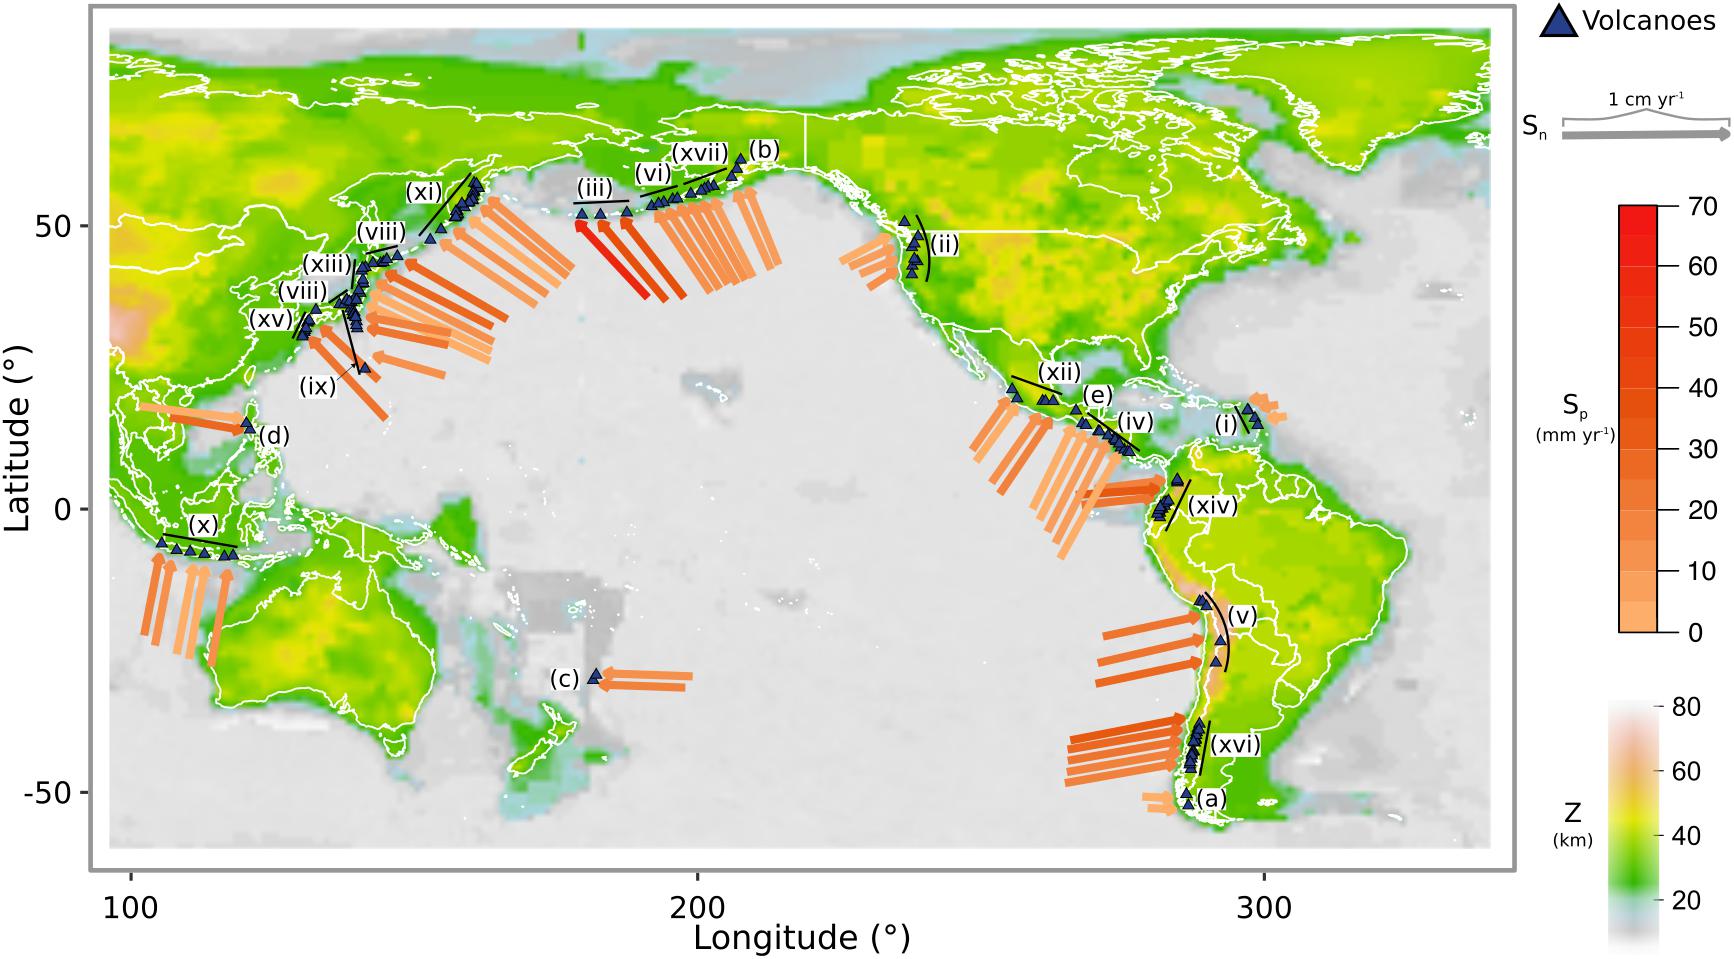
Figure 1. Tectonic and volcanic parameters: (a) Locations of all volcanoes and tectonic vectors used in this study. The length of each arrow is proportional to the rate of subduction normal to the trench (Sn) and the orientation of each arrow represents the angle of subduction. The color of each arrow is contoured for the rate of subduction parallel to the trench (Sp) and the color of the continents is contoured for the modeled crustal thickness (Z). Arcs used in the Bayesian network analysis and regional comparison (i.e., with more than two volcanoes) are labeled using roman numerals: (i) Antilles, (ii) Cascades, (iii) C. Aleutians, (iv) C. America, (v) C. Andes, (vi) E. Aleutians, (vii) Hokkaido-Kuriles, (viii) Honshu, (ix) Izu-Bonin, (x) Java-Bali, (xi) Kamchatka-Kuriles, (xii) Mexico, (xiii) NE. Japan, (xiv) N. Andes (xv) Ryuku, (xvi) S. Andes, and (xvii) W. Alaska. Arcs with two or less volcanoes included only in the Bayesian network analysis are labeled with lower case letters: (a) Austral Andes, (b) Eastern Alaska, (c) Kermadec; (d) N. Philippines, and (e) Chiapanecan.
Our analysis focuses on convergent margin volcanism and utilizes two databases: a record of large-magnitude explosive eruptions (LaMEVE v.3.1; Brown et al., 2014), and a synthesis of subduction-related parameters (Lallemand et al., 2005; Laske et al., 2013; Figure 1). We make an assumption of exchangeability in which each volcano represents a possible state of the common “subduction zone magmatic system” and hence each volcanic record represents one possible sequence of eruption events that could occur at any volcano at any time during the evolution of a magmatic system (Sheldrake, 2014). Such a hierarchical structure lends itself to the Bayesian analysis that is fundamental to our methodology. Our exchangeability assumption is based on the fact that each volcano in our analysis is located in an arc possible of producing large-magnitude volcanic eruptions between Magnitudes 4 and 7. Consequently, implicit in our assumption of exchangeability is that the injection of magma does not alter the thermomechanical behavior of the upper crust and influence magma accumulation, which occurs for the largest magmatic reservoirs feeding super-eruptions (de Silva and Gregg, 2014). We refine the assumption by removing volcanic arcs undergoing significant extension (e.g., New Zealand; Stern, 1985). The assumption of exchangeability then allows us to investigate tectonic parameters that may influence variability in the behavior of each volcano, but not specifically control the size or style of eruptive activity of a single volcano.
As we are interested in the effect of regional-scale tectonic processes it is important to average the behavior of many volcanoes (e.g., Turner and Langmuir, 2015a). We are not attempting to explain why an individual volcano had a large or a small eruption. Rather, we are attempting to understand whether groups of volcanoes have larger or smaller eruptions on average, and if this different average behavior relates to their subduction setting. Grouping multiple volcanoes reduces the variability arising from local processes that may influence an individual volcanic record over a short time period. Selecting volcanoes based on their geographic location is a natural approach to grouping (e.g., Hughes and Mahood, 2008) as it can minimize within-group variance. For each volcanic arc we compare the mean of each tectonic parameter with the average eruptive activity recorded (Supplementary Table A2). The mean represents an average of all possible eruptive states for a subduction zone magmatic system.
In total, our analysis consists of 162 individual volcanic records constrained by the availability of tectonic parameters (Figure 1) and effects of under-recording, which is described in the following section. Due to the multi-dimensional character of subduction zones, in which parameters are likely related to each other, we first use a structure-learning algorithm to define a graphical model, which quantifies the probabilistic relationships between different variables, and guides our comparison of the eruptive behavior in different geographical regions.
We use a graphical model called a Bayesian network to define the probability of tectonic parameters and eruption observations to be related for all 162 volcanoes in our analysis. A graphical model is defined by a directed acyclic graph in which the variables of interest are represented by nodes (i.e., tectonic, crustal and eruption parameters), and are connected by directed edges that define probabilistic relationships. If the data show significant departures from a normal distribution, they are usually discretised for mathematical convenience and computational speed, which is the case in this study. Consequently, the local distribution for each node is defined using conditional probability tables (CPT). A CPT defines the probability of a node, conditional on the other nodes to which it is connected.
To test whether variables are probabilistically related, and thus whether they should be connected by an edge in the graph, we use a structure-learning algorithm. Two main classes of algorithms have been developed for this task. The first, a score-based approach searches across all possible structures of a network by adding, removing and reversing arcs until it finds one that maximizes a score function that defines how well the model fits the data (Russell and Norvig, 2009). The second is a constraint-based method, based on the principle of the Inductive Causation (IC) algorithm (Verma and Pearl, 1991), which provides a framework to test the conditional independence between nodes. We use the first approach, specifically the Tabu search algorithm (Glover, 1990), which uses a greedy search to identify a network structure to maximize a scoring function. We choose a predictive log-likelihood score (Scutari et al., 2019) that learns the parameters based on volcanoes in some arcs, and then scores the network on volcanoes in other arcs. The analysis is bootstrapped 1000 times using combinations of different arcs to learn and score the network, from which the frequency of each edge is calculated, and edges can be removed if their frequency falls below a data-driven threshold (Scutari and Nagarajan, 2013). This approach allows us to estimate the regional-scale behavior and remove local effects under the assumption that such behavior is unlikely to be replicated across different regions. In order to construct each bootstrap sample, we randomly sample volcanoes from 15 to 21 sub-regions (from a total of 30 sub-regions, as defined by the LaMEVE database). Volcanoes in the remaining regions are used to score the network.
The analysis is restricted to a database of large-magnitude volcanic eruptions (LaMEVE; Magnitude > 4), in which magnitude is proportional to mass erupted (Brown et al., 2014). This is because we are interested in crustal scale processes related to magma generation and transport. These larger events characterize the tail of the frequency-magnitude distribution for volcanic eruptions, and will be less sensitive to shallow, local, short-term processes that may affect the occurrence of smaller eruptive events. To overcome rounding bias in the eruption record magnitudes are rounded (4, 5, 6, and 7). Under-recording of large magnitude eruptions also exists due to either natural causes (e.g., better preservation of younger and larger events; Rougier et al., 2018a) or epistemic biases (e.g., countries with greater scientific research; Kiyosugi et al., 2015; Rougier et al., 2018b). As the analysis of the eruptive record is commonly performed for a set of volcanoes that are grouped systematically (e.g., globally, volcano type, geographic region), under-recording is assessed based on the macro-scale properties of each group (e.g., change point in the rate of recording). Instead, the hierarchical structure we adopt in our analysis enables us to assess under-recording based on each individual volcanic record. This limits the influence of any possible epistemic biases. An eruption is included based on the record of its source volcano, rather than it’s individual age. The record of a volcano is included if it contains at least one event older than a specified date (tunique). The principle of the method is to then search for a time interval in which changing the value of tunique does not affect the macro-scale properties of the group (in our case the proportionality of the different magnitude eruptions). The details of this approach are presented in Sheldrake and Caricchi (2017), which shows for the Holocene period (11.7 ka – 2000 C.E.), changing the value of tunique has no effect on the proportionality of the different magnitude events, except for the inclusion of volcanoes whose eruption record is younger than 500 years. Volcanoes that only have very recent records are biased due to the historical nature of their record, which means that the smallest events (Magnitude 4) are recorded preferentially (Rougier et al., 2018a). Using the Holocene record and removing volcanoes that only have a historical record (i.e., eruptions younger that 500 years) we compare individual eruption records knowing that any potential recording bias in eruption size is consistent across the group in time (Figure 2). A slight temporal variation still exists, but is not related to eruption magnitude, geographical location or maximum age of the eruption record at an individual volcano (Figure 2). This is supported by the observation that the LaMEVE database is not overly biased by the activity of a few volcanoes (Deligne et al., 2017).
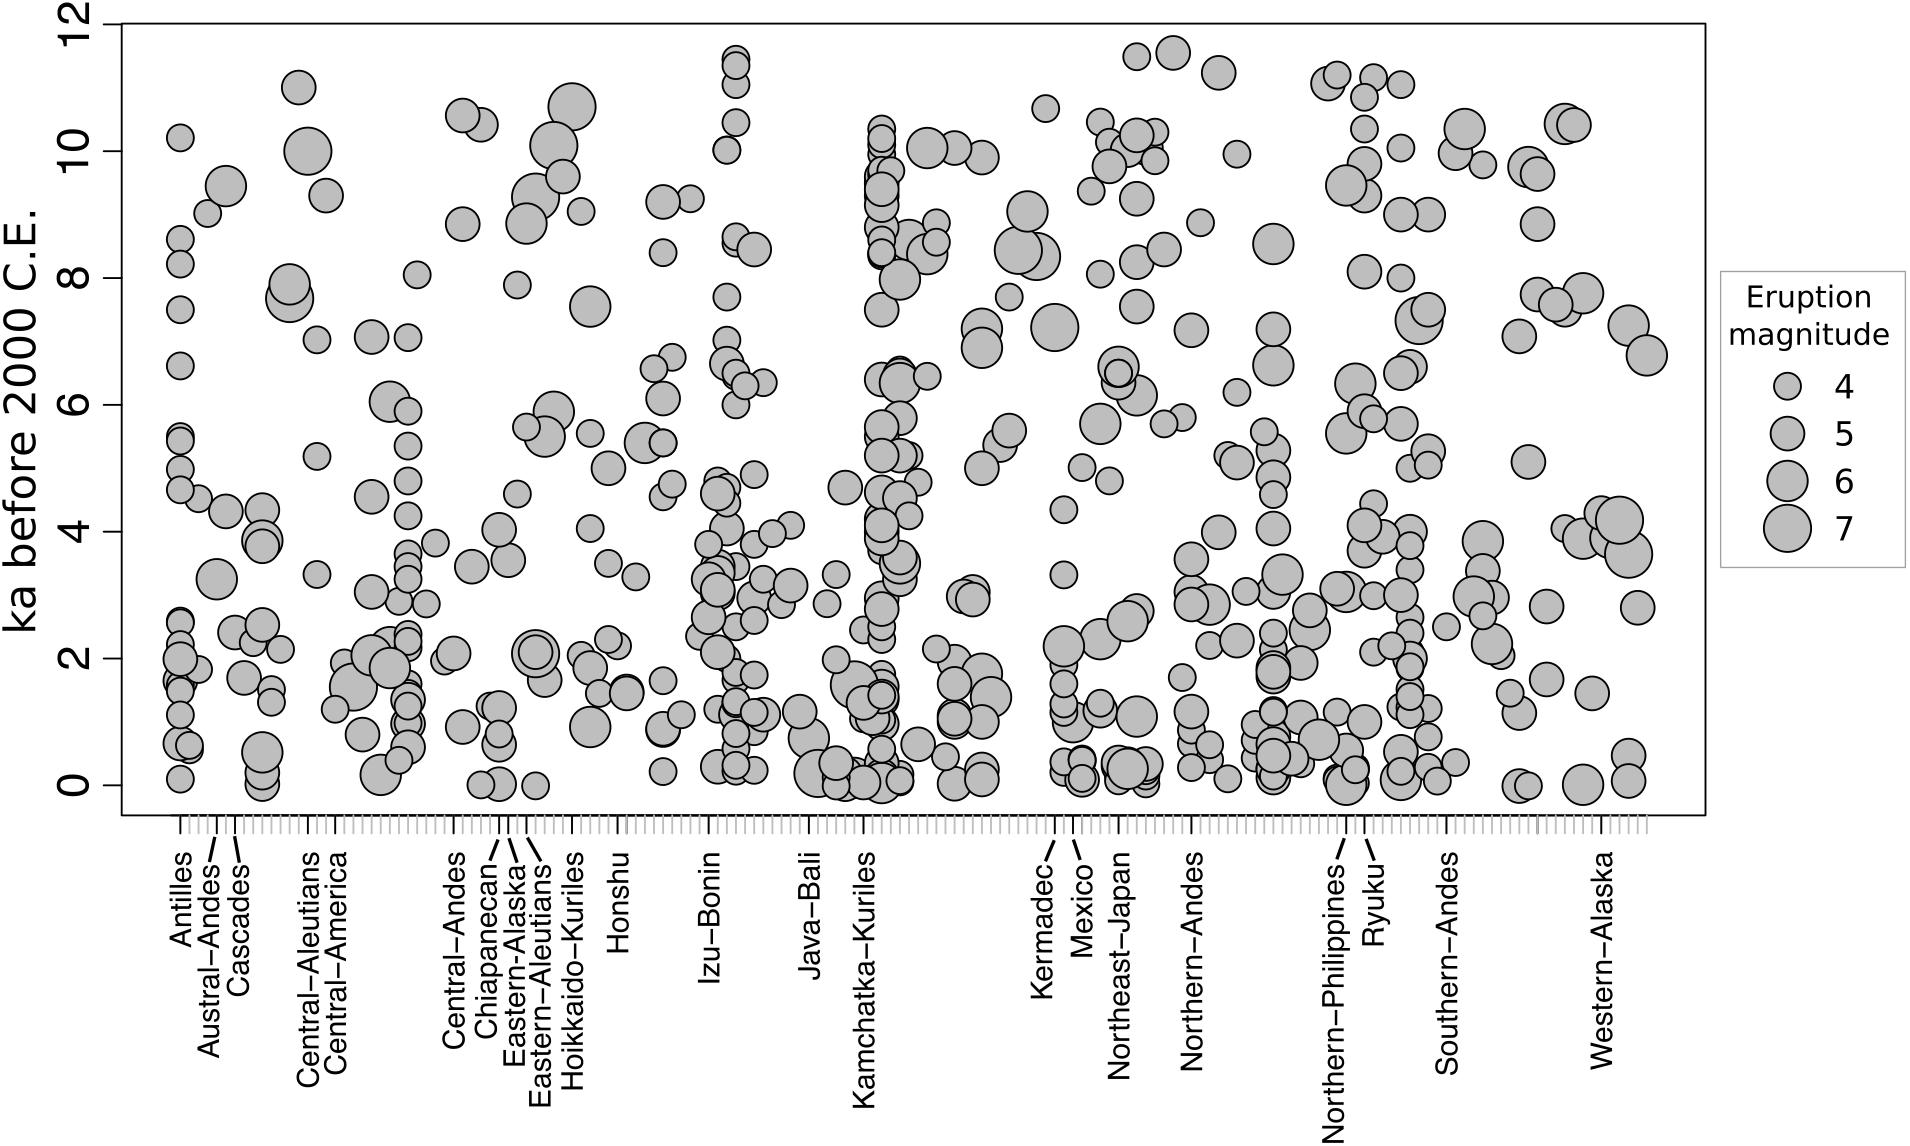
Figure 2. Eruption record for all 162 volcanoes in this analysis, showing no clear bias in event age or geographical location with respect to eruption magnitude. The volcanoes are ordered alphabetically according to the classification by volcanic arc in Figure 1. The order of volcanoes is the same order as in the Supplementary Table A1.
In total, the eruption records of 197 volcanoes satisfy the under-recording criterion presented in Sheldrake and Caricchi (2017). Of these, 162 volcanoes have corresponding tectonic parameters that we analyze in this study. Variability in the magnitude of volcanic eruptions is calculated using the Holocene eruption record during the previous 11,700 years before 2000 C.E. This includes 278 Magnitude 4 events, 202 Magnitude 5 events, 63 Magnitude 6 events, and 15 Magnitude 7 events (Figure 3 and Supplementary Table A1). We also record the latitude and longitude of each volcano, which allows us to calculate the modeled crustal thickness at that location (Laske et al., 2013), and to attribute tectonic parameters from the closest corresponding arc segment (Lallemand et al., 2005; Table 1 and Figure 3). We do not consider the impact of climate on volcanism (e.g., Rawson et al., 2016; Sternai et al., 2017) or the history of volcanism at a given volcano.
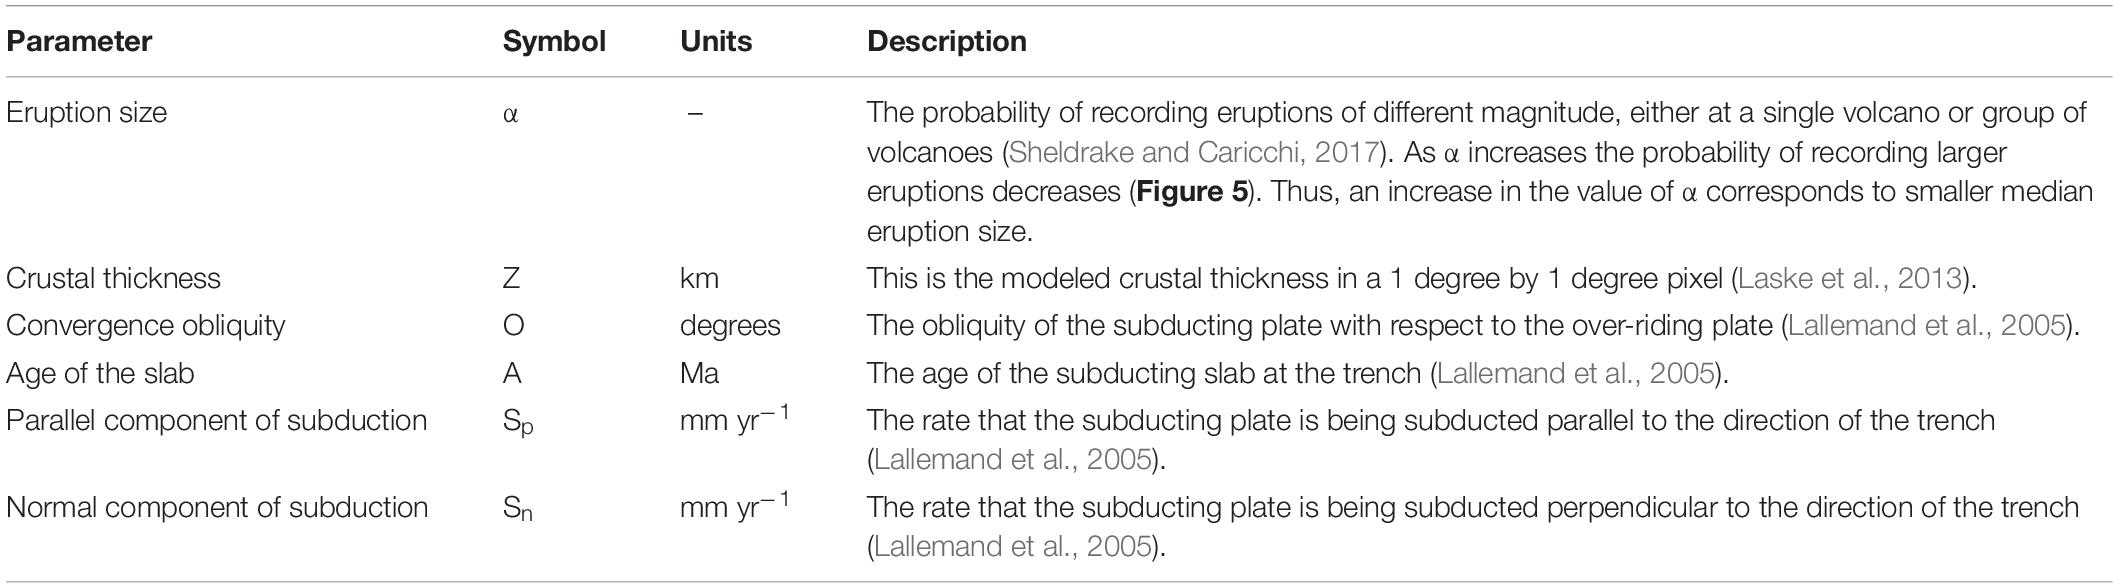
Table 1. Table of all parameters using in our analysis.
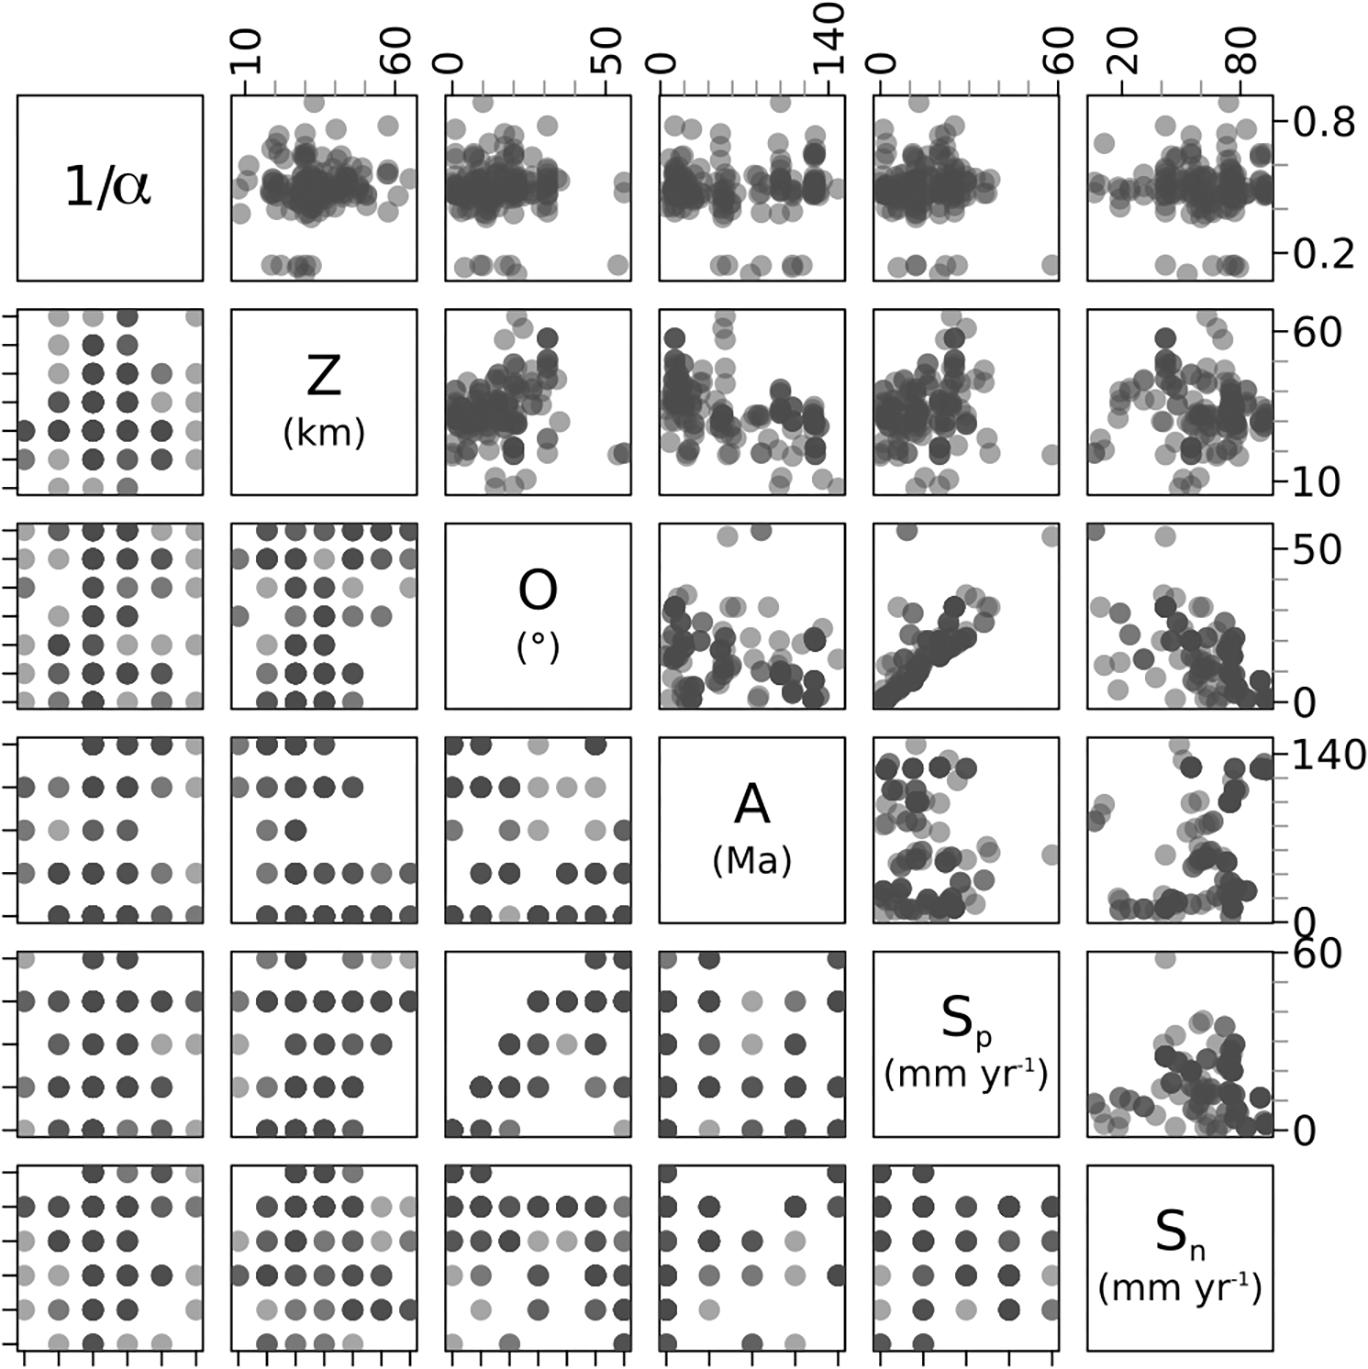
Figure 3. Pairs plot of all variables for the 162 volcanoes used in this study. Darker regions in each graph represent a higher density of volcanoes. The upper right panel contains the continuous data, with the relevant units labeled in the diagonal. The bottom left quadrant is the discretized data. The bounds of each interval are chosen to distinguish clusters of data in each parameter and can be found in the Supplementary Figure 1. Consequently, the bottom left panel is broadly a mirror image of the upper right panel. This can be observed by comparing the relationship between convergence obliquity (O) and the parallel component of subduction (Sp). Note we present the inverse of α, so larger values represent increased probability of recording larger eruptions. Descriptions of each parameter can be found in Table 1.
Kinematic parameters characterize the overall motion of subduction at each plate boundary, which is calculated using the absolute motion of the overriding and subducting plates, and the arc-trench. In our analysis we focus on velocity of subduction (Figure 4), which provides a first-order indication of the rate at which oceanic lithosphere is subducted beneath the overriding plate. For most arc sections included in this study the rate of subduction corresponds to the equivalent convergence rate, which is the sum of the velocities of the subducting plate and the trench/arc system (Figure 4B). We also examine the influence of convergence obliquity, which quantifies the angle of subduction relative to the trench-normal direction, measured in degrees. This is calculated using an orthogonal component (i.e., normal to the trench; Sn) and tangential component (i.e., parallel to the trench; Sp) of subduction, both measured in mm yr–1.
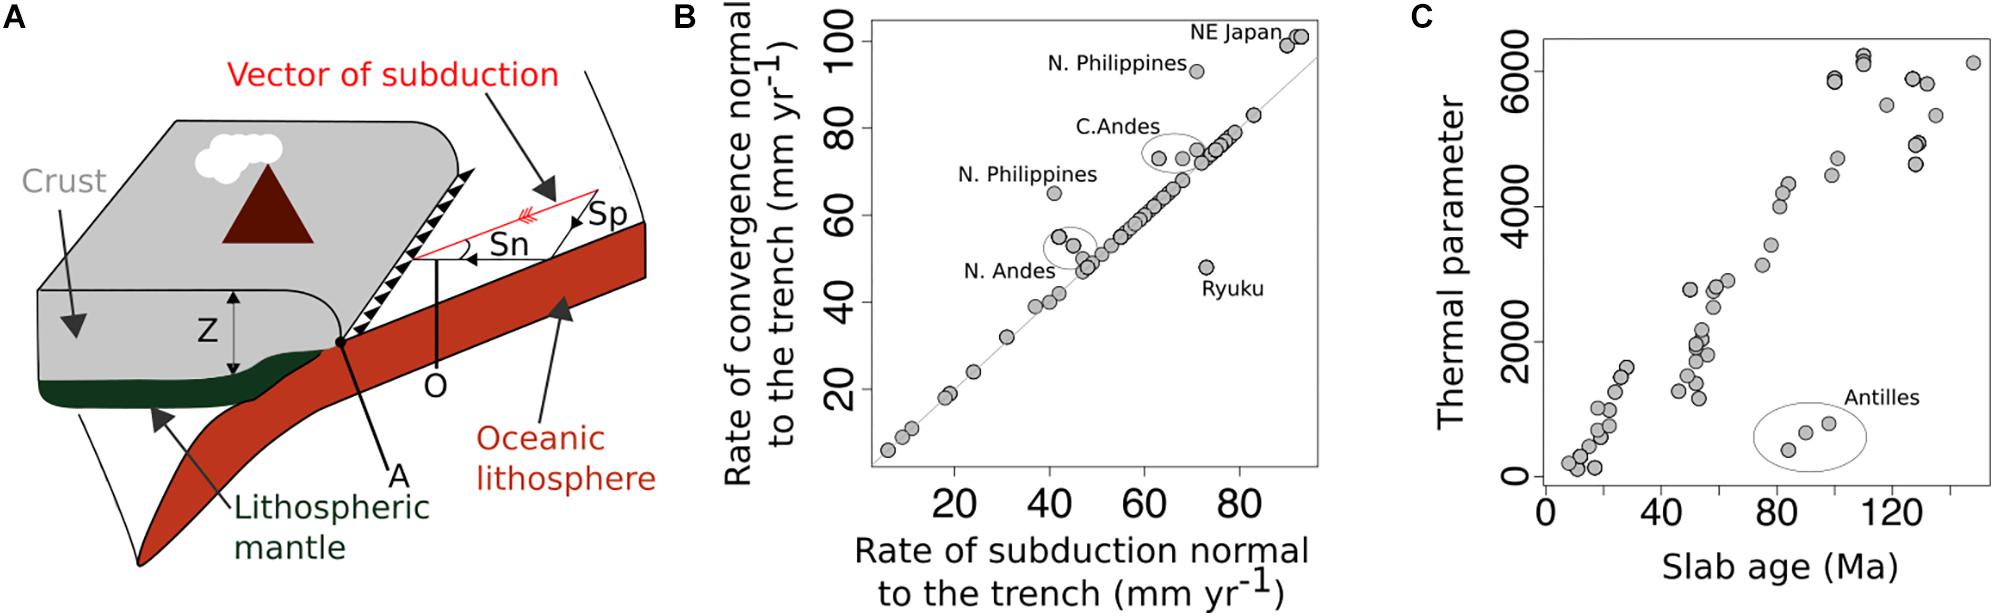
Figure 4. (A) Schematic for the exchangeable subduction zone, with the crustal thickness (Z), age of the slab (A), convergence obliquity (O), normal (Sn) and parallel (Sp) components of subduction all labeled; (B) plot of the convergence rate (the sum of the velocities of the subducting plate and the trench/arc system) versus the subduction rate for the arc segments from Lallemand et al. (2005) used in our study. As can be seen in the figure, the rate of subduction is broadly the same as the rate of convergence. We have labeled regions that do not fall on the 1:1 line between convergence rate and subduction rate; (C) A plot of the thermal parameter (Eq. 1) versus the age of the slab (A). At the global scale, variation in the thermal parameter is dominantly controlled by the age of the subducting slab. We label the Antilles, which is the only region whose thermal parameter is strongly controlled by the vertical rate of subduction.
The thermal structure of the mantle is characterized by the thermal parameter (Kirby et al., 1991; Eq. 1), which is a combination of the convergence rate (C), slab dip (θ) and age of the slab (A).
At a global scale, the dominant parameter is the age of the slab at the trench (A; Figure 4C), which is also included in our analysis. We do not incorporate the subducting slab angle into our analysis, which influences the distance between the trench and the volcanic arc (England et al., 2004; Perrin et al., 2018) and crustal thickening or shortening (Yanez and Cembrano, 2004; Lallemand et al., 2005). Instead, we include the crustal thickness (Z; km) of the overriding plate at each volcano as a bulk measurement of upper crust variability. Z is estimated using a model of crustal thickness averaged over a 1 by 1° area (Laske et al., 2013). Quantitative uncertainties are not reported in the tectonic datasets that we use, but uncertainties are orders of magnitude lower than the parameter variance and so will not impact the validity of the correlations that we identify.
Variability in the sizes of volcanic eruptions is calculated using the results of a Bayesian hierarchical analysis of the 197 volcanoes that satisfy the under-recording criteria described in Sheldrake and Caricchi (2017). The Bayesian analysis is performed using the principle of exchangeability, so that the probability of recording each eruption magnitude for each volcano is a result of its individual record (the proportion of different eruption magnitudes and total number of events recorded for each volcano) and the global record. For each individual volcano we characterize the slope between eruption magnitude and the probability of recording each eruption size (α). As these probabilities exhibit power law characteristics we perform this regression using the logarithm of each magnitude probability. For each geographical region we characterize the average power law behavior, which is also defined by the exponent α (Sheldrake and Caricchi, 2017). As the value of α increases, the probability of recording a higher proportion of smaller magnitude eruptions increases (Figure 5). Therefore α describes the proportion of different eruption sizes, and thus an increase in the value of α corresponds to decreasing median eruption size. We include arcs in our regional analysis that include three or more volcanoes, to remove estimates of α that have large uncertainties. We report the average of each tectonic parameter, as well as the standard deviation in the Supplementary Data (Supplementary Table A2).
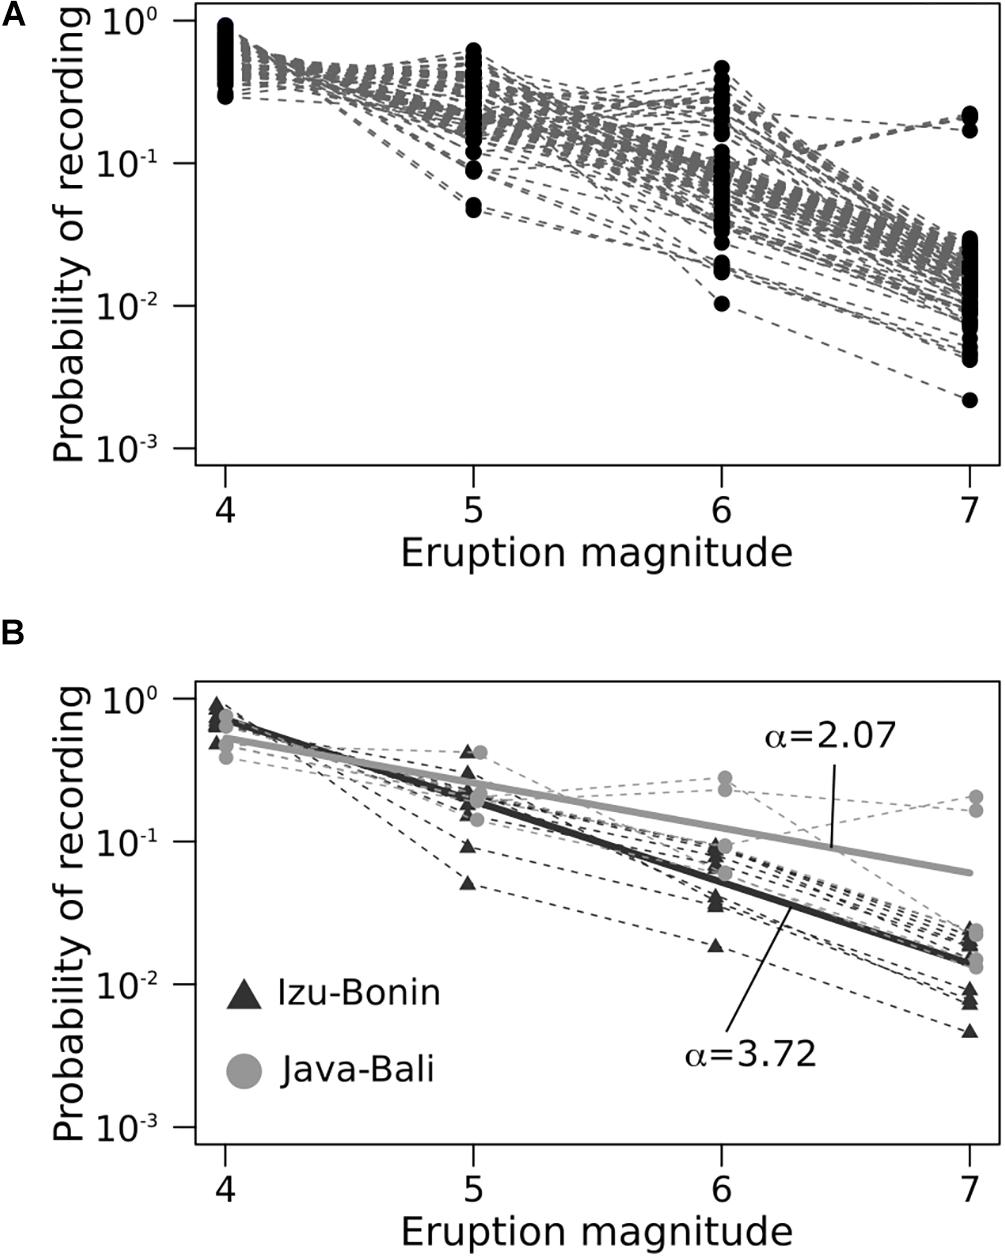
Figure 5. Probability of recording different eruption magnitudes for; (A) all 162 volcanoes in our analysis; (B) Izu-Bonin and Java-Bali (dashed-lines), with the average distribution for each arc fitted using a power law (solid lines). The slope of the power-law is characterized by the α parameter.
The results of the structural learning algorithm are presented in Figure 6, in which the darkness of the edge is proportional to its probabilistic strength. In total only 22 possible networks were identified by the learning algorithm (Figure 6A). The strength of each edge was calculated by averaging its frequency across all 1000 networks (Figure 6B). Solid lines indicate edges have passed the data-driven significance threshold, which is 0.34. The variable that shows the greatest probabilistic relationship with eruption size is the obliquity of convergence. Other parameters that are related to the distribution of eruptions sizes (α) and are greater than the significance threshold are the thickness of the crust, the rate of subduction normal to the trench, and the age of the subducting slab. The subduction-parallel component is not significant.
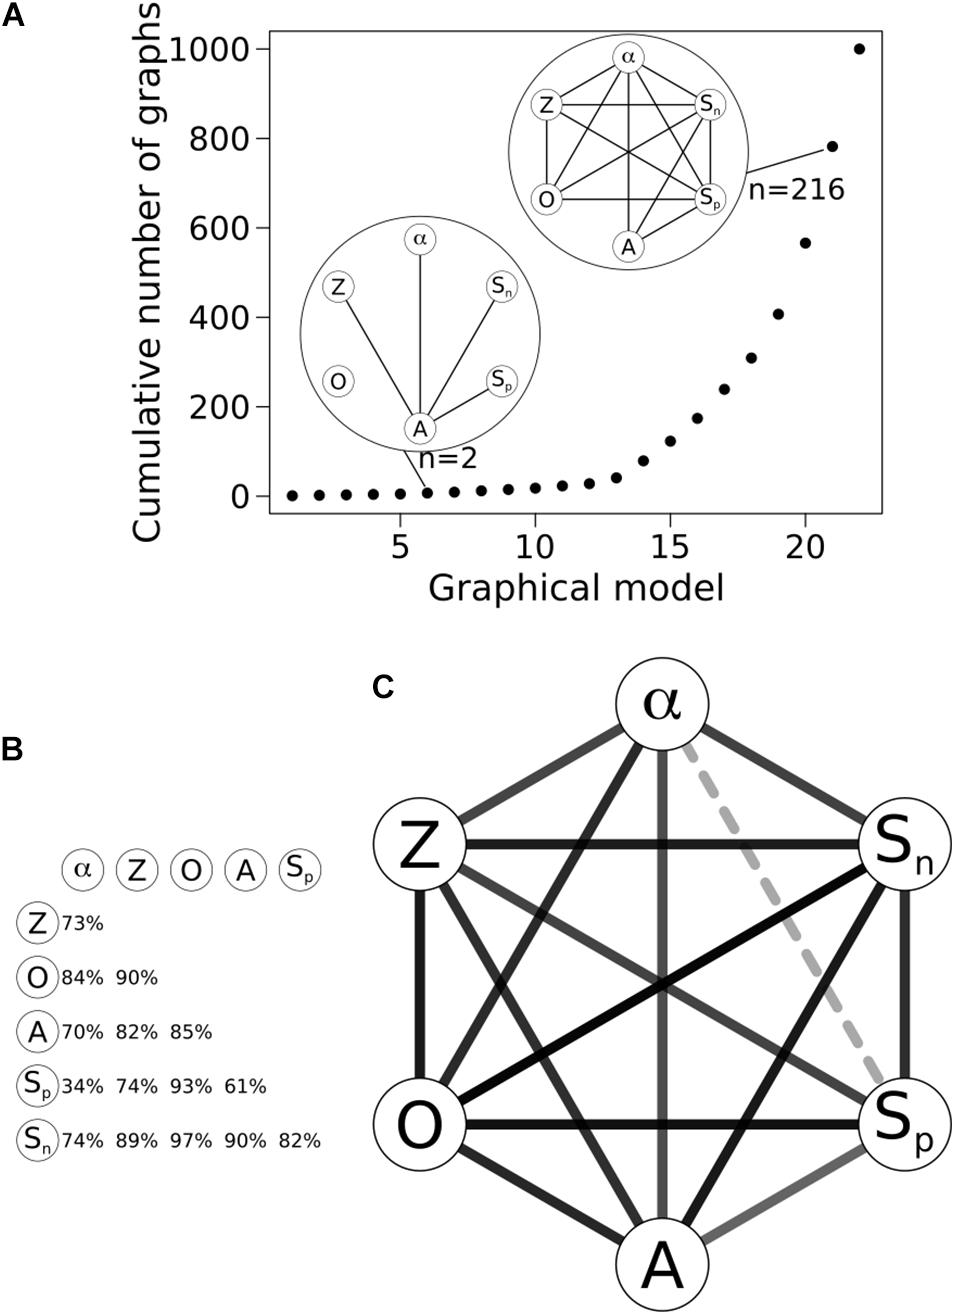
Figure 6. Graphical model that identifies which nodes (circles representing parameters) are linked by edges (lines). Descriptions of each parameter can be found in Table 1. (A) A plot of the cumulative number of graphical structures and number of graphical models estimated using the bootstrap approach. In total twenty-two networks are estimated, with two of the networks identified (n is equal to the number of times that network is identified as best-fitting the data). Given that learning under bootstrap identifies 22 networks, it’s a sign that the learning process is robust against noise; (B) The percentage of the 1000 bootstrapped networks that contain the respective edge. By performing this bootstrap 1000 times we reduce the effects of noise on our analysis, and improve the strength of the probabilistic correlations. Running the bootstrap analysis multiple times will result in some variability in the strength of the probabilistic relationships (±2%). However, the relative strengths of the edges, is what we are most interested in, and these remain, even if the absolute values of the probabilistic relationships varies slightly; (C) The resulting graphical model from the bootstrapped networks. The darkness of the edge represents the number of times that edge appears in the bootstrapped graphs. Edges that do not pass a significance threshold are labeled with a dashed line.
The role of convergence obliquity is observed when we compare the eruptive behavior of different volcanic arcs. Volcanic arcs with the lowest values of alpha (α) are characterized by subduction that is normal to the arc (Figure 7). There is no clear linear relationship, however, between decreasing α and increasing convergence obliquity, which shows why it is complicated to identify relationships between single tectonic parameters and eruptive behavior of volcanoes located in different arcs. This is due to the roles of other parameters on eruption size, such as the age of the subducting slab and the rate at which the slab is subducting. Both of these parameters do not exhibit any clear trend with α, and volcanic arcs with the highest values for the rate of subduction or age of the slab do not produce proportionally larger eruptions on average (Figure 7). This corroborates the results of the graphical model that the obliquity of convergence has the greatest probabilistic strength with eruption size (Figure 6). Finally, we can see the influence of crustal thickness for some groups of volcanoes, such as those with moderate convergence obliquity (Figure 7A) or the oldest slab ages (Figure 7B), where the value of alpha decreases as crustal thickness increases.
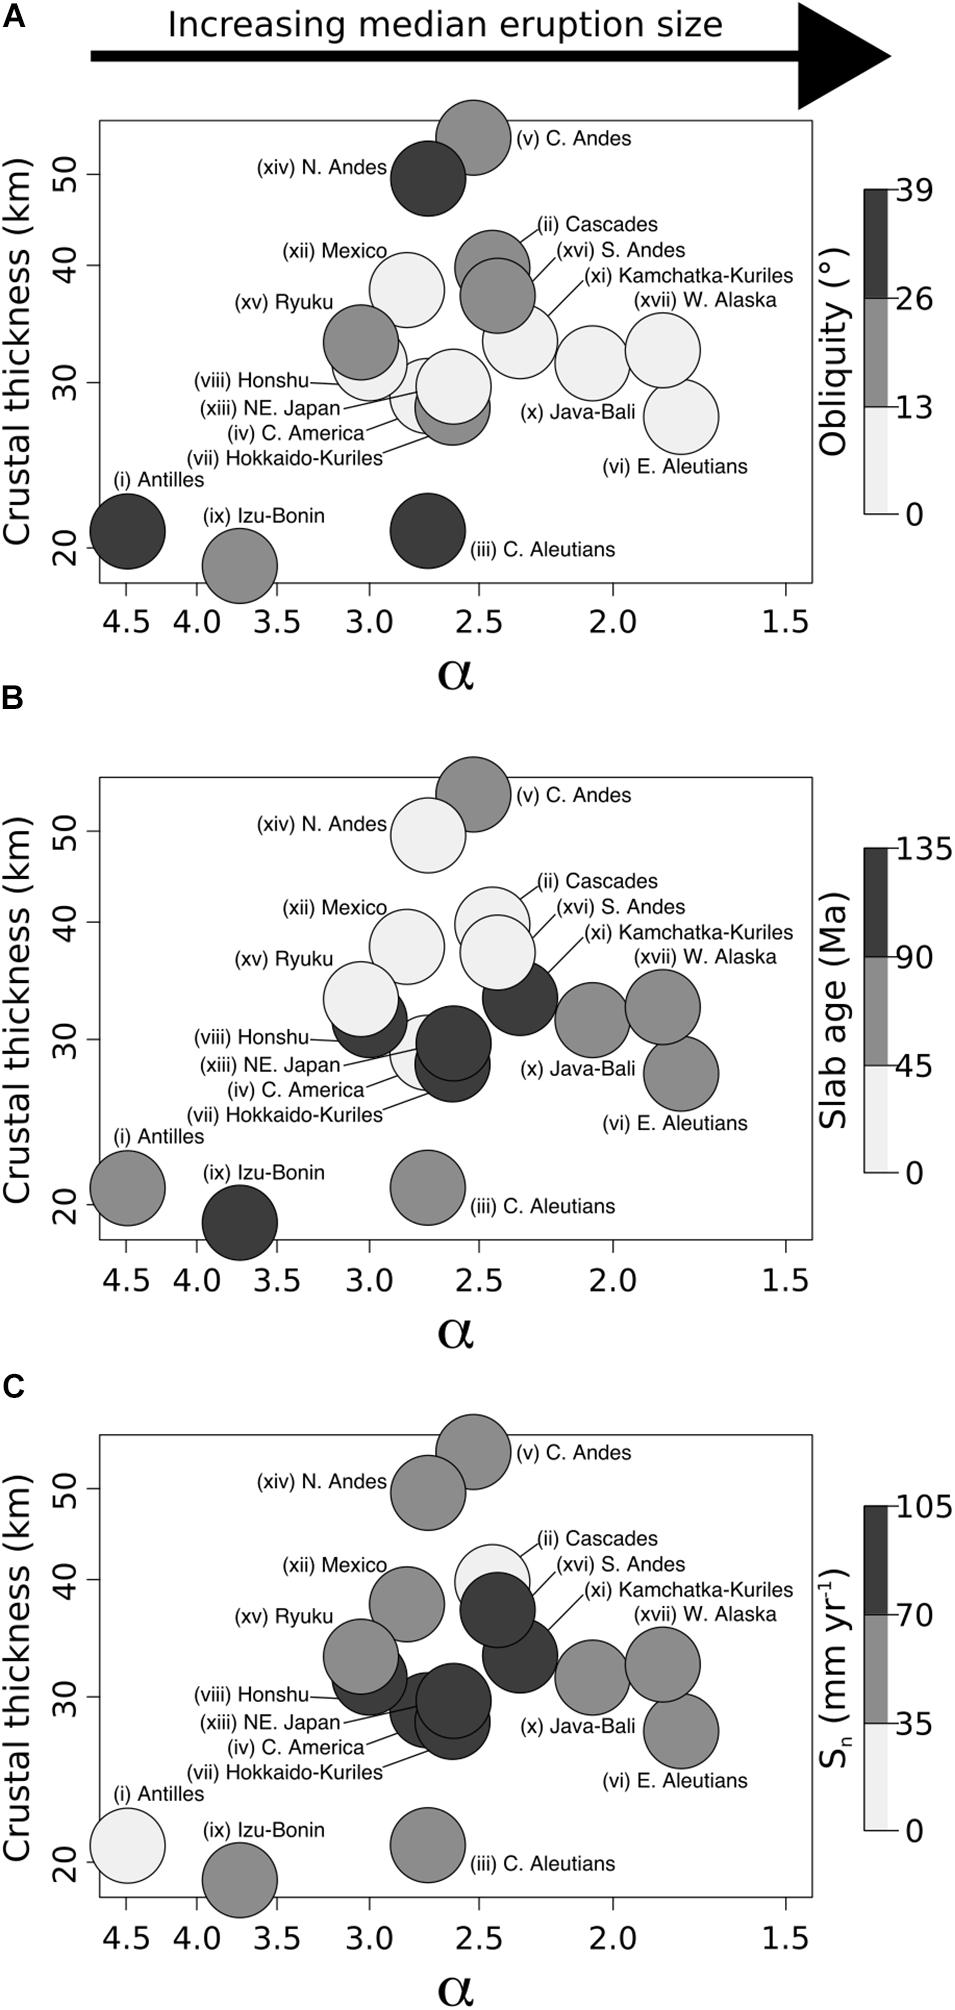
Figure 7. The distribution of the power-law slope parameter (α) versus the mean average crustal thickness (Z) for each arc. The graphs are color contoured for the average value of; (A) the obliquity of convergence (O); (B) the age of the slab (A); (C) the rate of subduction perpendicular to the volcanic arc (Sn). Note that the α parameter decreases to the right. Hence, the median size of volcanic eruptions increases to the right.
To explore the combined effect of these tectonic parameters on volcanic activity in more detail we distinguish volcanic arcs into two groups based on the following parameter,
where A is the age of the slab and Qs = Sn / (Sn + Sp) is the subduction motion, which represents the motion of the plate boundary, and is generally reflected in the motion of the arc (Nakamura et al., 1977; Acocella and Funiciello, 2010). We utilize this combined parameter (H) to represent the average size of magma reservoir in the crust. It allows us to distinguish the effects of high mantle productivity and low convergence obliquity, which combined favor the development of larger crustal reservoirs. Mantle productivity increases with the age of the slab (A in Eq. 2; Poli and Schmidt, 2002). Neglecting the cases of arcs experiencing significant extension, increasing normality of convergence (Qs in Eq. 2) promotes the formation of deeper magma reservoirs (Chaussard and Amelung, 2012, 2014) by modifying the trajectory of dikes to favor the formation of sills (Menand et al., 2010; Menand, 2011; Daniels and Menand, 2015; Rivalta et al., 2015; Kavanagh, 2018). Therefore, with increasing H the likelihood of formation of larger reservoirs crust also increases. Using H, we identify two groups of arcs characterized by; (1) High mantle productivity and normal subduction (H > 3.0); and (2) Low mantle productivity combined with oblique convergence (H < 3.0). The value of 3 separating the two regimes was identified using a k-means clustering algorithm.
Volcanic arcs with higher values of H have moderate crustal thicknesses with an average of ∼30 km, except for Izu-Bonin with an average value of ∼19 km (Figure 8). The low-H group is characterized by the complete range of crustal thicknesses from ∼20 to ∼55 km (Figure 8).
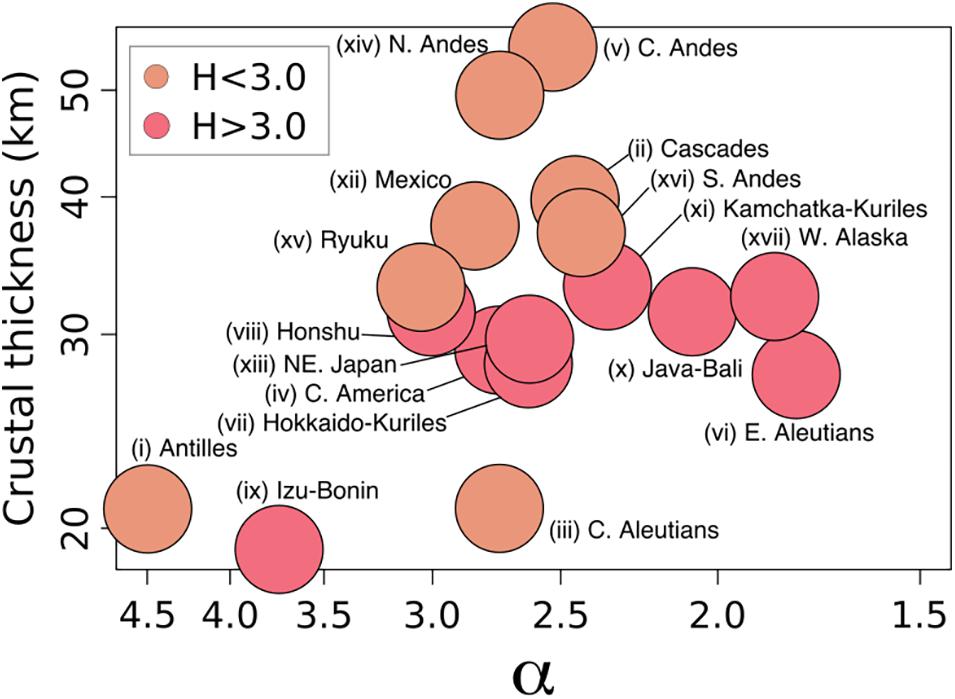
Figure 8. The distribution of the power-law slope parameter (α) versus the mean average crustal thickness (Z) for each arc. Volcanic arcs are distinguished into two regimes according to the age of the slab and subduction motion (Eq. 2). Note that the α parameter decreases to the right. Hence, the median size of volcanic eruptions increases to the right.
We estimated graphical models for volcanoes in each of these two groups, which enables us to identify within-group distinct dominant behaviors (Figure 9). For the high-H group the rate of subduction has no significant correlation with the magnitude distribution of volcanic eruptions (Figure 9A). Instead, the age of the slab becomes the dominant parameter followed by the obliquity of convergence and then the thickness of the crust (Figure 9A). The smallest values of α are found in volcanic arcs that have moderate values for the convergence obliquity and age of the slab, whereas older ages and/or lower obliquity are associated with lower values of α (Figure 9B). For the low-H group the value of α decreases with increasing crustal thickness (Figure 9D). This is also visible in the results of the graphical model, which indicates that the strongest probabilistic link with eruption size is with crustal thickness (Figure 9C). Here the only exception is the Central Aleutians, which has exceptionally large values of Sp for this group (Figure 9D).
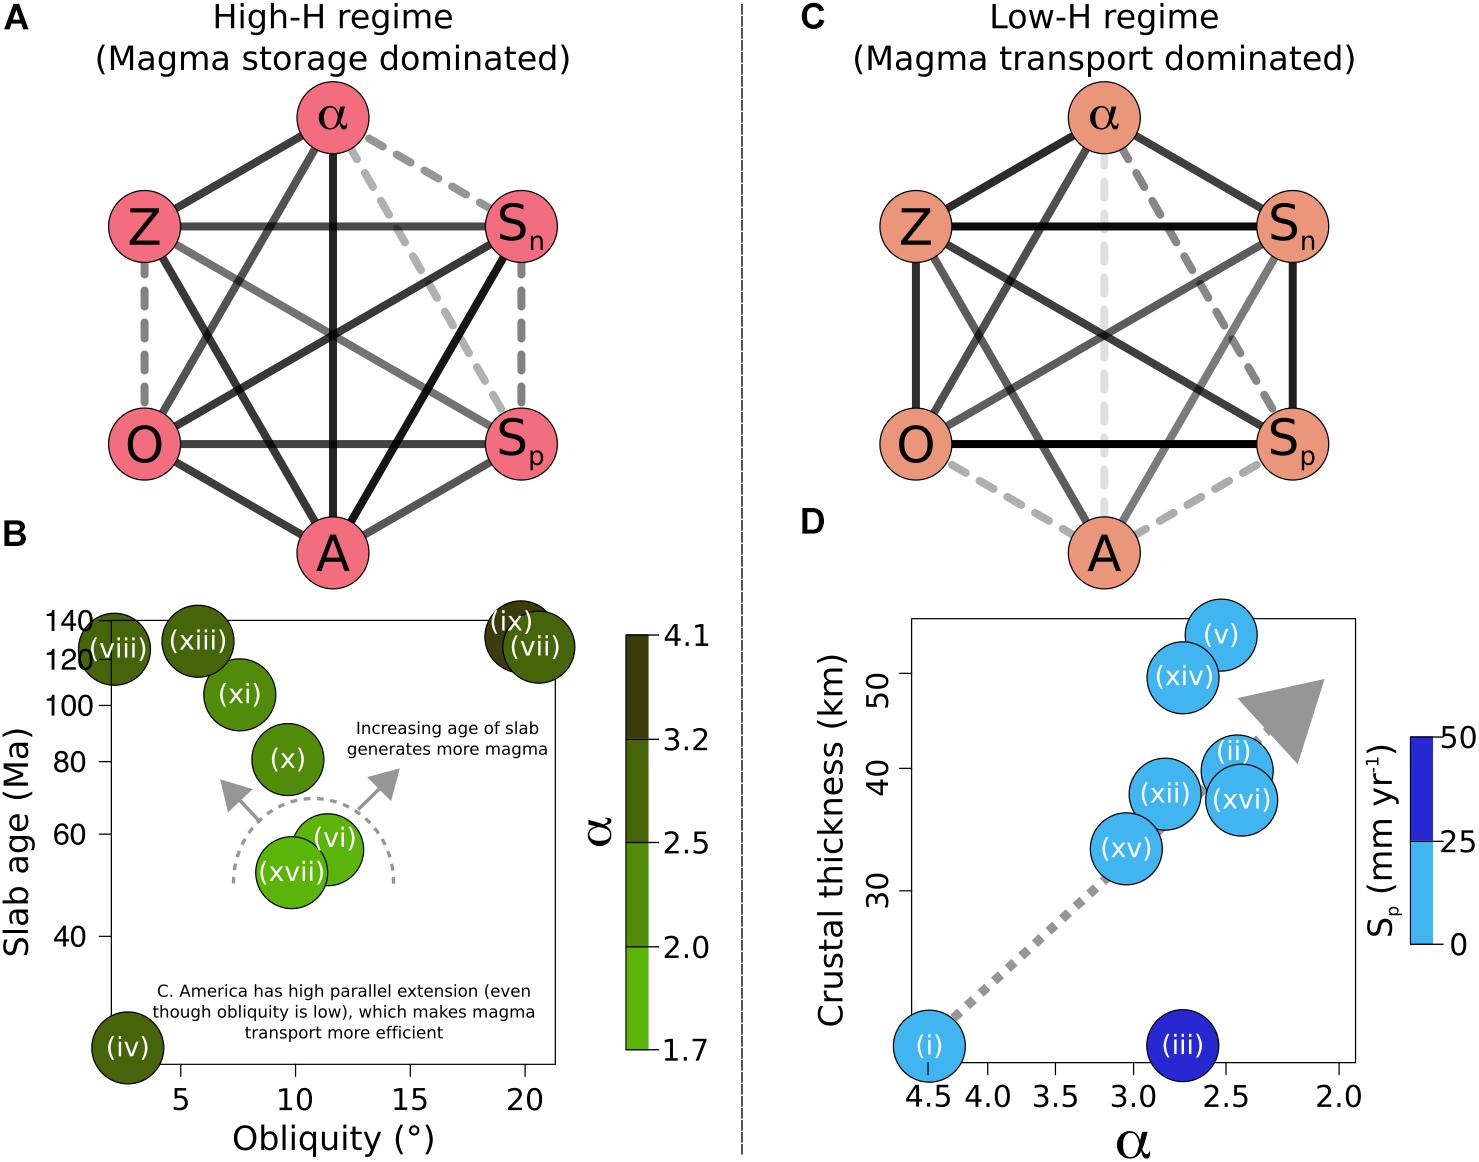
Figure 9. The dominant parameters for the two regimes defined in Eq. 2. The colors of the nodes in the graphical models (a+c) relate to the colors of the two groups in Figure 8 and descriptions of each parameter can be found in Table 1. (A) A graphical model for the high-H regime, signifying the importance of the slab age (A) and obliquity of convergence (O) on α. This is explored in (B) where an increase in the age of the slab (A) is correlated with an increase in α. C. America (iv) has a lower value of α because of the dominant extensional arc-parallel stress regime, discussed more in the main text. (C) A graphical model for the low-H regime, signifying the importance of crustal thickness on α. This is observed in (D) with a positive correlation between crustal thickness and decreasing values of α, except for the C. Aleutians (iii), which has high rates of subduction parallel to the volcanic arc. Arcs are labeled as follows: (i) Antilles, (ii) Cascades, (iii) C. Aleutians, (iv) C. America, (v) C. Andes, (vi) E. Aleutians, (vii) Hokkaido-Kuriles, (viii) Honshu, (ix) Izu-Bonin, (x) Java-Bali, (xi) Kamchatka-Kuriles, (xii) Mexico, (xiii) NE. Japan, (xiv) N. Andes (xv) Ryuku, (xvi) S. Andes, and (xvii) W. Alaska.
We have compared the tectonic setting to the eruptive records of individual volcanoes, using a Bayesian network. We have further compared the tectonic setting of different volcanic arcs to their average eruptive behavior. These two approaches have provided strikingly similar results and identified the obliquity of convergence, combined with the age of the slab and crustal thickness, as the most important parameters controlling the size distribution of volcanic eruptions (Figures 6–9). Using these results we discuss the possible processes that influence the size of volcanic eruptions up to magnitude 7 in different volcanic arcs.
Magma chambers are formed from the assembly of multiple sills, which will accumulate when vertically orientated dikes are retarded at the boundaries between crustal heterogeneities (Gudmundsson, 2011). However, regional compression can also change the trajectory of dikes to form sills (Menand et al., 2010), promoting the storage of magma, which is observed by deeper magma reservoirs in compressive settings (Chaussard and Amelung, 2014). Deeper reservoirs will promote viscoelastic behavior, increasing the ability to accumulate larger volumes of magma (Jellinek and DePaolo, 2003), resulting in lower values of α. When subduction is more normal (i.e., lower angle of obliquity) deformation is accommodated predominantly as arc-normal compression or extension (Acocella and Funiciello, 2010). For the set of volcanoes included in this analysis, lower convergence obliquity is more commonly associated with compressive rather than extensive stress regimes (Figure 10). Hence, we suggest that in low-obliquity arcs in our study, compression may also reduce the vertical transport of magma, promoting the formation of larger magmatic reservoirs and larger eruptions (i.e., lower α; Chaussard and Amelung, 2014).
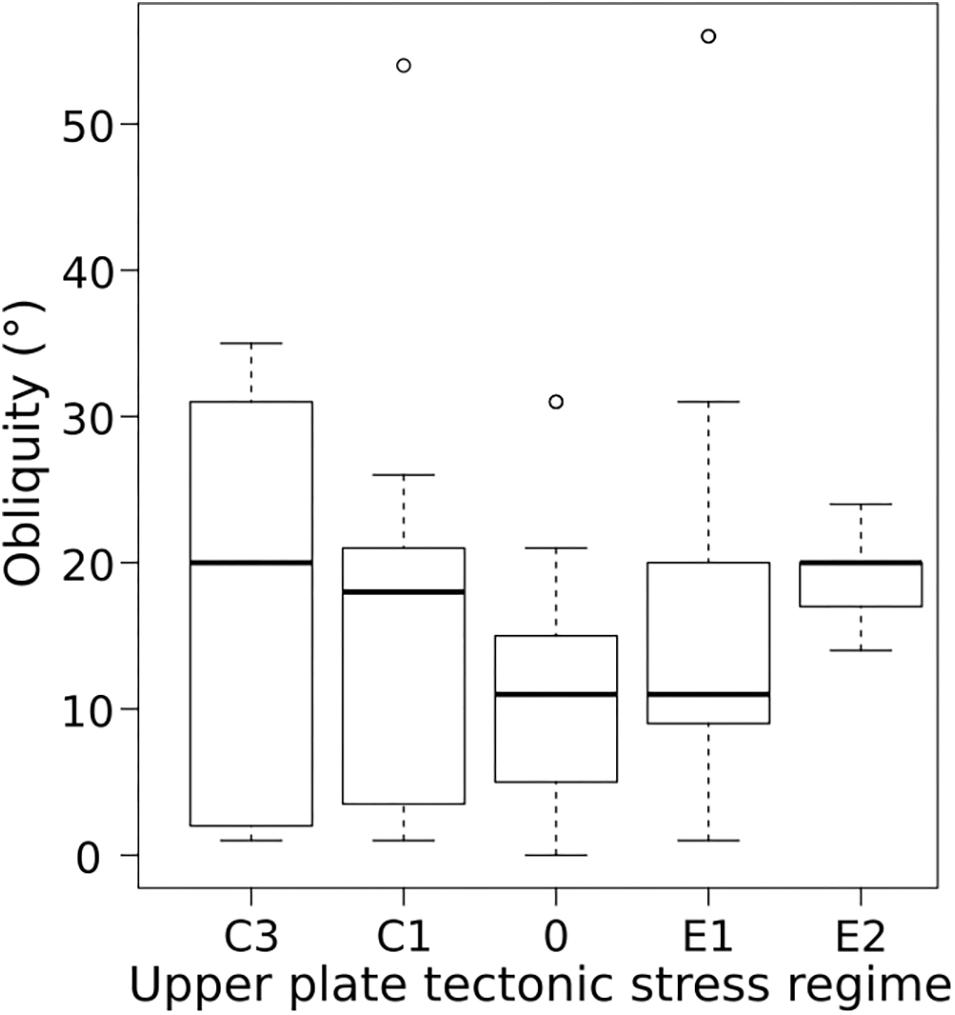
Figure 10. A box and whisker plot for the five types of upper crustal tectonic stress regime for the 162 volcanoes analyzed, according to the classifications of Lallemand et al. (2005). E3 to E1 represent decreasing rates of extension, 0 represents an upper crust in neither extension nor compression, and C1 to C3 represent increasing rates of compression. No volcanoes in this study are found in regions of compression with class C2 or extension with class E3. Low convergence obliquity is most likely to be recorded in compressive volcanic arcs (C3, C1).
The H parameter we identify allows us to separate the relative importance of magma productivity and convergence obliquity on the frequency of eruption of magnitude between 4 and 7. The ability to accumulate and thermally sustain larger volumes of eruptible magma within the crust is what distinguishes the high-H regime from the low-H regime. Regions of normal convergence associated with older slabs (high-H) produce a higher proportion of larger eruptions than regions of oblique convergence (low-H; Figure 8). Whilst both High- and Low-H regimes are associated with a range of α values, a higher proportion of larger eruptions (low α) occur preferentially in regions characterized by high-H.
The competition between magma supply and efficiency of storage versus transport can account for variations in the proportions of eruptions of different magnitude (Caricchi et al., 2014; Zellmer et al., 2019). Thus, it is unsurprising that similar values of α are associated with a range of tectonic and crustal parameters (Figure 7). In regions where convergence obliquity enables the development of similar size magma reservoirs (i.e., high-H or low-H regimes, respectively), larger and more frequent intrusion of magma into the upper crust will favor eruption (Caricchi et al., 2014). Within the high-H regime we suggest that the perturbation of upper crustal reservoirs is positively related to mantle productivity (A; Figure 9A). Therefore the accumulation of eruptible magma will be favored in regions with moderate slab ages, in which a higher proportion of larger eruptions are recorded (lower α; Figure 9B). Within the low-H regime upper crustal reservoirs are more likely to be ephemeral or inexistent as vertical magma transport is more efficient (Menand, 2011; Rivalta et al., 2015; Kavanagh, 2018). Consequently, in regions where the crust is thinner, magma is more likely to intrude sub-volcanic reservoirs (Taisne and Jaupart, 2011) leading to a higher proportion of smaller eruptions (higher α; Figures 9C,D).
Within arcs characterized by the high-H regime there is one exception in Central America, which has the youngest slab age but not the lowest value of α (Figure 9B). This arc is unique in that whilst the motion of subduction is normal, the magmatic arc is characterized by arc-parallel extension (Acocella and Funiciello, 2010) and shallow magmatic reservoirs located in strike-slip environments (Chaussard and Amelung, 2014). Consequently, we suggest that regional extension strongly influences magma accumulation by allowing the transport of magma to shallows levels, whilst also dissipating the overpressure generated by magma injection (Jellinek and DePaolo, 2003). This same effect of arc-parallel extension is observed within the low-H group for the Central Aleutians, which has a significantly higher proportion of larger eruptions (lower α; Figure 9D) in comparison to arcs of similar crustal thickness. In the Central Aleutians the parallel component of subduction is double that observed in any other arc within the low-H group (Figure 9D and Supplementary Table A2).
Crustal thickness may also influence melt generation in the mantle, with decompression-induced melting favored when the crust is thinner. This is because with increasing crustal thickness cooler isotherms are displaced further into the mantle wedge, reducing the energy available for melting (Langmuir et al., 2006; Karlstrom et al., 2014). Thus, smaller eruptions may also be favored when the crust is thinner, due to enhanced decompression melting that will result in more frequent perturbation of upper crustal magmatic systems. However, as slab age does not influence the proportion of different magnitude eruptions within the low-H group (Figure 9C), we suggest that crustal structure is a more dominant control on upper crustal magma fluxes than mantle productivity.
Our analysis focuses on volcanoes that produce eruptions of magnitude 4 to 7 during the Holocene period. Over longer timescales and for the largest eruptions (i.e., during flare-ups; de Silva, 2008; Paterson and Ducea, 2015) the evolution of the thermomechanical properties of the crust due to magma injection cannot be ignored. In these scenarios it is likely that in systems where mantle productivity is high, within regions where magma storage is promoted, the continued injection of magma would enable the development of a viscoelastic crustal rheology that would further promote magma accumulation (Jellinek and DePaolo, 2003; Karlstrom et al., 2017). Consequently, in these scenarios, it is likely that the frequency of magma injection into the upper crust would become insignificant in triggering eruptions (Caricchi et al., 2014), and that the storage regime would become dominated by the thermal maturation of the crust (de Silva and Gosnold, 2007; de Silva and Gregg, 2014).
Due to the large number of parameters modulating the link between subduction architecture and volcanism, different combinations of these parameters can produce similar proportions of eruptions of different magnitude. This is especially the case for α values between 2.2 and 3.2 (Figure 7), which also corresponds to the greatest range in caldera density (Figure 11). We examine the caldera density (defined as the number of examined calderas per 1000 km of arc length; Hughes and Mahood, 2008, 2011) as it provides a measure of the long-term magma productivity of an arc. At these longer timescales, higher fluxes can lead to larger eruptions by altering the thermomechanical properties of the crust to promote magma storage and accumulation of eruptible magma (de Silva and Gregg, 2014; Karlstrom et al., 2017). Hence, we use caldera density as a proxy for the rate of eruptible magma accumulation in the upper crust. Volcanic arcs with the highest density of calderas are characterized by the fastest rates of subduction normal to the trench (Figure 11A; Hughes and Mahood, 2008, 2011), but our analysis suggests that actually a high density of calderas is the result of the combination of older slab ages (Figure 11B) and low obliquity (Figure 11C), and not purely the result of high trench-normal subduction rates. Consequently, for α values between 2.2 and 3.2, high-H regimes will be associated with a larger density of calderas than low-H regimes (Figure 11D). Within the high-H group the rate of subduction (Sn or Sp) has minimal influence on the proportions of eruptions of different magnitude (α) in comparison to the age of the slab (Figure 9A). Hence, we cautiously suggest that at a global scale the age of the slab is a more dominant parameter than the rate of subduction in determining the productivity of the mantle wedge due to dehydration-induced melting, and thus magma supply to subvolcanic reservoirs.
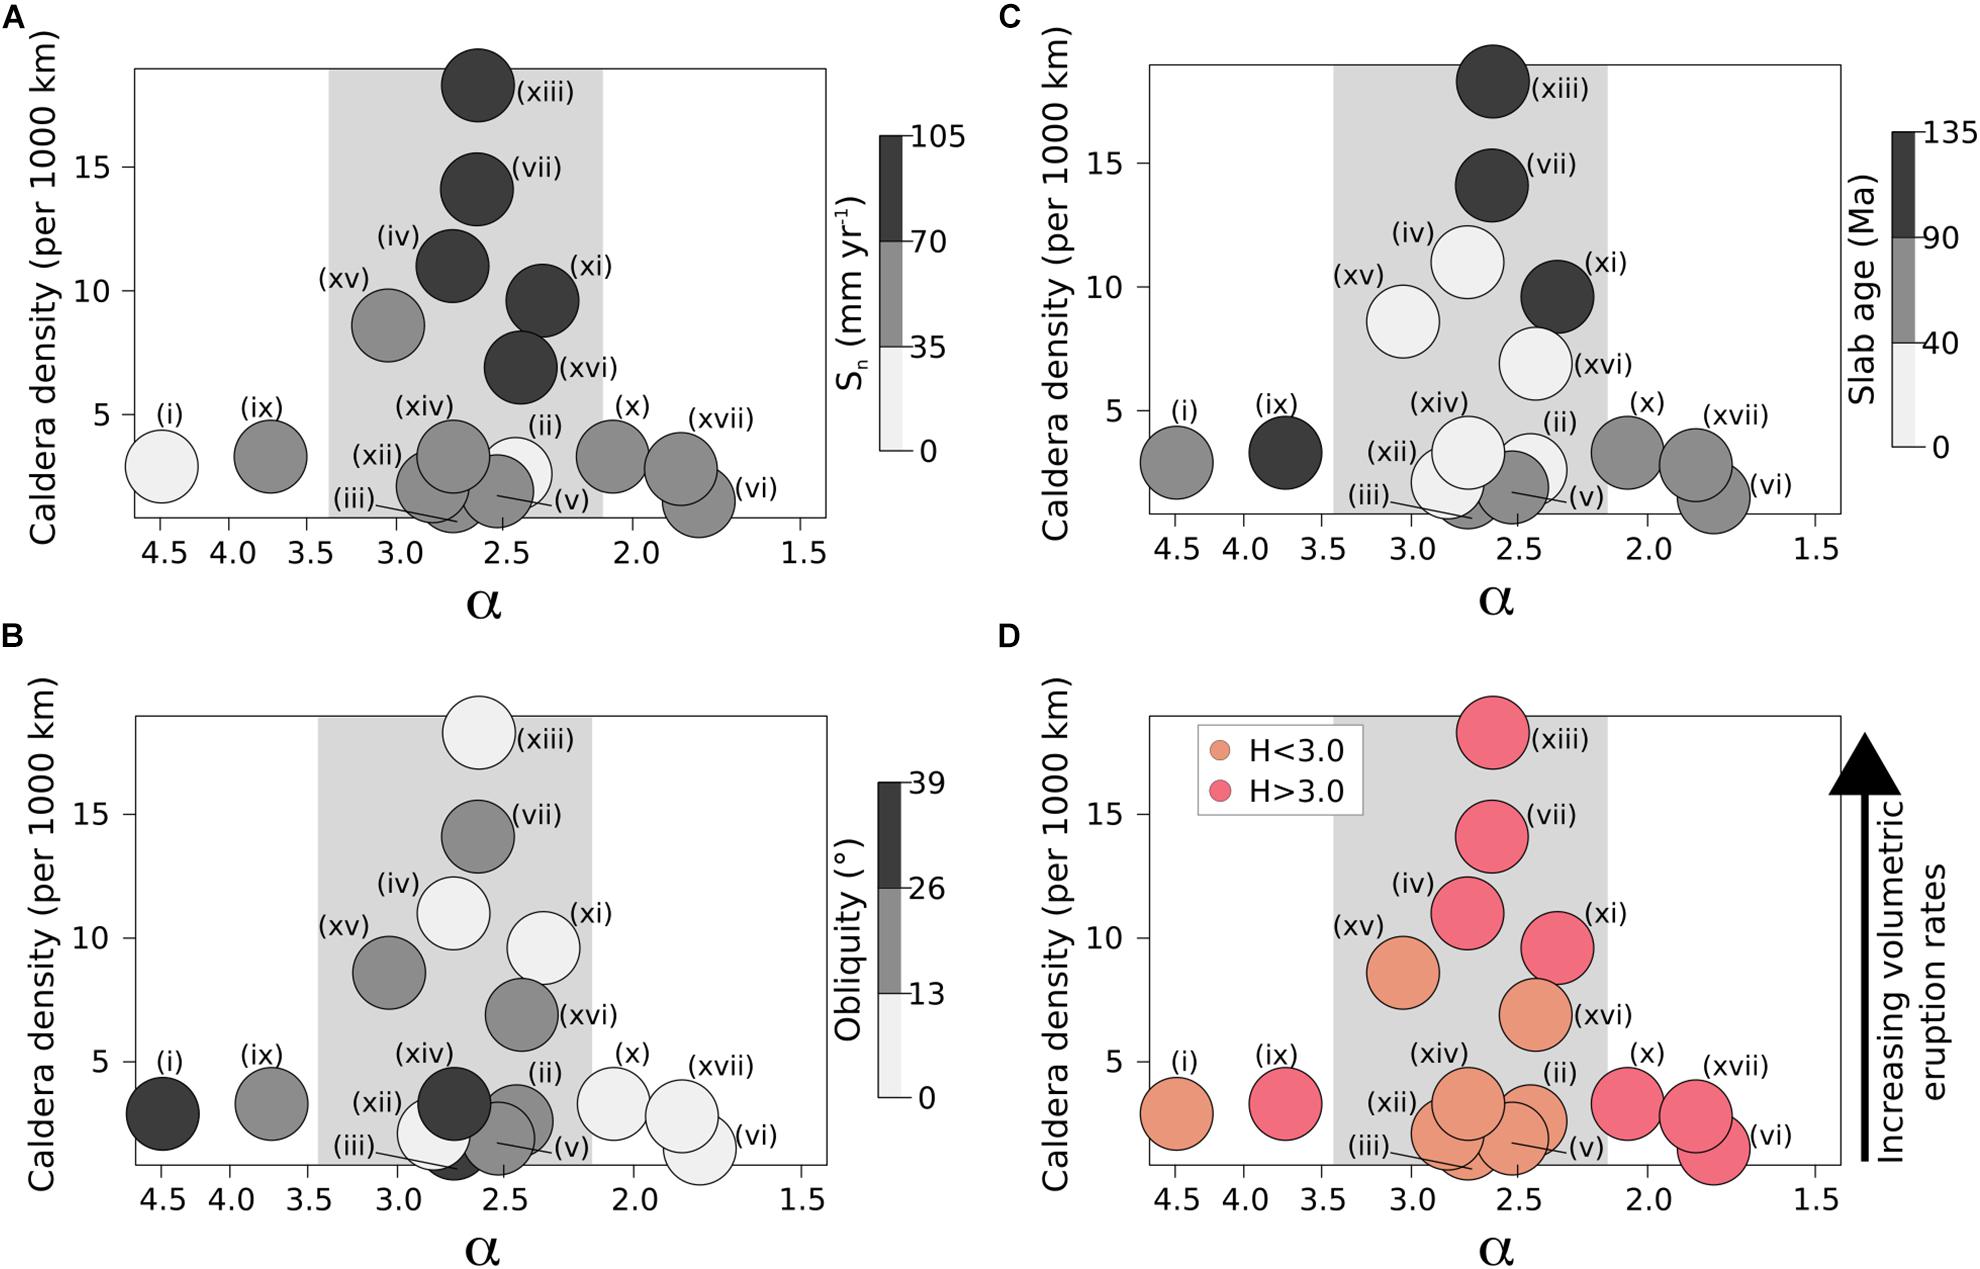
Figure 11. The distribution of the power-law slope parameter (α) versus the density of calderas in each volcanic arc (defined as the number of calderas per 1000 km; Hughes and Mahood, 2008). Values of α between 2.2 and 3.2 are characterized by the complete ranges of caldera densities, whereas extremes in α are only characterized by low caldera density. Arcs with high caldera density are characterized by (A) the highest rates of subduction normal to the arc. These high caldera density regions are also characterized by (B) low obliquity and (C) older slab ages. (D) Hence, for the arcs with α between 2.2 and 3.2, increasing caldera density is associated with a transition from a low-H regime to a high-H regime. Arcs are labeled as follows: (i) Antilles, (ii) Cascades, (iii) C. Aleutians, (iv) C. America, (v) C. Andes, (vi) E. Aleutians, (vii) Hokkaido-Kuriles, (ix) Izu-Bonin, (x) Java-Bali, (xi) Kamchatka-Kuriles, (xii) Mexico, (xiii) NE. Japan, (xiv) N. Andes (xv) Ryuku, (xvi) S. Andes, and (xvii) W. Alaska. Honshu is not included in the analyses by Hughes and Mahood, 2008, and is therefore not plotted.
It is important to recognize that the highest magma fluxes will not always favor larger eruptions, which is why a higher density of calderas does not equate to larger eruptions and no linear relationship is observed between α and the density of calderas (Figure 11). For example, volcanic arcs characterized by smaller (α > 3.2) or larger (α < 2.2) eruptions are only characterized by a low caldera density (Figure 11). The formation of large magmatic systems able to feed large volcanic eruptions will depend on the ability of the crust to accommodate large volumes of magma and the thermal-rheological state of the crust (Jellinek and DePaolo, 2003). We suggest that regimes (α > 3.2) that dominantly favor the vertical transport of magma (i.e., low crustal thickness) inhibit the development of larger magma bodies and the formation of large caldera-forming eruptions. Alternatively, regimes (α < 2.2) that dominantly favor slow accumulation of eruptible magma (low obliquity and moderate slab ages) favor the development of larger magma bodies (i.e., low-α) but over long durations resulting in infrequent large caldera-forming eruptions. In these settings prolonged magmatism without eruption will result in high intrusive-extrusive ratios, which will lead to viscoelastic behavior and further promote storage of magma and larger reservoir volumes (Karlstrom et al., 2017).
When comparing different eruption records it can be difficult to isolate the influence of a single tectonic or crustal parameter. Subduction zones are characterized by multiple parameters and the bootstrapped approach to develop a probabilistic graphical model has allowed us to identify significant correlations between parameters. We have been able to validate this approach by comparing the results of a graphical model for 162 volcanoes, with the average behavior of 17 volcanic arcs. Our results shed light on how tectonic parameters influence the competition between magma accumulation and eruption in volcanic arcs. For large-magnitude explosive volcanic eruptions up to Magnitude 7, we identify two broad regimes: (1) high-H regimes, characterized by normal convergence that favors the accumulation of larger volumes of magma, which are thermally sustained by high mantle productivity associated with older slabs; and (2) low-H regimes, characterized by oblique convergence that favors transport and eruption of smaller volumes of magma. Within both regimes, we suggest that more frequent perturbation and eruption of upper crustal reservoirs will favor smaller eruptions on average. Within the high-H regime, sufficiently high mantle productivity is required to favor the accumulation of large volumes of eruptible magma. However, the highest mantle productivity will favor perturbation and eruption of magma and so the oldest slabs are not associated with the highest proportion of larger eruptions. Within the low-H regime mantle productivity is a less important control on the accumulation of magma and instead crustal transport associated with thinner crust will lead to more frequent and thus smaller eruptions. For the largest eruptions on Earth (e.g., Magnitude 8), however, we suggest the effects of slab age and crustal thickness on triggering eruptions becomes negligible, and instead the accumulation of eruptible magma is dominantly controlled by thermomechanical modification of the crust.
Within the field of Earth Sciences many complex highly multidimensional datasets exist, providing an opportunity to use graphical models and structured learning as an exploratory tool to disentangle probabilistic relationships within heterogeneous data sets. Where data are plentiful the directionality of edges in graphical models can be estimated, which can aid the distinction of correlation and causality between different variables (Scutari and Denis, 2014). For example, structural learning algorithms could be employed to understand what parameters control the dynamics of subduction, regional and local controls on the geochemistry of volcanic eruptions (e.g., Till et al., 2019) or the location (e.g., Andikagumi et al., 2020), geometry (e.g., Geyer and Marti, 2008), or morphology of volcanoes (e.g., Grosse et al., 2012). Such a structured approach to data analysis reduces the impact of pre-conceptual biases and provides a framework to develop data-driven hypotheses for physical relationships by incorporating additional data into the graphical models, to test hypotheses using numerical models, and ultimately help to shed light on geological processes. Where data are plentiful we envisage that our approach can be focused to understand more subtle variations in eruption sizes between volcanic regions, by incorporating parameters such as the history of volcanism or geometry of the mantle wedge. We hope our results and the methodology that we have used can stimulate further research into understanding the connection between tectonic kinematics and volcanism.
All datasets and analytical codes generated for this study are included in the Supplementary Material.
TS designed the study and performed the analysis. All authors helped with the manuscript preparation and discussion. MS helped with the statistical analysis.
TS and LC received funding from the European Research Council (ERC) under the European Union’s Horizon 2020 Research and Innovation Programme (Grant Agreement No. 677493 – FEVER).
The authors declare that the research was conducted in the absence of any commercial or financial relationships that could be construed as a potential conflict of interest.
We would like to thank the two reviewers and both the Associate and Chief editors, whose detailed comments were extremely insightful and helped improve the manuscript.
We include the data on the 162 volcanoes and 15 regions used in our study (both in.xlsx and.txt format). We also include a script to perform the structure-learning algorithm described in section “Graphical Model.” Finally, we plot histograms for each of the variables in Table 1.
The Supplementary Material for this article can be found online at: https://www.frontiersin.org/articles/10.3389/feart.2020.00127/full#supplementary-material
Acocella, V., and Funiciello, F. (2010). Kinematic setting and structural control of arc volcanism. Earth Planet. Sci. Lett. 289, 43–53.
Andikagumi, H., Macpherson, C. G., and McCaffrey, K. J. W. (2020). Upper plate stress controls the distribution of mariana arc volcanoes. J. Geophys. Res. Solid Earth 2019:JB017391.
Annen, C. (2009). From plutons to magma chambers: thermal constraints on the accumulation of eruptible silicic magma in the upper crust. Earth Planet. Sci. Lett. 284, 409–416.
Brown, S. K., Crosweller, H. S., Sparks, R. S. J., Cottrell, E., Deligne, N. I., Guerrero, N. O., et al. (2014). Characterisation of the Quaternary eruption record: analysis of the large magnitude explosive volcanic eruptions (LaMEVE) database. J. Appl. Volcanol. 3:5.
Cagnioncle, A. M., Parmentier, E. M., and Elkins-Tanton, L. T. (2007). Effect of solid flow above a subducting slab on water distribution and melting at convergent plate boundaries. J. Geophys. Res. Solid Earth 112:B09402.
Caricchi, L., Annen, C., Blundy, J., Simpson, G., and Pinel, V. (2014). Frequency and magnitude of volcanic eruptions controlled by magma injection and buoyancy. Nat. Geosci. 7:126.
Caricchi, L., and Blundy, J. (2015). The temporal evolution of chemical and physical properties of magmatic systems. Geol. Soc. Spec. Publ. 422, 1–15.
Chaussard, E., and Amelung, F. (2012). Precursory inflation of shallow magma reservoirs at west Sunda volcanoes detected by InSAR. Geophys. Res. Lett. 39:L21311.
Chaussard, E., and Amelung, F. (2014). Regional controls on magma ascent and storage in volcanic arcs. Geochem. Geophy. Geosyst. 15, 1407–1418.
Cooper, K. M. (2019). Time scales and temperatures of crystal storage in magma reservoirs: implications for magma reservoir dynamics. Philos. Trans. R. Soc. A 377:20180009.
Daniels, K. A., and Menand, T. (2015). An experimental investigation of dyke injection under regional extensional stress. J. Geophys. Res. Solid Earth 120, 2014–2035.
de Silva, S. L., and Gosnold, W. D. (2007). Episodic construction of batholiths: insights from the spatiotemporal development of an ignimbrite flare-up. J. Volcanol. Geoth. Res. 167, 320–335.
de Silva, S. L., and Gregg, P. M. (2014). Thermomechanical feedbacks in magmatic systems: implications for growth, longevity, and evolution of large caldera-forming magma reservoirs and their supereruptions. J. Volcanol. Geoth. Res. 282, 77–91.
Degruyter, W., and Huber, C. (2014). A model for eruption frequency of upper crustal silicic magma chambers. Earth Planet. Sci. Lett. 403, 117–130.
Deligne, N. I., Sparks, R. S. J., and Brown, S. K. (2017). Report on potential sampling biases in the LaMEVE database of global volcanism. J. Appl. Volcanol. 6:7.
England, P., Engdahl, R., and Thatcher, W. (2004). Systematic variation in the depths of slabs beneath arc volcanoes. Geophys. J. Int. 156, 377–408.
England, P. C., and Katz, R. F. (2010). Melting above the anhydrous solidus controls the location of volcanic arcs. Nature 467:700.
Geyer, A., and Marti, J. (2008). The new worldwide collapse caldera database (CCDB): a tool for studying and understanding caldera processes. J. Volcanol. Geothermal Res. 175, 334–354.
Glazner, A. F. (1991). Plutonism, oblique subduction, and continental growth: an example from the Mesozoic of California. Geology 19, 784–786.
Grosse, P., de Vries, B. V. W., Euillades, P. A., Kervyn, M., and Petrinovic, I. A. (2012). Systematic morphometric characterization of volcanic edifices using digital elevation models. Geomorphology 136, 114–131.
Grove, T. L., Till, C. B., Lev, E., Chatterjee, N., and Médard, E. (2009). Kinematic variables and water transport control the formation and location of arc volcanoes. Nature 459, 694.
Gudmundsson, A. (2011). Deflection of dykes into sills at discontinuities and magma-chamber formation. Tectonophysics 500, 50–64.
Gudmundsson, A. (2012). Magma chambers: formation, local stresses, excess pressures, and compartments. J. Volcanol. Geoth. Res. 237, 19–41.
Huber, C., Bachmann, O., and Manga, M. (2009). Homogenization processes in silicic magma chambers by stirring and mushification (latent heat buffering). Earth Planet. Sci. Lett. 283, 38–47.
Hughes, G. R., and Mahood, G. A. (2008). Tectonic controls on the nature of large silicic calderas in volcanic arcs. Geology 36, 627–630.
Hughes, G. R., and Mahood, G. A. (2011). Silicic calderas in arc settings: characteristics, distribution, and tectonic controls. GSA Bull. 123, 1577–1595.
Jellinek, A. M., and DePaolo, D. J. (2003). A model for the origin of large silicic magma chambers: precursors of caldera-forming eruptions. Bull. Volcanol. 65, 363–381.
Karakas, O., Degruyter, W., Bachmann, O., and Dufek, J. (2017). Lifetime and size of shallow magma bodies controlled by crustal-scale magmatism. Nat. Geosci. 10:446.
Karlstrom, L., Lee, C. T., and Manga, M. (2014). The role of magmatically driven lithospheric thickening on arc front migration. Geochem. Geophys. Geosyst. 15, 2655–2675.
Karlstrom, L., Paterson, S. R., and Jellinek, A. M. (2017). A reverse energy cascade for crustal magma transport. Nat. Geosci. 10:604.
Kavanagh, J. L. (2018). Mechanisms of Magma Transport in the Upper Crust - Dyking in Volcanic and Igneous Plumbing Systems. Amsterdam: Elsevier, 55–88.
Kirby, S. H., Durham, W. B., and Stern, L. A. (1991). Mantle phase changes and deep-earthquake faulting in subducting lithosphere. Science 252, 216–225.
Kiyosugi, K., Connor, C., Sparks, R. S. J., Crosweller, H. S., Brown, S. K., Siebert, L., et al. (2015). How many explosive eruptions are missing from the geologic record? Analysis of the quaternary record of large magnitude explosive eruptions in Japan. J. Appl. Volcanol. 4:17.
Lallemand, S., Heuret, A., and Boutelier, D. (2005). On the relationships between slab dip, back-arc stress, upper plate absolute motion, and crustal nature in subduction zones. Geochem. Geophys. Geosys. 6:Q09006.
Langmuir, C. H., Bezos, A., Escrig, S., and Parman, S. W. (2006). Chemical systematics and hydrous melting of the mantle in back-arc basins. Geophys. Monogr. AGU 166:87.
Laske, G., Masters, G., Ma, Z., and Pasyanos, M. (2013). Update on CRUST1. 0—A 1-Degree Global Model of Earth’s Crust. Vienna: EGU General Assembly.
Marsh, B. D. (1981). On the crystallinity, probability of occurrence, and rheology of lava and magma. Contrib. Mineral. Petrol. 78, 85–98.
Menand, T. (2011). Physical controls and depth of emplacement of igneous bodies: a review. Tectonophysics 500, 11–19. doi: 0.1016/j.tecto.2009.10.016
Menand, T., Daniels, K. A., and Benghiat, P. (2010). Dyke propagation and sill formation in a compressive tectonic environment. J. Geophys. Res. Solid Earth 115:B08201.
Nakamura, K., Jacob, K. H., and Davies, J. N. (1977). Volcanoes as Possible Indicators of Tectonic Stress Orientation - Aleutians and Alaska, in Stress in the Earth. Basel: Birkhäuser, 87–112.
Paterson, S. R., and Ducea, M. N. (2015). Arc magmatic tempos: gathering the evidence. Elements 11, 91–98.
Perrin, A., Goes, S., Prytulak, J., Rondenay, S., and Davies, D. R. (2018). Mantle wedge temperatures and their potential relation to volcanic arc location. Earth Planet. Sci. Lett. 501, 67–77.
Poli, S., and Schmidt, M. W. (2002). Petrology of subducted slabs. Annu. Rev. Earth Plant Sci. 30, 207–235. doi: 10.1146/annurev.earth.30.091201.140550
Rawson, H., Pyle, D. M., Mather, T. A., Smith, V. C., Fontijn, K., Lachowycz, S. M., et al. (2016). The magmatic and eruptive response of arc volcanoes to deglaciation: insights from southern Chile. Geology 44, 251–254. doi: 10.1130/G37504.1
Rivalta, E., Taisne, B., Bunger, A. P., and Katz, R. F. (2015). A review of mechanical models of dike propagation: schools of thought, results and future directions. Tectonophysics 638, 1–42.
Rougier, J., Sparks, R. S. J., and Cashman, K. V. (2018a). Regional and global under-recording of large explosive eruptions in the last 1000 years. J. Appl. Volcanol. 7:1.
Rougier, J., Sparks, R. S. J., Cashman, K. V., and Brown, S. K. (2018b). The global magnitude–frequency relationship for large explosive volcanic eruptions. Earth Planet. Sci. Lett. 482, 621–629.
Russell, S. J., and Norvig, P. (2009). Artificial Intelligence: A Modern Approach. Upper Saddle River: Prentice Hall.
Scutari, M., and Denis, J. B. (2014). Bayesian Networks: With Examples in R. London: Chapman and Hall/CRC.
Scutari, M., and Nagarajan, R. (2013). Identifying significant edges in graphical models of molecular networks. Artif. Intell. Med. 57, 207–217.
Scutari, M., Vitolo, C., and Tucker, A. (2019). Learning Bayesian networks from big data with greedy search: computational complexity and efficient implementation. Stat. Comput. 29, 1095–1108.
Sheldrake, T. (2014). Long-term forecasting of eruption hazards: a hierarchical approach to merge analogous eruptive histories. J. Volcanol. Geoth. Res. 286, 15–23.
Sheldrake, T., and Caricchi, L. (2017). Regional variability in the frequency and magnitude of large explosive volcanic eruptions. Geology 45, 111–114.
Stern, T. A. (1985). A back-arc basin formed within continental lithosphere: the Central Volcanic Region of New Zealand. Tectonophysics 112, 385–409.
Sternai, P., Caricchi, L., Garcia-Castellanos, D., Jolivet, L., Sheldrake, T. E., and Castelltort, S. (2017). Magmatic pulse driven by sea-level changes associated with the Messinian salinity crisis. Nat. Geosci. 10, 783–787.
Syracuse, E. M., and Abers, G. A. (2006). Global compilation of variations in slab depth beneath arc volcanoes and implications. Geochem. Geophys. Geosys. 7:Q05017.
Taisne, B., and Jaupart, C. (2011). Magma expansion and fragmentation in a propagating dyke. Earth Planet. Sci. Lett. 301, 146–152.
Till, C. B., Kent, A. J. R., Abers, G. A., Janiszewski, H. A., Gaherty, J. B., and Pitcher, B. W. (2019). The causes of spatiotemporal variations in erupted fluxes and compositions along a volcanic arc. Nat. Commun. 10, 1–12.
Turner, S. J., and Langmuir, C. H. (2015a). The global chemical systematics of arc front stratovolcanoes: evaluating the role of crustal processes. Earth Planet. Sci. Lett. 422, 182–193.
Turner, S. J., and Langmuir, C. H. (2015b). What processes control the chemical compositions of arc front stratovolcanoes? Geochem. Geophys. Geosys. 16, 1865–1893.
van Keken, P. E., Currie, C., King, S. D., Behn, M. D., Cagnioncle, A., He, J., et al. (2008). A community benchmark for subduction zone modeling. Phys. Earth Planet 171, 187–197.
Verma, T., and Pearl, J. (1991). Equivalence and Synthesis of Causal Models. Los Angeles, CA: UCLA. 220–227.
Vigneresse, J. L. (1995). Control of granite emplacement by regional deformation. Tectonophysics. 249, 173–186.
Yanez, G., and Cembrano, J. (2004). Role of viscous plate coupling in the late Tertiary Andean tectonics. J. Geophys. Res. Solid Earth 109:B02407.
Keywords: bayesian network, magma storage, volcanic eruption record, structure leaning, magma accumulation
Citation: Sheldrake T, Caricchi L and Scutari M (2020) Tectonic Controls on Global Variations of Large-Magnitude Explosive Eruptions in Volcanic Arcs. Front. Earth Sci. 8:127. doi: 10.3389/feart.2020.00127
Received: 03 January 2020; Accepted: 02 April 2020;
Published: 05 May 2020.
Edited by:
Shanaka L. de Silva, Oregon State University, United StatesReviewed by:
Leif Karlstrom, University of Oregon, United StatesCopyright © 2020 Sheldrake, Caricchi and Scutari. This is an open-access article distributed under the terms of the Creative Commons Attribution License (CC BY). The use, distribution or reproduction in other forums is permitted, provided the original author(s) and the copyright owner(s) are credited and that the original publication in this journal is cited, in accordance with accepted academic practice. No use, distribution or reproduction is permitted which does not comply with these terms.
*Correspondence: Tom Sheldrake, dGhvbWFzLnNoZWxkcmFrZUB1bmlnZS5jaA==
Disclaimer: All claims expressed in this article are solely those of the authors and do not necessarily represent those of their affiliated organizations, or those of the publisher, the editors and the reviewers. Any product that may be evaluated in this article or claim that may be made by its manufacturer is not guaranteed or endorsed by the publisher.
Research integrity at Frontiers
Learn more about the work of our research integrity team to safeguard the quality of each article we publish.