 Mana Tsuchida
 Masanori Kameyama
- Geodynamics Research Center, Ehime University, Matsuyama, Japan
We conducted numerical simulations of thermal convection of highly viscous fluids in a 2-D spherical annulus in order to study what mechanisms control the dynamic behaviors of subducting slabs such as the formation of “stagnant slabs” in the mantle transition zone (MTZ) and their descent into the lower mantle. Two series of experiments are carried out, by applying the different histories of migrating motion of “trench” where the slab of cold fluids descends from the top surface, together with systematically varying the velocities of subducting slabs and trench migration, the Clapeyron slope at around 660 km depth, and the viscosity jump between the upper and lower mantle. In the first series of experiments where the migration rate of trench is kept constant with time, our model successfully reproduces the diverse morphology of subducting slabs depending on the delicate combinations of control parameters, including five fundamental types named penetration, accumulation, entrainment, long-term stagnation and short-term stagnation (SS). In addition to the above fundamental types, we found two distinctive types of slab behaviors (named pS and cS) where the slabs are stagnated at the base of MTZ after they experience the penetration or collapse into the lower mantle and yield the snapshot behaviors very close to those of SS at some time instances. In the second series of experiments where we imposed a step-like change in the trench retreat velocity with time, we found that a deceleration of trench retreat enhances the collapse of the horizontally-lying or stagnant slabs into the lower mantle by, for example, inducing the avalanche of stagnant slabs from its hinge. In particular, we obtained in some cases the flattening of slabs well below the 660 km discontinuity without any discontinuous changes in mantle properties at the depth. Our results suggest that the formation and descent of stagnant slabs are strongly related to the trench retreat, particularly through its temporal changes. In other words, the variations in the shapes of subducting slabs in nature are most likely to reflect the difference in the history of trench migration.
1. Introduction
Seismic tomography studies (e.g., Fukao and Obayashi, 2013) have revealed that the slabs of subducted plates show diverse behaviors in the mantle beneath various subduction zones. In several regions such as Japan and Izu-Bonin arc, for example, so-called “stagnant slabs” are observed at the base of the mantle transition zone (MTZ), without penetrating into the lower mantle owing to the horizontal flattening at around the 660 km discontinuity. In other subduction zones where (parts of) the slabs have entered into the lower mantle, not all slabs can reach the deep lower mantle readily and smoothly as observed in, for example, beneath Central America arc: It is now recognized that in some regions subducted slabs seem to be stagnated at about 1,000 km depths (e.g., Java arc), experiencing a stagnation at the MTZ and penetration into the lower mantle simultaneously (e.g., Tonga arc), or stagnating at the MTZ before collapsing from its hinge (e.g., Mariana arc).
Since the numerical studies of mantle convection first arose (e.g., McKenzie et al., 1973), the dynamic behaviors of subducted plates in the mantle have been intensively studied, particularly focusing on the mechanisms of the formation of stagnant slabs in the MTZ. Christensen (1996) developed a 2-D numerical model in Cartesian geometry which incorporates the effects of an endothermic phase boundary and viscosity jump at the 660 km discontinuity together with imposed motions of subducting plate and trench at the surface, and reported that the trench retreat plays an important role in flattening of subducting slabs at the base of MTZ. Torii and Yoshioka (2007) systematically studied the influence of these physical parameters on the formation of stagnant slabs, and showed that stagnant slabs can be generated in realistic parameter ranges. These numerical models are further improved by many workers through incorporating other complicated factors such as the effects of the age of the subducting and overriding plate (Garel et al., 2014), the viscosity reduction in slabs due to the grain-size reduction (Čížková et al., 2002; Nakakuki et al., 2010), the presence of metastable phase transitions in the cold slabs (Tetzlaff and Schmeling, 2000; Agrusta et al., 2014).
In addition to the dynamics of the slabs at the base of MTZ, a growing number of numerical studies have been conducted on the avalanche of the subducting slabs into the lower mantle. Yoshioka and Naganoda (2010) carried out numerical experiments in a 2-D box model with imposed surface velocity, and pointed out that the trench advance and trench jumps cause the eventual fall of stagnant slabs into the lower mantle as proposed by van der Hilst and Seno (1993). Agrusta et al. (2017) used a 2-D self-consistent subduction models to investigate the transition between the stagnation and penetration of slabs, and have revealed that these transitions are strongly influenced by many agents such as the temporal changes in trench retreat velocity, the Clapeyron slope at the 660 km discontinuity, the subducting plate age, and so on. On the other hand, recent numerical models of the subduction in the Mariana arc (e.g., Čížková and Bina, 2015; Faccenna et al., 2018) suggested the double subduction system as a possible mechanism that triggers the change from trench retreat to trench advance in this region.
In this study, we will further develop numerical model of subducted slabs in the convecting mantle using 2-D model in spherical annulus, in order to study what mechanisms control the behaviors of subducted slabs in the mantle at various depths, such as the formation of stagnant slabs in the MTZ and the course of its avalanche into the lower mantle. Compared with earlier works, we will perform numerical calculations by varying the values of control parameters systematically over broad ranges. As our initial attempt to study the effects of various parameters, we will follow the strategy by Torii and Yoshioka (2007) and focus on the effects of trench migration rate and its temporal change. By carefully comparing the shapes of slabs obtained in our simulation models with those estimated from seismic tomography, we aim at deepening the understanding on the dynamics and temporal evolutions of subducting slabs in the mantle.
2. Model Description
2.1. Model Setup
Our numerical model is schematically shown in Figure 1A. We consider thermal convection of mantle materials which is driven by a subducting and retreating motion of a cold slab in one eighth (azimuth θmin ≤ θ ≤ θmax where ) of a two-dimensional spherical annulus whose outer and inner radii are rmax = 6, 400 km and rmin = 4, 400 km, respectively. We take into account the effects of the phase transition from olivine to wadsleyite at around 410 km depth and that from ringwoodite to bridgmanite and ferro-periclase at around 660 km depth. The density contrasts associated with these phase transitions are taken to be 8.3 and 7.8%, respectively (Dziewonski and Anderson, 1981). The Clapeyron slope of the phase transition at 410 km depth is taken to be γ410 = +3 MPa/K, while that of 660 km depth γ660 is varied from −3 MPa/K or −1 MPa/K, based on the result of laboratory experiments (e.g., Ito and Takahashi, 1989; Katsura et al., 2003; Fei et al., 2004). The meanings and values of parameters used in this study are given in Table 1.
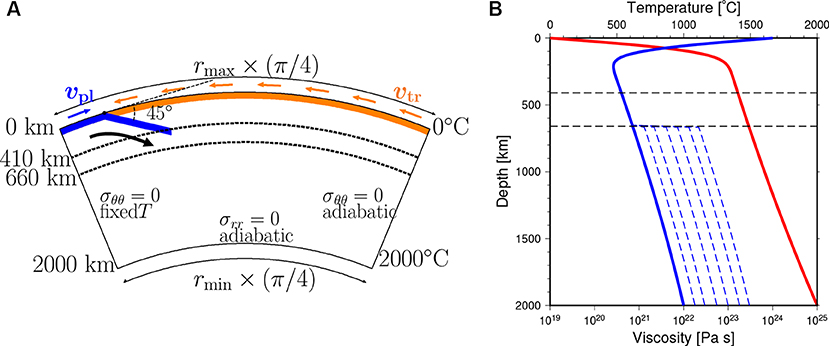
Figure 1. (A) A schematic figure of our 2-D numerical model in a spherical annulus. The blue segment indicates the channel of cold fluid as a model of subducting plate. The maximum depth of its upper plane is 400 km. The orange segment shows the overriding plate. The dashed lines are the phase boundaries around 410 and 660 km. (B) The initial depth distribution of temperature T (red line) and viscosity η (blue lines). The horizontal axes show the viscosity (bottom) and the temperature (top), and the vertical axis shows the depth. The blue solid line indicates the viscosity calculated by Equation (1) with rη = 1, and blue dashed lines indicate those with rη = 1.8, 3, 5.6, 10, 18, and 30, respectively.
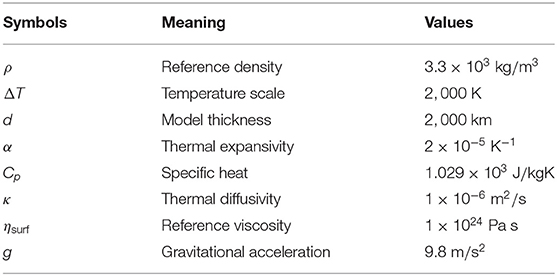
Table 1. Meanings and values of symbols in this study.
The viscosity η of mantle material is assumed to depend exponentially on the temperature T and pressure p (or the depth from the top surface), and given by
where C is the temperature at the top surface, r (rmin ≤ r ≤ rmax) is the distance from the center of the Earth, ηsurf is the viscosity at the top surface (r = rmax and T = Tsurf), ΔT is the temperature scale which is arbitrarily chosen to be 2, 000°C, and and express temperature and depth dependence of the viscosity. In addition, the effect of the viscosity jump between the upper and lower mantle is introduced by f(Γ660) through the “phase function” Γ660 of the endothermic phase transition at around 660 km depth (Christensen and Yuen, 1985); f(Γ660) is taken to be 1 and rη in the upper and lower mantle, respectively. Here, we assume the value of rη to be 1 ≤ rη ≤ 30 (see Figure 1B) as had been employed in earlier studies (e.g., Torii and Yoshioka, 2007; Yoshioka and Naganoda, 2010; Kameyama and Nishioka, 2012).
In this study, the kinematic motions of subducting and overriding plates are imposed near the top surface, as in our earlier work (Kameyama and Nishioka, 2012). First, as in the works by Yoshioka and coworkers (Yoshioka and Sanshadokoro, 2002; Torii and Yoshioka, 2007; Yoshioka and Naganoda, 2010), the subducting plate is modeled by a downward flow of cold and viscous fluid at a uniform velocity vpl along with a channel of 80 km thick which guides the cold fluid from the top surface into the MTZ. The channel is bent downward with the dip angle 45° at the trench which is located away from the left-side of the top surface (θ = θmax). In addition, the length of the channel is assumed to increase with time, in order to model the descent of cold slab. The maximum depth of the upper plane of the 80 km thick channel is taken to be 400 km. Second, we take into account the effect of trench retreat by the similar method as van Hunen et al. (2000). Here the overriding plate is assumed to migrate together with the trench and channel at a rate of vtr in the horizontal direction with respect to the deep mantle. That is, the effect of trench migration is numerically implemented through the coordinate transformation between the two “reference frames” which laterally moves with respect to each other at the angular velocity .
In the present numerical model, the rate of plate convergence vc at the trench is given by the sum of the subducting plate velocity (vpl) and the overriding plate velocity (vtr).
When non-dimensionalized using a velocity scale of vscale ≡ κ/(rmax − rmin) (where κ = 10−6 m2/s is thermal diffusivity), the dimensionless rate of plate convergence is kept to be 5, 000 throughout this study, while that of trench migration are changed from 0 to 3, 000. That is, vc = 7.88 cm/yr and vtr ≤ 4.73 cm/yr are employed.
The initial distribution of temperature T is given by
where C is the potential temperature of the mantle, α is thermal expansivity, and Cp is specific heat. In the right-hand side, the first and second terms represent the effects of half-space cooling (Turcotte and Schubert, 2002) and adiabatic compression (Figure 1B), respectively. In this equation, τ(θ) is the age of plate as a function of the horizontal position θ. At the trench (θ = θmax − θtr), τ(θ) is taken to be τpl (=101Ma). On the other hand, τ(θ) decreases with θ in the oceanic region (θ ≥ θmax − θtr), while τ(θ) = τpl is fixed in the continental region (θ ≤ θmax − θtr).
The boundary conditions for temperature T are (i) fixed temperature C at the top surface (r = rmax), (ii) fixed temperature at the left boundary (θ = θmax) in order to maintain the initial thermal structure of subducting oceanic plate given by Equation (3), and (iii) adiabatic conditions at the bottom (r = rmin) and right (θ = θmin) boundaries. On the other hand, the boundary conditions for velocity v are given by (i) vr = 0 and fixed vθ at the top surface, (ii) vr = 0 and at the both side boundaries (θ = θmin, θmax) and (iii) vθ = 0 and at the bottom boundary, where vθ and vr are θ- and r-components of the velocity, respectively. That is, no slip condition is assumed at the top surface, while at the other boundaries the flow is taken to be perpendicular to the boundaries and zero normal stress. In addition, the condition
is imposed at the right-hand side wall so as to keep the net mass flux zero across the boundary.
2.2. Numerical Techniques
We calculate the flow field, the distributions of temperature T and their temporal variations by solving the governing equations for conservations of mass, momentum and the thermal energy under the extended Boussinesq approximation (Christensen and Yuen, 1985). The conservation of the thermal energy includes the effects of adiabatic heating and latent heat due to the phase transitions. However, the effect of viscous dissipation (or frictional heating) is ignored in this study, in order to avoid a spuriously high dissipation near the trench where the channel is sharply bent in an artificial manner. The equations for conservation of mass and momentum are written in terms of the stream function ψ defined by
instead of directly solving for the velocity v and pressure p. On the other hand, the time integration of energy equation is carried out by the Crank-Nicolson scheme.
The discretization of the basic equations are carried out based on the finite volume method. The region is uniformly divided into 256 and 640 meshes in r- and θ-directions, respectively. This pattern of mesh division yields almost square numerical meshes near the top surface. The discretized equations for temperature T and flow fields (velocity v and pressure p) are solved by our thermal convection simulation code for 2-D spherical annulus (Kameyama and Harada, 2017). The numerical validity of our code has been already verified by comparing with previous study (Zhong and Gurnis, 1993). The time increment δt is taken to be the half of the value determined from the numerical stability of energy equation, yielding δt ~ 1.6 × 10⁴ years. We confirmed that δt defined thus is small enough, by comparing the numerical results for several cases with the ones done using smaller time increments by factors of 0.5 and 0.25. The time integrations are carried out for more than 100 million years (My) for all the cases presented here, and for up to 150 My in some cases where the slab stagnation is observed (see below for details).
3. Results
Two series of experiments are presented in this study, using different histories of the migrating motion of trench. In the first series of experiments, we carried out calculations where the rate vtr of trench retreat is assumed to be constant with time. In the second series of experiments, on the other hand, we take into account the temporal changes in vtr, by imposing its step-like change with time.
3.1. Slab Behaviors Under Constant Rate of Trench Retreat
In the first series of experiments, we investigate the subduction dynamics obtained from a series of 84 numerical experiments where we systematically varied the values of viscosity jump rη between the upper and lower mantle, Clapeyron slope γ660 at 660 km discontinuity, and the rate vtr of trench retreat (see Table 2). The velocity vpl of subducting plate is accordingly varied in order to fix the rate of plate convergence vc at the trench. We here note that, rather than vpl, vc controls the amount of the slab of cold fluid which is “injected” into the mantle during the period of calculation. In other words, for all the cases with fixed vc presented here, the effects of negative buoyancy of cold slabs are equal at the same elapsed times from the onset of subduction.

Table 2. Cases and results of numerical simulations without time change in vtr.
3.1.1. The Effects of Control Parameters on Slab Dynamics
We first discuss the effects of the control parameters in this study (rη, γ660, and vtr) on the behaviors and shapes of subducting slab around the MTZ and in the lower mantle. In Figure 2 we show the snapshots of the distributions of temperature T and viscosity η at the elapsed time of about 50 million years (My) after the onset of subduction, obtained for four selected cases from the first series of calculations. Shown in Figure 2A are the snapshots of the case where we employed rη = 1, γ660 = −1 MPa/K, and vtr = 0 cm/yr. As can be clearly seen from the figure, a slab of cold and viscous fluid is subducting through the channel down to the top of MTZ (see the phase transition at around 410 km depth indicated by the upper red lines). The slab further sinks across the phase transition at around 660 km depth (indicated by the lower red lines), and finally penetrates into the lower mantle directly and smoothly.
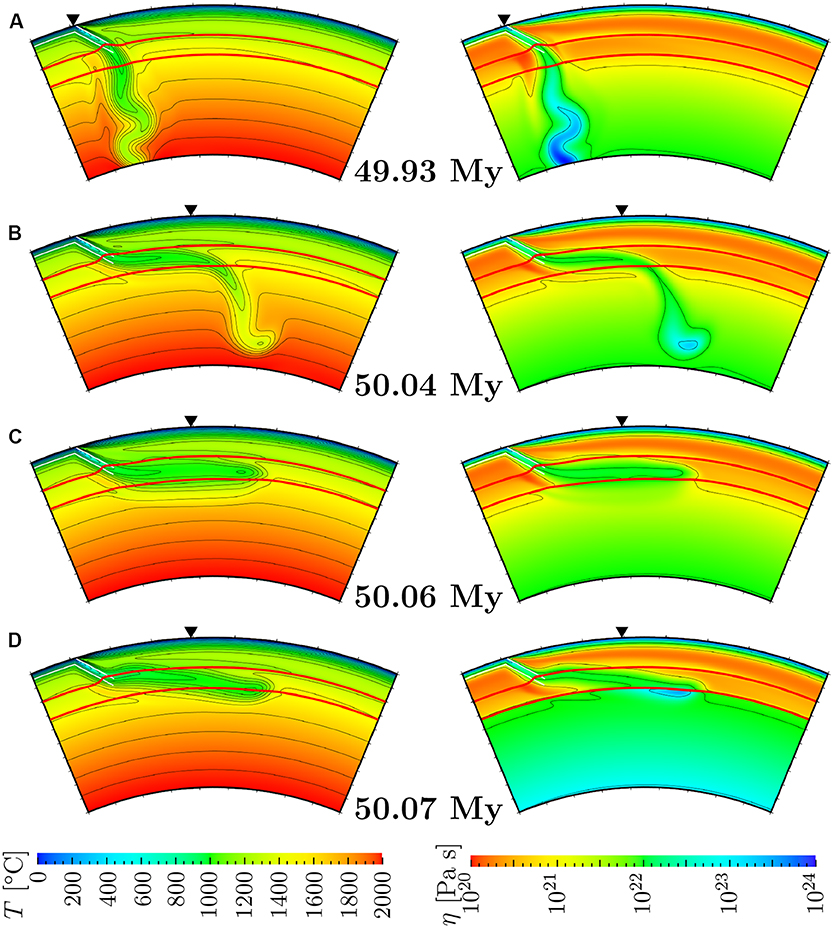
Figure 2. Snapshots of the distribution of temperature T (left) and viscosity η (right) at around 50 My after the initiation of subduction for (A) reference case (vtr = 0 cm/yr, rη = 1, γ660=-1 MPa/K), (B) case with lager trench retreat velocity (vtr = 3.15 cm/yr, rη = 1, γ660=-1 MPa/K), (C) case with steeper negative Clapeyron slope (vtr = 3.15 cm/yr, rη = 1, γ660=-3 MPa/K), and (D) case with larger viscosity jump (vtr = 3.15 cm/yr, rη = 10, γ660=-1 MPa/K). The values of temperature T are shown in colors with the contour lines at 1,000, 1,100, 1,200, 1,300, 1,400, 1,500, 1,600, 1,700, 1,800, and 1,900 [°C], and the values of viscosity η are shown in colors with contour lines at 1020, 1021, 1022, 1023, and 1024 [Pa s]. The color scales are shown at the bottom of figure. The red lines indicate the phase boundaries around 410 km and 660 km, while the thin white lines indicate the channel of the cold descending fluid. In each figure, the initial positions of trench are indicated by the black triangles.
In order to see the influence of the trench retreat, we show in Figure 2B the snapshot of the case where a non-zero rate of trench retreat is given (vtr = 3.15 cm/yr) while the values of other parameters are the same as those in Figure 2A. By comparing Figure 2B and Figure 2A we can clearly see that the trench retreat enhances the flattening and stagnation of subducted slabs. Indeed, a horizontally-lying portion of cold slab can be observed in the MTZ in Figure 2B, which is in a stark contrast to the case in Figure 2A. However, as can be seen from Figure 2B, the entire portion of subducted slab is not stagnated around the 660 km depth; the tip of cold slab penetrates and sinks in the lower mantle. This indicates that the combined effect of vtr = 3.15 cm/yr and γ660 = −1 MPa/K (and rη=1) employed in this case is not strong enough for the entire cold slab to be stagnated.
We next present the snapshots of Figures 2C,D in order to see the influences of γ660 and rη under a non-zero vtr. Shown in Figures 2C,D are the cases where a steeper γ660 = −3 MPa/K and a larger jump rη = 10 in viscosity is employed at the 660 km discontinuity than those in Figure 2B, respectively, while the values of other parameters are kept unchanged. We can clearly see that, from the comparison with Figure 2B, the entire portion of subducted slab stagnates at the 660 km discontinuity, either because of a positive buoyancy in the cold slab induced by the phase transition with strongly negative Clapeyron slope γ660 (in Figure 2C) or because of a strong viscous resistance coming from highly viscous lower mantle with large rη (in Figure 2D). These results are consistent with the earlier findings by Torii and Yoshioka (2007) that classified the manner of slab stagnation into buoyancy-dominated and viscosity-dominated regimes.
Our results with 2-D spherical annulus showed that all of the control parameters in this study (the viscosity jump rη and Clapeyron slope γ660 at the 660 km discontinuity, and the rate vtr of trench retreat) enhances the slab stagnation at the base of MTZ. Among them, rη and γ660 tend to prevent subducting slabs from penetrating into the lower mantle, whereas vtr flattens the subducted slabs at around the MTZ. These results are consistent with those of earlier numerical studies in the 2-D box model (e.g, Torii and Yoshioka, 2007; Kameyama and Nishioka, 2012). The close similarity between the results of our experiments and earlier ones also suggests that the effect of the Earth's curvature is minor on the dynamic behavior of slabs in the shallow mantle.
3.1.2. Five Fundamental Types of Slab Behaviors
Our systematic calculations of 84 cases showed that there are five fundamental types for the behaviors of subducted slabs at around the MTZ, depending on the combinations of three control parameters (rη, γ660, and vtr). Figure 3 shows the temporal development of the five types of subducting slab behaviors. In Table 2 and Figure 4, on the other hand, we summarize the classification of subducting slab behaviors for all 84 cases.
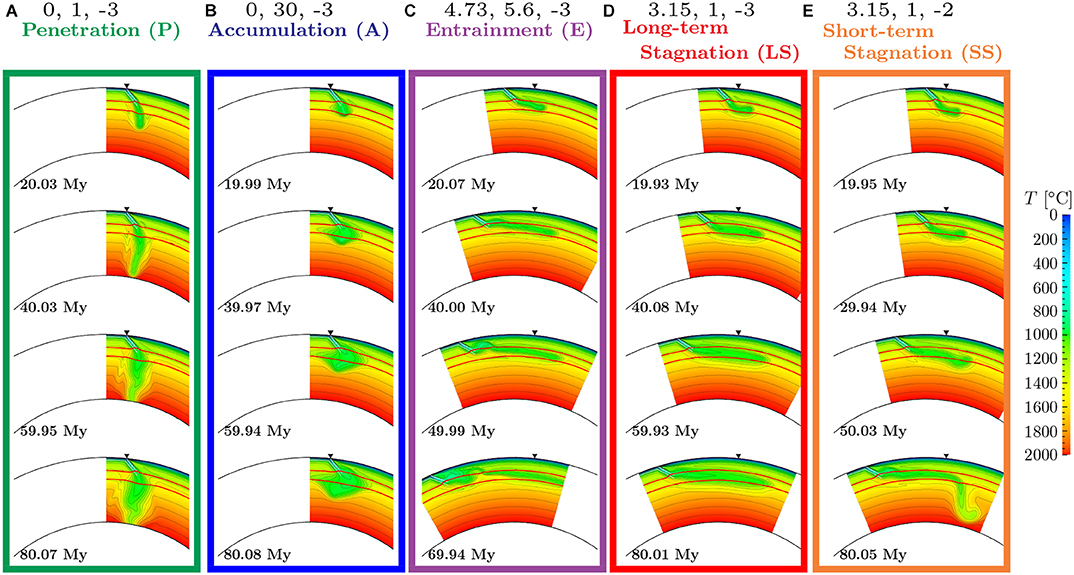
Figure 3. Comparison between the evolution of five types of subducting slab morphologies: (A) Penetration (green), (B) Accumulation (blue), (C) Entrainment (purple), (D) Long-term Stagnation (red), and (E) Short-term Stagnation (orange). Indicated at the top of respective frames are the trench retreat velocity vtr [cm/yr], the viscosity jump between the upper and lower mantle rη, and the Clapeyron slope at the 660 km discontinuity γ660 [MPa/K] for each case, respectively. The meaning of the colors, contour lines, red and white lines, and black triangles are same as in Figure 2.
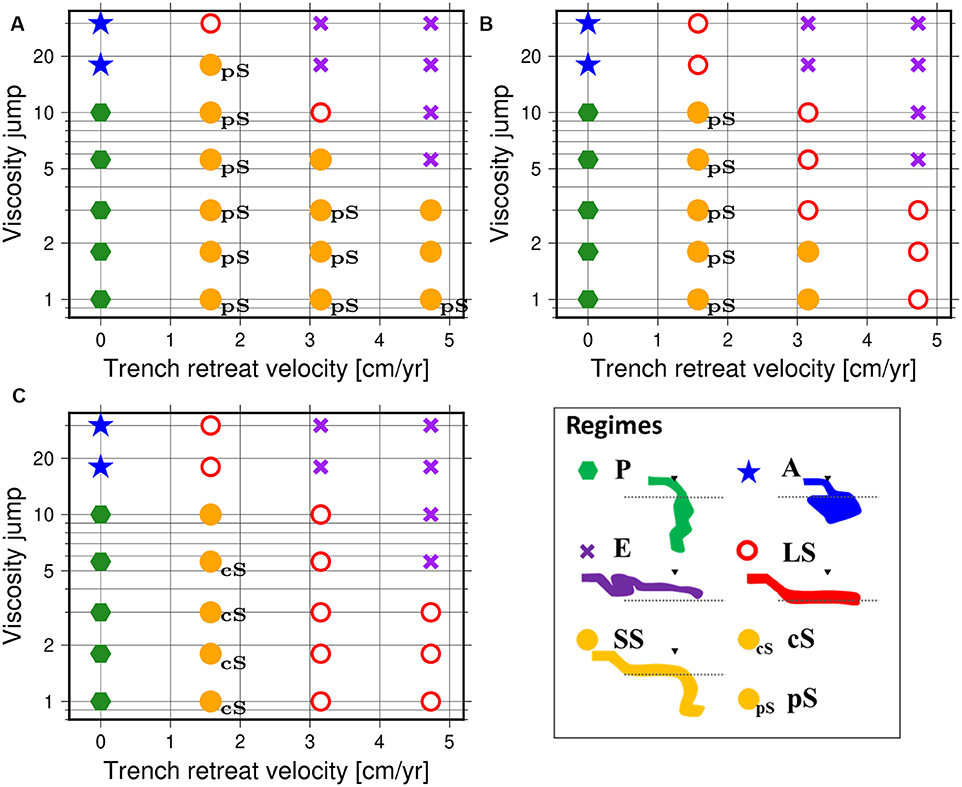
Figure 4. Regime diagrams of the slab morphologies as a function of trench retreat velocity vtr and viscosity jump rη for the cases of (A) γ660 = −1 MPa/K, (B) γ660 = −2 MPa/K, and (C) γ660=-3 MPa/K. The types of Penetration (P), Accumulation (A), Entrainment (E), Long-term Stagnation (LS), and Short-term Stagnation (SS) are represented by green hexagons, blue stars, purple crosses, red open circles, and orange filled circles, respectively. In addition, the types of stagnation after penetration (pS) and stagnation after collapse (cS) are represented by small letters of “pS” and “cS” in the right side of filled orange circles, respectively. In the schematic illustration of the regimes, the black triangles indicate the initial trench location, and the dashed lines indicate the 660 km discontinuity.
Among the five types of slab behaviors, first three are the ones where subducted slabs are not stagnated at the base of MTZ owing to extreme choices of control parameters other than γ660. Figure 3A shows the “penetration” (P)-type behavior of slabs. The P-type is characterized by the penetration of cold slabs into the lower mantle immediately and vertically. This type of behavior is observed for 15 cases out of 84 calculations, and occurs for vtr = 0 and small rη (rη ≤ 10). On the other hand, Figure 3B shows the “accumulation” (A)-type behavior of slabs. In the A-type, subducted slabs do not penetrate into the lower mantle but accumulate at around the 660 km discontinuity, owing to the large viscosity jump between the upper and lower mantle. This type of behavior is observed for 6 cases out of 84 calculations, and occurs for vtr = 0 and large rη (rη ≥ 18). In Figure 3C we show the third type of slab behaviors, called “entrainment” (E)-type, observed for the cases when both vtr and rη are large. In the E-type, subducting slabs are entrained and pulled up by a local circulations in the shallow mantle driven by a trench retreat and is broken into pieces, since the effects of the imposed vtr and rη are too strong. This type is observed in 18 cases of our calculations.
The fourth and fifth types of slab behaviors are the ones where the stagnant slabs are observed in the presence of trench retreat (vtr ≠ 0) in addition to the effects of γ660 and rη. Shown in Figure 3D is an example of “long-term stagnation” (LS)-type, while in Figure 3E is that of “short-term stagnation” (SS)-type. For both types, the subducting slab is bent and flattened at the 660 km discontinuity, forming a horizontally-lying stagnant slab at the base of MTZ in the earliest stage of subduction. In the LS-type, subducted slabs are stagnated around the 660 km discontinuity for a long time interval (at least more than 80 My) without penetrating into the lower mantle. The horizontally-lying portion of cold slab becomes longer with time along with the trench retreat. In the SS-type, in contrast, the stagnant slab starts to collapse into the lower mantle at its tip after the first several ten million years, because the negative buoyancy caused by the mass of the stagnant slab dominates the positive buoyancy owing to the negative Clapeyron slope γ660 and the resistance due to the viscosity jump between the upper and lower mantle. The LS- and SS-type of behaviors are observed for 20 and 6 cases out of 84 calculations, respectively.
We however note that not all the patterns of slab behaviors obtained here fall in any of five fundamental types: In several cases we observed distinctive temporal evolutions whose snapshots are very similar to those of SS-type at some time instances. In the next subsubsection, we will study the slab behaviors of such cases in more detail.
3.1.3. Distinctive Slab Behaviors: Stagnation After Penetration or Collapse
In the cases of short-term stagnation (SS) described in section 3.1.2, the cold slabs sink into the lower mantle after they lie horizontally at the base of MTZ. In some other cases, in contrast, we observed that a horizontally-lying (or “stagnated”) portion of cold slab develops after a part of slab sinks into the lower mantle. By the letters “pS” or “cS” attached with the filled orange circles in Figure 4, we indicate the values of parameters which yield a “stagnation” of slab after its penetration (hereafter called “pS”) or collapse (“cS”) into the lower mantle. In Figure 5, on the other hand, we show the temporal evolution of the distributions of temperature T and horizontal stress σθθ around the subducting slabs for the cases with pS and cS, together with that of SS for comparison. As can be seen from the snapshots at around t = 10 My, the behaviors of subducting slabs are very similar for all the three types before the tips of subducting slabs impinge the 660 km discontinuity. In addition, the behaviors of slabs are quite similar for sufficiently large t (e.g., t > 60 My) between the types. However, during the period of temporal evolution except for very early and very late stages, the behaviors of slabs significantly differ between the types.
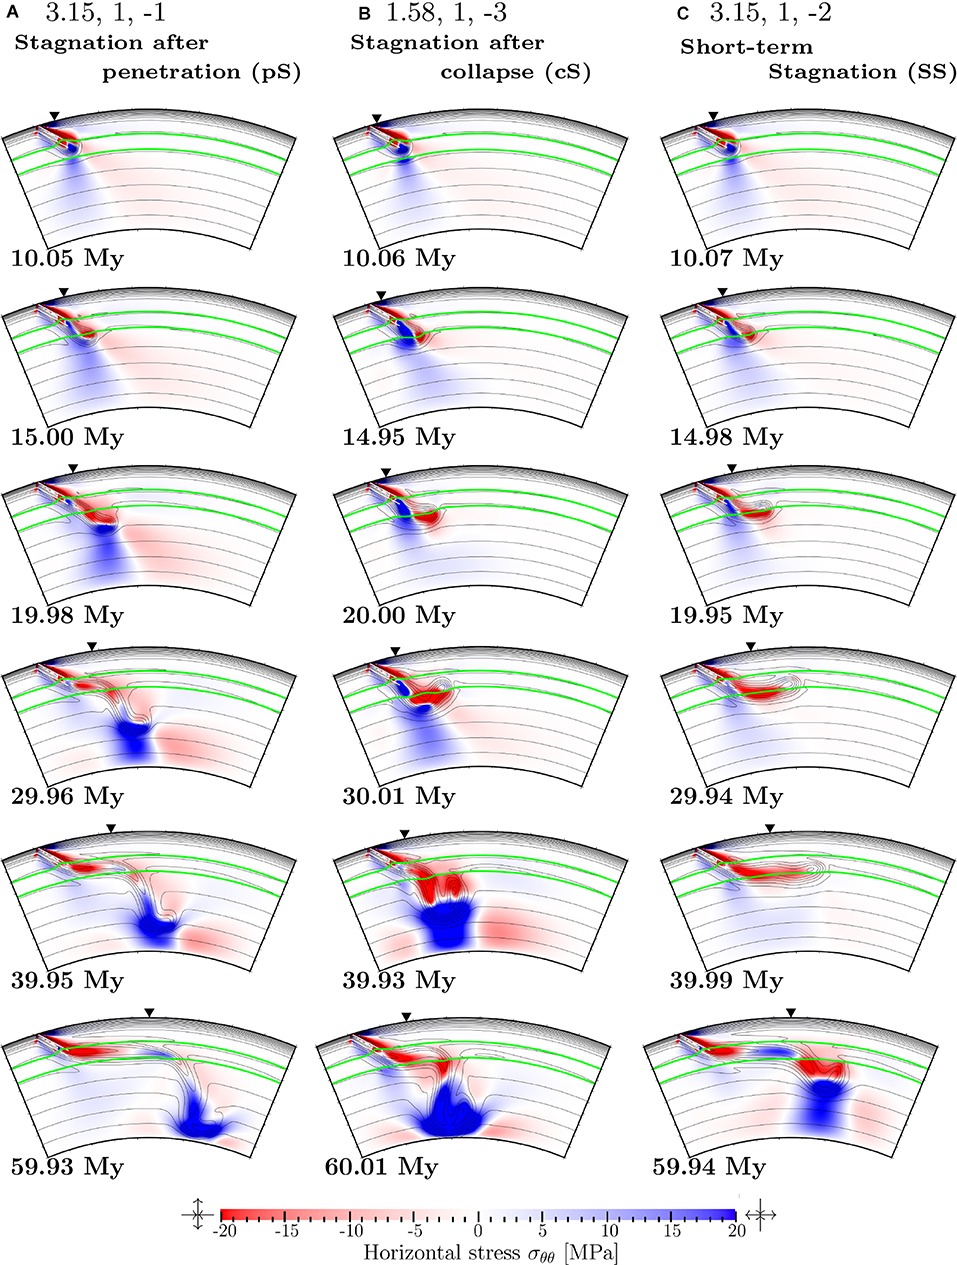
Figure 5. Snapshots of the distributions of temperature T (contours) and horizontal stress σθθ (colors) for the time instances indicated in the figure, obtained for the cases with (A) stagnation after penetration, (B) stagnation after collapse, and (C) short-term stagnation. Indicated at the top of respective frames are the trench retreat velocity vtr [cm/yr], the viscosity jump between the upper and lower mantle rη, and the Clapeyron slope at the 660 km discontinuity γ660 [MPa/K] for each case, respectively. The contour interval for T is 100°C. The colorscale for σθθ is indicated at the bottom of figure. The regions with σθθ < 0 is under horizontal compression (vertical extension), while those with σθθ > 0 is under horizontal extension (vertical compression). We also show by the green lines in each figure the phase boundaries at around 410 km and 660 km depths.
Figure 5A shows the temporal evolution of the slabs for the case with stagnation after penetration (pS) where we assumed γ660 = −1 MPa/K, rη = 1 and vtr = 3.15 cm/yr. From the snapshot at t ≃ 15 My, we can see the region with σθθ > 0 (i.e., vertical compression) in the lower part of the slab just above the 660 km discontinuity both for the cases with pS and SS. However, the degree of vertical compression in this region is weaker than that for the case with SS (see Figure 5C), because of the weaker resistance coming from the gentler Clapeyron slope γ660 for given vpl and vtr. This results in a slab penetration to a greater depth by about 20 My than that for SS. At t = 19.98 My, the stress state near the tip of the subducting slab in the lower mantle is strong horizontal compression (vertical extension) in the upper part, indicating that the cold slab tends to sink owing to its negative buoyancy. During the subsequent period of t < 39.95 My, however, the horizontal compression becomes significantly weakened in the tip of slab in the lower mantle because the temperature difference becomes smaller between the slab and the surrounding mantle, leading to a slowing down of the descent of slab in the lower mantle. The deceleration of slab can be also seen from the stress state at the position of slab penetration at 660 km discontinuity; the horizontal compression gradually decreases with time there. On the other hand, the position of slab is almost unchanged at the base of the MTZ for t > 29.96 My, because the slab penetration also acts as a strong anchor of cold slab in the uppermost part of the lower mantle. Taken together with the effect of trench retreat, a subducting slab is flattened to form a horizontally-lying portion in the MTZ whose horizontal dimension increases with time. As can be seen from the snapshot of t > 40 My, the slab subduction for the pS-type finally yields a structure quite similar with those of SS for t > 40 My.
On the other hand, Figure 5B shows the temporal evolution of the slabs for the case with stagnation after collapse (cS) where we assumed γ660 = −3 MPa/K, rη = 1 and vtr = 1.58 cm/yr. Comparing the snapshots for t less than about 20 My in Figures 5B,C, the behavior of slab for the case with cS is quite similar with that for SS. Indeed, for both cases, horizontally-lying portions of cold slabs are about to be formed at the base of MTZ. In addition, there are regions with vertical compression (σθθ > 0) in the lower part of the slab just above the 660 km discontinuity. However, the degree of vertical compression in this region is stronger for cS than that for SS (see Figure 5C), because of the slower trench retreat and faster imposed subduction together with the steeper Clapeyron slope γ660. During the subsequent period of t ≤ 30.01 My, the cold slab sinks into the lower mantle to a greater depth than for the case in Figure 5C. On the other hand, the imposed subduction also induces a horizontal compression near the tip of cold slab, which leads a buckling of slab and forms a concave structure of collapsed slab in the uppermost lower mantle at t = 30.01 My. During the subsequent period of t ≥ 39.93 My, the collapsed slab further sinks in the lower mantle owing to its negative buoyancy. In addition, as in the cases of pS, the descent of slab in the lower mantle strongly anchors the cold slab in the uppermost part of the lower mantle, and a horizontally-lying portion develops at the base of MTZ along with the trench retreat. As can be seen from the snapshot of t = 60.01 My, the slab subduction for the cS-type finally yields a structure quite similar with those of SS.
3.2. Stagnant Slab Behaviors With Temporal Changes in Trench Retreat Velocity
In the first series of experiments where the rate of trench retreat vtr is kept unchanged with time, we found that the trench retreat greatly helps to form and sustain the horizontally-lying or stagnant slabs (see section 3.1). In this section, we carry out the second series of experiments where the effect of trench retreat weakens with time, and study how the behaviors of subducting slabs are affected by the temporal changes in vtr particularly for the cases where horizontally-lying or stagnant slabs are formed under the continuous retreating motion of trench. In this study, for simplicity, we assumed that the trench retreat occurs at a constant non-zero rate for the elapsed time 0 ≤ t ≤ tstop while it does not for t > tstop. Here we choose tstop to be around 40 My, since the horizontally-lying slabs are well-developed or ready to be developed by t = tstop for all the cases with LS, SS, cS, and pS.
We conducted 45 numerical simulations by imposing sudden stop of the trench retreat at around 40 My after the onset of slab subduction, using the values of control parameters (rη, γ660, and non-zero vtr for t ≤ tstop) which yield horizontally-lying slabs (LS, SS, cS, and pS in section 3.1). Among them, we observed the collapse of the stagnant slabs into the lower mantle only for the cases with rη ≤ 10. In particular, the avalanche styles of stagnant slabs observed in our simulations can be classified into four styles, depending not only on the types of slab behaviors described in section 3.1 but also on the slab shapes at the time instance of the sudden stop of the trench retreat (t = tstop). In Table 3 and Figure 6, we summarize the classification of slab behaviors for all 45 cases. (In Figure 6, we also plot 6 cases indicated by “did not fall” in Table 3, where the slabs did not fall into the lower mantle.) In Table 3, the symbol “type(40)” is meant for the type of the slab behavior for the cases with tstop = 40 My, while “type(∞)” stands for the type presented in section 3.1 with the continuous trench retreat (i.e., tstop = ∞).
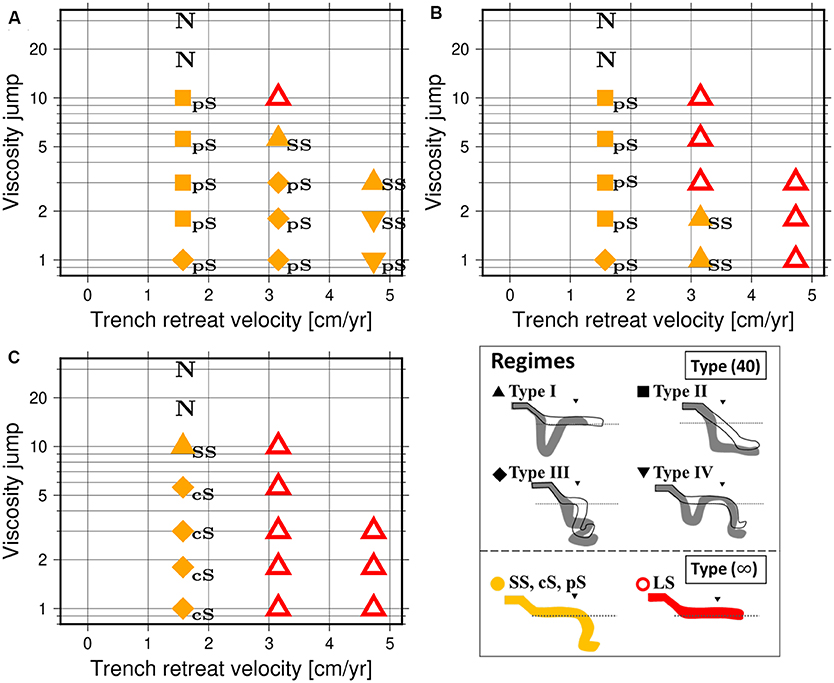
Figure 6. Regime diagrams of the slab morphologies with sudden stop of trench retreat at around 40 My after the initiation of subduction as a function of trench retreat velocity vtr and viscosity jump rη for the cases of (A) γ660 = −1 MPa/K, (B) γ660=-2 MPa/K, and (C) γ660 = −3 MPa/K. The symbols stand for the slab morphologies of Type(40); triangles, squares, diamonds, and inverted triangles indicate Types I, II, III, and IV, respectively. The cases with “did not fall” are also indicated by the letter “N” in the figure. On the other hand, the colors of symbols stand for the slab morphologies of Type(∞); red open symbols indicate LS, while yellow filled ones are other types whose Type(∞) are indicated by small letters (“SS”, “pS,” and “cS”) attached to the symbols. In the schematic illustration of the regimes, slab morphologies before (black contour) and after (gray fill) changing vtr for Type I, II, III, and IV are shown. The black triangles and the dashed lines indicate the initial trench location and the 660 km discontinuity, respectively.
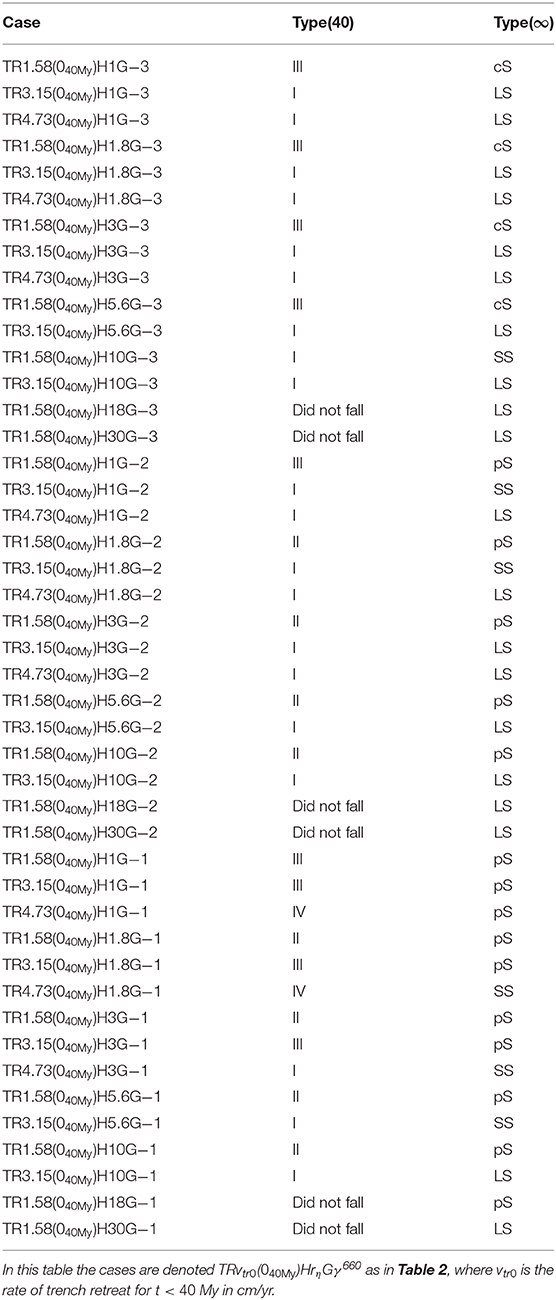
Table 3. Cases and results of numerical simulations with time change in vtr.
3.2.1. Type I: Avalanche From the Hinge of Stagnant Slabs
Figure 7A shows the slab behavior obtained for the case where we employed rη = 3, γ660 = −2 MPa/K and vtr = 3.15 cm/yr is applied only for t ≤ 40 My after the onset of subduction (For comparison, we also show in small panels attached with large ones the snapshots for the same time instances of t > 40 My for the corresponding case without a sudden stop of trench retreat). The choice of control parameters yields the LS-type without the sudden stop of trench retreat; the stagnant slab is formed at the base of MTZ by t = 39.96 My after the onset of subduction, and it hardly falls into the lower mantle for more than 80 My. In the case where we impose a sudden stop of trench retreat at 40 My after the onset of subduction, in contrast, we observe an avalanche of stagnant slab. As can be seen from the snapshot at t = 60.08 My, a cold plate is bent downward at the hinge (the left-hand end) of the stagnant slab along with the imposed downward motion of subducting plate, and starts to penetrate into the lower mantle. At t = 80.00 My, a large portion of subducted slab collapses into the lower mantle, owing to its negative buoyancy.
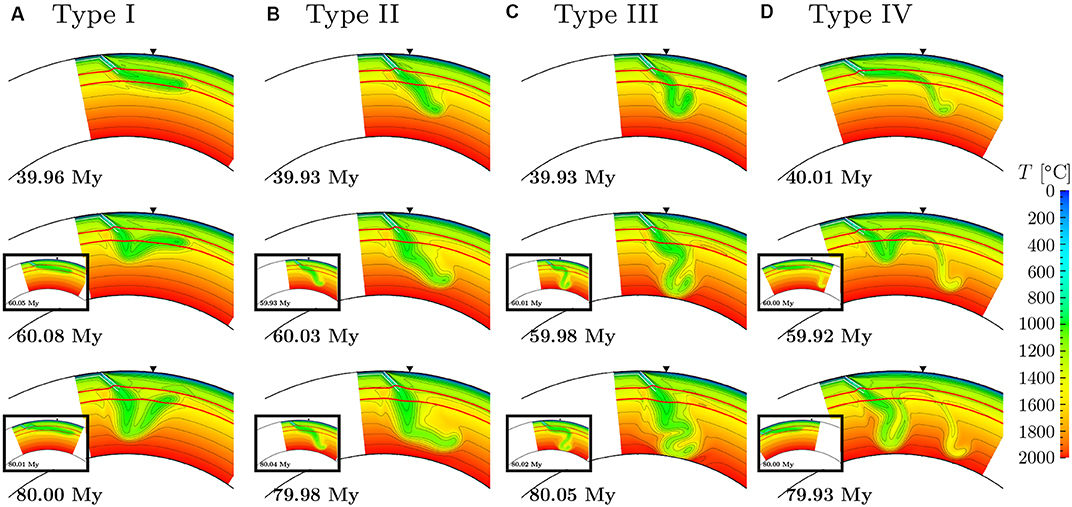
Figure 7. Evolutions of slab behaviors with the sudden stop of trench retreat at around 40 My after the initiation of subduction. Snapshots of temperature distribution at 40 My (top), 60 My (middle), and 80 My (bottom) for the cases of (A) vtr = 3.15 cm/yr, rη = 3, γ660=-2 MPa/K, (B) vtr = 1.58 cm/yr, rη = 3, γ660 = −2 MPa/K, (C) vtr = 1.58 cm/yr, rη = 1, γ660=-3 MPa/K, and (D) vtr = 4.73 cm/yr, rη = 1, γ660=-1 MPa/K. The small panels within the black frames show the slab behaviors with constant vtr. The meaning of the colors, contour lines, red and white lines, and black triangles are same as in Figure 2.
The type I of slab behavior is observed for 15 cases where type(∞) is LS. We also obtained the same type for 5 cases where type(∞) is SS. This reflects the fact that the shapes of slabs for SS are quite similar with those for LS at t = tstop before the collapse of slabs for SS. This result is also consistent with those of Yoshioka and Naganoda (2010) and Agrusta et al. (2017) where the collapse of stagnant slab enhanced by the change from trench retreat to trench advance.
3.2.2. Type II: Stagnation Below 660 km
Figure 7B shows the slab behavior for the case where the type(∞) is pS with rη = 3, γ660 = −2 MPa/K and vtr = 1.58 cm/yr. At t = 39.93 My just before the sudden stop of trench retreat, the subducting slab penetrates into the lower mantle almost smoothly, in spite of a small kink at the 660 km discontinuity. The descent of cold slab continues after the sudden stop of trench retreat along with the imposed downward motion of subducting plate. During the subsequent period of t ≤ 79.98 My, the kink of subducting slabs gradually sinks down to about 1,500 km depth. The tip of subducting slab, on the other hand, reaches down to about 1,500 km depth by t = 60.03 My, and is almost anchored at this depth during t ≤ 79.98 My. The difference in the rate of descent in the slab results in a horizontally-lying portion of cold slab in the lower mantle at around 1,500 km depth at this time instance, as if it is stagnated at this depth.
This type of slab behaviors can be seen in total of 8 cases where type(∞) is pS while a horizontally-lying portion of cold slab is not well-developed yet by t = tstop. We also note that in two cases with rη = 10 a thickening of cold slabs, similar to the accumulation in section 3.1.2, is observed at the 660 km discontinuity in addition to the trapping of slabs in the lower mantle.
3.2.3. Type III: Buckling After Penetration in the Lower Mantle
In Figure 7C we show the slab behaviors for the case where the type(∞) is cS with rη = 1, γ660 = −3 MPa/K and vtr = 1.58 cm/yr (see also Figure 5B in section 3.1). During the period of t ≤ 39.93 My where the trench retreat continuously occurs, the subducting slab collapses into the lower mantle at its hinge owing to its negative buoyancy. In addition, during the subsequent period of t < 59.98 My where the trench retreat is turned off, the behavior of subducting slab is quite similar with those for the case with cS where the trench retreat continuously occurs (see also Figure 5B). However, because of the absence of trench retreat and enhanced rate of imposed subduction, the subducted slab is intensively buckled in the uppermost part of the lower mantle.
This type of slab behavior is observed in a total of 9 cases where type(∞) is pS or cS. This is because in these cases the horizontally-lying portion of cold slab is not significantly developed by the time of the sudden stop of trench retreat (t = tstop). On the other hand, for the cases with 3 ≤ rη ≤ 5.6 and γ660 = −3 MPa/K, we observed that the slabs accumulate at around the MTZ, owing to the resistance force from large rη and steep γ660.
3.2.4. Type IV: Avalanche From the Hinge After Penetration From the Head of a Slab
Figure 7D shows the slab behaviors in the case with type(∞) is pS where we employed rη = 1, γ660 = −1 MPa/K and vtr = 4.73 cm/yr. At t = 40.01 My just after the sudden stop of trench retreat, a well-developed SS-type slab takes place, which is characterized by a very long horizontally-lying portion and its tip sunk in the lower mantle. However, as can be seen from the snapshot of t = 59.92 My after the sudden stop of trench retreat, the enhanced motion of imposed subduction newly induces a penetration of cold slab at the hinge of stagnant slab in addition to that at its tip. During the subsequent period, the cold subducting plate is preferentially supplied to the newly penetrating portion, while in the old penetrating portion the temperature difference becomes smaller between the slab and the surrounding mantle.
This type can be observed in 2 cases out of 45 calculations for the cases where type(∞) is pS or SS, particularly when a horizontally-lying stagnant portion of cold slab is sufficiently long at around the 660 km discontinuity by the time of the sudden stop of trench retreat.
4. Discussion and Concluding Remarks
In this paper we conducted numerical experiments of mantle convection with imposed kinematic motion of cold slabs and trench migration, aiming to understand the cause of the diverse morphology of subducting slabs observed by the seismic tomography. In particular, we studied the effects of control parameters (the viscosity jump rη and the Clapeyron slope γ660 at the 660 km discontinuity, and the rate vtr of trench retreat) on the formation of “stagnant slabs” in the MTZ and their avalanche into the lower mantle. In the first series of our experiments where vtr is kept constant with time, we confirmed that the trench retreat greatly helps to form horizontally-lying or stagnant slabs at the 660 km discontinuity. In particular, we found distinctive temporal evolutions of slabs in some ranges of control parameters, in addition to the fundamental five types named penetration (P), accumulation (A), entrainment (E), long-term stagnation (LS), and short-term stagnation (SS). In these distinctive types (named pS and cS), the subducted slabs tend to stagnate at the 660 km discontinuity after they experience the penetration or the collapse into the lower mantle, yielding the shapes of slabs quite similar to those of SS at some time instances. In the second series of our experiments, we investigated the effects of the sudden stop of trench retreat on the horizontally-lying slabs (LS, SS, cS, and pS types in the first series of experiments). We found that the styles of avalanche of stagnant slabs vary depending not only on the types of slab behaviors described in section 3.1 but also on the slab shapes at the time instance of the sudden stop of the trench retreat. In these experiments, we also observed wider variations of slab behaviors than in the cases with continuous trench retreat, such as the slabs which look as if they are stagnated below the 660 km discontinuity. The results of our experiments suggest that the history of trench migration (the retreat velocity and its temporal change) plays the greatest role in the formation and avalanche of stagnant slabs, among the control parameters which may affect the dynamics of subducting slabs.
The fundamental five types of slab behaviors, particularly the LS and SS, obtained in the first series of our experiments can be well-compared with those of natural ones observed by the seismic tomography. For example, the “stagnant slab” behaviors observed beneath the Northeast Japan or Izu-Bonin arcs (e.g., Zhao, 2009; Fukao and Obayashi, 2013) can be well-explained either by the LS or SS types in this study: These slabs seem to be LS, if the western tip of the flat slab in the MTZ observed beneath the East Asia arc is the tip of the Pacific slab whose subduction started about 60 Ma (e.g., Seton et al., 2012, 2015) and the Pacific slab has not yet penetrated into the lower mantle (Honda, 2016). On the other hand, these slabs seem to be SS, if the western tip of the stagnant Pacific slab represents the subduction which occurred about 20–30 My as suggested in Liu et al. (2017). Similarly, the slab morphology observed in the Tonga subduction zone, characterized by a horizontally-flattening portion of the slab in MTZ and the remnant slabs in the lower mantle (van der Hilst, 1995; Richards et al., 2011), is also comparable with that of SS type in this study, although the seismological interpretation is still controversial for Tonga slab (Fukao and Obayashi, 2013).
On the other hand, the occurrence of pS and cS types (stagnation after penetration or collapse) in addition to the fundamental five types in the first series of our experiments strongly indicate that the morphology of slabs similar to SS can also come out from the slabs which start to stagnate horizontally in the MTZ after their penetration or collapse into the lower mantle. In other words, it is difficult to distinguish the SS type from the pS or cS type solely from the comparison of slab shapes at some time instances given by the snapshot of slab behavior observed by seismic tomography. We can certainly speculate that, if simply based on the comparison of control parameters relevant for each type with those of the subduction zones listed above, the pS and/or cS types are more likely to occur than SS in natural subduction zones. However, more careful inspection should be necessary to accurately determine the types of slab behaviors for particular subduction zones by, for example, taking into account the detailed history of trench migration.
In addition, the occurrence of four types of slab behaviors in the second series of our experiments suggests that the temporal variations in the rate of trench retreat can significantly induce the complexities in the collapse of stagnant slabs into the lower mantle which can be hardly observed for the cases with constant rate of trench retreat. For example, the collapse of the stagnant slabs at their hinges obtained for the types I and IV can be well-compared with that observed in the Mariana arc (Fukao and Obayashi, 2013). In particular, the occurrence of horizontally-lying portion of slabs significantly below the 660 km discontinuity for the type II is very similar to that observed in the Western Java arc which looks to be “trapped”at about 1,000 km depth (Fukao and Obayashi, 2013). The occurrence of type II simply due to the sudden stop of trench retreat may therefore suggests that a “trapped” slab at some depths in the lower mantle does not necessarily imply the existence of discontinuous changes in physical properties such as viscosity (Marquardt and Miyagi, 2015; Rudolph et al., 2015) at that depth.
Although we do believe that our model successfully reproduces the slab behaviors such as the stagnant slabs at the MTZ and their avalanches into the lower mantle, we need further numerical calculations without several simplifications which we made in the present study. For example, the slab behaviors in the lower mantle, such as the flattened slab well below the 660 km discontinuity, are probably affected by the limited model thickness of 2,000 km as well as the imposed boundary condition at the bottom boundary, which may therefore need more careful validation using improved model with a full mantle thickness. In addition, the assumption of the imposed motions of subducting and overriding plates in this study are most likely to modulate the flow in the mantle wedge and, in turn, the behaviors of subducting slabs. Implicit in this assumption is a further presumption that the trench migration occurs independently of the deformation of slabs or other model parameters such as the Clapeyron slope and the viscosity jump at around 660 km depth, which may not necessarily hold in natural subduction zones. Besides, we employed the prescribed kinematic motions of subducting plate and trench (vpl and vtr) using a highly simplified history of trench migration (constant through time or sudden stop at 40 My after the initiation of the subduction), which may not necessarily occur in natural subduction zone. In particular, the assumption of the constant rate of plate convergence at the trench (vpl + vtr) throughout the calculations may not be fully consistent with the dynamics in the underlying mantle. Hence, it is quite important to conduct further numerical simulations by using models with the self-consistent motions of subducting and overriding plate, including the complexities in geometry of the subduction zones such as the presence of back-arc opening (e.g., Nakakuki and Mura, 2013) and the double subduction system (e.g., Čížková and Bina, 2015; Faccenna et al., 2018), in order to fully understand the diversity of slab behaviors in the natural subduction zones.
Data Availability Statement
The datasets generated for this study are available on request to the corresponding author.
Author Contributions
MT and MK conceived and designed the experiments and wrote the paper. MT performed the experiments and analyzed the data.
Funding
This work was supported by JSPS KAKENHI Grant numbers 26400457 and 18K03724 and Joint Usage/Research Center PRIUS, Ehime University, Japan. MT received travel support from the Ehime University.
Conflict of Interest
The authors declare that the research was conducted in the absence of any commercial or financial relationships that could be construed as a potential conflict of interest.
Acknowledgments
We would like to thank two reviewers for their constructive comments and suggestions which greatly improved the paper.
References
Agrusta, R., Goes, S., and van Hunen, J. (2017). Subducting-slab transition-zone interaction: stagnation, penetration and mode switches. Earth Planet. Sci. Lett. 464, 10–23. doi: 10.1016/j.epsl.2017.02.005
Agrusta, R., van Hunen, J., and Goes, S. (2014). The effect of metastable pyroxene on the slab dynamics. Geophys. Res. Letters 41, 8800–8808. doi: 10.1002/2014GL062159
Christensen, U. R. (1996). The influence of trench migration on slab penetration into the lower mantle. Earth Planet. Sci. Lett. 140, 27–39. doi: 10.1016/0012-821X(96)00023-4
Christensen, U. R., and Yuen, D. A. (1985). Layered convection induced by phase transitions. J. Geophys. Res. Solid Earth 90, 10291–10300. doi: 10.1029/JB090iB12p10291
Čížková, H., and Bina, C. R. (2015). Geodynamics of trench advance: insights from a philippine-sea-style geometry. Earth Planet. Sci. Lett. 430, 408–415. doi: 10.1016/j.epsl.2015.07.004
Čížková, H., van Hunen, J., van den Berg, A. P., and Vlaar, N. J. (2002). The influence of rheological weakening and yield stress on the interaction of slabs with the 670 km discontinuity. Earth Planet. Sci. Lett. 199, 447–457. doi: 10.1016/S0012-821X(02)00586-1
Dziewonski, A. M., and Anderson, D. L. (1981). Preliminary reference Earth model. Phys. Earth Planet. Interiors 25, 297–356. doi: 10.1016/0031-9201(81)90046-7
Faccenna, C., Holt, A. F., Becker, T. W., Lallemand, S., and Royden, L. H. (2018). Dynamics of the Ryukyu/Izu-Bonin-Marianas double subduction system. Tectonophysics 746, 229–238. doi: 10.1016/j.tecto.2017.08.011
Fei, Y., Van Orman, J., Li, J., Van Westrenen, W., Sanloup, C., Minarik, W., et al. (2004). Experimentally determined postspinel transformation boundary in Mg2SiO4 using MgO as an internal pressure standard and its geophysical implications. J. Geophys. Res. Solid Earth 109:B02305. doi: 10.1029/2003JB002562
Fukao, Y., and Obayashi, M. (2013). Subducted slabs stagnant above, penetrating through, and trapped below the 660 km discontinuity. J. Geophys. Res. Solid Earth 118, 5920–5938. doi: 10.1002/2013JB010466
Garel, F., Goes, S., Davies, D., Davies, J. H., Kramer, S. C., and Wilson, C. R. (2014). Interaction of subducted slabs with the mantle transition-zone: a regime diagram from 2-d thermo-mechanical models with a mobile trench and an overriding plate. Geochem. Geophys. Geosyst. 15, 1739–1765. doi: 10.1002/2014GC005257
Honda, S. (2016). Slab stagnation and detachment under northeast china. Tectonophysics 671, 127–138. doi: 10.1016/j.tecto.2016.01.025
Ito, E., and Takahashi, E. (1989). Postspinel transformations in the system Mg2SiO4-Fe2SiO4 and some geophysical implications. J. Geophys. Res. Solid Earth 94, 10637–10646. doi: 10.1029/JB094iB08p10637
Kameyama, M., and Harada, A. (2017). Supercontinent cycle and thermochemical structure in the mantle: Inference from two-dimensional numerical simulations of mantle convection. Geosciences 7:126. doi: 10.3390/geosciences7040126
Kameyama, M., and Nishioka, R. (2012). Generation of ascending flows in the Big Mantle Wedge (BMW) beneath northeast Asia induced by retreat and stagnation of subducted slab. Geophys. Res. Lett. 39. doi: 10.1029/2012GL051678
Katsura, T., Yamada, H., Shinmei, T., Kubo, A., Ono, S., Kanzaki, M., et al. (2003). Post-spinel transition in Mg2SiO4 determined by high P-T in situ X-ray diffractometry. Phys. Earth Planet. Interiors 136, 11–24. doi: 10.1016/S0031-9201(03)00019-0
Liu, X., Zhao, D., Li, S., and Wei, W. (2017). Age of the subducting pacific slab beneath east Asia and its geodynamic implications. Earth Planet. Sci. Lett. 464, 166–174. doi: 10.1016/j.epsl.2017.02.024
Marquardt, H., and Miyagi, L. (2015). Slab stagnation in the shallow lower mantle linked to an increase in mantle viscosity. Nat. Geosci. 8:311. doi: 10.1038/ngeo2393
McKenzie, D. P., Roberts, J., and Weiss, N. O. (1973). Convection in the Earth's mantle. Tectonophysics 19, 89–103. doi: 10.1016/0040-1951(73)90034-6
Nakakuki, T., and Mura, E. (2013). Dynamics of slab rollback and induced back-arc basin formation. Earth Planet. Sci. Lett. 361, 287–297. doi: 10.1016/j.epsl.2012.10.031
Nakakuki, T., Tagawa, M., and Iwase, Y. (2010). Dynamical mechanisms controlling formation and avalanche of a stagnant slab. Phys. Earth Planet. Interiors 183, 309–320. doi: 10.1016/j.pepi.2010.02.003
Richards, S., Holm, R., and Barber, G. (2011). When slabs collide: a tectonic assessment of deep earthquakes in the Tonga-Vanuatu region. Geology 39, 787–790. doi: 10.1130/G31937.1
Rudolph, M. L., Lekić, V., and Lithgow-Bertelloni, C. (2015). Viscosity jump in Earth's mid-mantle. Science 350, 1349–1352. doi: 10.1126/science.aad1929
Seton, M., Flament, N., Whittaker, J., Müller, R. D., Gurnis, M., and Bower, D. J. (2015). Ridge subduction sparked reorganization of the pacific plate-mantle system 60-50 million years ago. Geophys. Res. Lett. 42, 1732–1740. doi: 10.1002/2015GL063057
Seton, M., Müller, R., Zahirovic, S., Gaina, C., Torsvik, T., Shephard, G., et al. (2012). Global continental and ocean basin reconstructions since 200ma. Earth Sci. Rev. 113, 212–270. doi: 10.1016/j.earscirev.2012.03.002
Tetzlaff, M., and Schmeling, H. (2000). The influence of olivine metastability on deep subduction of oceanic lithosphere. Phys. Earth Planet. Interiors 120, 29–38. doi: 10.1016/S0031-9201(00)00139-4
Torii, Y., and Yoshioka, S. (2007). Physical conditions producing slab stagnation: constraints of the Clapeyron slope, mantle viscosity, trench retreat, and dip angles. Tectonophysics 445, 200–209. doi: 10.1016/j.tecto.2007.08.003
Turcotte, D. L., and Schubert, G. (2002). Geodynamics. Cambridge: Cambridge University Press. doi: 10.1017/CBO9780511807442
van der Hilst, R. (1995). Complex morphology of subducted lithosphere in the mantle beneath the tonga trench. Nature 374, 154–157. doi: 10.1038/374154a0
van der Hilst, R., and Seno, T. (1993). Effects of relative plate motion on the deep structure and penetration depth of slabs below the izu-bonin and mariana island arcs. Earth Planet. Sci. Lett. 120, 395–407. doi: 10.1016/0012-821X(93)90253-6
van Hunen, J., van den Berg, A. P., and Vlaar, N. J. (2000). A thermo-mechanical model of horizontal subduction below an overriding plate. Earth Planet. Sci. Lett. 182, 157–169. doi: 10.1016/S0012-821X(00)00240-5
Yoshioka, S., and Naganoda, A. (2010). Effects of trench migration on fall of stagnant slabs into the lower mantle. Phys. Earth Planet. Interiors 183, 321–329. doi: 10.1016/j.pepi.2010.09.002
Yoshioka, S., and Sanshadokoro, H. (2002). Numerical simulations of deformation and dynamics of horizontally lying slabs. Geophys. J. Int. 151, 69–82. doi: 10.1046/j.1365-246X.2002.01735.x
Zhao, D. (2009). Multiscale seismic tomography and mantle dynamics. Gondwana Res. 15, 297–323. doi: 10.1016/j.gr.2008.07.003
Keywords: numerical simulation, mantle convection, stagnant slab, trench retreat, subduction zone
Citation: Tsuchida M and Kameyama M (2020) 2-D Numerical Simulations on Formation and Descent of Stagnant Slabs: Important Roles of Trench Migration and Its Temporal Change. Front. Earth Sci. 8:117. doi: 10.3389/feart.2020.00117
Received: 31 January 2020; Accepted: 27 March 2020;
Published: 07 May 2020.
Edited by:
Jeroen Van Hunen, Durham University, United KingdomCopyright © 2020 Tsuchida and Kameyama. This is an open-access article distributed under the terms of the Creative Commons Attribution License (CC BY). The use, distribution or reproduction in other forums is permitted, provided the original author(s) and the copyright owner(s) are credited and that the original publication in this journal is cited, in accordance with accepted academic practice. No use, distribution or reproduction is permitted which does not comply with these terms.
*Correspondence: Mana Tsuchida, dHN1Y2hpZGFAc2NpLmVoaW1lLXUuYWMuanA=