 Aimé J. Messiga
 Camellia Lam
 Steven Kidd
- Agassiz Research and Development Centre, Agriculture and Agri-Food Canada, Agassiz, BC, Canada
Phosphorus (P) management using mineral and manure P in excess of plant needs contributes to legacy soil P in coastal British Columbia, Canada. The objectives of this study were (a) to assess the effects of starter P at early growth stages and their carryover through corn maturity, and (b) to determine how corn yields relate to soil P saturation indicators. Eleven 1-year experiments were conducted on sites with contrasting legacy soil P in 2018 (three sites) and 2019 (eight sites). Six combinations of starter and manure P rates (T1: 0Pstarter + 0Pmanure; T2: 0Pstarter + 35Pmanure; T3: 5Pstarter + 30Pmanure; T4: 10Pstarter + 25Pmanure; T5: 15Pstarter + 20Pmanure; T6: 20Pstarter + 15Pmanure) were assigned to a RCBD with four replicates. In 2018, corn dry matter weight (DMY) at the 6-leaf stage was affected by starter P in all sites, and the response curve was described by a linear-plus-plateau model with critical starter P of 5.0 and 7.5 kg ha–1. In 2019, corn DMY at early growth stages was not affected by starter P. Corn DMY at harvest varied between 15.2 Mg ha–1 in sites with low initial soil P and 27.2 Mg ha–1 in sites with excess P. Four sites exhibited a trend of high DMY with treatment comprising low starter P and high side-dressed manure P additions. The degree of P saturation (DPS, 14.0 to 38.0%) and P saturation index (PSI, 3.0 to 14.0%) were related to corn DMY by quadratic functions (R2 = 0.76–0.94). From these results, we can conclude that the effect of starter P on young corn plants varies with year, but does not carryover through harvest. Moreover, current starter P (30–40 kg ha–1) recommended for corn can be reduced by up to 75% (5.0–7.5 kg ha–1) without affecting yield, thus reducing annual P inputs and farmers’ production costs. Finally, PSI as a proxy of DPS is a possible agro-environmental indicator that, coupled with reduced starter P fertilizer, can further contribute to reducing the risk of P transfer from agricultural soils in coastal British Columbia.
Introduction
In coastal British Columbia (BC), Canada, agricultural soils receive large annual phosphorus (P) inputs including dairy and poultry manures as well as chemical fertilizers to support a diverse and intensive peri-urban agricultural sector. A provincial soil survey conducted in 2007 showed that 89% of fields have soil test P concentrations varying between 100 and 350 mg Mehlich-3 P (PM3) kg–1, which increases the risk of P transport by runoff (Kowalenko et al., 2007). A national study using the indicator of risk of water contamination by P showed that 35 to 75% of croplands in Abbotsford (largest city in Fraser Valley) have P source concentrations above the environmental threshold of 4 mg P kg–1 (van Bochove et al., 2012). Heavy rainfalls in these areas, mostly during the non-growing season, and the relatively dry summers also increase the risk of P loss by preferential flow. Reports have shown that the Fraser and Sumas Rivers fit in the Eutrophic class with total P concentrations between 30 and 100 mg L–1 (British Columbia Ministry of Environment, 2006). It is crucial to disentangle the mechanisms controlling P cycling (input, transformation, and output) in these soils with high legacy P concentrations.
Silage corn (8500 ha) and forage grass (13,670 ha) rotation is the main cropping system providing feed for dairy cows in BC. Phosphorus fertilization recommendations for the silage corn phase of the rotation averaged 90 kg P ha–1, including 50 kg P ha–1 as dairy manure and 40 kg P ha–1 as starter fertilizer P for a crop that exports on average 35 kg P ha–1 (Bittman et al., 2006; Zhang et al., 2018). The annual P surplus for forage grass and silage corn rotation systems is 3030 Mg (50 kg P ha–1) (Bittman et al., 2017), which contributes to buildup of legacy soil P. A better match of P applications to silage corn needs is necessary to maintain or drawdown legacy soil P.
Starter P is a small amount of P fertilizer placed in close proximity to the seed at planting to promote young plants’ growth until the root system develops. Starter P fertilizer rates are 5 to 15 kg P ha–1 in Ontario and Quebec (Preston et al., 2019), and 5 to 13 kg P ha–1 in the US (Jokela, 1992). The placement or banding of P fertilizer near the seed reduces P fixation because soil-fertilizer contact is limited, making more P available to young plants soon after germination (Jokela, 1992). The benefits of starter fertilizer P on early growth of corn are well-recognized, particularly in low-P soils (Wolkowski, 2000; Vetsch and Randall, 2002; Preston et al., 2019). In areas where cool soil temperatures prevail early in the growing season, starter P can be beneficial even in high-P soils (Bittman et al., 2006). While some studies show the lasting effects of starter P through harvest (Bordoli and Mallarino, 1998; Malhi et al., 2001; Preston et al., 2019), other have highlighted the fact that early growth and nutrient uptake responses to starter P do not always translate into higher yield (Randall and Hoeft, 1988; Mallarino et al., 1999). The carryover of starter P effects through maturity was also observed primarily on a low-P soil (Bordoli and Mallarino, 1998). In Wisconsin, corn yield response to starter P was not observed on an excessively high-testing silt loam soil (Wolkowski, 2000).
Over the past two decades, extensive research has been conducted to develop or adapt agri-environmental P risk indicators to assess the risk of P loss from agricultural soils (Renneson et al., 2015). The P saturation index (PSI) as adaptation of the degree of P saturation (DPS) using routine agronomic soil test was developed in several agricultural regions of Canada and the United States. A PSI was adapted for the acidic soils of eastern Canada (Khiari et al., 2000; Pellerin et al., 2006; Benjannet et al., 2018) and the mid-Atlantic regions of the US (Sims et al., 2002) using P and Aluminum (Al) extracted by the Mehlich-3 method because P retention is correlated with Al in these soils. Benjannet et al. (2018) identified two critical values of PSI for Atlantic Canada above which P fertilization should be limited to crop requirements: 19.2% for very to extremely acidic soils (pH < 5.5) and 14.2% for slightly to moderately acidic soils (pH > 5.5). Pellerin et al. (2006) reported two critical PSI values for Quebec of 13.1 and 7.6% for coarse- and fine-textured soils, respectively. Given the differences observed on PSI values across areas and the influence of factors such as pH and soil textures, it is crucial to understand how these indicators of P risk relate to classical agronomic parameters before suggesting its use for the high legacy P soils of BC. The objectives of this study were (a) to assess the effects of starter fertilizers P at early growth stages (3- and 6-leaf stages) and their carryover through silage corn maturity, and (b) to determine how silage corn yields relate to soil P saturation indicators in high legacy soil P environments.
Materials and Methods
Site Description
A 2-year study was conducted in 2018 and 2019 in Agassiz and Rosedale, located in south coastal BC, Canada. Three sites were selected in 2018 and eight sites in 2019, for a total of 11 1-year corn trials (site1–site11). Soils in the area include the Monroe series, characterized by a feeble profile development and coarse texture (Typic Dystroxerepts under the U.S. Soil Taxonomy; Soil Survey Staff, 2014). The minimum and maximum general soil properties across all sites were: soil pH: 4.9 and 6.0; total carbon: 0.94 and 11.35%; total nitrogen: 0.07 and 0.82%; and Mehlich-3 extractable P: 3.42 and 195.32 mg kg–1 (Table 1). The average daily temperature ranges from 3.2°C in December to 18.8°C in August. The local climate is moderate oceanic, characterized by warm, rainy winters and relatively cool, dry summers with annual rainfall of 1689 mm, 261.9 mm of which falls between May and July (Table 2).
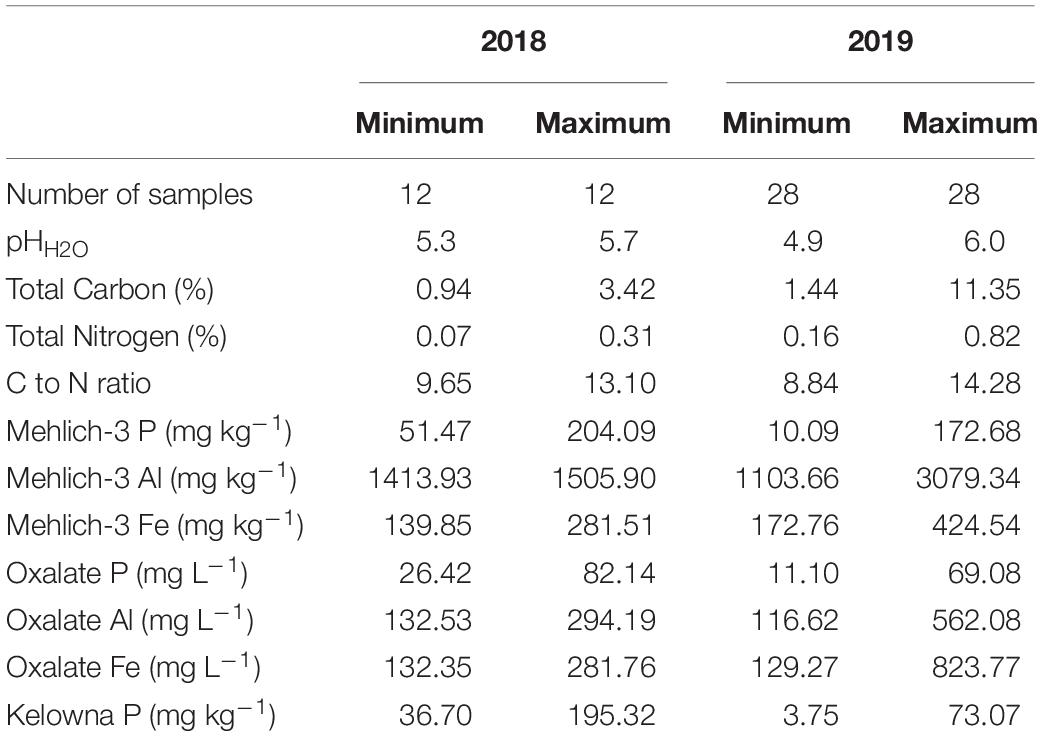
Table 1. Minimum and maximum values of general properties of soils (0–15 cm depth) at 11 studied sites in 2018 and 2019.
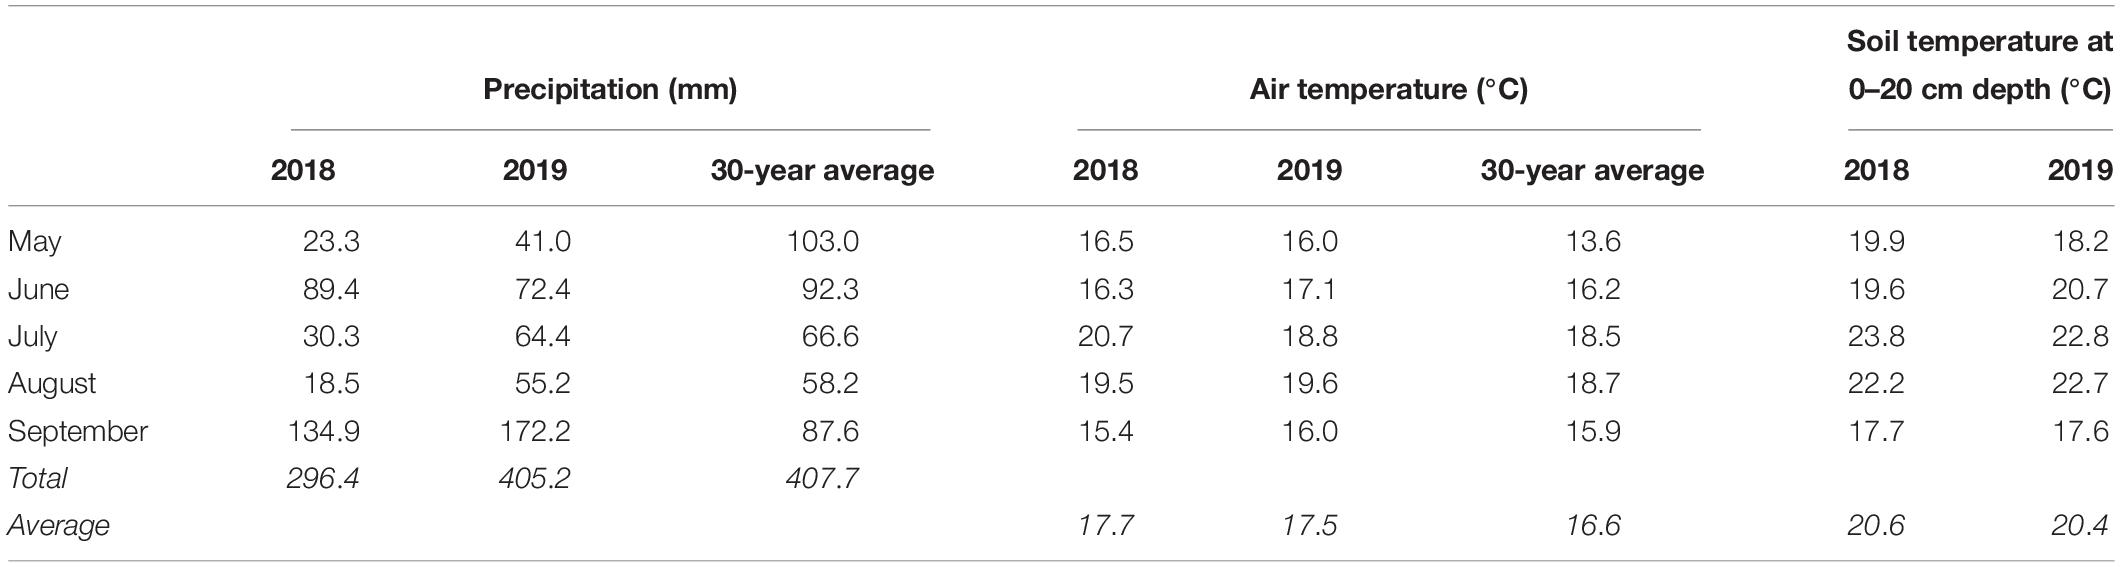
Table 2. Monthly total precipitations and mean monthly air and soil temperatures at Agassiz – Rosedale, BC, in 2018 and 2019 in comparison with the 30-year (1981–2010) average.
Experimental Design and Treatments
The 11 1-year corn experiments consisted of six treatments of combined starter fertilizer P and manure P rates. The six treatments were assigned to a randomized complete block design with four replicates for a total of 24 experimental units (10 m long and 4.5 m wide). Starter fertilizer P rates were 0, 0, 5, 10, 15, and 20 kg P ha–1 as triple super phosphate (TSP), and manure P rates were 0, 15, 20, 25, 30, and 35 kg available P ha–1. The six combinations of starter P (mineral fertilizer) and manure P treatments were arranged to meet a total available P input of 35 kg P ha–1 as follows: T0: 0Pstarter + 0Pmanure, T1: 0Pstarter + 35Pmanure, T2: 5Pstarter + 30Pmanure, T3: 10Pstarter + 25Pmanure, T4: 15Pstarter + 20Pmanure, T5: 20Pstarter + 15Pmanure (Table 3).
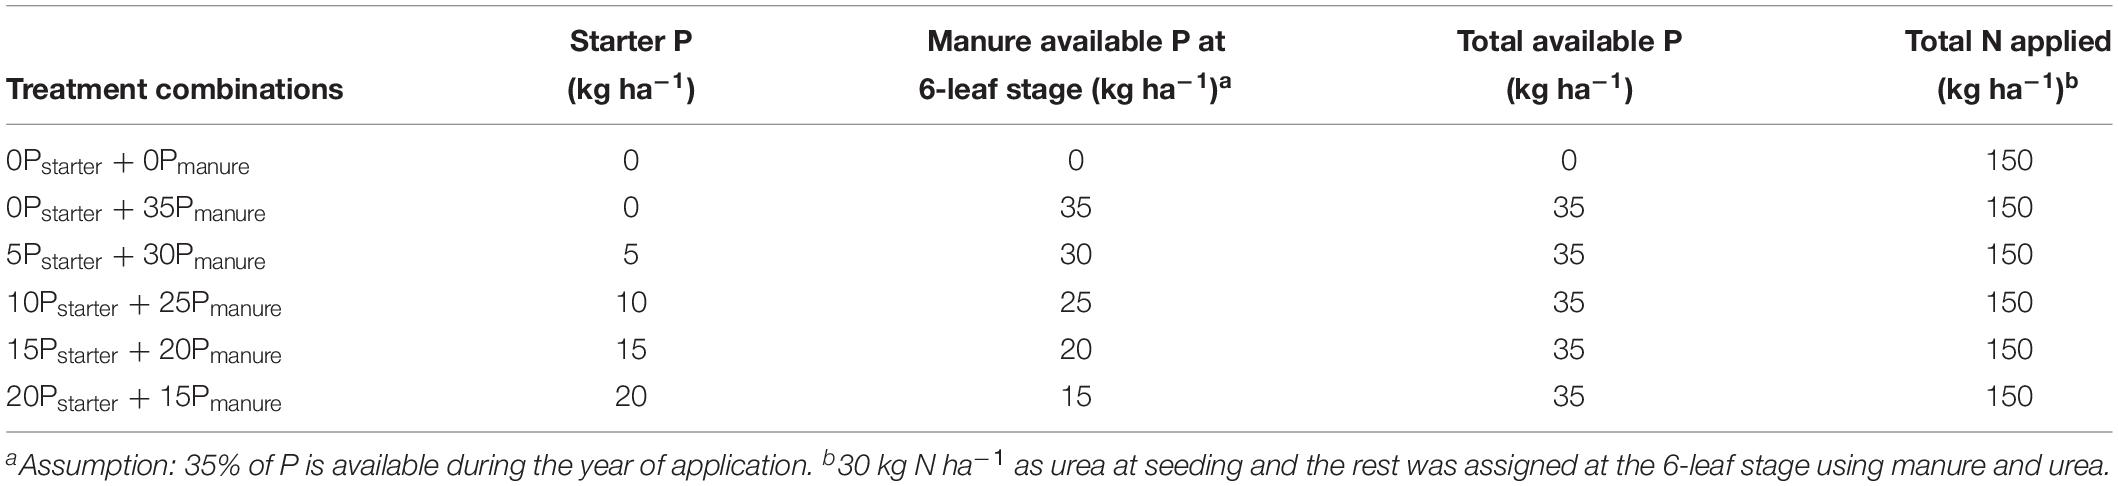
Table 3. Description of the six combination of starter P and manure P treatments.
The fields selected for the trials were sprayed with Roundup [glyphosate (N)-(phosphonomethyl)glycine, 1000 g ha–1] to terminate the grass stand in early April. The soil was plowed to a depth of 30 cm, followed by disking and harrowing to 10 cm, and marked with flags to delineate the experimental plots before seeding in early to mid-May. There were six rows by plot unit, and corn was sown at 81 × 103 plants ha–1. Starter fertilizer N (30 kg N ha–1) as urea (46% N) was band-applied (5 cm from the seeding row) using a disk opener (5 cm deep). Starter fertilizer P as TSP was band-applied by hand (5 cm from the seeding row) and buried (5 cm deep) with a rake the day following planting. Additions of manure P (0, 35; 30; 25; 20; and 15 kg available P ha–1) to reach the target of 35 kg available P ha–1 (we assumed that 35% of manure P is available during the year of application) and a supplement of N fertilizer as ammonium nitrate to meet the local recommendation of 150 kg N ha–1 (including manure N) were side dressed at the 6-leaf stage to supply P and N for the rest of the growing season. The volume of manure for each combination treatment was measured in 11-L buckets and hand applied closed to the corn rows. Manure used in the corn experiments was collected in three dairy farms in the Frazer valley and their general chemical characteristics are presented in Table 4. At the 3-leaf stage, a mixture of post-emergence herbicides atrazine (1353 g ha–1) and related triazines (87 g ha–1) [2-chloro-4-ethylamino-6-isopropylamino-1,3,5-trithemazine; 2-chloro-N-(2-ethyl-6-methylphenyl)-N- (2-methoxy-1-methyl-ethyl)-(S)] and glyphosate (1000 g ha–1) was sprayed to control weeds according to provincial recommendations (BC MA, 2012).
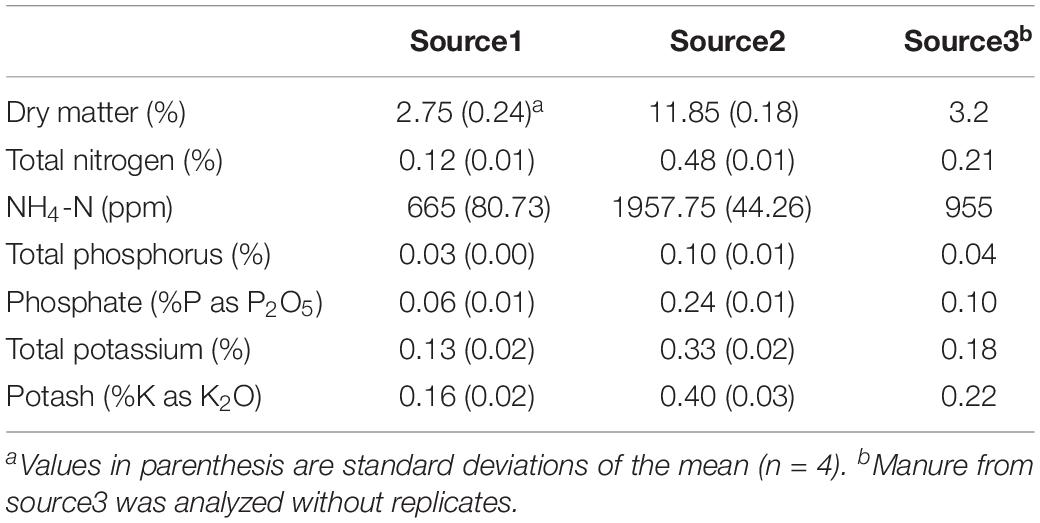
Table 4. Average chemical characteristics of manure from three sources used in the corn experiments.
Plant Sampling and Measurements
Corn plants were harvested at the 3-leaf stage (early-June), the 6-leaf stage (early-July), and maturity (mid-September) in a staggered pattern on the four innermost rows of each experimental plot. For the 3- and 6-leaf stages, 10 young corn plants were harvested, while for mature corn, 20 plants were harvested at 10 cm above the soil surface using a machete. Fresh weight was recorded in the field, and plants were chopped and a sub-sample of approximately 500 g from each plot was scooped and dried at 60°C in a forced-draft oven for 3–5 days and ground (2-mm screen). Dried and ground samples of 0.1 g were digested using a fluxer (M4 Fluxer, Claisse) and analyzed as described by Kowalenko and Babuin (2014). Phosphorus concentrations were assessed with an Inductively Coupled Plasma Optical Emission Spectrometer (ICAP 7000 series, Thermo Scientific). The P offtake at each harvest was calculated by multiplying corn P concentration by dry matter weight (DMY).
Soil Analyses
Soils were analyzed for general properties. Briefly, pH was measured in distilled water with a 1:2 soil: water ratio (Hendershot et al., 1993). Total C and N were determined by dry combustion with a LECO CNS-1000 (LECO, Corp., St. Joseph, MI, United States). Mehlich-3 extractable P (PM3), aluminum (AlM3) and iron (FeM3) were determined by shaking 2.5 g of soil with a 25 mL of Mehlich-3 solution (pH 2.3) for 5 min (Mehlich, 1984). Acid ammonium oxalate extractable P (POx), aluminum (AlOx) and iron (FeOx) were determined according to Ross and Wang (1993). The concentrations of PM3, AlM3, FeM3, POx, AlOx, and FeOx were assessed with an Inductively Coupled Plasma Optical Emission Spectrometer (ICAP 7000 series, Thermo Scientific).
The PSI was related to Mehlich-3 extracts as follows (Sims et al., 2002; Messiga et al., 2013):
where PM3 and AlM3 are quantified in Mehlich-3 extracts (mg kg–1).
The DPS was related to acid ammonium oxalate extracts as follows (Breeuwsma and Silva, 1992; Messiga et al., 2013):
where POx, AlOx, and FeOx are quantified in acid ammonium oxalate extracts (mmol kg–1).
Statistical Analyses
Data were tested for normality using SAS univariate procedure. Analysis of variance (ANOVA) for DMY and P uptake for corn at the 3- and 6-leaf stages was performed separately for each site using the PROC MIXED of SAS version 9.3 (SAS Institute, 2010) with blocks as random effects and P rate as fixed effects. When P rate was significant, contrast analysis was used to assess if the effect was linear or quadratic. Model selection was based on graphical and numerical methods by comparing R2, lack of fit F tests (Cerrato et al., 1990), and residual sum of squares.
The linear model was described as follows:
Where Y is the corn DMY (Mg ha–1) or P uptake (kg P ha–1), a is the intercept, b is the linear coefficient, and x is the starter P rate (kg P ha–1).
The linear-plus-plateau model is described as follows:
where Y is the corn DMY (Mg ha–1) or P uptake (kg P ha–1), a is the intercept, b is the linear coefficient, x is the starter P rate (kg P ha–1), C is the critical starter rate of fertilization, which occurs at the intersection of the linear response and the plateau lines, and P is the plateau corn DMY (Mg ha–1) or P uptake (kg P ha–1), a constant obtained by fitting the model to the data.
ANOVA for DMY and P uptake for corn at maturity was performed separately for each site using the PROC MIXED with blocks as random effects and P combination treatment as fixed effects. When P combination treatment was significant, differences among least square means (LSMEANS) for all treatment pairs were tested at a significance level of P = 0.05. In addition, standard errors of mean (SEM) were calculated.
Results
Weather Conditions
In 2018, the growing season, from May to September, received 111.3 mm less rainfall than the 30-year normal of 407.7 mm (Table 2). More specifically, May with 23.3 mm, July with 30.3 mm and August with 18.5 mm rainfall were respectively at least 4, 2 and 3 times drier than the 30-year normal. In 2019, May with 41.0 mm and June with 72.4 mm rainfall were respectively 2.5 and 1.3 times drier than the 30-year normal. The mean growing season air temperatures of 17.7°C for 2018 and 17.5°C for 2019 were higher than the 30-year normal of 16.6°C. In 2018, the mean air temperature in June was similar to the 30-year normal of 16.2°C, but June 2019 was warmer. The warm air temperatures of June 2019 were translated into warmer soil temperatures compare with June 2018. In particular, during the periods May 26 and June 26, there were 13 successive days with soil temperatures below 19°C in 2018 (Figure 1A), compared with only 5 days in 2019 (Figure 1B). In addition, there were 8 days with soil temperatures below 18°C in 2018, but only 1 day in 2019. In brief, mean soil temperature between May 26 and June 26 was 1°C cooler in 2018 with 19.6°C than 2019 with 20.6°C.
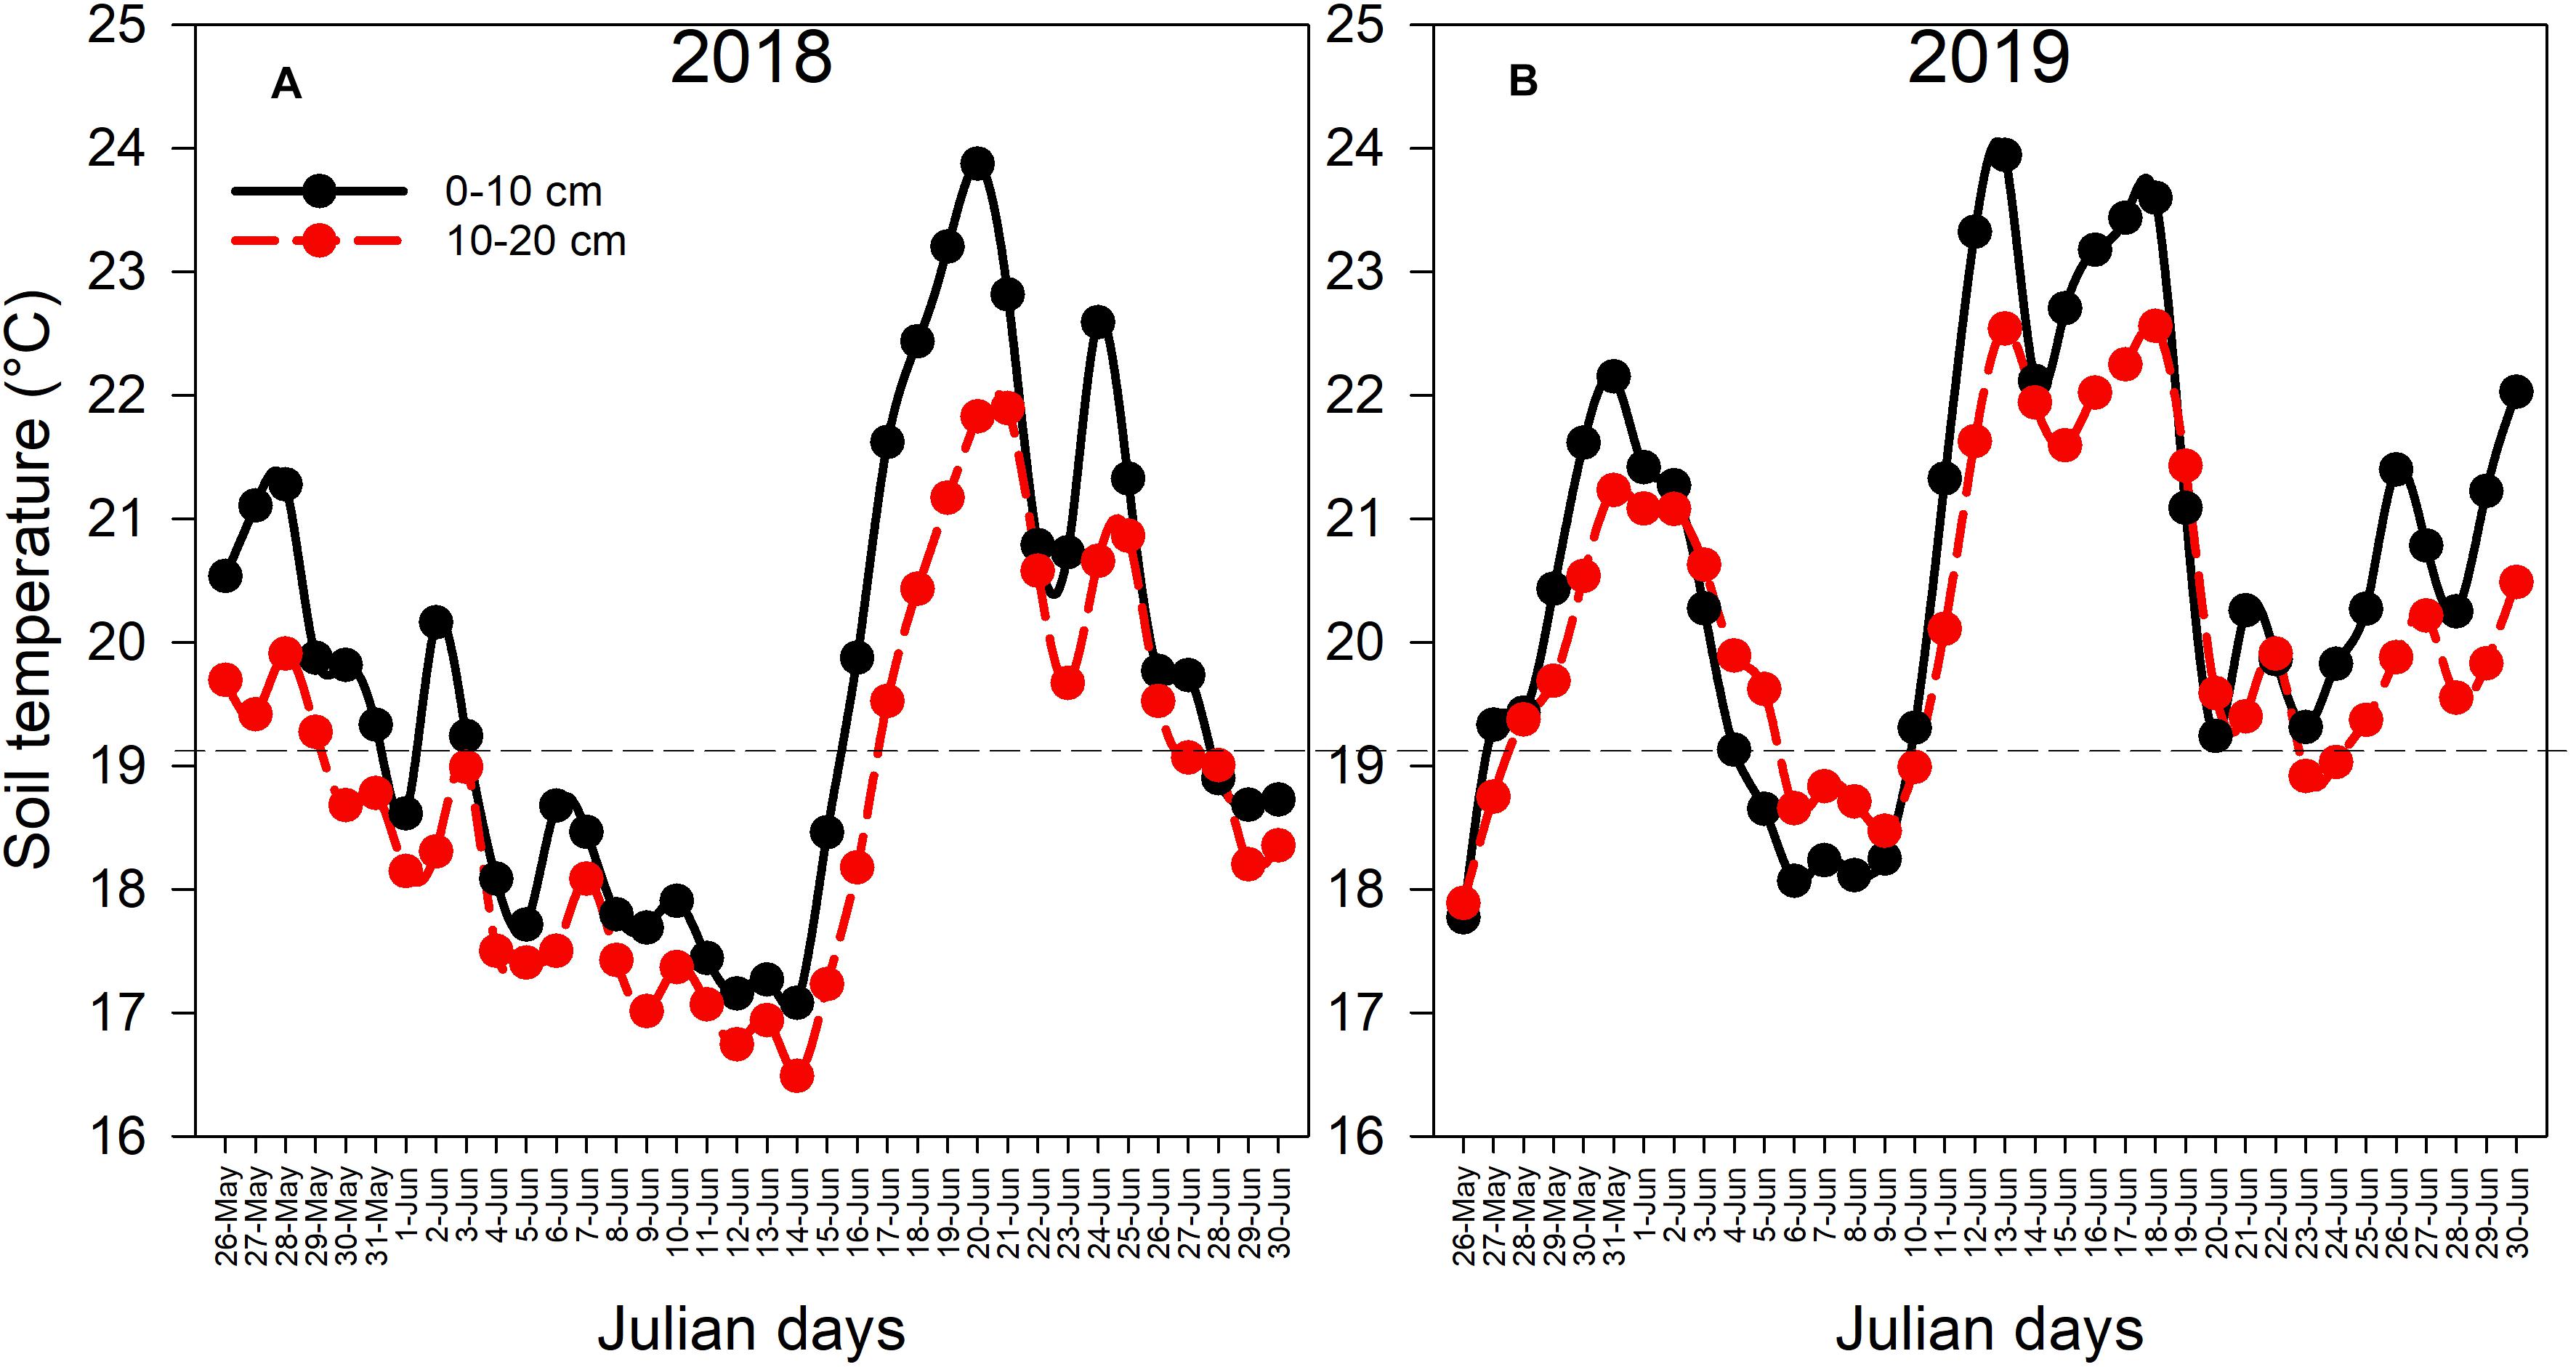
Figure 1. Average soil temperature during the periods (A) May 26, 2018 and (B) May 26, 2019.
Corn Dry Matter Yield
Corn DMY at the 3-leaf stage was not affected by starter P fertilization in all 11 sites in 2018 and 2019 (Figure 2). Corn DMY at the 3-leaf stage was on average 0.070 Mg ha–1 in site1, site2, and site3 (Figure 2A); 0.17 Mg ha–1 in site4, site7, and site9 (Figure 2B); 0.28 Mg ha–1 in site10 and site11 (Figure 2B); 0.41 Mg ha–1 in site8 (Figure 2B); and 0.78 Mg ha–1 in site5 and site6 (Figure 2B).
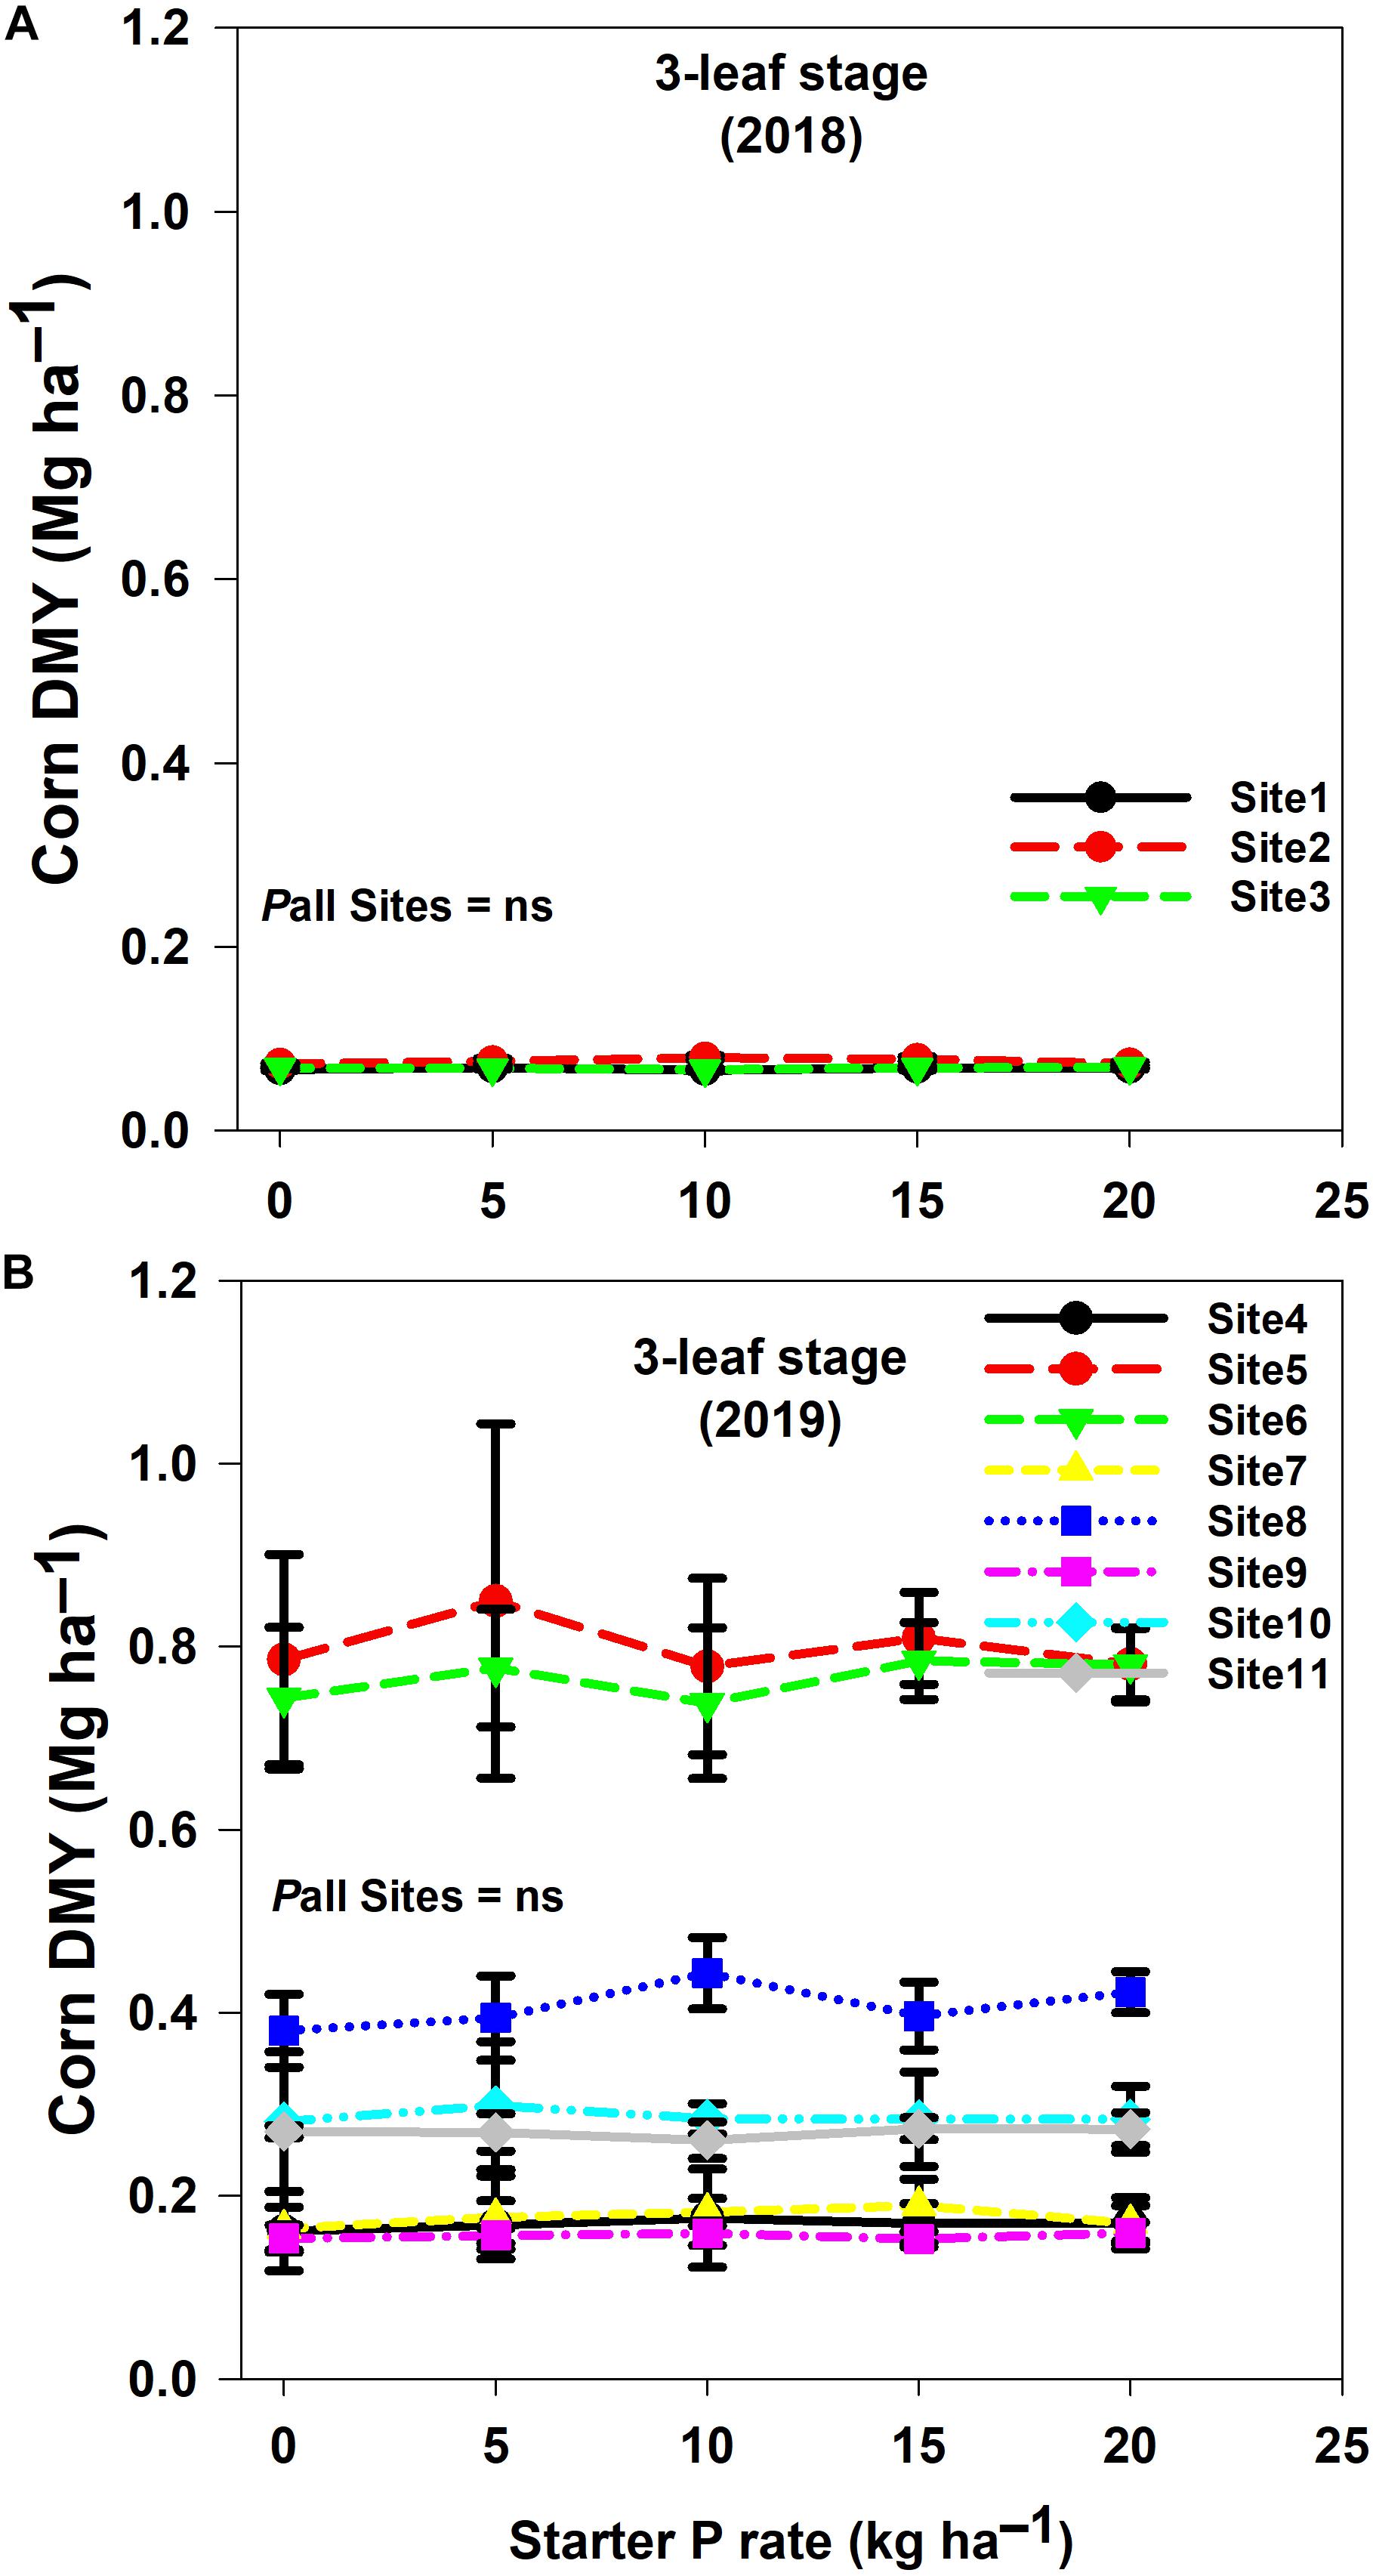
Figure 2. Corn dry matter yield (DMY) at 3-leaf stage with application of starter P rates across 11 sites [2018 (A) and 2019 (B)] in the Fraser Valley, BC. Error bars represent standard deviations of the means.
Corn DMY at the 6-leaf stage was affected by starter P fertilization in all three sites in 2018 (Figure 3A): site1 (P value = 0.014), site2 (P value = 0.033), and site3 (P value = 0.032). The trend of corn DMY response across the three sites was described by a linear-plus-plateau model. The critical starter P rates were 5 kg ha–1 for site1 and site3 and 7.5 kg ha–1 for site2. The plateau DMY were 0.39 and 0.37 Mg ha–1 for site1 and site3 and 0.66 Mg ha–1 for site2 (Table 5). In 2019, only six out of the eight sites were sampled at the 6-leaf stage due to workload and asynchrony with farmer’s activities and planning. Corn DMY was not affected by starter P fertilization in the six sampled sites (Figure 3B). Corn DMY at the 6-leaf stage was on average 0.62 Mg ha–1 in site9; 0.91 Mg ha–1 in site10 and site11; and 1.48 Mg ha–1 in site5, site6, and site8 (Figure 3B).
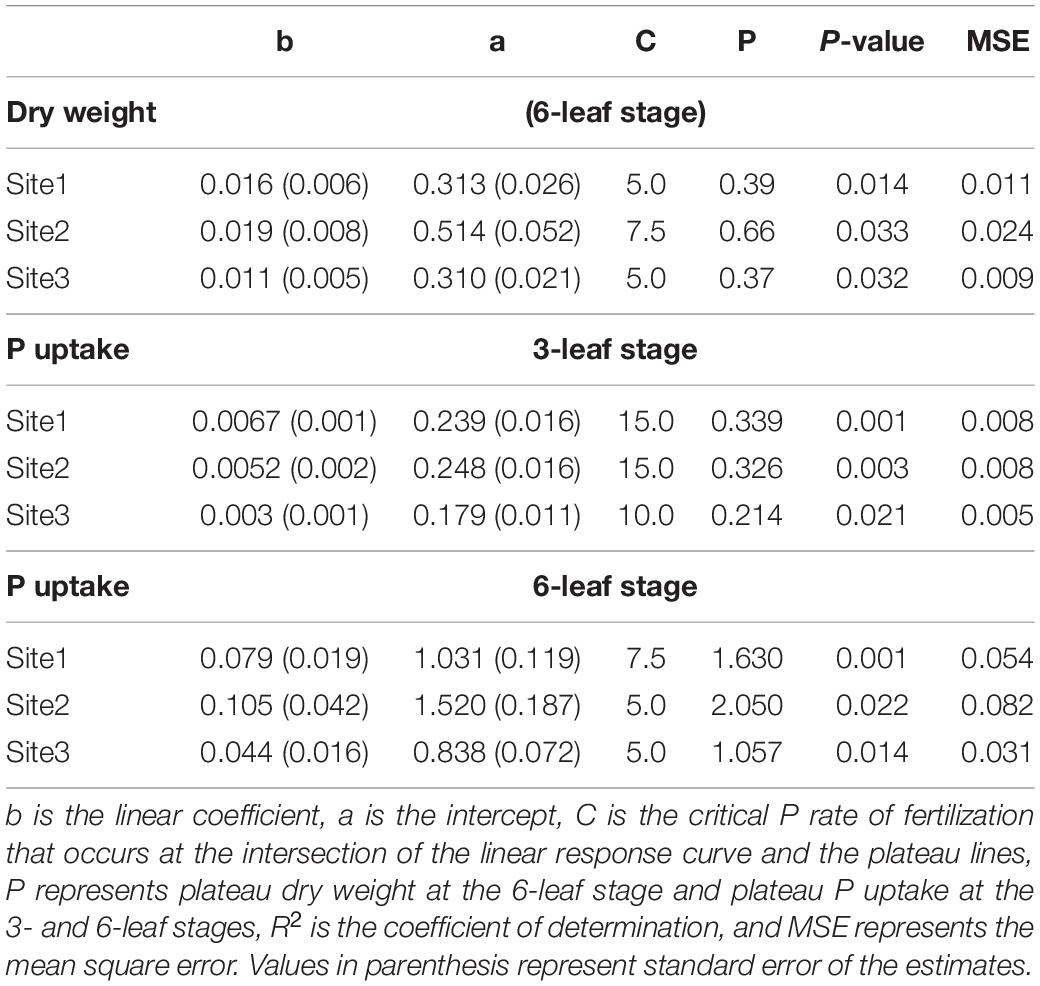
Table 5. Parameters of the linear-plus-plateau response curves (Y = bx + a) to P fertilization of corn dry weight at the 6-leaf stage, corn P uptake at the 3- and 6-leaf stages in 2018.
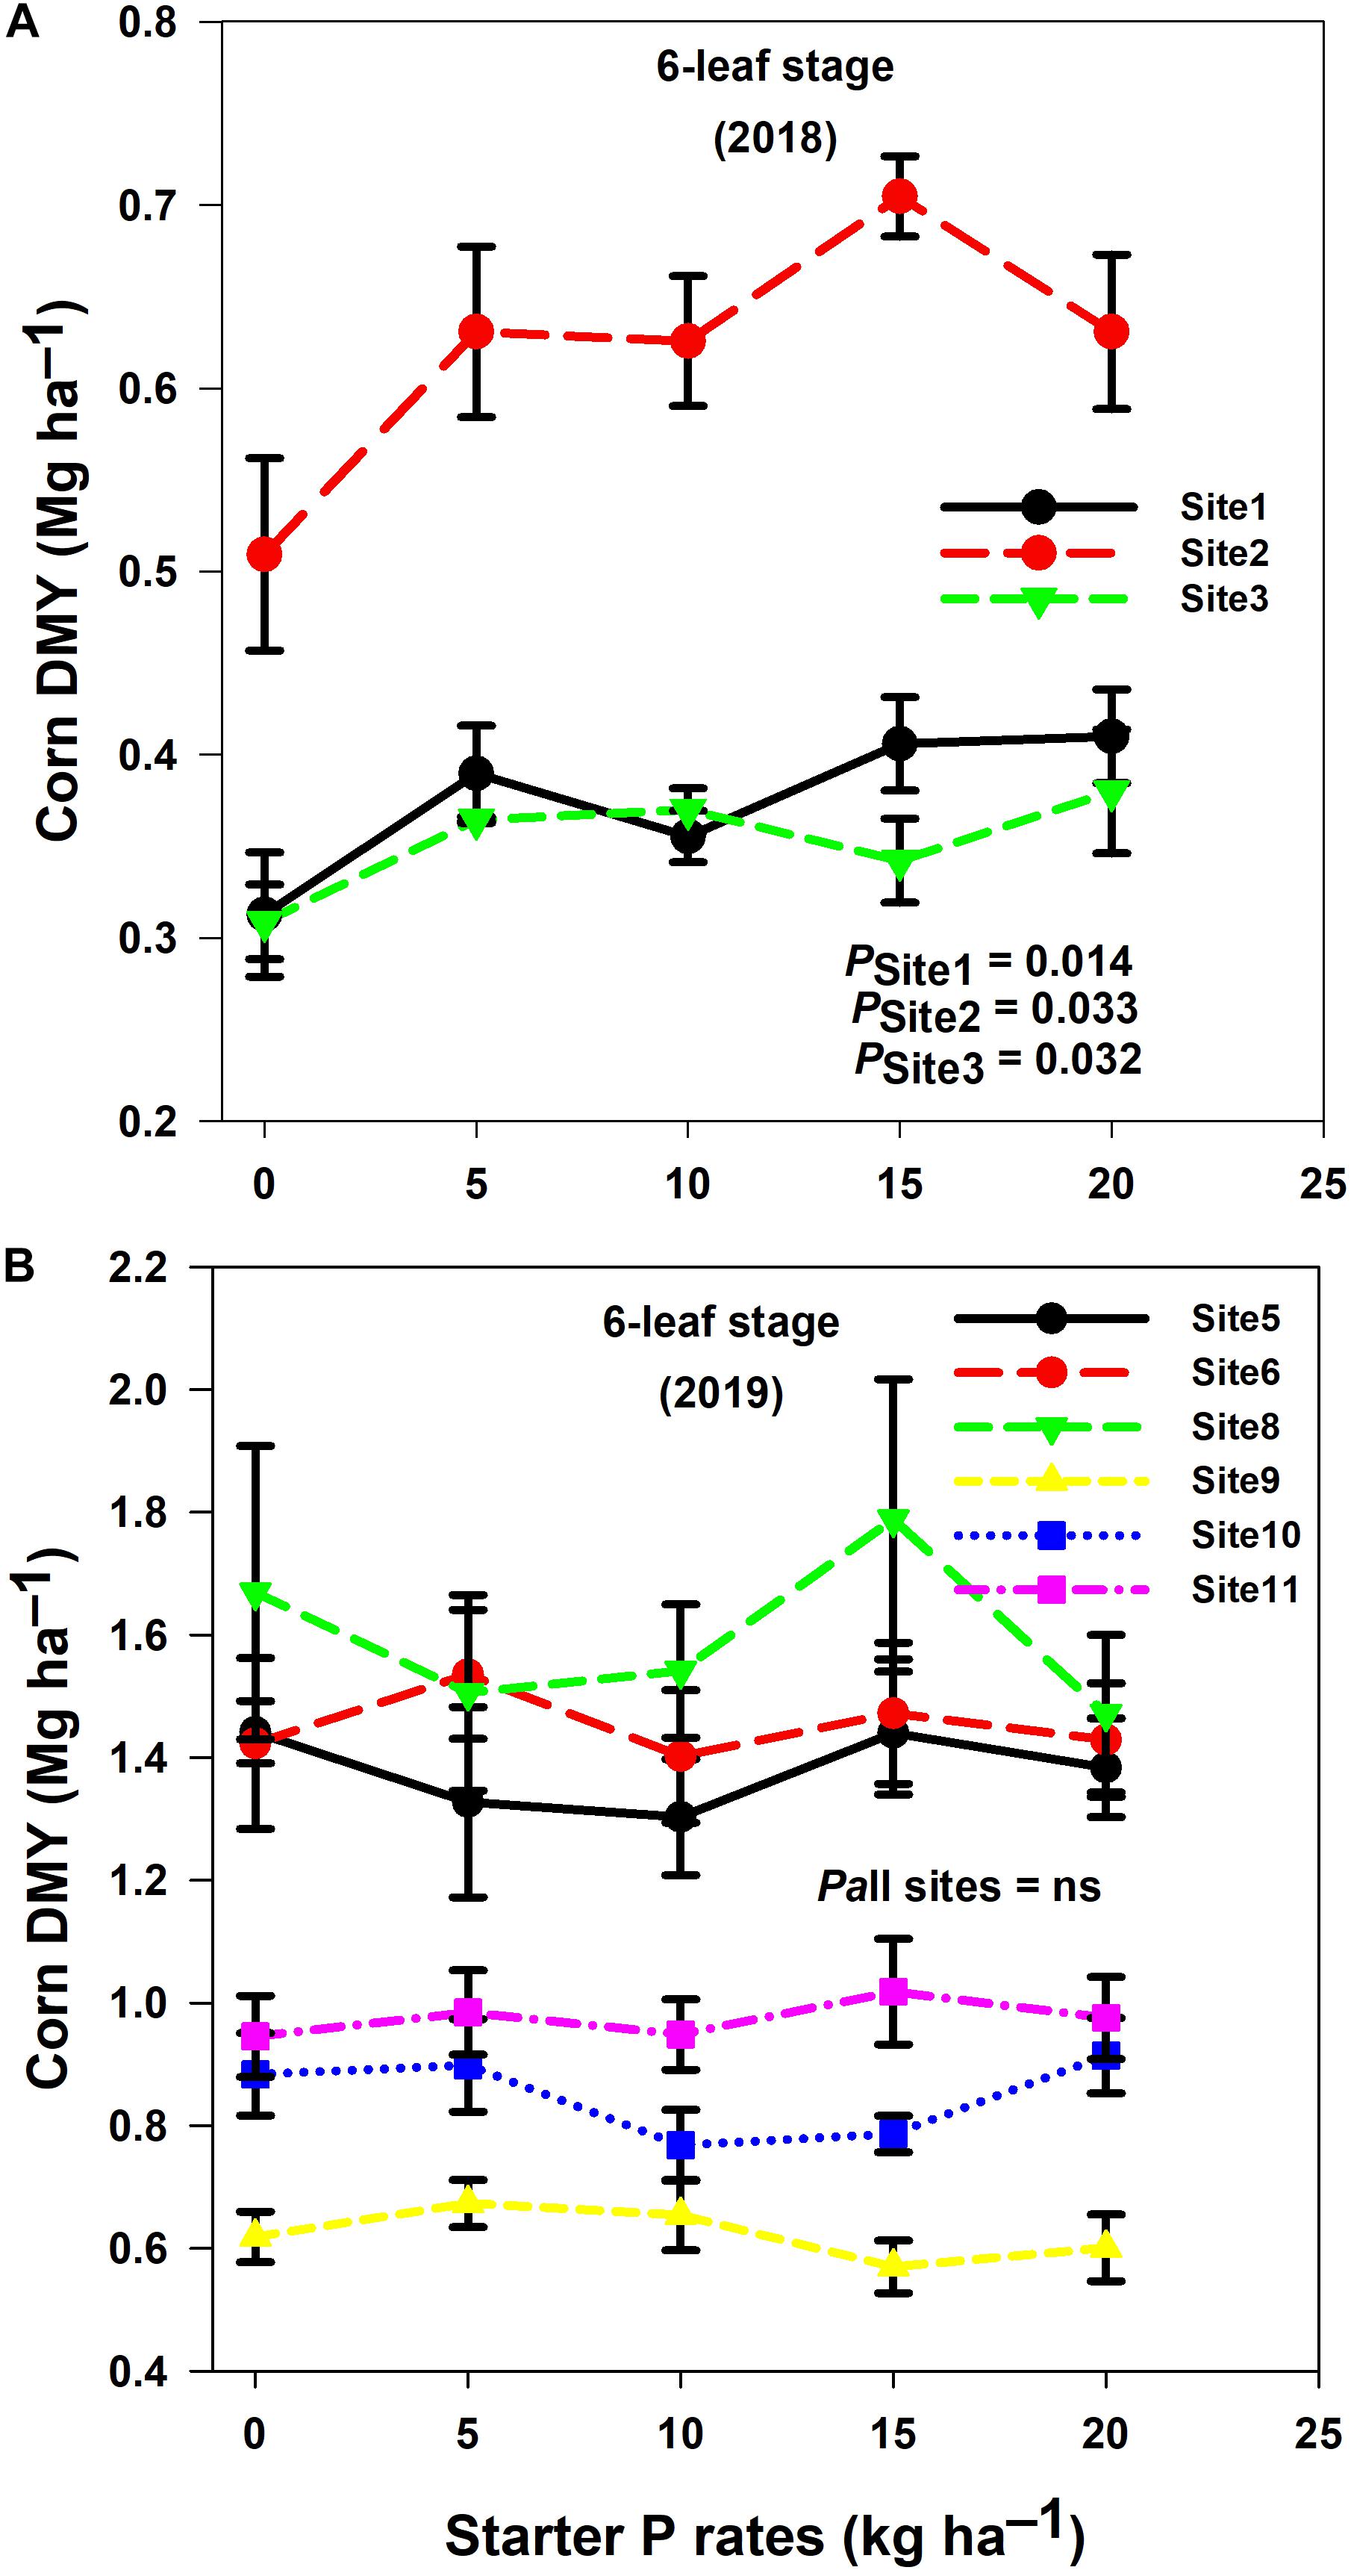
Figure 3. Corn dry matter yield (DMY) at 6-leaf stage with application of starter P rates across 11 sites [2018 (A) and 2019 (B)] in the Fraser Valley, BC. Error bars represent standard deviations of the means.
Corn DMY at harvest varied with starter and manure P additions in the three sites (site1, site2, site3) in 2018 and only one site (site11) in 2019 for a total of 4 out of 11 sites. Among the four sites, the highest corn DMY were obtained with treatment combinations comprising low banded starter P rates at planting and high side-dressed manure P additions at the 6-leaf stage. In site1, corn DMY was 18.60 Mg ha–1 with T2 (5Pstarter + 30PManure) and 15.15 Mg ha–1 with T5 (20Pstarter + 15PManure), representing a change of 22.75% (Figure 4A); in site2, corn DMY was 27.20 Mg ha–1 with T1 (0Pstarter + 35PManure) and 22.75 Mg ha–1 with T5 (20Pstarter + 15PManure), representing a change of 19.48% (Figure 4A); in site3, corn DMY was 28.47 Mg ha–1 with T2 (5Pstarter + 30PManure) and 24.78 Mg ha–1 with T4 (15Pstarter + 20PManure) and T0 (0Pstarter + 0PManure), representing a change of 14.95% (Figure 4A).
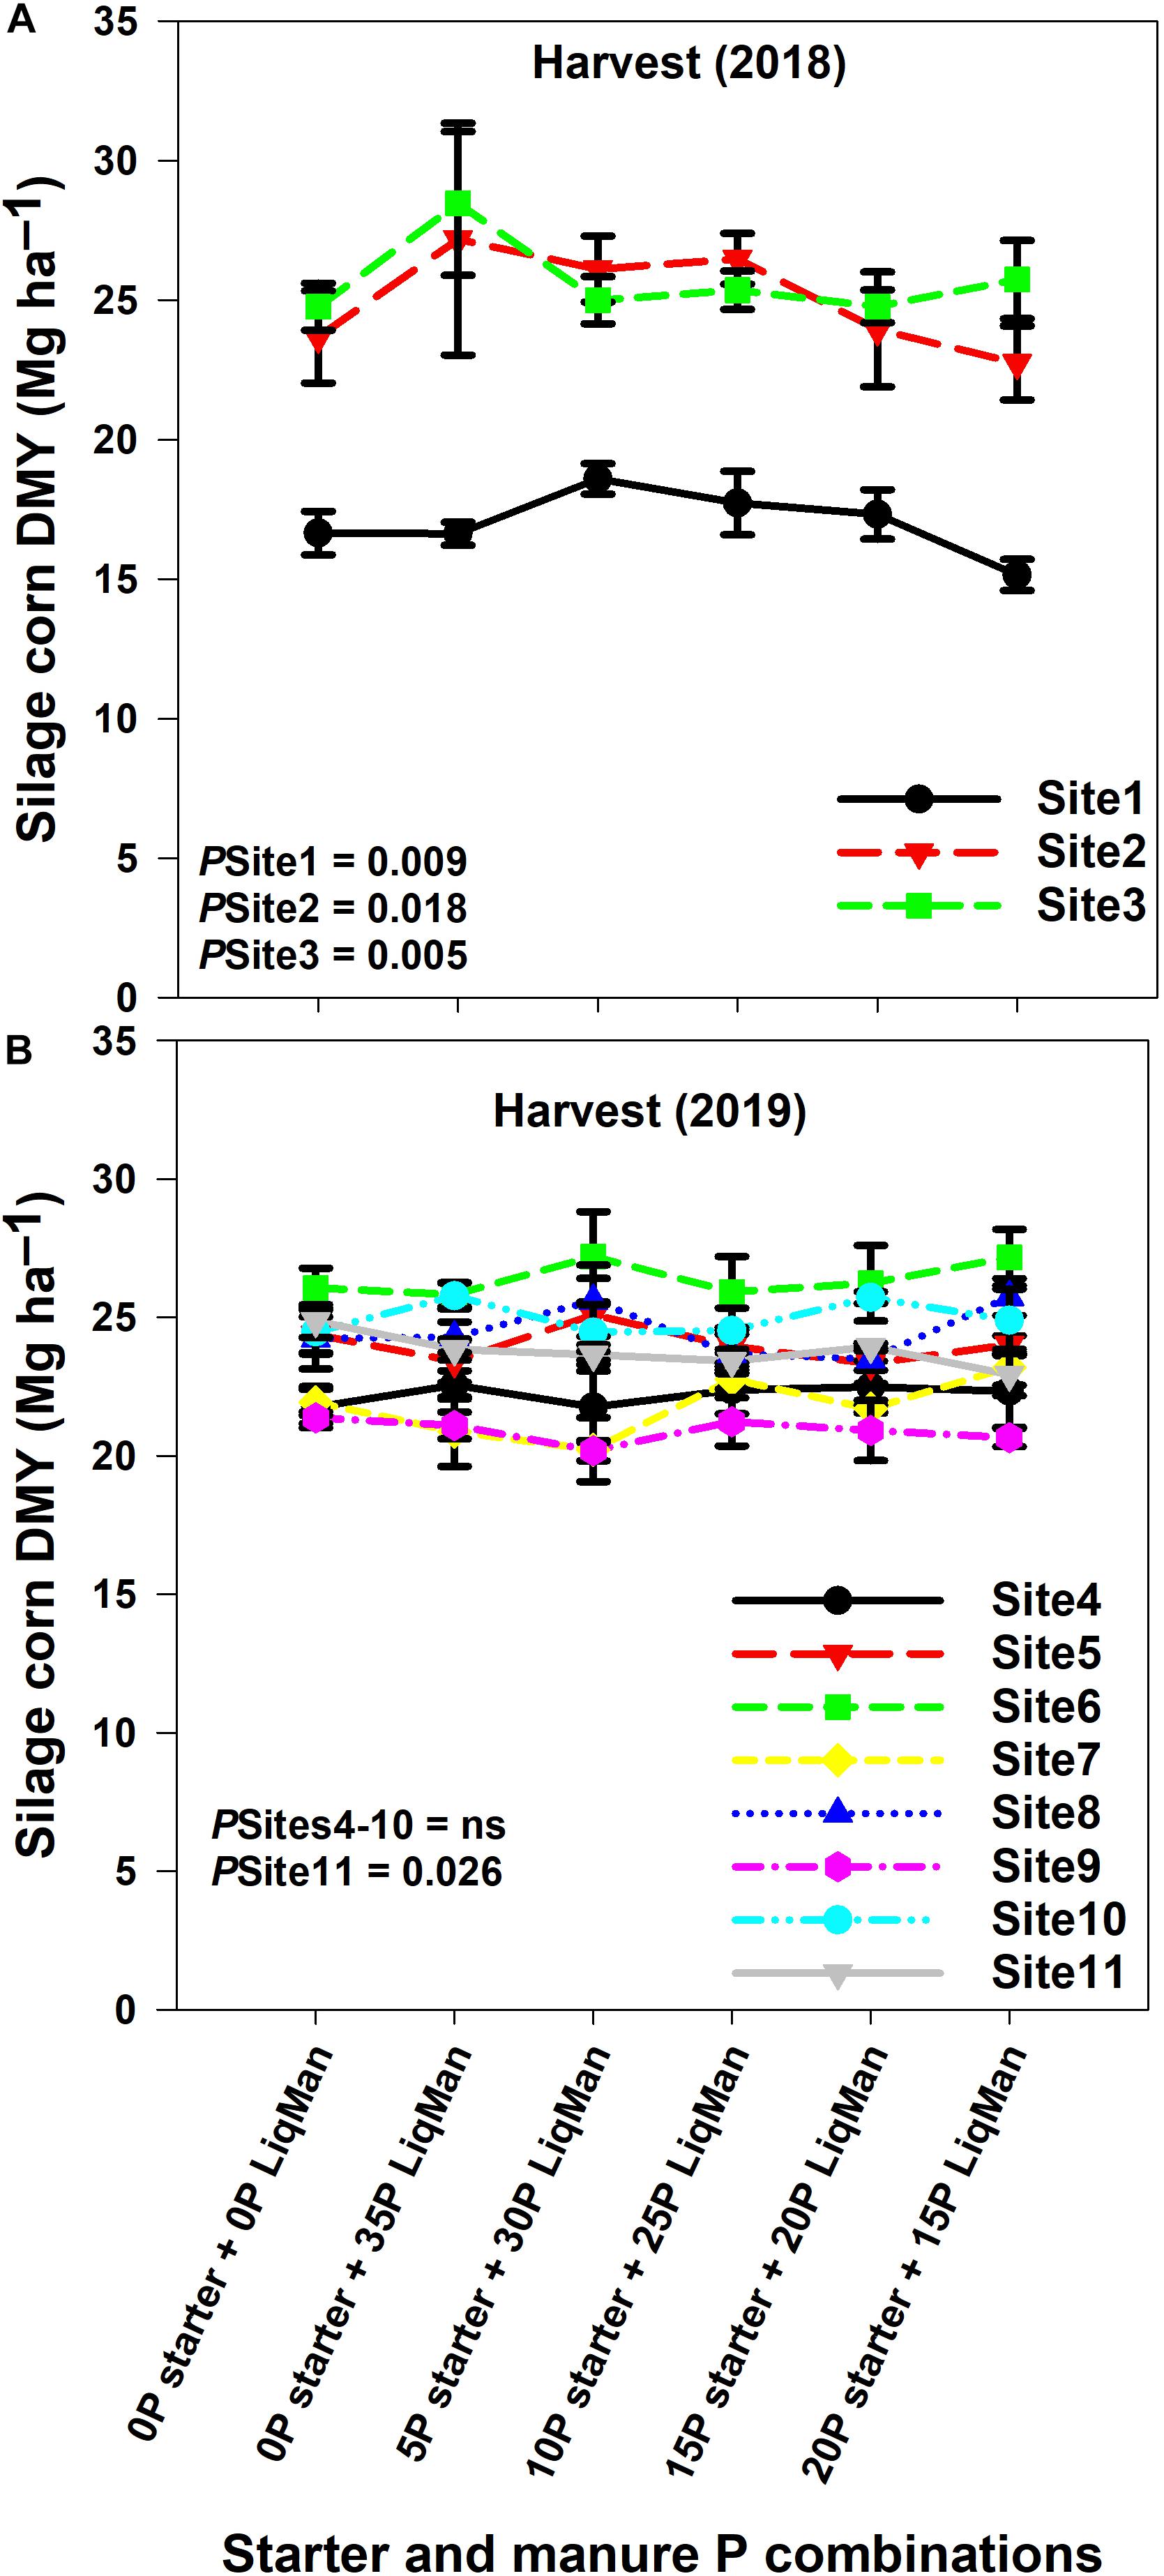
Figure 4. Corn dry matter yield (DMY) at harvest with application of starter P rates and dairy manure across 11 sites [2018 (A) and 2019 (B)] in the Fraser Valley, BC. Dairy manure was applied at 6-leaf stage. Error bars represent standard deviations of the means.
Corn P Uptake
Corn P uptake at the 3-leaf stage was affected by starter P fertilization in all three sites in 2018 (Figure 5A): site1 (P value = 0.001), site2 (P value = 0.003), and site3 (P value = 0.021). The trend of corn P uptake response across the three sites was described by a linear-plus-plateau model. The critical starter P rates were 15 kg ha–1 for site1 and site2 and 10 kg ha–1 for site3. The plateau P uptake was 0.33 kg ha–1 for site1 and site2 and 0.21 kg ha–1 for site3 (Table 5). Corn P uptake at the 3-leaf stage was affected by starter P fertilization in only one site (site6) in 2019 (Figure 5B). Corn P uptake at the 3-leaf stage was on average 0.57 kg ha–1 in site4, site7, and site10 (Figure 1B); 0.83 kg ha–1 in site9 and site11 (Figure 1B); 1.53 kg ha–1 in site8 (Figure 1B); and 3.44 kg ha–1 in site6 (Figure 1B).
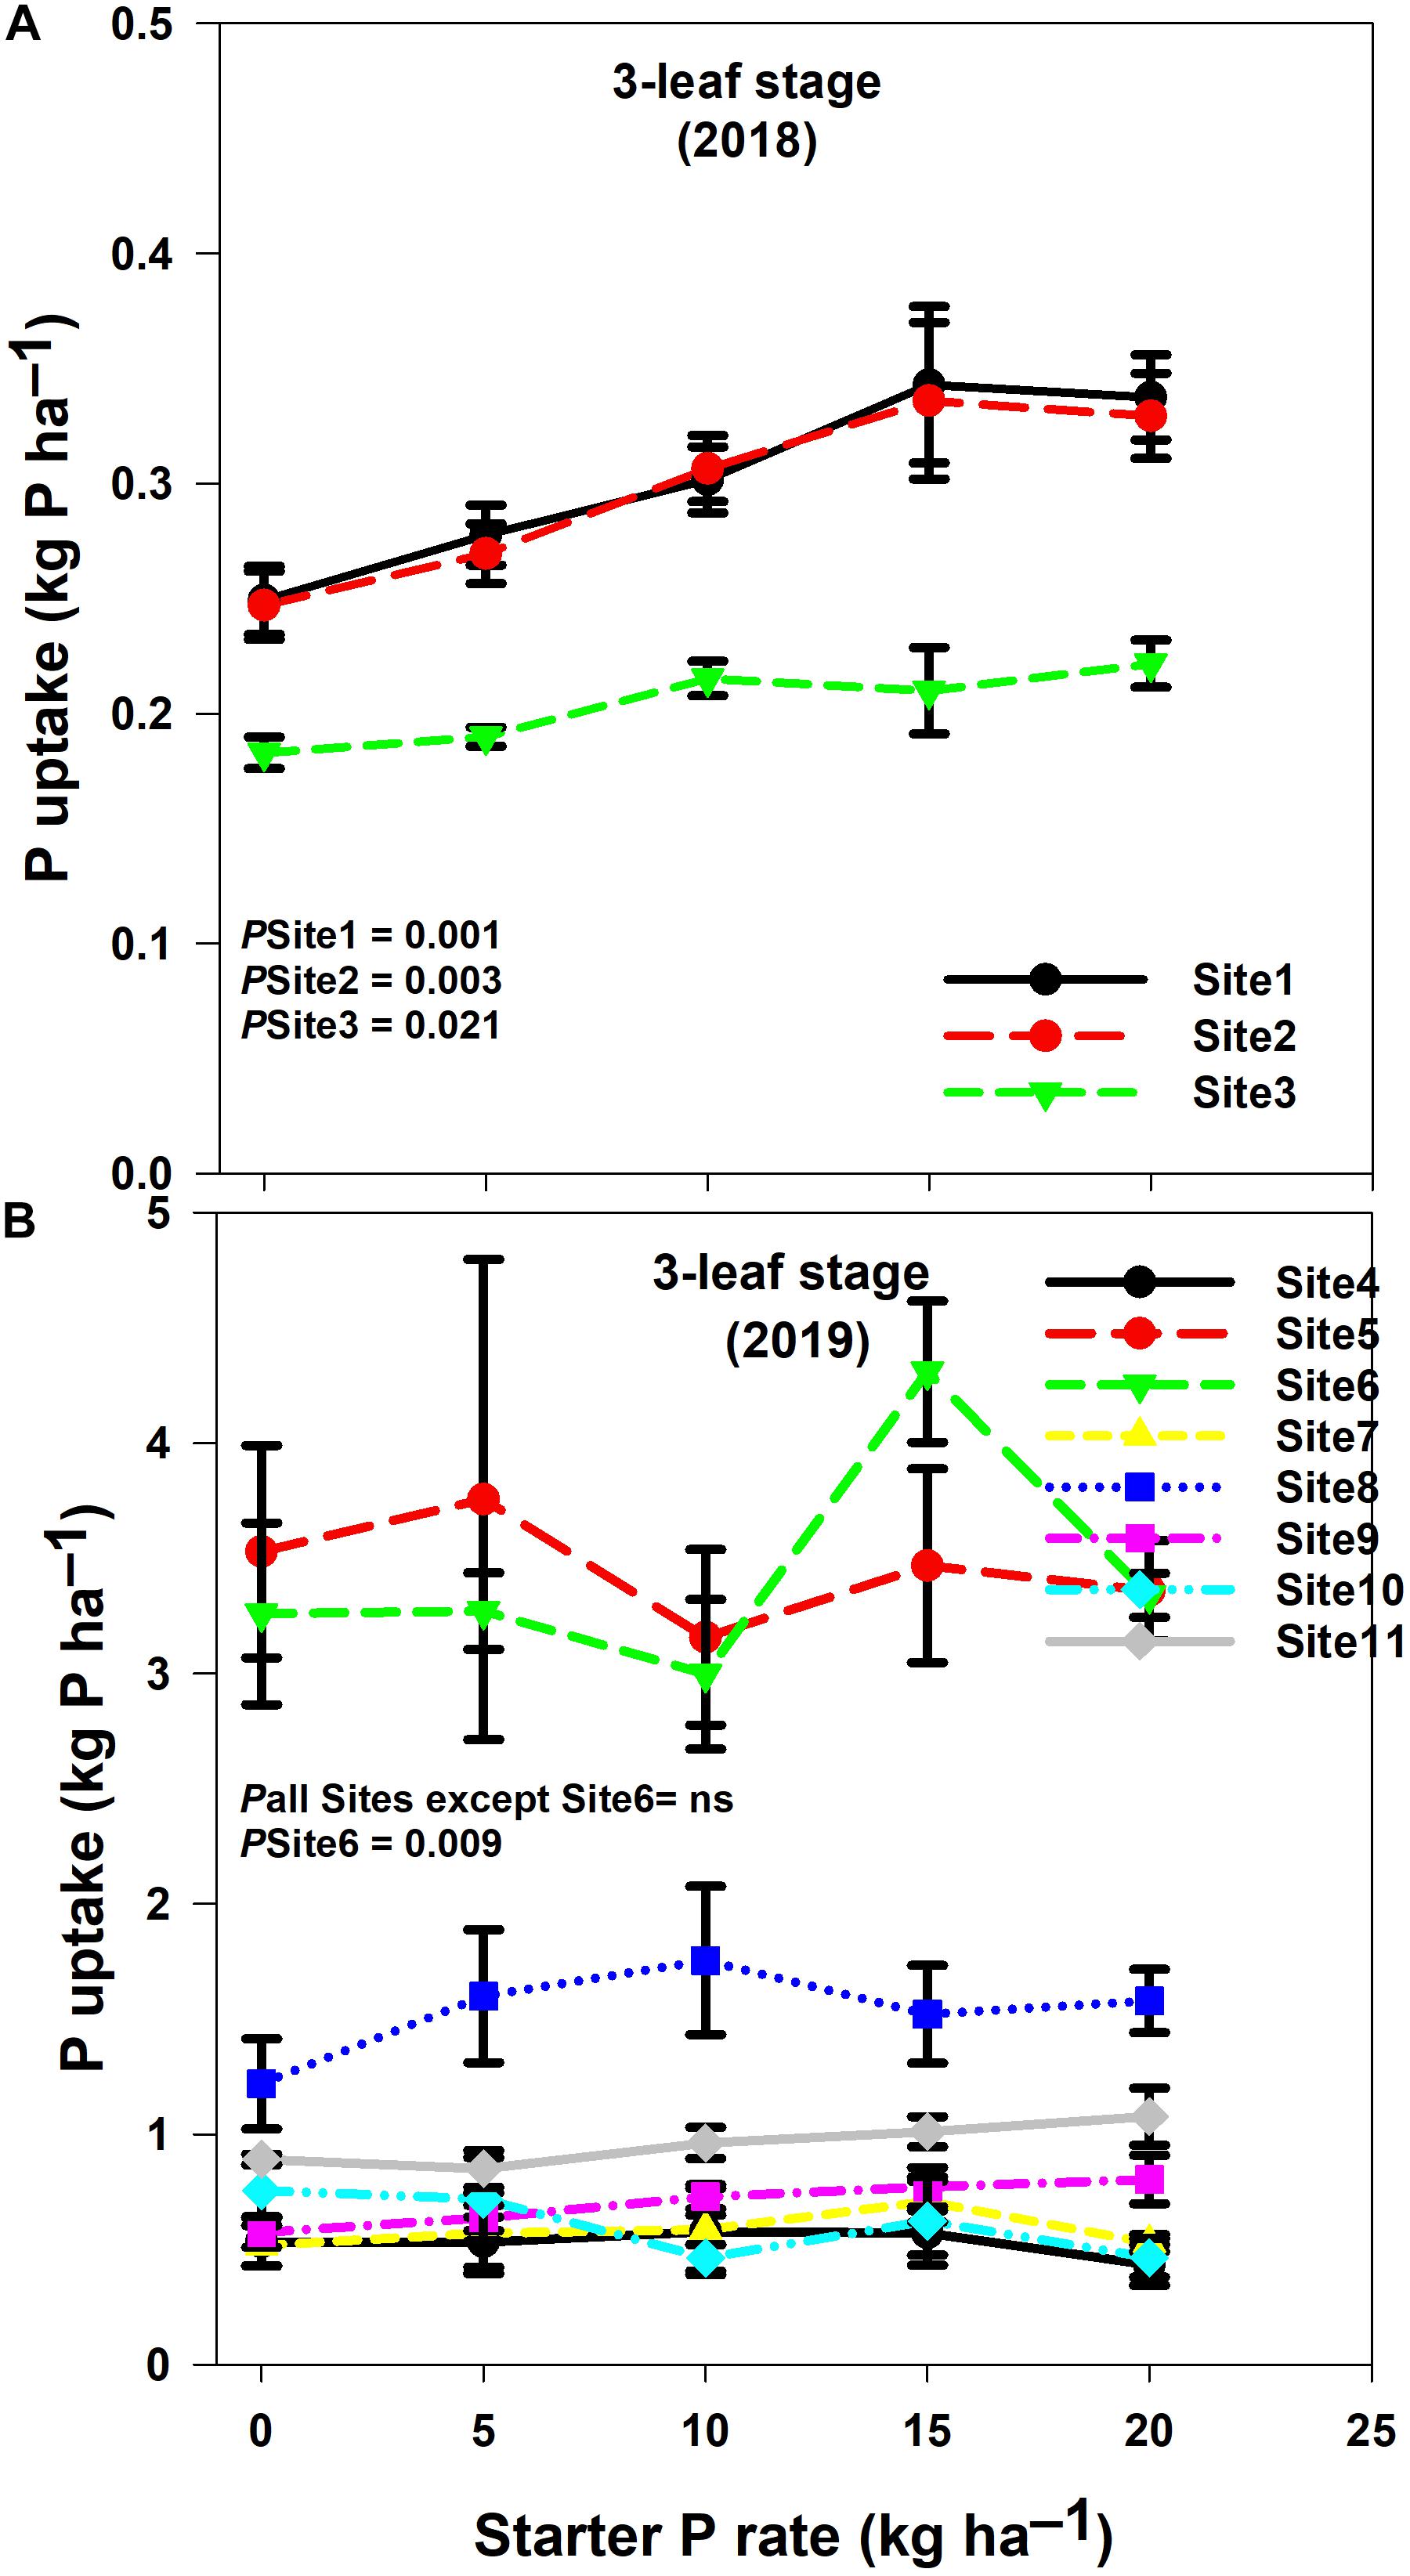
Figure 5. Corn P uptake at 3-leaf stage with application of starter P rates and dairy manure across 11 sites [2018 (A) and 2019 (B)] in the Fraser Valley, BC. Dairy manure was applied at 6-leaf stage. Error bars represent standard deviations of the means.
Corn P uptake at the 6-leaf stage was affected by starter P fertilization in all three sites in 2018 (Figure 6A): site1 (P value = 0.001), site2 (P value = 0.022), and site3 (P value = 0.014). The trend of corn P uptake response across the three sites was described by a linear-plus-plateau model. The critical starter P rates were 7.5 kg ha–1 for site1 and 5.0 kg ha–1 for site2 and site3. The plateau P uptakes were 1.63 kg ha–1 for site1, 2.05 kg ha–1 for site2 and 1.06 kg ha–1 for site3 (Table 5). Corn P uptake at the 6-leaf stage was affected by starter P fertilization in only one site (site5) in 2019 (Figure 6B). Corn P uptake was on average 2.20 kg ha–1 in site9 (Figure 6B); 3.67 kg ha–1 in site10 (Figure 6B); 4.22 kg ha–1 in site11 (Figure 6B) and 5.12 kg ha–1 in site5, site6, and site8 (Figure 6B).
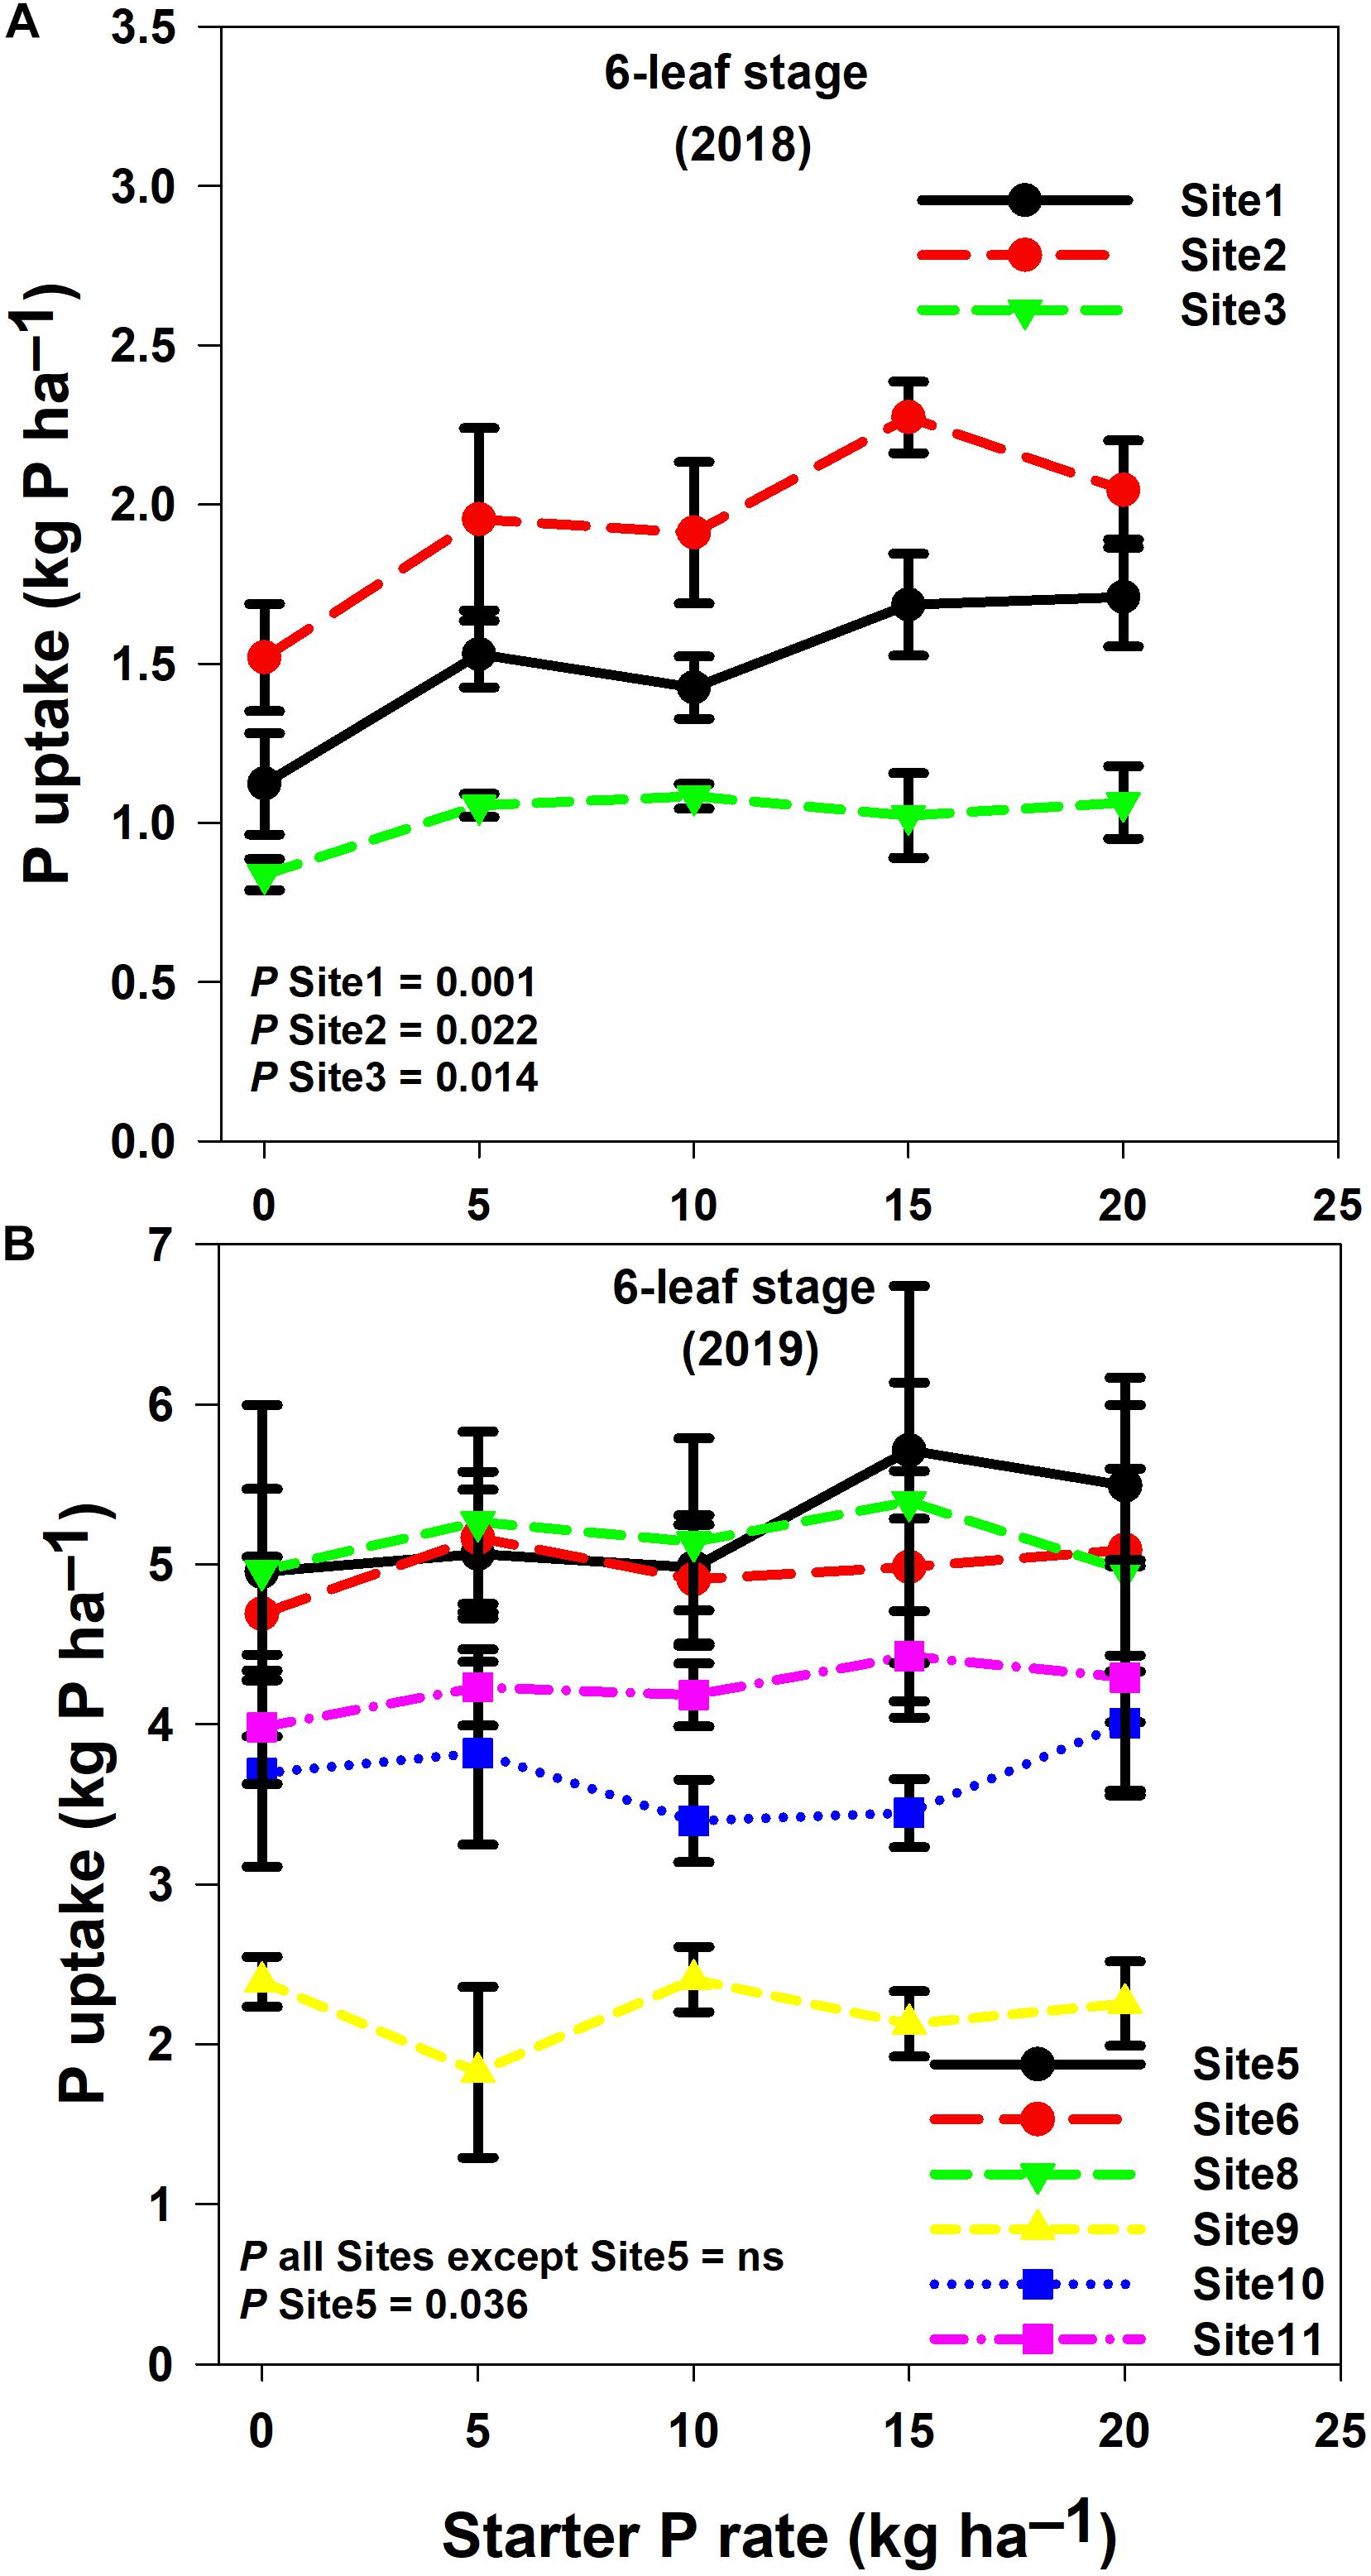
Figure 6. Corn P uptake at 6-leaf stage with application of starter P rates and dairy manure across 11 sites [2018 (A) and 2019 (B)] in the Fraser Valley, BC. Dairy manure was applied at 6-leaf stage. Error bars represent standard deviations of the means.
Corn P uptake at harvest varied with starter and manure P additions in two sites (site1 and site2) out of three in 2018 and seven sites out of eight in 2019 (Figure 7). Corn P uptake varied between 19.66 and 29.79 kg ha–1 in site1 (Figure 7A); 26.82 and 35.90 kg ha–1 in site9 (Figure 7B); 28.17 and 37.24 kg ha–1 in site7 (Figure 7B); 29.10 and 38.43 kg ha–1 in site4 (Figure 7B); 55.67 and 63.54 kg ha–1 in site3 (Figure 7A); 56.67 and 73.46 kg ha–1 in site2 (Figure 7A); 57.00 and 68.63 kg ha–1 in site11 (Figure 7B); 59.68 and 69.00 kg ha–1 in site5 (Figure 7B); 61.18 and 70.29 kg ha–1 in site8 (Figure 7B); 61.76 and 70.08 kg ha–1 in site10 (Figure 7B); and 67.14 and 74.72 kg ha–1 in site6 (Figure 7B). There was a trend of high corn P uptakes with treatment combinations comprising low banded starter P rates at planting and high side-dressed manure P additions at the 6-leaf stage, but low P uptake with treatment combinations comprising high banded starter P rates at planting and low side-dressed manure P additions at the 6-leaf stage (Figure 7).
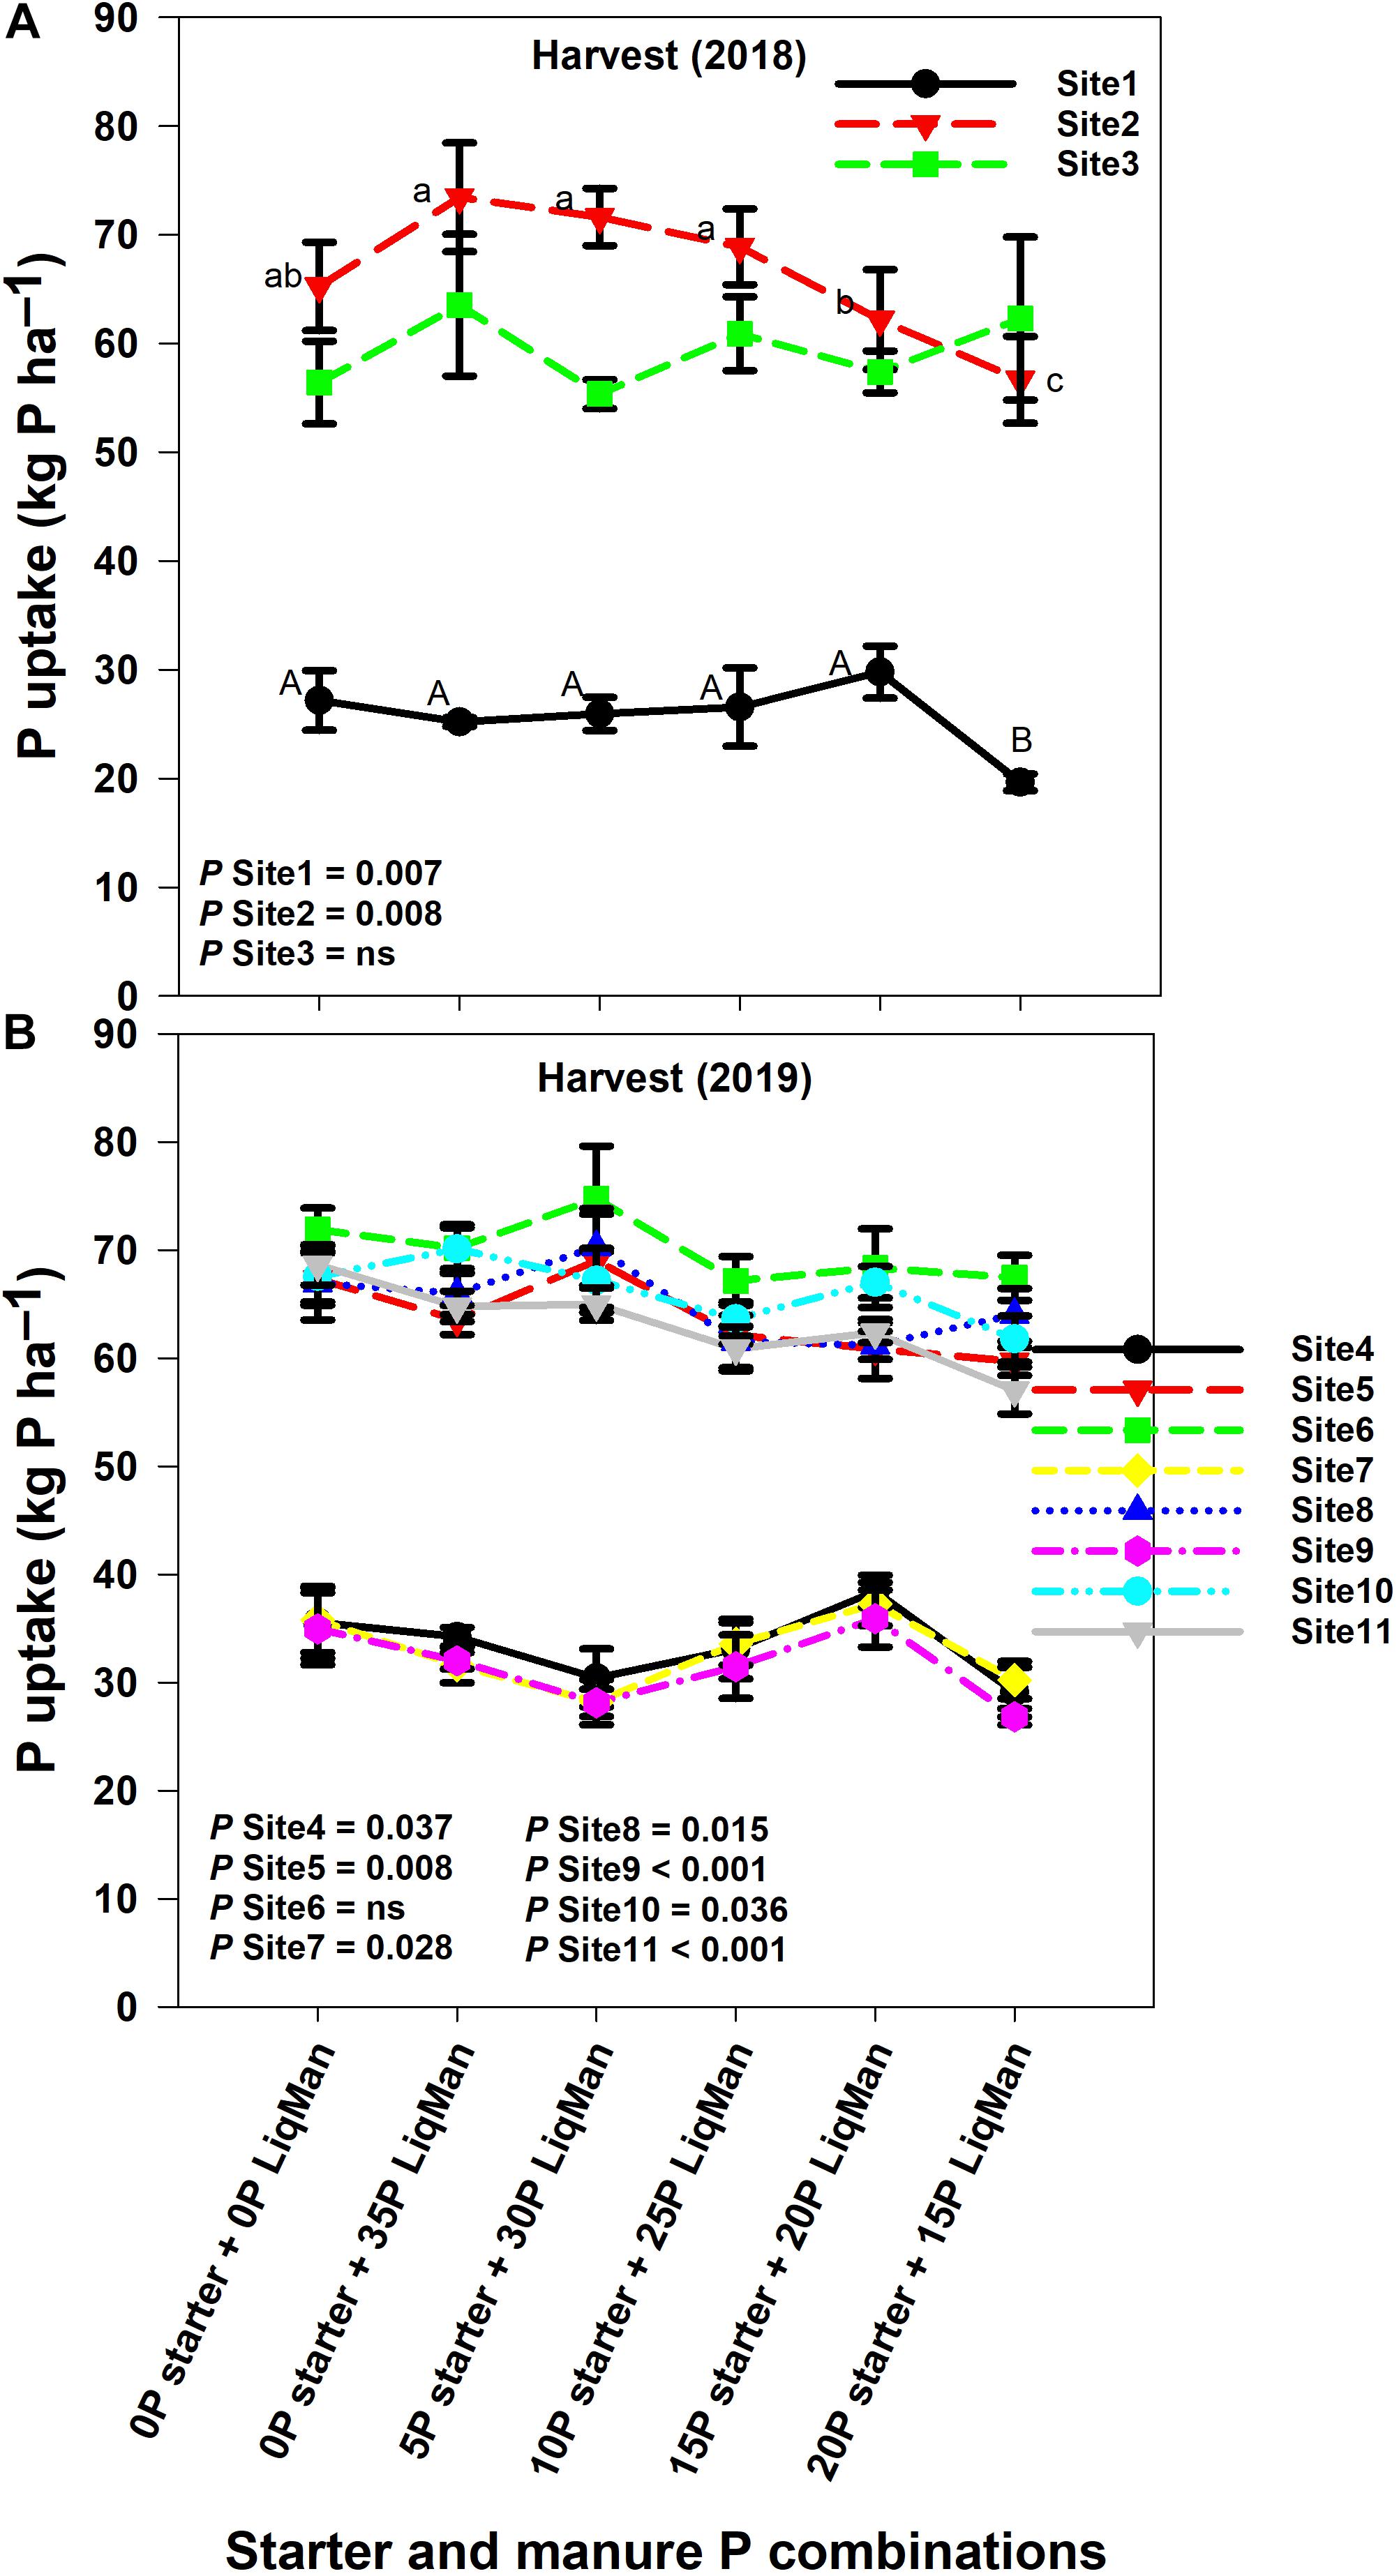
Figure 7. Corn P uptake at harvest with application of starter P rates and dairy manure across 11 sites (2018 and 2019) in the Fraser Valley, BC. Dairy manure was applied at 6-leaf stage. Error bars represent standard deviations of the means.
Phosphorus Budget
Phosphorus budget was significantly lower under control compared with the other starter and manure P combinations in all 11 sites in 2018 and 2019 (Figure 8). Phosphorus budget was on average −31.26 kg ha–1 in site1, site4, site7, and site9 (Figures 8A,B) and −65.20 kg ha–1 in the other sites (Figures 8A,B) with 0 P addition. In contrast, phosphorus budget was on average 4.2 kg ha–1 in site1, site4, site7 and site9 (Figures 8A,B) and −29.73 kg ha–1 in the other sites (Figures 8A,B) with the different starter and manure P combinations.
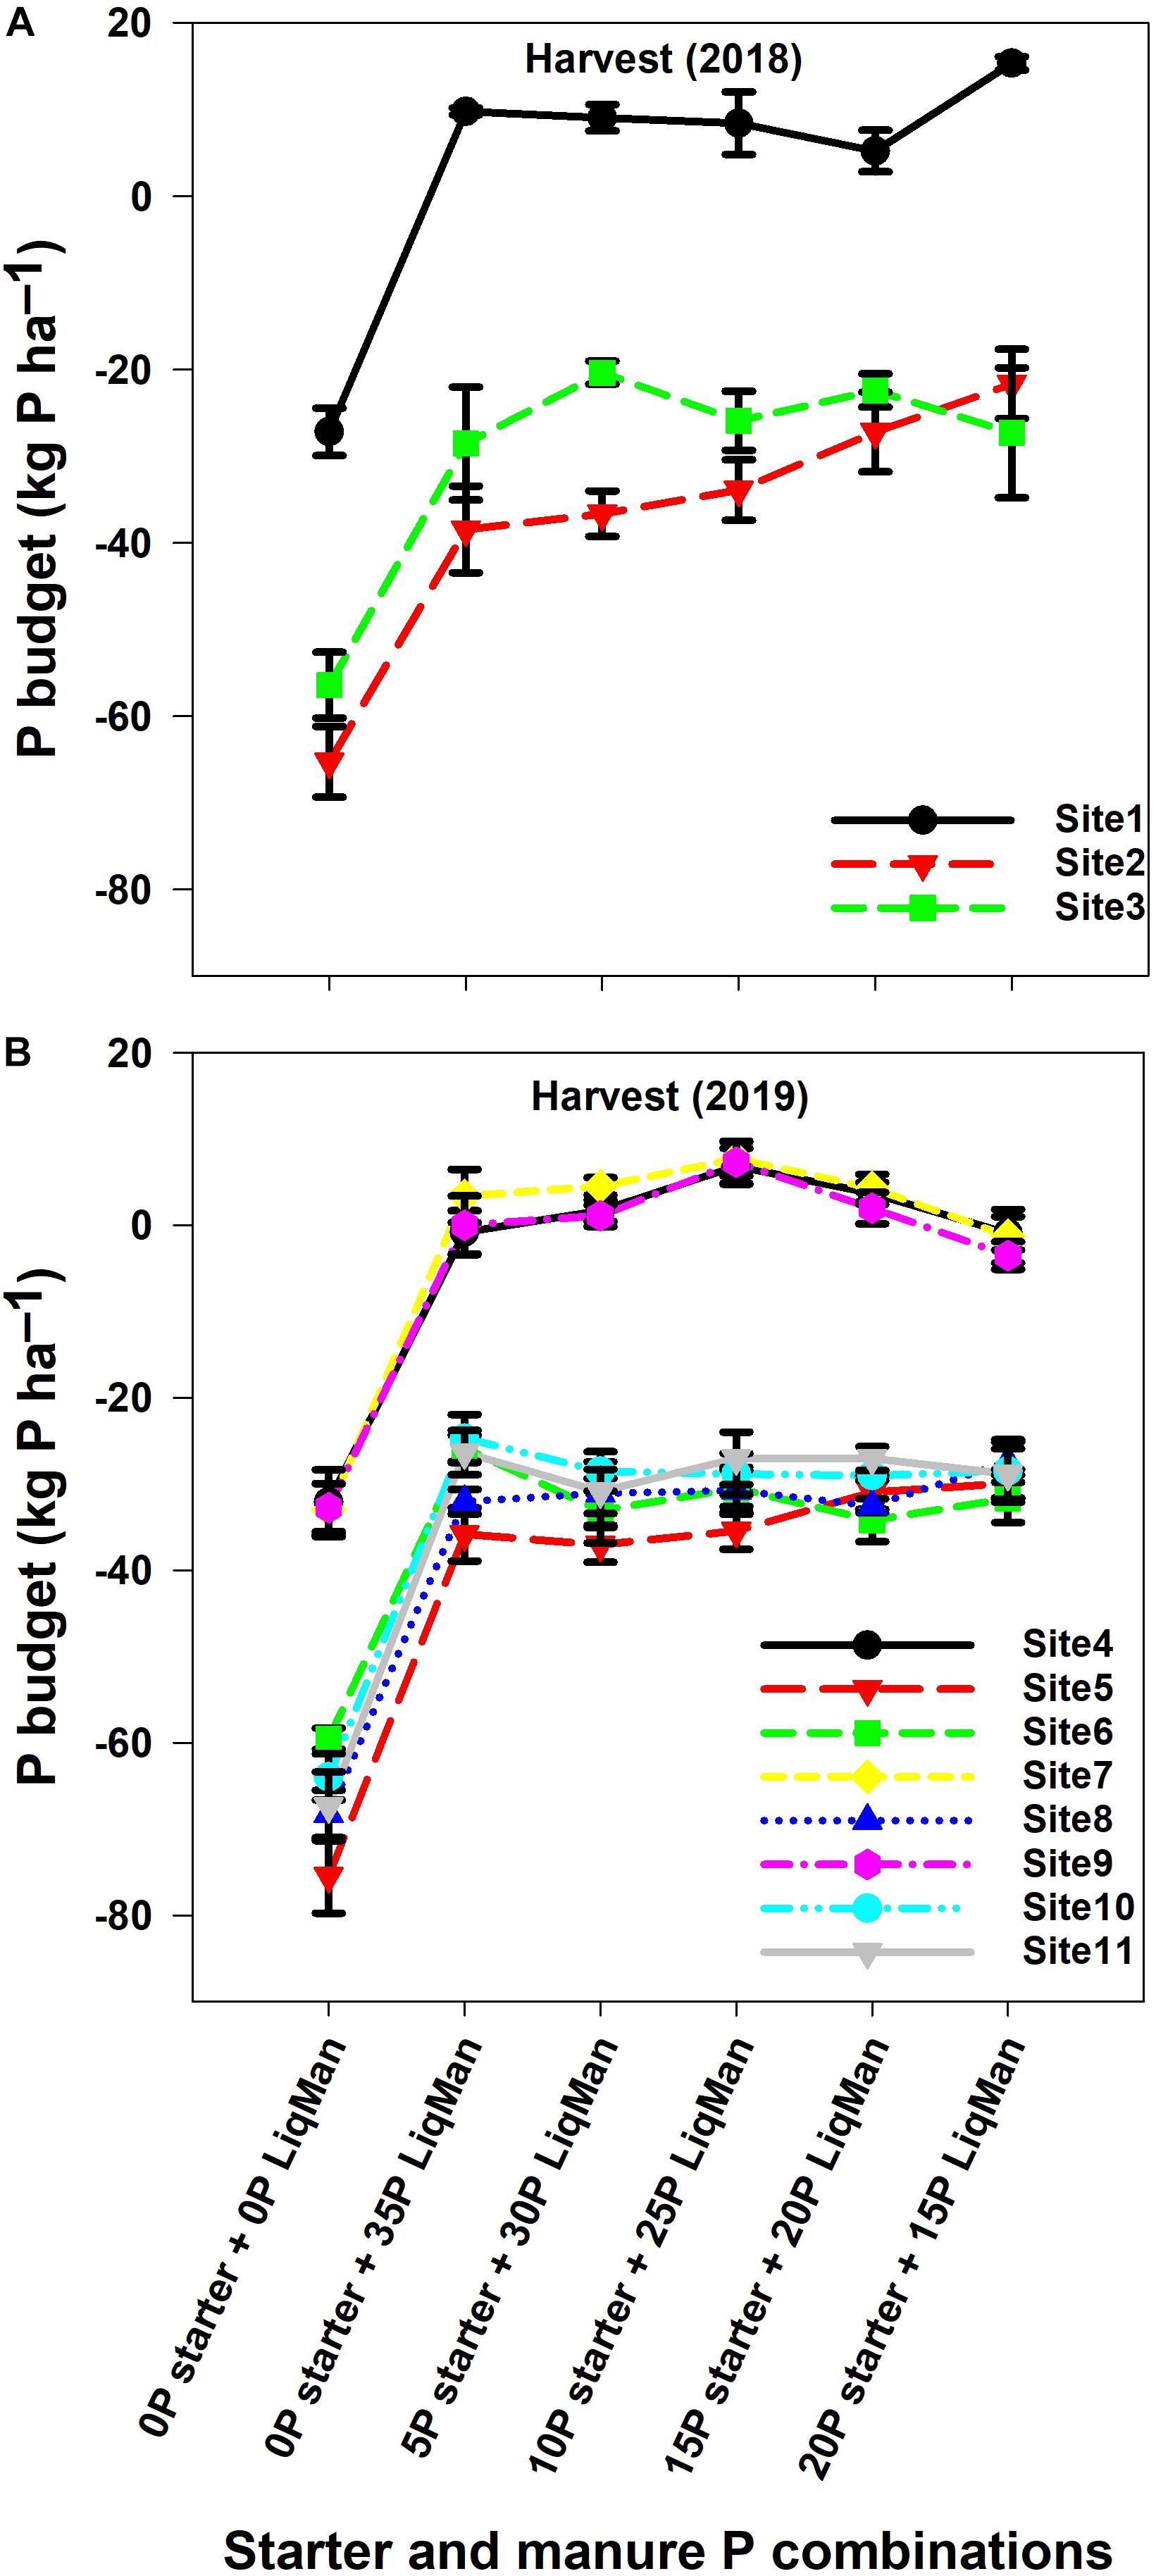
Figure 8. P budget at harvest with application of starter P rates and dairy manure across 11 sites [2018 (A) and 2019 (B)] in the Fraser Valley, BC. Dairy manure was applied at 6-leaf stage. Error bars represent standard deviations of the means.
Mehlich-3 P and P Saturation Indicators vs. Dry Matter Weight and P Uptake at Harvest
The 11 sites selected for the 2-year study represented a wide range of PM3, Pox, AlM3, AlOx, FeM3, and FeOx values (Table 1). The relationships between PM3, DPS, PSI and corn DMY and P uptake were described by a quadratic relationship (Figure 9). The quadratic relationships obtained in this study are significant, with R2 values varying between 0.65 and 0.94 (Figures 9A,C). These relationships encompassed a range of PM3 between 60 and 200 mg kg–1, which is representative of high testing P soils of the coastal BC (Figures 9A,B), DPS between 14 and 38% (Figures 9C,D), and PSI between 3 and 14% (Figures 9E,F). However, site5 and site6 were not fitted by the functions. In addition, for the relationship between PM3 and P uptake, site4 and site7 were not fitted by the quadratic function (Figure 9B).
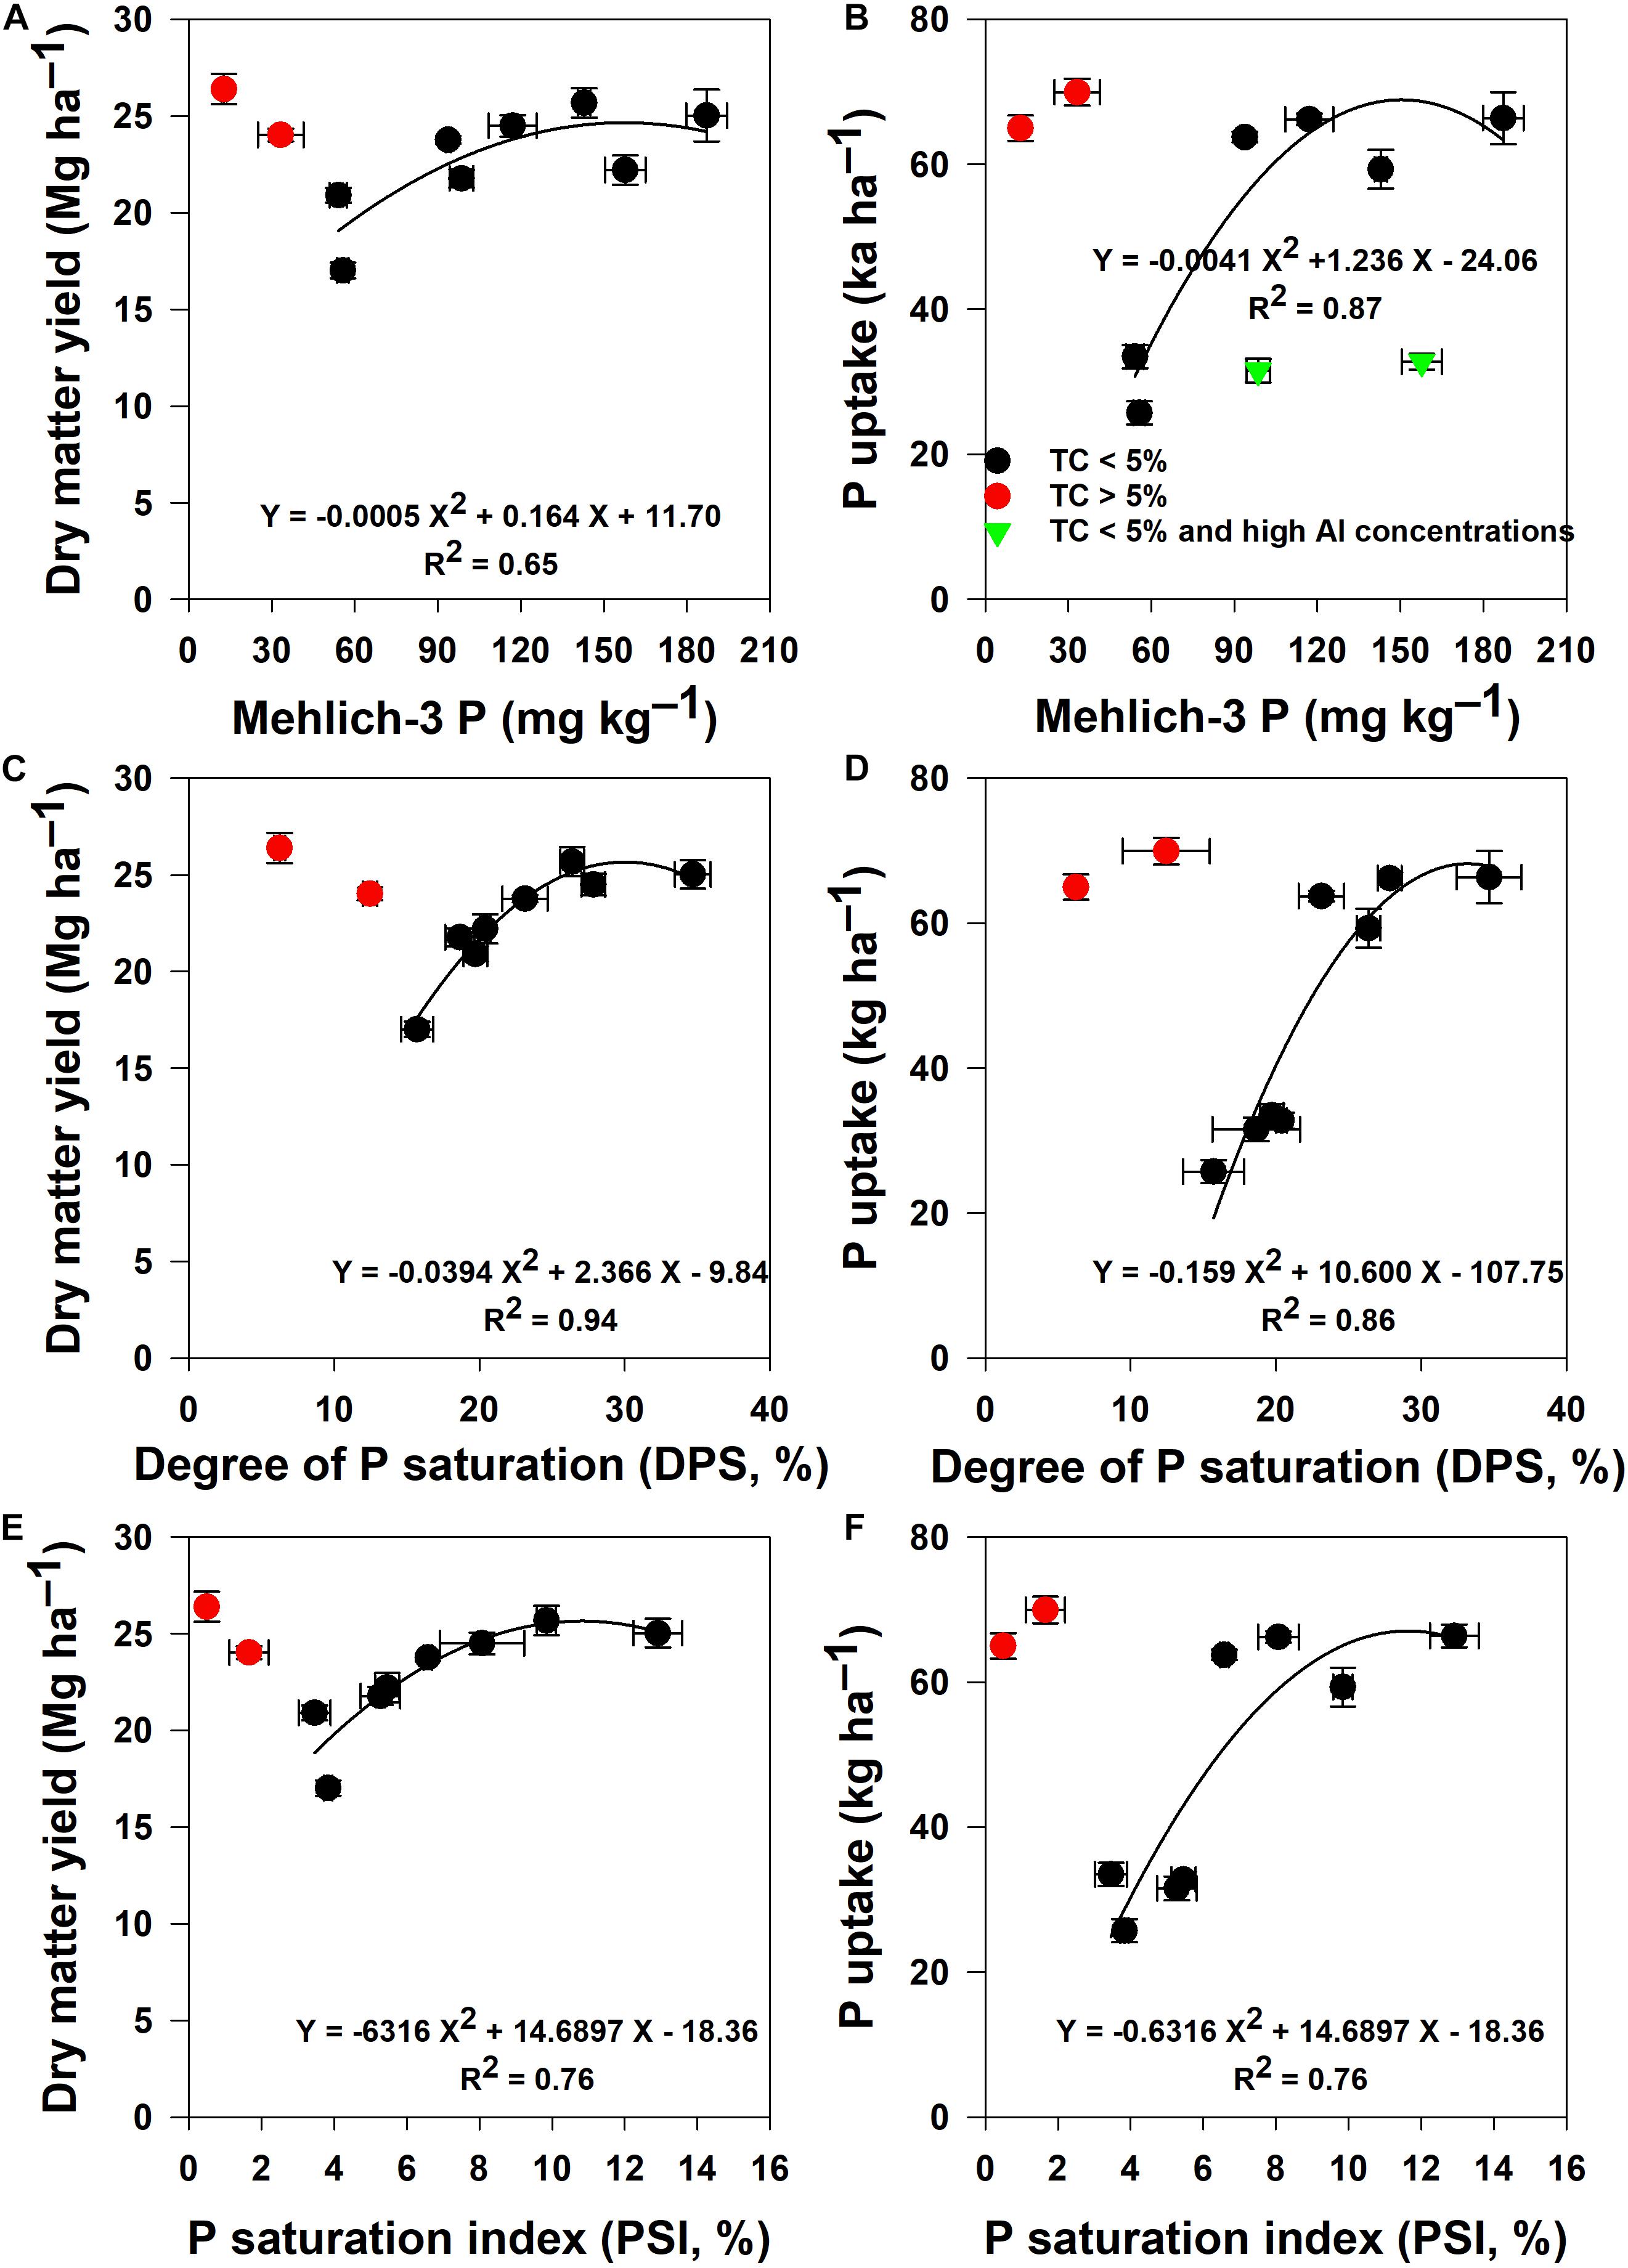
Figure 9. Mehlich-3 P (A,B); Degree of P saturation (C,D); P saturation index (E,F) vs. Dry matter yield and P uptake at harvest with application of starter P rates and dairy manure across 11 sites in the Fraser Valley, BC. Dairy manure was applied at 6-leaf stage. Error bars represent standard deviations of the means.
Discussion
The Effect of Starter P Fertilization on Growth of Young Silage Corn
The linear-plus-plateau response models of DMY and P uptake to starter P obtained in 2018 confirm the well-established negative effects of low soil temperatures on performances of corn plants at early growth stages (3- and 6-leaf stages). In 2018, starter P was beneficial for corn growth early in the growing season in the three study sites. This positive effect coincided with low soil temperatures that prevailed early in the growing season between emergence and the 6-leaf stage (May 26 and June 26, 2018). Daily soil temperatures were below 19°C for 13 successive days, and soil temperatures as low as 17°C were recorded (Figure 1A). In contrast, in 2019, starter P had no significant effect on the 3- and 6-leaf stage corn plants in all eight study sites, probably because soil temperatures during the same period dropped below 19°C for only 5 successive days with a minimum of 18°C (Figure 1B). Low soil temperatures early in the growing season reduce root growth and soil P availability even in high-P soils. One significant result of our study, however, is the critical starter P rates obtained from the linear-plus-plateau response models of DMY and P uptake to starter P at the 3- and 6-leaf stages. Overall, critical starter P rate was 5 kg P ha–1 at two sites and 7.5 kg P ha–1 at one site (Table 5). The P values and mean square error (MSE) indicated that linear-plus-plateau models accurately predicted the response of DMY and P uptake of young corn plants to starter P at the 3- and 6-leaf stages in 2018. The critical starter P rates obtained in our study are in the range of those recommended in other areas. Starter P fertilizer rates for silage corn are 5 to 15 kg P ha–1 in Ontario and Quebec (Preston, 2019) and 5 to 13 kg P ha–1 in the US (Jokela, 1992). In cool and moist coastal BC, almost all silage corn is side-banded at approximately 30–40 kg P ha–1, and most of the corn receives manure (Zhang et al., 2018). The critical starter P rates obtained in our study are below local recommendations (British Columbia Ministry of Agriculture [BCMA], 2010). This indicates the need to refine and update recommendations for P fertilizer, particularly starter P fertilizer, for silage corn production in BC. Refining starter P fertilizer for silage corn will contribute to decreasing annual P inputs in this cropping system. A better match of P applications to silage corn needs will help to maintain or drawdown legacy P and reduce P losses to water sources.
The Effects of Starter and Manure P Additions on Corn Dry Matter Yield and P Uptake at Harvest
Corn DMY values at harvest were in the range of those obtained by Zhang et al. (2018) in south coastal BC in a study investigating the effects of 11 year of different dairy manure fractions and mineral fertilizer on two consecutive silage corn productions with average DMY of 16.1 Mg ha–1 in 2015 and 22.7 Mg ha–1 in 2016. Our results are also in the range of those obtained by Ferreira and Teets (2017) in 2014 and 2015 at two commercial dairy farms located in Virginia. Our results are in the range of those obtained by Arriola et al. (2012) across several silage hybrids in Florida. In contrast, our results are higher than those of Jokela (1992), perhaps due to new and improved silage corn hybrids used in our study.
In our study, we were interested in understanding how a balanced P input including banded starter P fertilizer at planting and side-dressed manure P at the 6-leaf stage affects silage corn DMY and P uptake at harvest. Our results show that in 4 out of the 11 study sites, there was a trend of high DMY at harvest with treatment combinations comprising low starter P rates (<10 kg P ha–1) and high side-dressed manure P (>25 kg P ha–1) additions at the 6-leaf stage (Figures 4A,B). Corn P uptake showed similar trends in 9 out of the 11 study sites (Figures 7A,B). The final DMY and P uptake values indicate that the effect of starter P observed at the 6-leaf stage in 2018 was not carryover through harvest. It is well-known that most crops take up only 10 to 20% of P fertilizer during the year of application. The decreasing trend of corn P uptake at harvest with treatments including high starter P rates indicates that part of P fertilizer was fixed by the soil and therefore was not readily available for plant uptake later in the growing season. Kowalenko (2005) showed that soils of coastal BC exhibit high P retention or fixation capacity. Zhang et al. (2018) also found that early plant response to starter P did not have a lasting effect on yield at final harvest even though starter P rate applied was 40 kg P ha–1. Mallarino et al. (1999) in several corn experiments in Iowa also found that early growth and nutrient uptake to banded P did not translate into higher yield. Jokela (1992) in a study conducted on 12 soils with contrasting P levels also found that when soil test P is medium or high, the likelihood of the carryover effect of starter P on silage corn yield through harvest is low.
The 6-leaf stage coincides with the beginning of rapid nutrient uptake by corn plants. In our study, the synchrony between the timing of manure P application and the growth stage corresponding to high nutrient demand enhanced the potential for greater corn P uptake (Figures 4A,B). In coastal BC where dairy manure is an important source of P and other nutrients for dairy farmers, management practices that include combinations of low starter P rates and optimum rates of side-dressed manure P at the 6-leaf stage could be an alternative to current practices. The presence of other nutrients in dairy manure also contributed to a large extent to DM production and silage quality with optimum side-dressed manure P additions at the 6-leaf stage. In this study, nitrogen is the only element that was balanced among the treatment combinations (Table 3). Zhang et al. (2018) and other authors showed that interference in root P uptake with other nutrients such as zinc and calcium could occur in manure treated plots and result into lower P concentrations and P uptakes compared with control plots. We did not observe symptoms or other evidence of interference among nutrients on plant growth, probably because of the short-term nature of our study sites.
Relationship Between Silage Corn Yield and P Saturation Indicators
One important goal of this study is to improve our understanding of the mechanisms controlling P cycling in soils with high legacy P in coastal BC in order to reduce the risk of P losses to soils and water sources while building resilient cropping systems. In this study, we show that PM3, DPS and PSI are highly correlated with silage corn DMY and P uptake with R2 values varying between 0.65 and 0.94 (Figure 9). These relationships encompassed a range of PM3 between 60 and 200 mg kg–1, which is representative of the high testing P soils of coastal BC (Figure 9A), DPS between 14 and 38% (Figures 9A,B), and PSI between 3 and 14% (Figure 9B). The significant relationship between PSI and DMY obtained in our study indicates that this proxy of DPS can be adapted for coastal BC soils as an agro-environmental indicator to assess the risk of P losses. In the Netherlands, DPS > 25% indicates a high risk of P transport with runoff water (Breeuwsma and Silva, 1992). In Wallonia, Belgium, a study using 57 agricultural topsoil samples subject to diverse P management showed that DPS values between 20 and 30% corresponded to the agronomic optimum of soil P content (Renneson et al., 2015). In North America, the PSI has provided much-needed information to support environmental assessment at watershed, local, and provincial scales (Khiari et al., 2000; Sims et al., 2002; Benjannet et al., 2018).
Among the sites that were used for this study, two were not fitted by the quadratic functions for DMY and P uptake (site5 and site6). These sites were located in the same area and were characterized by PM3 values lower than 30 mg kg–1 and TC content greater that 7%. Another contrasting behavior of these soils is that they yielded DMY in the high range at the 3-leaf stage (0.80 Mg ha–1), the 6-leaf stage (1.40 Mg ha–1) and harvest (25 Mg ha–1), which could not be supported by the low PM3 values (Figure 4B). It is possible that Mehlich-3 and Oxalate ammonium extracting solutions are not adapted for these soils with high organic matter content. It is also possible that the high organic matter content contributes to P supply to plants through mineralization throughout the growing season. Two other sites were also not fitted by the quadratic function for PM3 vs. P uptake (site4 and site7). The sites were located in the same area and were characterized by PM3 values of 155 mg kg–1 for site4 and 90 mg kg–1 for site7. Even though the sites had high and very high soil test P, DMY at the 3-leaf stage (Figure 2B) as well as P uptake at the 3-leaf stage (Figure 5B) and harvest (Figures 7A,B) were in the low range. These two sites were located on poorly-drained soils, and their reactive Al were much higher than the other sites, indicating a higher P fixation capacity as shown by their DPS and PSI, which are aggregated among sites with PM3 in the low range (Figures 9C–F). Additional sites with similar characteristics will be needed to derive a recommendation for starter P that is different from what is suggested in this study.
Agronomic and Environmental Implications for Soils With High Legacy P
The site-year dependence of young corn plant growth and the linear-plus-plateau response model to starter P fertilization have implications for P fertilizer recommendations for silage corn production in BC. As noted in sections above, fertilization management for silage corn in coastal BC includes dairy manure (liquid or solid) spreading at rates 30 to 50 Mg ha–1, usually in the spring just before moldboard plowing (British Columbia Ministry of Agriculture [BCMA], 2010). Phosphorus supplied by manure applications ranges from approximately 30 to 50 kg P ha–1. In addition, starter fertilizer including P at rates 30 to 40 kg P ha–1 is banded 5 cm to the side and 5 cm below the corn row with the planter. Therefore, the total annual P input in most fields ranged between 60 and 90 kg P ha–1 for a crop that takes up approximately 35 kg P ha–1. The excess P, on average 40 kg P ha–1 every year, accumulates in the soil and contributes to increasing the legacy soil P. Our results demonstrate that P fertilizer recommendations for silage corn can be refined by decreasing starter P rates to 5.0 to 7.5 kg P ha–1 without decreasing DMY at harvest. This result provides opportunities for the fertilizer industry in BC to prepare new starter fertilizer blends for silage corn production to address annual variations observed with soil temperatures early in the growing season (Figures 1A,B). These starter P rates will represent a cut of more than 75% of annual P input and could have a positive incidence on farmers’ production costs and the dairy industry as a whole while protecting the environment. In southern BC, dairy farmers grow silage corn for five consecutive years followed by another five consecutive years of forage grass. It is crucial to understand whether annual applications of critical starter P rates are necessary and how they affect the growth of young silage corn plants in these types of rotation systems. Future studies are therefore needed to test the stability of annual applications of critical starter P rates during the silage corn phase. This knowledge will be useful to provide recommendations specifically tailored for dairy farmers and will contribute to better managing legacy soil P in silage corn and forage grass rotation systems in southern BC.
So far, most private laboratories in coastal BC use the Kelowna or modified Kelowna methods to assess the status of soil test P for P fertilizer recommendations. Our results show that the Mehlich-3 method, which is widely used in acidic to near-neutral soils in North America including Canada, can be used on the soils of coastal BC. Use of the Mehlich-3 method offers the opportunity to assess other cations such as Al and Fe and therefore make it possible to adapt a PSI for BC soils (Khiari et al., 2000; Sims et al., 2002; Benjannet et al., 2018). We showed that PM3, DPS and PSI were all closely related to silage corn DMY and P uptake across 11 soils with a wide range of soil test P levels. Finally, future works including additional soils with contrasting properties will be needed to identify environmental P risk classes at the scale of coastal BC, Canada.
Conclusion
Silage corn DMY was affected by starter P fertilizer at the 6-leaf stage in one out of two seasons, and this response coincided with 13 consecutive days of low soil temperatures. Our results show that the response of DMY to starter P is described by a linear-plus-plateau model with critical starter P rate at 5.0 and 7.5 kg P ha–1. Our results also show that in 4 out of the 11 study sites, there was a trend of high DMY at harvest with treatment combinations comprising low starter P rates and high side-dressed manure P additions at the 6-leaf stage. Thus, the effect of starter P fertilizer observed at early growth stages was not carryover through harvest. It appears that when high amounts of P fertilizers are banded as starter P (30 to 40 kg P ha–1) to promote the growth of young corn plants early in the season when soil temperatures are still low, part of this P is fixed and therefore is not readily available for corn P uptake later in the growing season. This fixed P contributes to increased legacy soil P and the risk of P losses to water sources. Our results also highlighted the fact that PM3, DPS and PSI are highly correlated with silage corn DMY and P uptake and therefore indicate that PSI as a proxy of DPS can be adapted for coastal BC soils as an indicator of the risk of P losses.
Data Availability Statement
The datasets generated for this study are available on request to the corresponding author.
Author Contributions
AM conceived the idea and wrote the manuscript. CB and AM designed the methodology and planned all the field activities on the 11 sites, and analyzed the data and prepared the graphs and tables. CL, SK, YL, SY, CB, and AM established the experiments, applied the treatments of starter P and manure P, maintained all the sites, collected all the soil and plant samples and performed all the laboratory analyses, and contributed to the study and gave final approval for the manuscript.
Funding
AM thanks Agriculture and Agri-Food Canada for funding this work through an A-Base program (Project ID: J-002266 - Solutions for carryover of legacy P in the Fraser Valley and Hullcar Valley).
Conflict of Interest
The authors declare that the research was conducted in the absence of any commercial or financial relationships that could be construed as a potential conflict of interest.
Acknowledgments
We thank Duncan Reid from Terralink, Inc. for his help in finding dairy farmers in Agassiz and Rosedale who agreed to share their land for this research. We thank Jessica Stoeckli and Deen Babuin from the Agassiz RDC research support unit for their assistance with analyses using ICP.
References
Arriola, K. G., Kim, S. C., Huisden, C. M., and Adesogan, A. T. (2012). Stay-green ranking and maturity of corn hybrids: 1. Effects on dry matter yield, nutritional value, fermentation characteristics, and aerobic stability of silage hybrids in Florida. J. Dairy Sci. 95, 964–974. doi: 10.3168/jds.2011-4524
Benjannet, R., Khiari, L., Nyiraneza, J., Thompson, B., He, J., Geng, X., et al. (2018). Identifying environmental phosphorus risk classes at the scale of Prince Edward Island, Canada. Can. J. Soil Sci. 98, 317–329. doi: 10.1139/cjss-2017-0076
Bittman, S., Kowalenko, G. C., Hunt, D. E., Forge, T. A., and Wu, X. (2006). Starter phosphorus and broadcast nutrients on corn with contrasting colonization by mycorrhizae. Agron. J. 98, 394–401. doi: 10.2134/agronj2005.0093
Bittman, S., Sheppard, S. C., Poon, D., and Hunt, D. E. (2017). Phosphorus flows in a peri-urban region with intensive food production: a case study. J. Environ. Manag. 187, 286–297. doi: 10.1016/j.jenvman.2016.11.040
Bordoli, J. M., and Mallarino, A. P. (1998). Deep and shallow banding of phosphorus and potassium as alternatives to broadcast fertilization for no-till corn. Agron. J. 90, 27–33. doi: 10.2134/agronj1998.00021962009000010006x
Breeuwsma, A., and Silva, S. (1992). Phosphorus Fertilization And Environmental Effects in the Netherlands and the Po Region (Italy). Report No. 57. Wageningen: DLO The Winand Staring Centre.
British Columbia Ministry of Agriculture [BCMA] (2010). Nutrient Management Reference Guide, eds D. Schmidt and O. Poon (Columbia: BCMA).
British Columbia Ministry of Environment (2006). Water Quality, Water Management Branch Ministry of Environment. Victoria: British Columbia Ministry of Environment.
Cerrato, M. E., and Blackmer, A. M. (1990). Comparison of models for describing; corn yield response to nitrogen fertilizer. Agron. J. 82, 138–143. doi: 10.2134/agronj1990.00021962008200010030x
Ferreira, G., and Teets, C. L. (2017). Effect of planting density on yield, nutritional quality, and ruminal in vitro digestibility of corn for silage grown under on-farm conditions. PAS 33, 420–425. doi: 10.15232/pas.2017-01621
Hendershot, W. H., Lalande, H., and Duquette, M. (1993). “Ion exchange and exchangeable cations, in Soil Sampling and Methods of Analysis eds. M. R. Carter and E. G. Gregorich (Boca Raton, FL: Lewis Publishers), 183–205.
Jokela, W. E. (1992). Effect of starter fertilizer on corn silage yields on medium and high fertility soils. J. Prod. Agric. 5, 233–237.
Khiari, L., Parent, L. E., Pellerin, A., Alimi, A. R. A., Tremblay, C., Simard, R. R., et al. (2000). An agri-environmental phosphorus saturation index for acid coarse-textured soils. J. Environ. Qual. 29, 1561–1567. doi: 10.2134/jeq2000.00472425002900050024x
Kowalenko, C. G. (2005). Binding of inorganic sulphate and phosphate in humid-climate soils measured using column leaching, equilibration and extraction methods. Can. J. Soil Sci. 85, 599–610. doi: 10.4141/s04-068
Kowalenko, C. G., and Babuin, D. (2014). Use of lithium metaborate to determine total phosphorus and other element concentrations in soil, plant, and related materials. Commun. Soil Sci. Plant Anal. 45, 15–28. doi: 10.1080/00103624.2013.848884
Kowalenko, G. C., Schmidt, O., Kenney, E., Neilsen, D., and Poon, D. (2007). Okanagan Agricultural Soil Study 2007. A Survey Of The Chemical And Physical Properties Of Agricultural Soils Of The Okanagan And Similkameen Valleys In Relation To Agronomic And Environmental Concerns. Available online at: https://www2.gov.bc.ca/assets/gov/farming-natural-resources-and-industry/agriculture-and-seafood/agricultural-land-and-environment/environmental-farm-planning/okanagan_soil_study_report_2007.pdf (accessed December 20, 2019).
Malhi, S. S., Zentner, R. P., and Heier, K. (2001). Banding increases effectiveness of fertilizer P for alfalfa production. Nutr. Cyc. Agroecosys. 59, 1–11.
Mallarino, A. P., Bordoli, J. M., and Borges, R. (1999). Phosphorus and potassium placement effects on early growth and nutrient uptake of No-Till corn and relationships with grain yield. Agron. J. 91, 37–45. doi: 10.2134/agronj1999.00021962009100010007x
Mehlich, A. (1984). Mehlich 3 soil test extractant: a modification of Mehlich 2 extractant. Commun. Soil Sci. Plant Anal. 15, 1409–1416. doi: 10.1080/00103628409367568
Messiga, A. J., Ziadi, N., Bélanger, G., and Morel, C. (2013). Soil nutrients and other major properties in grassland fertilized with nitrogen and phosphorus. Soil Sci. Soc. Am. J. 77, 643–652. doi: 10.2136/sssaj2012.0178
Pellerin, A., Parent, L. -É, Fortin, J., Tremblay, C., Khiari, L., and Giroux, M. (2006). Environmental Mehlich-III soil phosphorus saturation indices for Quebec acid to near neutral mineral soils varying in texture and genesis. Can. J. Soil Sci. 86, 711–723. doi: 10.4141/s05-070
Preston, C. L., Ruiz Diaz, D. A., and Mengel, D. B. (2019). Corn response to long-term phosphorus fertilizer application rate and placement with strip-tillage. Agron. J. 111, 841–850. doi: 10.2134/agronj2017.07.0422
Randall, G. W., and Hoeft, R. G. (1988). Placement methods for improved efficiency of P and K fertilizers: a review. J. Prod. Agric. 1, 70–78.
Renneson, M., Van denberghe, C. J., Dufey, J. M., Marcoen, L. B., and Colinet, G. (2015). Degree of phosphorus saturation in agricultural loamy soils with a near-neutral pH. Eur. J. Soil Sci. 66, 33–41. doi: 10.1111/ejss.12207
Ross, G. J., and Wang, C. (1993). “Extractable Al, Fe, Mn, and Si,” in Soil Sampling and Methods Of Analysis, 1st Edn, ed. M. R. Carter (Boca Raton, FL: Lewis Publishers).
SAS Institute (2010). SAS User’s Guide: Statistics, Version 9, 3rd Edn. Cary, NC: SAS Institute Inc.
Sims, J. T., Maguire, R. O., Leytem, A. B., Gartley, K. L., and Pautler, M. C. (2002). Evaluation of Mehlich-3 as an agri-environmental soil phosphorus test for the Mid-Atlantic United States of America. Soil Sci. Soc. Am. J. 66, 2016–2032. doi: 10.2136/sssaj2002.2016
van Bochove, E., Theriault, G., Denault, J., Dechmi, F., Allaire, S. E., and Rousseau, A. N. (2012). Risk of phosphorus desorption from canadian agricultural land: 25-year temporal trend. J. Environ. Qual. 41, 1402–1412. doi: 10.2134/jeq2011.0307
Vetsch, J. A., and Randall, G. W. (2002). Corn production as affected by tillage system and starter fertilizer. Agron. J. 94, 532–540. doi: 10.2134/agronj2002.5320
Wolkowski, R. P. (2000). Row-placed fertilizer for maize grown with an in-row crop residue management system in southern Wisconsin. Soil Tillage Res. 54, 55–62. doi: 10.1016/s0167-1987(99)00114-2
Keywords: starter P fertilizer, manure P, silage corn yield, 3- and 6-leaf stage, legacy soil P, P saturation index
Citation: Messiga AJ, Lam C, Li Y, Kidd S, Yu S and Bineng C (2020) Combined Starter Phosphorus and Manure Applications on Silage Corn Yield and Phosphorus Uptake in Southern BC. Front. Earth Sci. 8:88. doi: 10.3389/feart.2020.00088
Received: 13 January 2020; Accepted: 13 March 2020;
Published: 07 April 2020.
Edited by:
Paulo Sergio Pavinato, University of São Paulo, BrazilReviewed by:
Sudipta Rakshit, Tennessee State University, United StatesGonzalo Ferreira, Virginia Tech, United States
Copyright © 2020 Her Majesty the Queen in right of Canada. This is an open-access article distributed under the terms of the Creative Commons Attribution License (CC BY). The use, distribution or reproduction in other forums is permitted, provided the original author(s) and the copyright owner(s) are credited and that the original publication in this journal is cited, in accordance with accepted academic practice. No use, distribution or reproduction is permitted which does not comply with these terms.
*Correspondence: Aimé J. Messiga, YWltZS5tZXNzaWdhQGNhbmFkYS5jYQ==