 Zhongming He
 Da Xiang
 Yaxin Liu1
94% of researchers rate our articles as excellent or good
Learn more about the work of our research integrity team to safeguard the quality of each article we publish.
Find out more
ORIGINAL RESEARCH article
Front. Earth Sci. , 10 March 2020
Sec. Earth and Planetary Materials
Volume 8 - 2020 | https://doi.org/10.3389/feart.2020.00062
This article is part of the Research Topic Hydro-Mechanical Coupling and Creep Behaviours of Geomaterials View all 30 articles
In order to study the creep characteristics of the coarse-grained soil as embankment filler under long-term vehicle loading, the creep test was performed on coarse-grained soil using the large scale dynamic and static triaxial instruments, and the creep process of the coarse-grained soil sample was simulated by PFC3D software, and the internal particle motion and energy change during the deformation process were studied. The research results show that the coarse-grained soil embankment filler has non-linear creep characteristics. At a low stress level, the coarse-grained soil is in the stage of elastic deformation. At a high stress level, the final creep deformation curve of the coarse-grained soil does not converge. The creep process is a process in which the particles are distorted and rotated, changing from an unstable state to a stable state. During this process, the particle energy is dissipated to the minimum, and the creep of the sample reaches a stable state. This understanding of particle motion and energy changes during the triaxial creep test of coarse-grained soil will help deepen the understanding of creep characteristics of coarse-grained soil and provide a reference for engineering practice.
Central China, as the core of the Silk Road Economic Belt and the 21st-Century Maritime Silk Road and a key area for targeted poverty alleviation policies, road construction work in this region is in full swing (Wilson, 2016), It is inevitable to pass through mountainous areas. Due to the requirements of planning and design, road construction often needs to be filled to a large extent (JTG D30-2015, 2015). Coarse-grained soil (it refers to the soil in which the grains between 0.075 and 60 mm accounting for more than 50% of its total mass) is widely distributed in China and is easy to be obtained. Because of the wide range of its gradation, it has large porosity, strong permeability. After compaction, it has excellent engineering characteristics such as high compaction degree and high shear strength, so it is often used as embankment filling material during highway construction (Hu et al., 2018). The embankment as the highway foundation not only bears the weight of the pavement structure, but also bears the dynamic load transmitted by the pavement during the driving of the vehicle. The stability and deformation of the embankment directly affect the service performance of the road.
With the rapid development of the expressway, many scholars have conducted a series of studies on coarse-grained soil. For example, Guo (1999), Zhou et al. (2016), and Long et al. (2017) analyzed the mechanical properties and constitutive model of coarse-grained soil, but at present, there are few in-depth studies on the creep characteristics of coarse-grained soil. Cai et al. (2019) and Peng et al. (2019) reveled the influence of confining pressures on deformation characteristics of sandstones and the effects of different densities, gradation types, and loading schemes on the creep characteristics of saturated sand. Yang et al. (2014) studied the creep deformation characteristics of sand under the piles of high-speed railway bridges by conducting creep tests on sands under the piles, and obtained creep models and corresponding parameters. Hu et al. (2014) and Sun et al. (2017) took the undisturbed soil at the landslide zone as the research object, performed large scale triaxial creep test, studied the creep sample under different confining pressures and stress levels, and combined the isochronous curve method to obtain the difference between conventional strength and long-term strength. Liu et al. (2015) used a triaxial creep tester to study the creep difference of marine soft soil under static and low-frequency cyclic loading, and comparatively analyzed the effects of frequency, confining pressure and principal stress on creep characteristics of soft soil. Yuan et al. (2014) tested seven groups of feldspar, quartz and organic soil samples with different distribution forms and different contents by using a direct shear creep instrument, and discussed the influence of distribution forms and contents of rheological materials on creep. Kang et al. (2012) examined the evolution of pore characteristics in dense and loose samples subjected to a biaxial creep test by using discrete element method (DEM) numerical simulations. Tang et al. (2019) investigated the creep behaviors of granite residual soil with pre-stress of 100 kPa by a series of small size creep tests, and established a creep model of the granite residual by rheological theory. Zhao et al. (2017, 2018, 2019) captured elastoviscoplastic strain components by implementing a series of triaxial creep tests on fractured limestone specimens under multilevel loading and unloading cycles. And a non-linear elastoviscoplastic (EVP) creep constitutive model which can describe both the loading and unloading creep behavior precisely was proposed. Moreover, plenty of previous study focus on the application of discrete element software PFC3D on creep behavior. For example, Kwok and Bolton (2013) applied the DEM to the simulation of soil creep in a triaxial test. It was found that crack growth can lead to softening of samples with volumetric contraction due to grain breakage accompanying dilation due to shearing. Zhou and Song (2016) proposed a random virtual crack DEM model or creep behavior of rockfill in PFC2D according to the theory of subcritical crack propagation induced by stress corrosion mechanisms. They found that the increase in stress levels and particle size will lead to an obvious growth of the creep strain and creep rate of the rockfill.
The above research shows that the current research on the influence factors of creep is mostly about soft soil and rocks, while the research on coarse-grained soil is less, and the present research results mostly analyze the creep characteristics from a macro perspective, and there are some limitations to the understanding of the creep mechanism, which can not explain the internal structure change of coarse-grained soil during creep. Therefore, it is necessary to study the creep mechanism of coarse-grained soil from both the macroscopic and mesoscopic perspectives.
This test uses the Autotriax automatic triaxial test system in the National Engineering Laboratory of China of Highway Maintenance Technology of Changsha University of Science and Technology, the model of the system is Dynatriax100/14 (see Figure 1). The triaxial test system is mainly consists of microcomputer system that control all test stages, pressure chamber, confining pressure application system, axial pressure device, and measurement system.
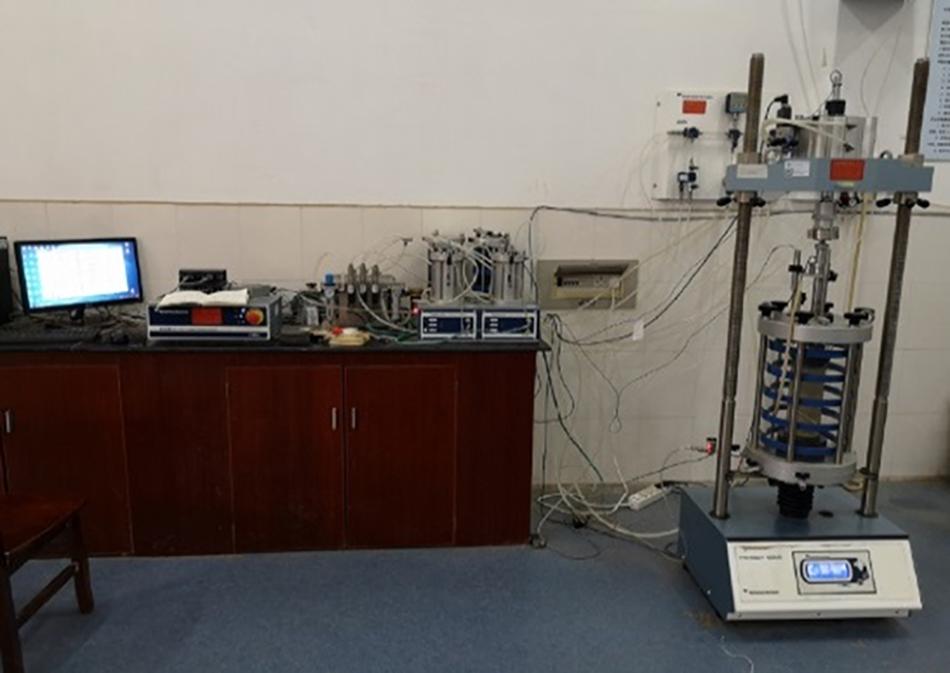
Figure 1. Autotriax automatic triaxial test system.
The soil for the samples was taken from the slope construction of the carbonaceous mudstone coarse-grained soil in the fifth section of an expressway in Guangxi Province, China. The samples before and after disintegration are shown in Figure 2.
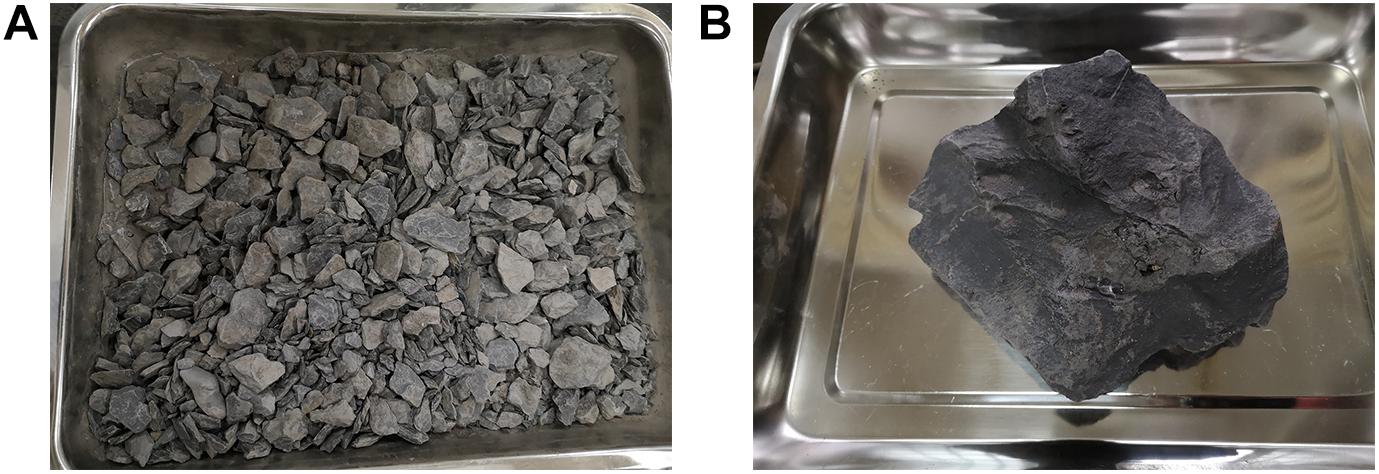
Figure 2. Physical form of samples after and before disintegration: (A) After disintegration, (B) Before disintegration.
The disintegrated samples were taken for road performance tests such as compaction and CBR test. The basic physical and mechanical parameters of the carbonaceous mudstone coarse-grained soil were obtained, they are shown in Table 1.
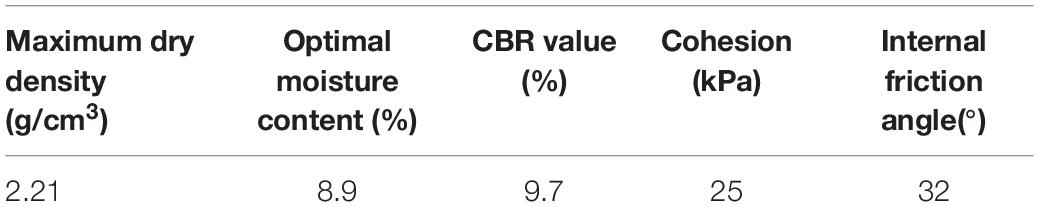
Table 1. Basic physical and mechanical parameters of coarse-grained soil.
This test uses a solid cylindrical sample with a diameter of 100 mm and a height of 200 mm. Different preparation methods of the sample will result to a significant impact on the test, so this test uses the layer compaction method for sample preparation, and the compaction degree is 93% to control the quality of each layer of compacted soil. In order to determine the value of the deviatoric stress in the creep test, the same soil sample is used for isotropically consolidation at a preset confining pressure, and an axial load is applied to obtain the failure load (σ1−σ3)f at the preset confining pressure; And it uses a graded loading method, which is divided into four stress levels (n = 4) for creep test loading, and the load increment of each stage is (σ1−σ3)f/n. It should be confirmed that the previous stage has reached the stable state of creep before the lower stage loading; In order to consider the influences of stress level, moisture content and confining pressure on the creep characteristics of coarse-grained soil, five groups of tests are selected for comparative analysis. Each group of tests lasts about 10 days, and the entire test lasts 6 months. The creep test scheme is shown in Table 2. Where, the stress level S is the ratio of the principal stress difference under load in the creep test and the principal stress difference at failure in the triaxial test, and it can be calculated from Eq. 1. The stress levels under axial load in the creep test are 0.1, 0.4, 0.6, and 0.8.
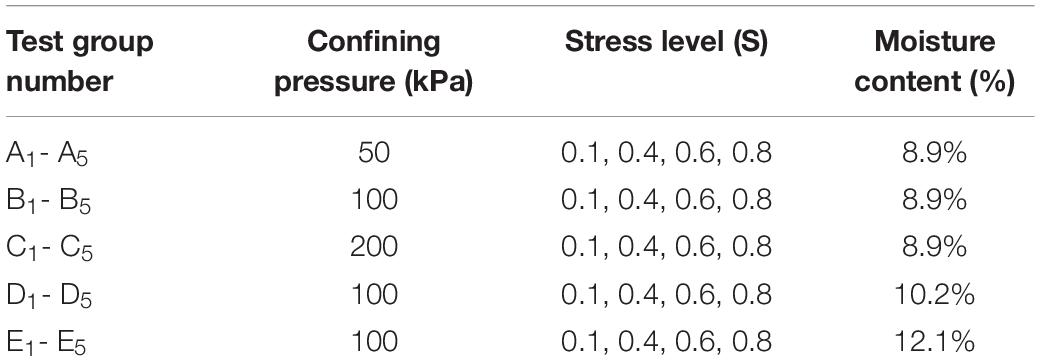
Table 2. Test scheme.
Where, c is the cohesion of the soil and φ is the internal friction angle.
The model boundary in this paper consists of side walls and upper and lower loading plates. Through the trial run of the program, it was found that loading the test sample with the clump loading board is better than using the servo control loading simulation of wall. Therefore, the method of directly applying stress to the clump loading plate for creep test simulation was used to establish a model with the same size as the creep test sample, with a height of 200 mm and a diameter of 100 mm. During the establishment of the model, the lateral rigid wall of the traditional triaxial test model was transformed into a flexible particle film composed of particles of the same size, and the film particles were bonded through the contact bonding model to ensure the particle only transmit force but not moment. By applying an equivalent concentration force to the film particles to simulate the confining pressure, the generated model test sample is shown in Figure 3.
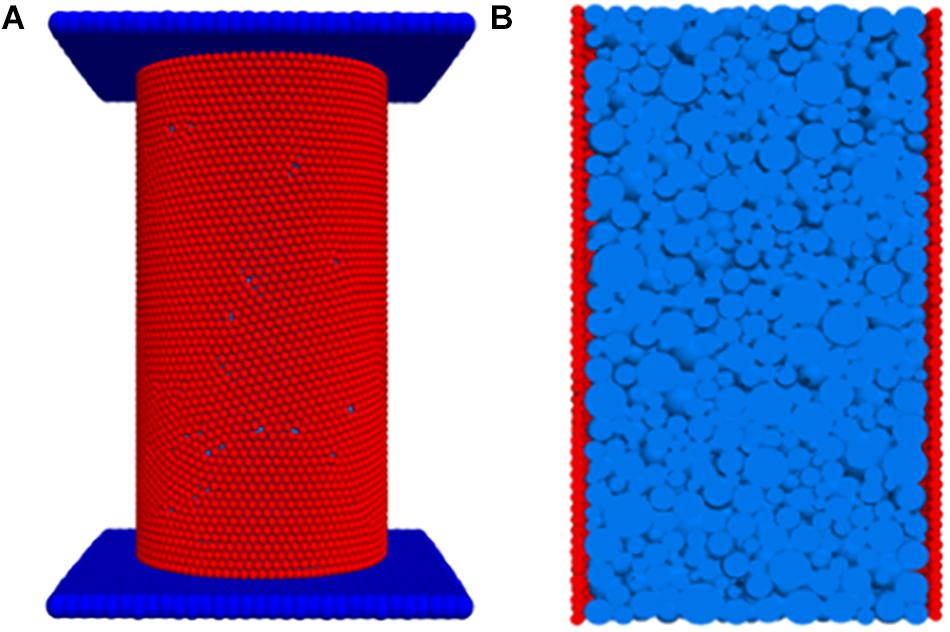
Figure 3. Sample of triaxial test simulation: (A) Overall picture, (B) Schematic diagram of flexible particle film.
This article used dynamic expansion method for particles generation. When the particles are generated according to the actual grading, the number of particles generated will reach millions, which seriously affects the model calculation efficiency, on the other hand the computer’s memory cannot achieve the calculation of millions of particles. Therefore, according to the research results of Zhang (2015), the weighted average method was used to modify the particle group that smaller than 1 mm, and the particles after each level of correction were generated under the same porosity. Through simulation calculations, it was found that using this method can not only effectively increase the operation speed, but also inherit the meso-structure characteristics of the original sample with prominent local heterogeneity. The weighted average radius of the particles was calculated to be 2.879 mm by using Eq. 2, and Equation (2) is as follows:
Weighted average particle radius:
Where, Ri is the average radius of particles; Mi is particle content; Wi is the weighted number.
When particle generation is performed according to the minimum radius and the ratio of the maximum radius to the minimum radius in DEM, according to the Random command, the generation probability of the particle radius from the smallest to the largest is the same. So, the minimum radius of the particles was fixed by the weighted average radius of the particles, and then the maximum radius of the particles was calculated, and the ratio of the maximum radius to the minimum radius was obtained, as shown in Eq. 3:
Where, Ri is the particle radius; Rmin is the minimum radius of the particle, ratioRmax/min is the ratio of the maximum radius to the minimum radius of the particle, and Wj is the weighted number. From the calculation of Wr, we can calculate the value of ratioRmax/min. According to the Eq. 3, in the model generation in this paper, the minimum radius was fixed to 0.5 mm and the ratio of the maximum radius to the minimum radius of the particles was 39.712.
As far as the present research is concerned, the mesoscopic parameters in the numerical simulation are obtained through repeated debugging by comparing with the test results or the physical properties of the material. In order to simulate the creep characteristics of coarse-grained soil under different moisture contents, it is necessary to use the variables in the meso-parameters to simulate the changes in the moisture content of the sample. For coarse-grained soil, the actual bonding force between particles will change with the change of moisture content. Therefore, when using PFC3D for simulation, it is necessary to establish the relationship between the bond strength and moisture content of the particles. This paper combined the existing research results and laboratory test data, and used yield stress as an intermediate variable to establish the relationship between moisture content and particle bond strength, and finally got a quantitative relationship between moisture content and bond strength. And the linear contact stiffness model was used. Based on the macro-parameters such as the stress-strain curve and elastic modulus obtained from tests, the mesoscopic parameters were repeatedly adjusted to obtain a set of simulated parameter values that match the laboratory test, as shown in Table 3.
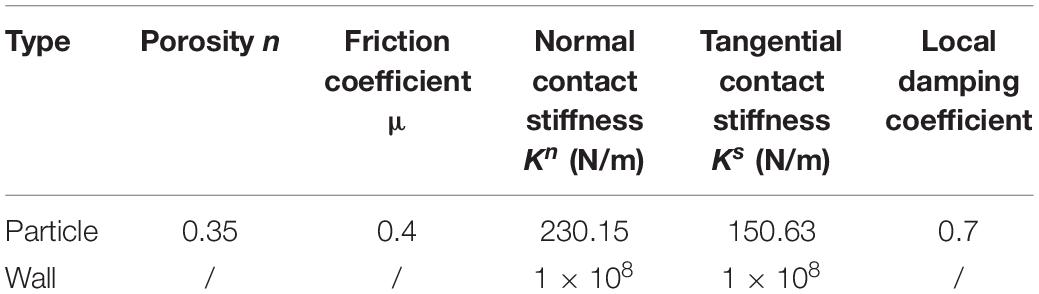
Table 3. Mesoscopic parameters of numerical simulation.
The axial stress-strain test curve was obtained by triaxial test under different confining pressures (50, 100, 200 kPa), same compaction degree (93%) and same moisture content (8.9%), as shown in Figure 4.

Figure 4. Stress-strain curves of coarse-grained soil samples under different confining pressures.
From Figure 4, under the same moisture content and compaction, the greater the confining pressure, the greater the shear strength of the coarse-grained soil filler, and the greater the value of the deviatoric stress required to achieve the same axial strain. The coarse-grained soil sample with a confining pressure of 50 kPa requires a stress difference of 0.8 MPa when the axial strain reaches 14%, while the samples with a confining pressure of 100 and 200 kPa need larger stress differences to achieve the same axis strain. In the initial stage of shearing of the sample, the sample is in the elastic stage, showing softening of the shear strain, and the axial stress-strain curve changes linearly. As the stress difference increases, the sample changes from strain softening to strain hardening, and the axial stress-strain curve changes non-linearly.
Figure 5 shows the bulk strain-axial strain curves of coarse-grained soil samples under different confining pressure. As can be seen from Figure 5, the development law of bulk strain of samples under different confining pressures is as follows: when the confining pressures are 50 and 100 kPa, the samples shear shrink first and then shear dilate; when the confining pressure is 200 kPa, the samples shear shrink as a whole. The main reasons are: when the confining pressure is 50 kPa, the effect of confining pressure is relatively small, the particles are more likely to rotate and move under the action of shear force, and the lateral deformation and axial deformation of the test sample occur simultaneously, manifested as shear shrinkage and then shear dilatancy; When the confining pressure is 200 kPa, it is difficult for the particles to rotate and move during the shearing process, and it is easy for the particles to be broken. The particles are mainly compacted and compressed, supplemented by lateral deformation, which is manifested as overall shear shrinkage.
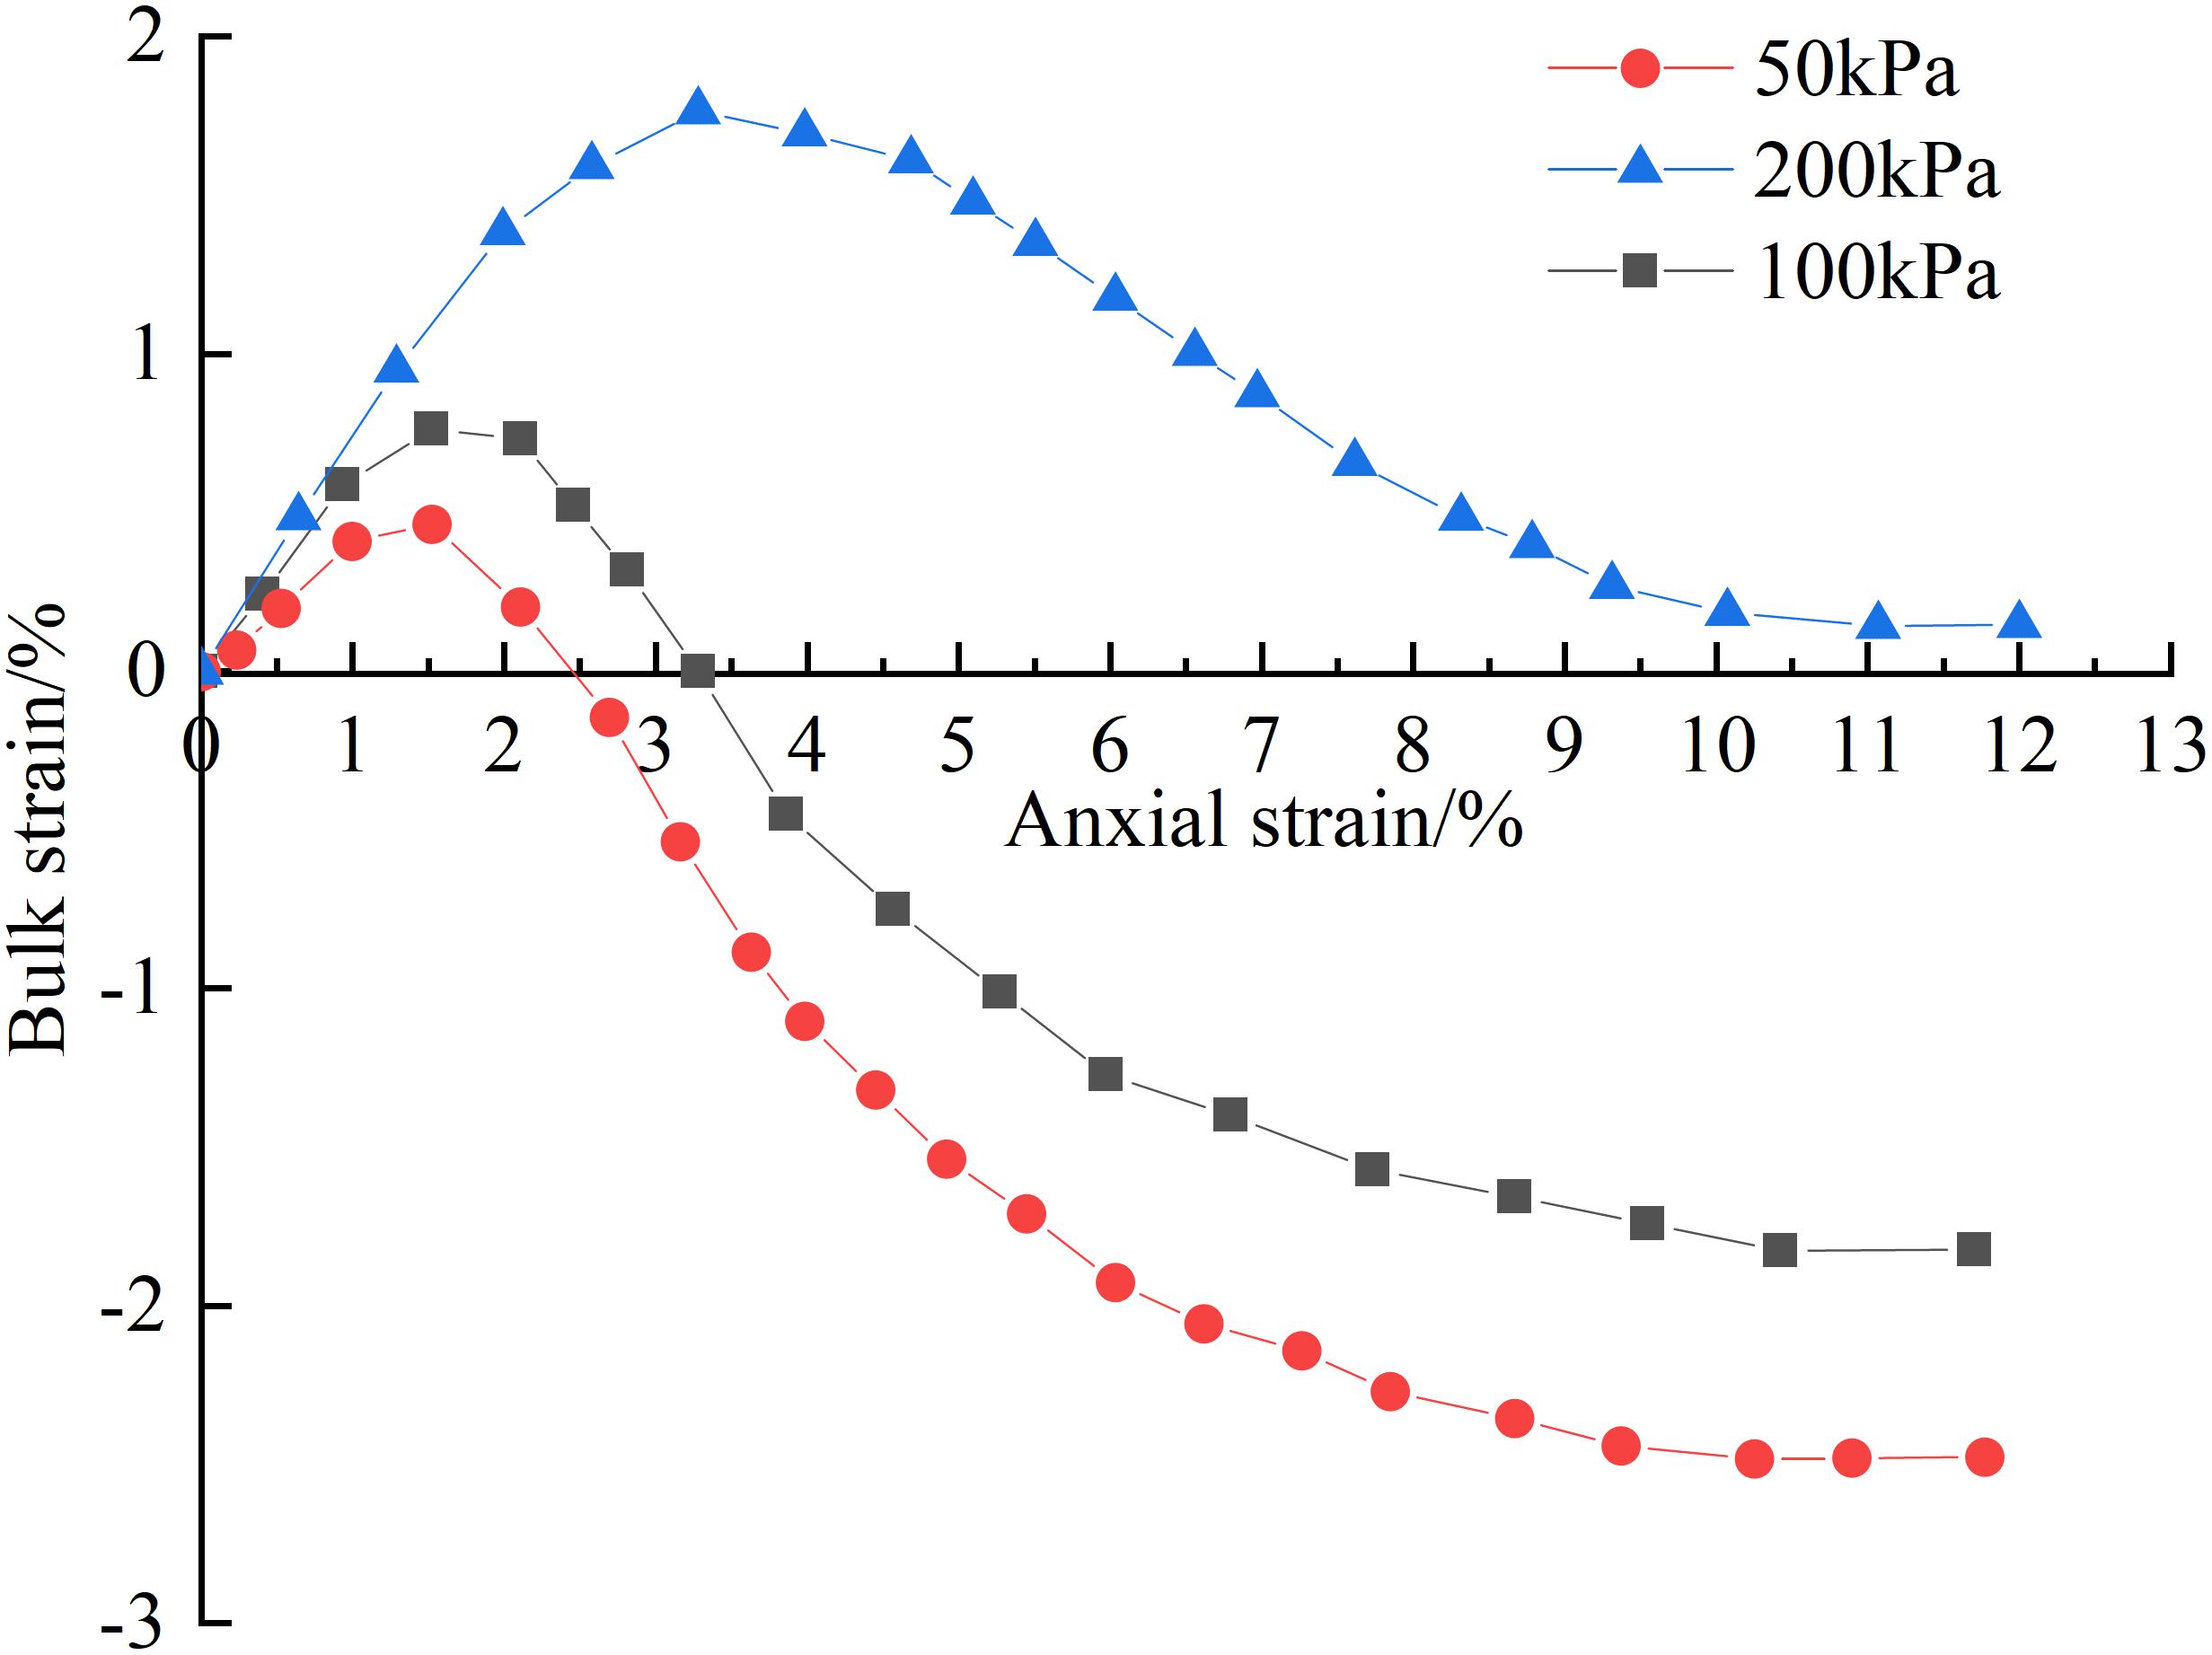
Figure 5. Bulk strain curves of coarse-grained soil samples under different confining pressures.
According to the test scheme, triaxial creep tests were performed under three different confining pressures (50, 100, and 200 kPa) to obtain a series of test data. According to the Boltzmann superposition principle and Chen’s loading characteristics, the creep time history curve under each step during loading was obtained by coordinate translation method. Figure 6 show the deformation curves at different stress levels and at different times.
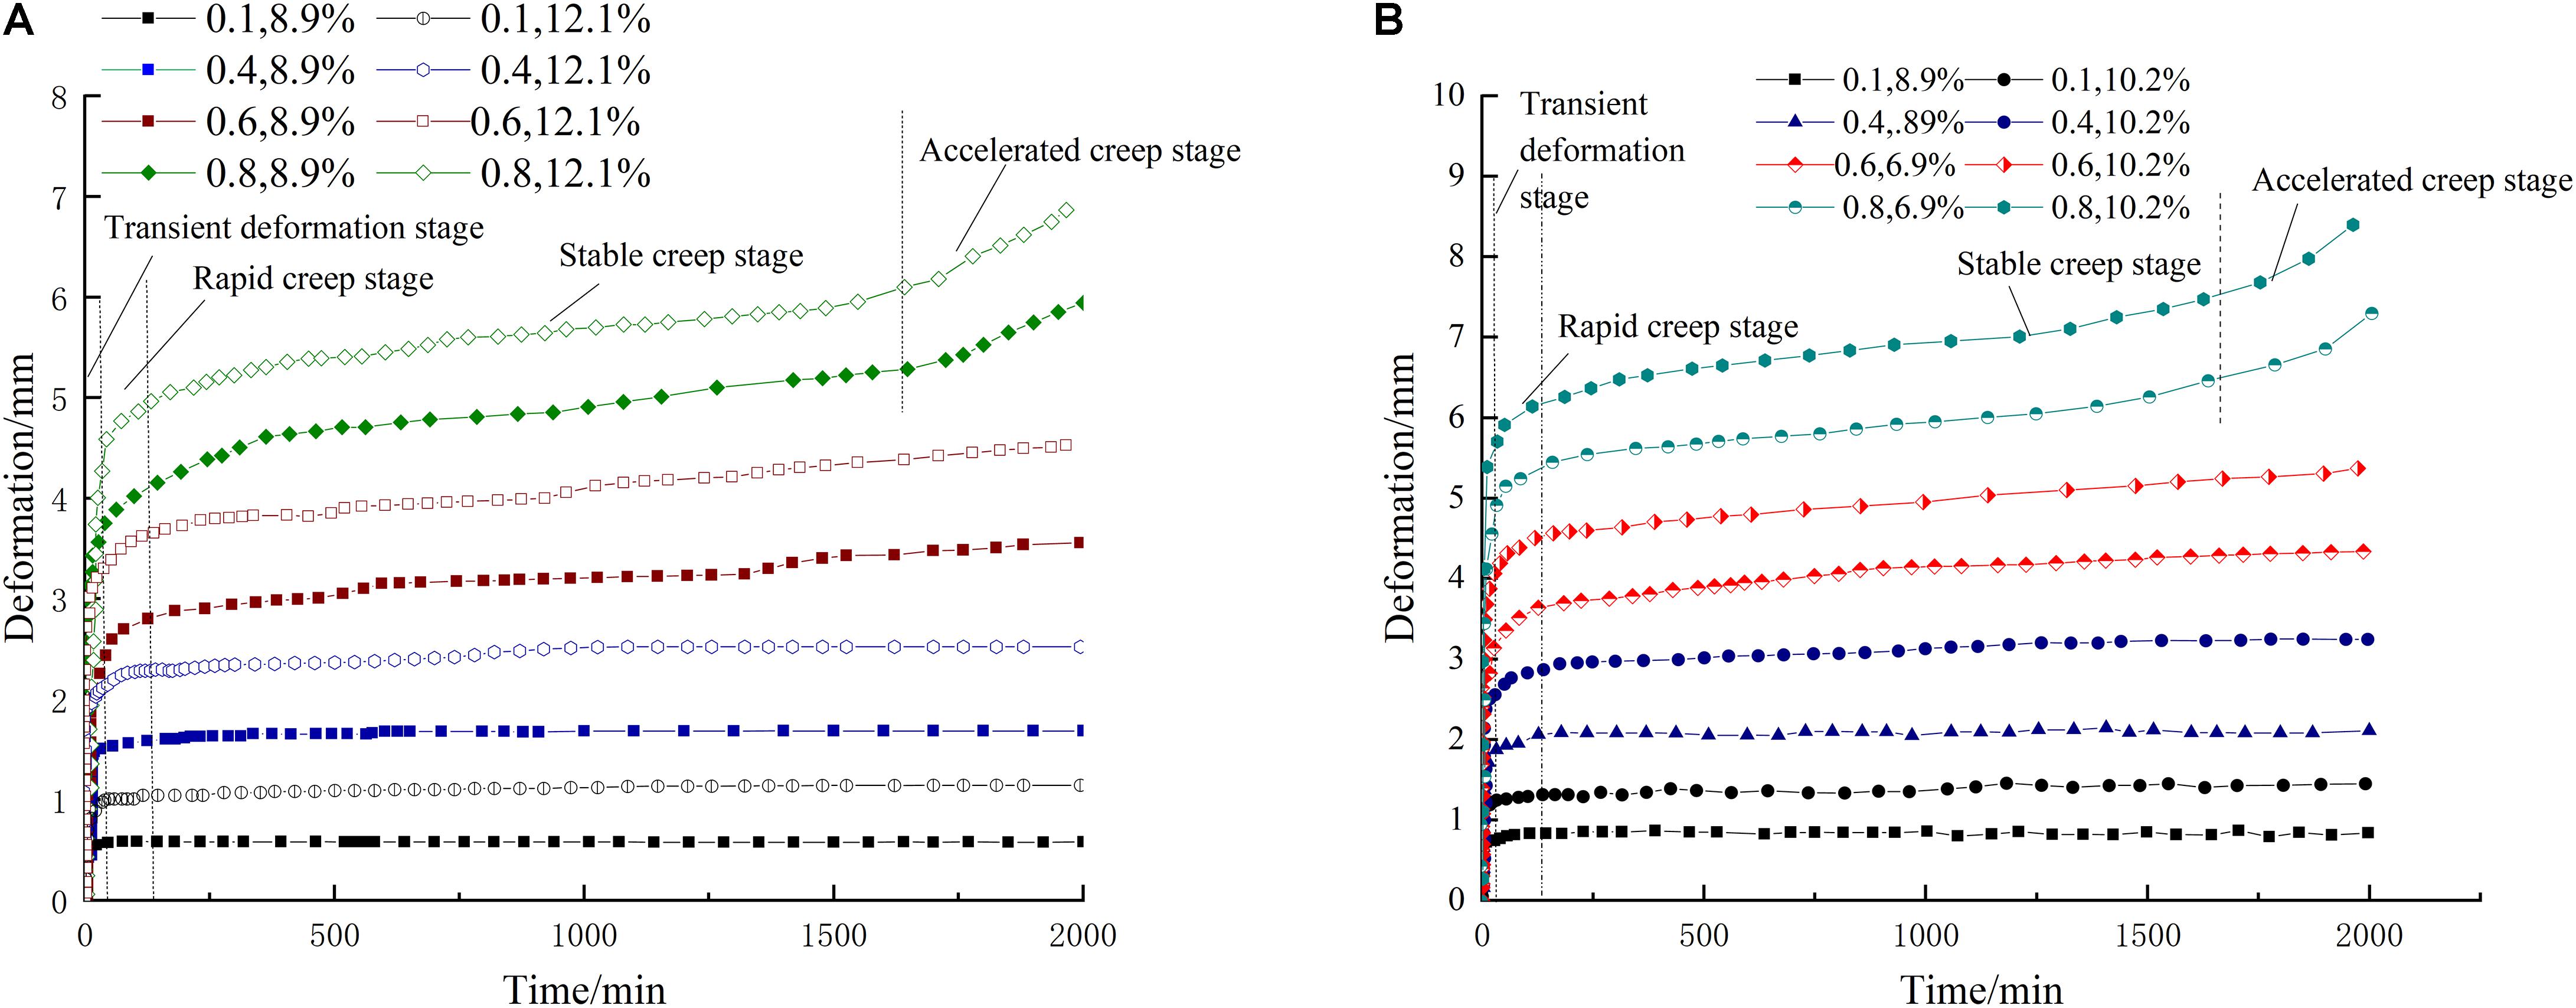
Figure 6. Axial creep curve of coarse-grained soil filler: (A) Confining pressure is 50 kPa, (B) Confining pressure is 200 kPa.
It can be seen from Figure 6 that the stress state is the main factor affecting the creep of the sample, and the lower the stress level, the shorter the time required to reach stability, and the higher the stress level, the longer the time required for creep to reach stability. The curve can be divided into four stages: transient elastic deformation stage, rapid creep stage, stable creep stage and accelerated creep stage. When the stress level is within this range (0.1 ≤ S < 0.4), especially when S is 0.1, confining pressure is 50 kPa and the moisture content is 8.9%, and the corresponding transient elastic deformation is 0.574 mm, accounting for 98% of the total test deformation. The plastic deformation value at this stage is very small and only transient elastic deformation occurs; When the stress level is within this range (0.4 ≤ S < 0.8), the sample enters the rapid creep stage after transient elastic deformation. As the particle pores are filled and compressed, the particle’s motion resistance increases, the creep deformation rate decreases, the creep curve converges, and eventually it becomes flat; When the stress level is within this range (S ≥ 0.8), the sample enters the accelerated creep stage in the later stage of loading, the slope of the creep curve increases, the deformation of the sample increases, and the curve tends to non-converge. As the stress level increases, the earlier the accelerated creep occurs, the sample tends to fail.
Figure 7 is the creep isochronous curve under different stress levels. The isochronous strain curve of each sample has obvious non-linearity. When the stress level is within this range (0.1 ≤ S < 0.4), except for the curve of 60 min, the curves at other periods are more coincident, indicating that when the stress level is small, the creep deformation of coarse-grained soil mainly includes transient elastic deformation and rapid deformation stage, which accounts for 75% ∼ 85% of the total deformation; When the stress level is within this range (0.4 ≤ S < 0.8), the curves in each period do not overlap. After t = 60 min, the sample enters the rapid creep stage. The creep deformation gradually stabilizes with time, and the curves gradually coincide, indicating that the creep deformation of coarse-grained soil samples within this stress level mainly occurs within the first 2 h, and the creep deformation gradually decreases and stabilizes with time. But when stress level S is 0.8, the creep isochronous curves of t = 1500 min and t = 2000 min do not coincide, indicating that the creep of coarse-grained soil samples at this stress level enters the accelerated creep stage in the later stage of test loading, the deformation of coarse-grained soil samples gradually increases, and the creep curve tends to non-converge.
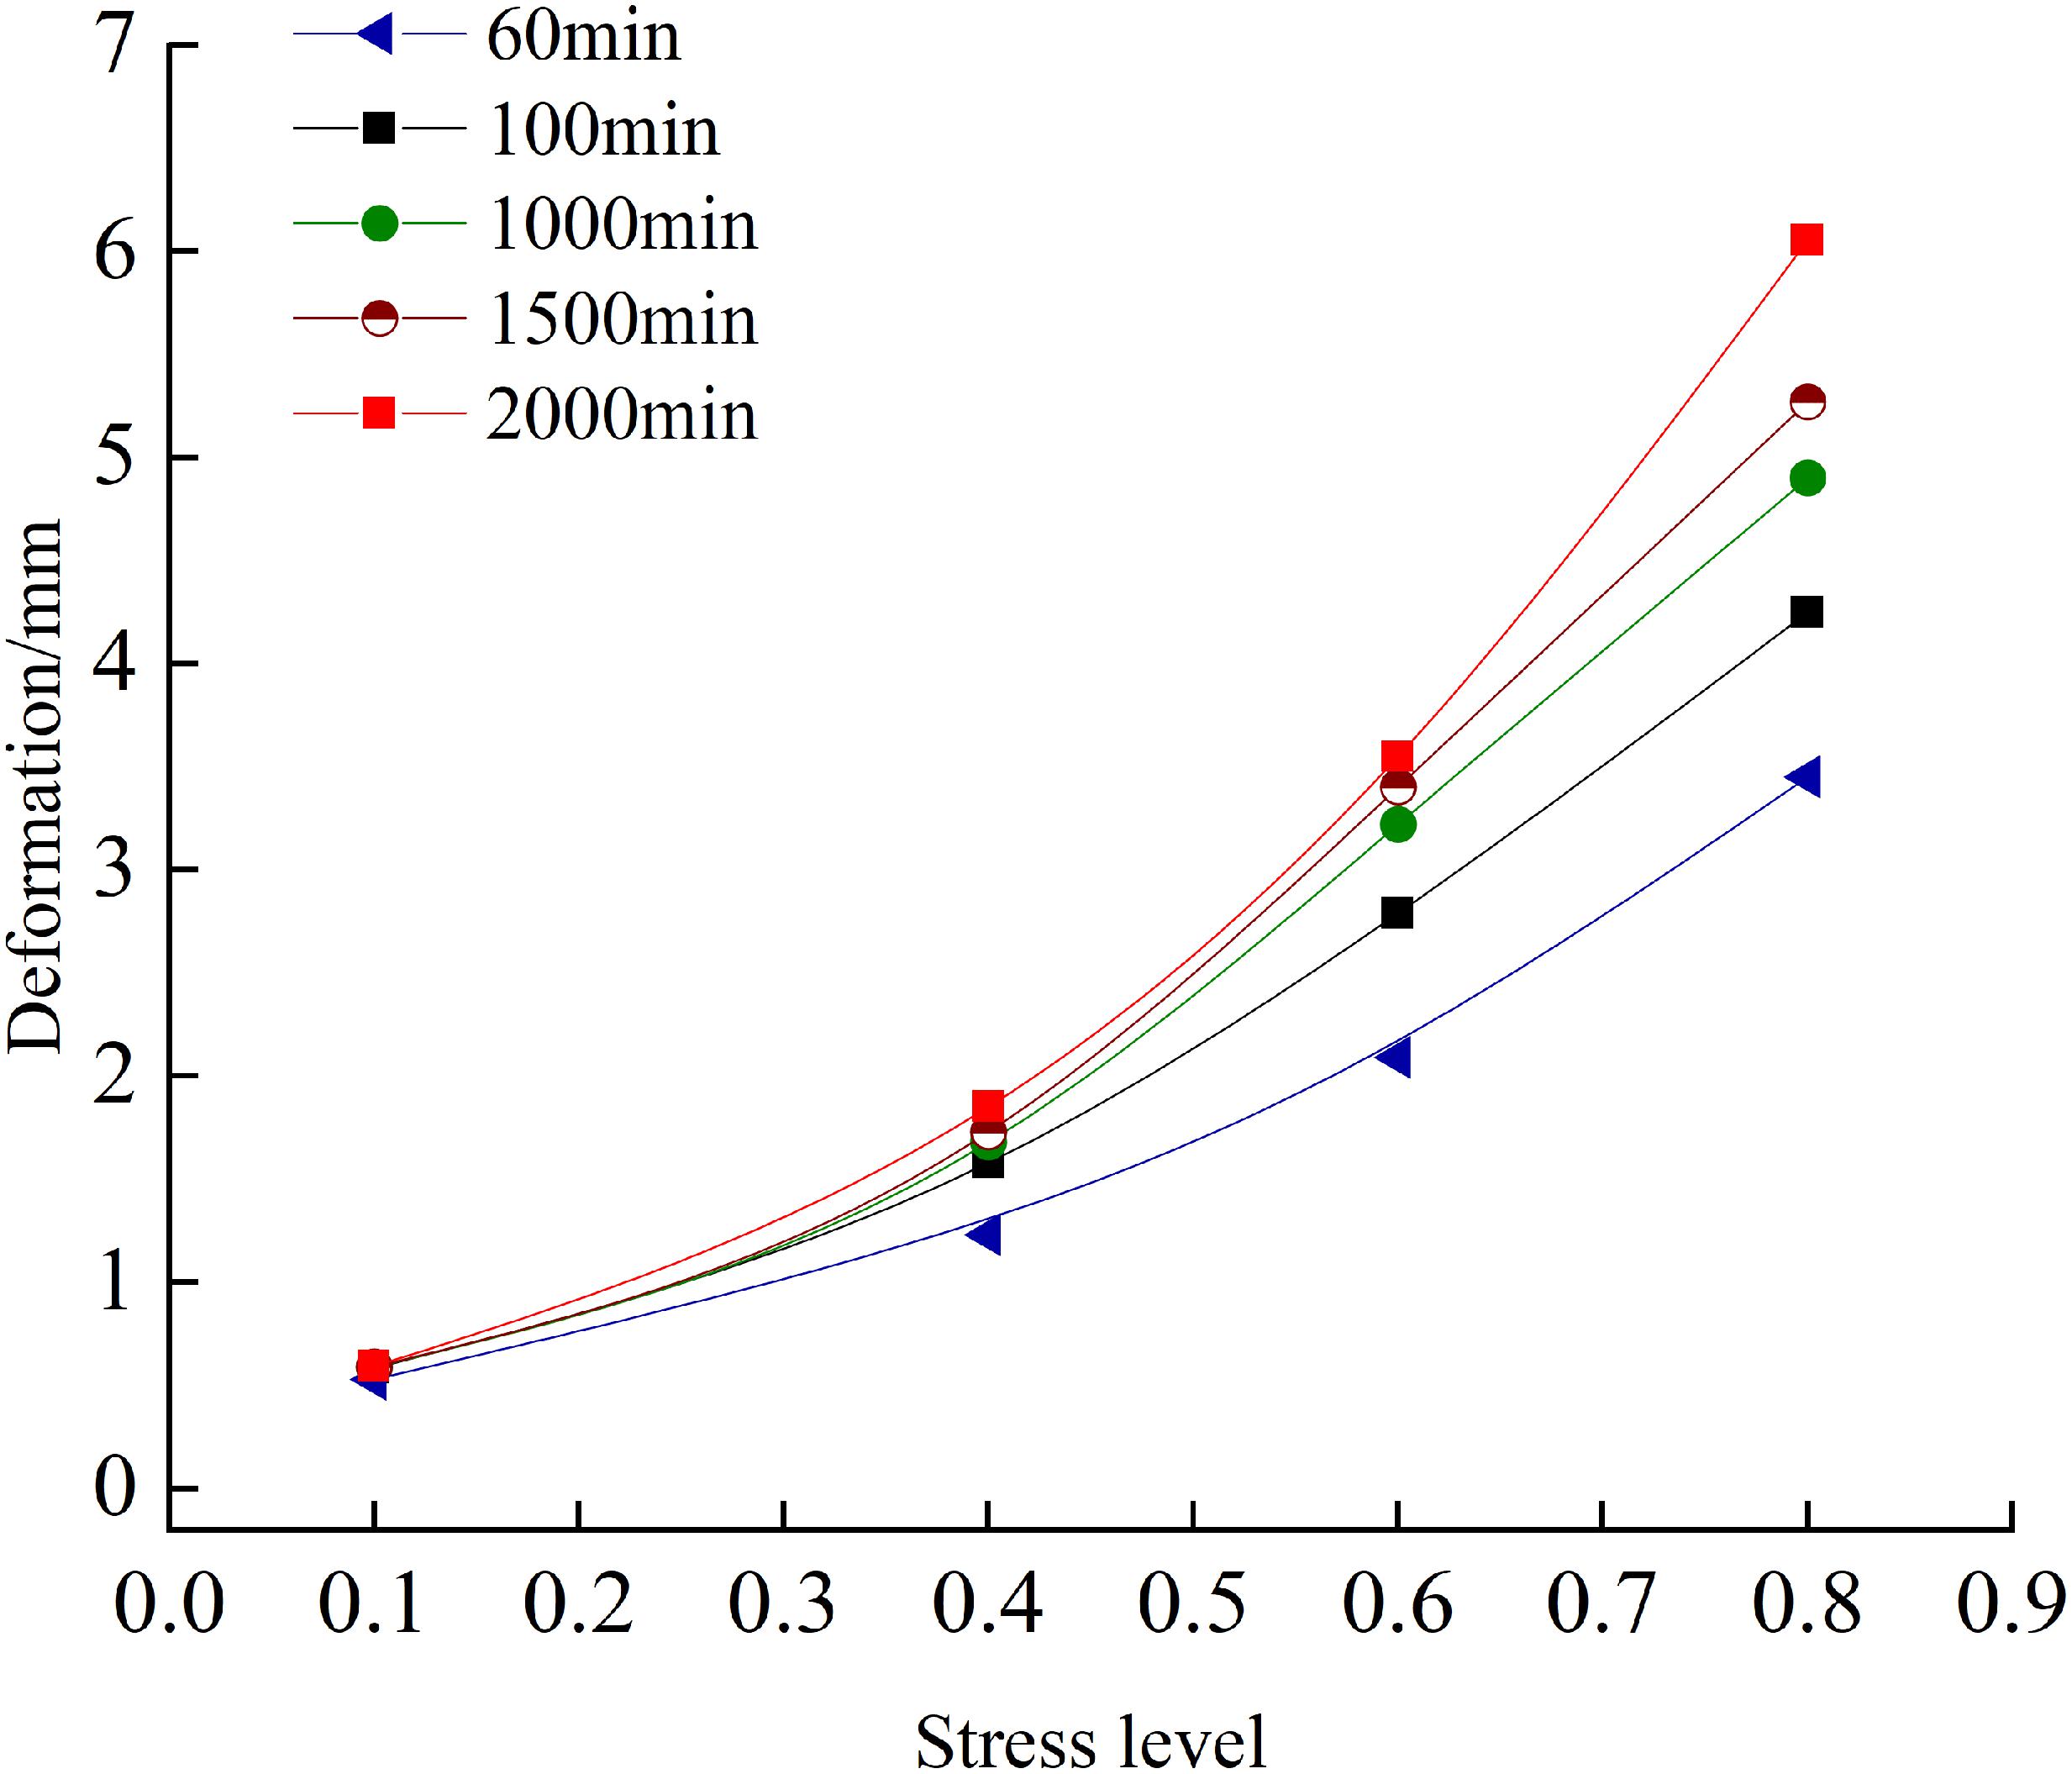
Figure 7. Creep isochronous curves under different stress levels.
Through numerical simulation of creep tests on coarse-grained soil, the particle motion and energy changes during creep were studied. It can be seen from Figure 8 that the simulation results of particle flow are basically the same as the test deformation trend. There is a difference of about 20% in the early stage of deformation, but the difference becomes smaller and smaller as time goes on, and the final deformation difference is less than 10%, indicating the accuracy and rationality of the calibration of the model’s mesoscopic parameters. In the first 30 min, the creep deformation of particles increases rapidly, reaching 75–80% of the final deformation value. After that, the deformation value increases slowly and gradually reaches the fixed value. And as can be seen from the above figure, the simulation value is generally larger than the test value. It is considered that this is related to the shape of the particles. In this paper, sphere particles were used for test simulation, and the influence of the angularity of the aggregate on the overall force and deformation of the material was ignored. Although the friction and bonding model has been given to the particles, the friction and bonding between particles cannot be truly represented. Under the loading, misalignment between spheres is very easy, the structure is rearranged, the force is transmitted quickly under the loading, and the compact state can be achieved in a short time. Therefore, the simulation of creep test can be performed better on material by using the real shape of the particle.
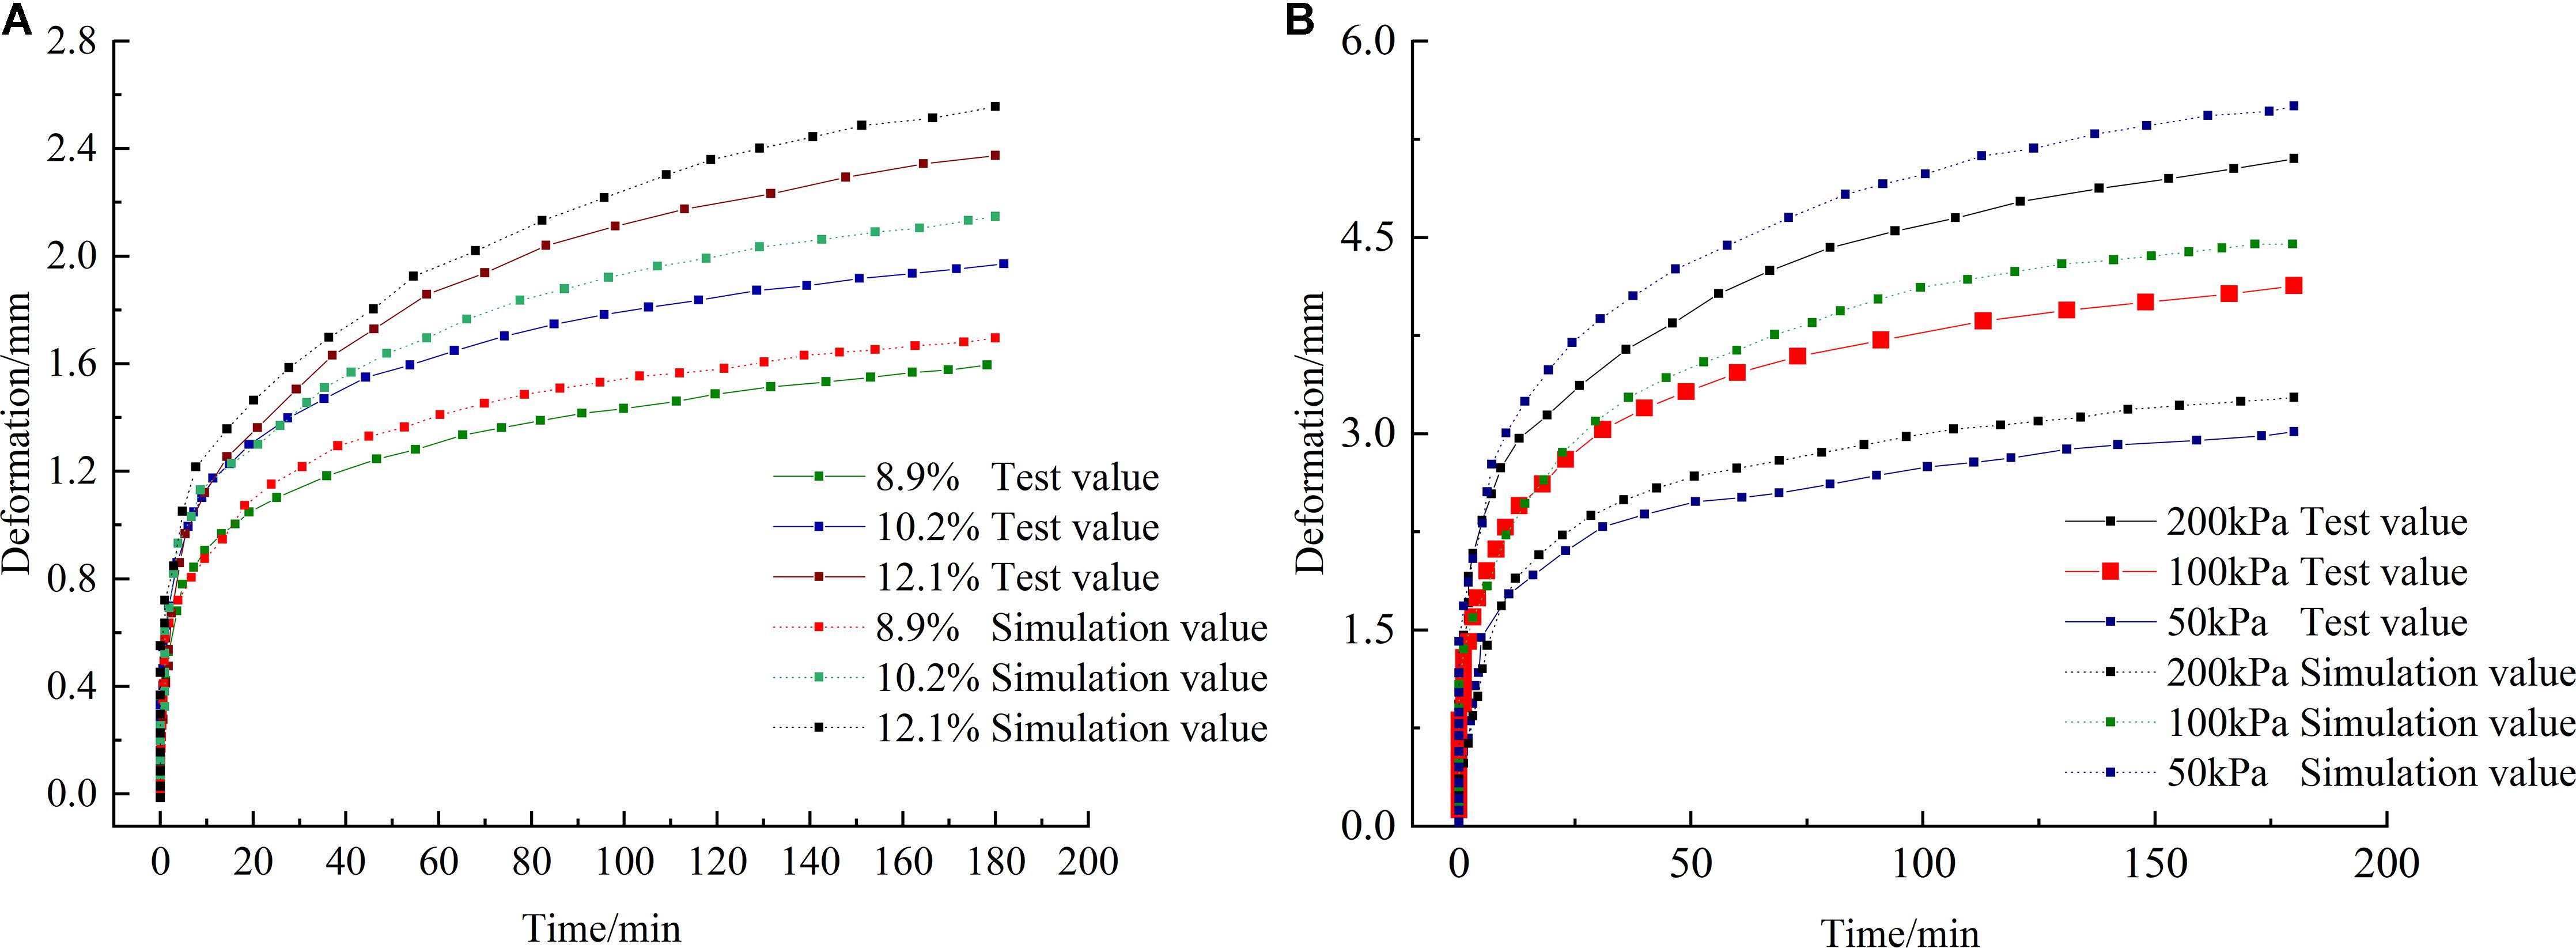
Figure 8. Variation of deformation value: (A) Under different water content, S = 0.4, confining pressure is 50 kPa, (B) Under different confining pressures, S = 0.6, moisture content is 8.9%
Conventional tests cannot directly measure the particle motion during the test. The PFC3D software can use the measurement circle for real-time monitoring. In this paper, a cyclic loading test was performed on the test sample according to the parameters in group E3. The measurement circle distribution is shown in Figure 9, The radius of measurement circle 1 (0, 0, 80), measurement circle 2 (0, 0, 0), and measurement circle 3 (0, 0, −80) is 5 mm.
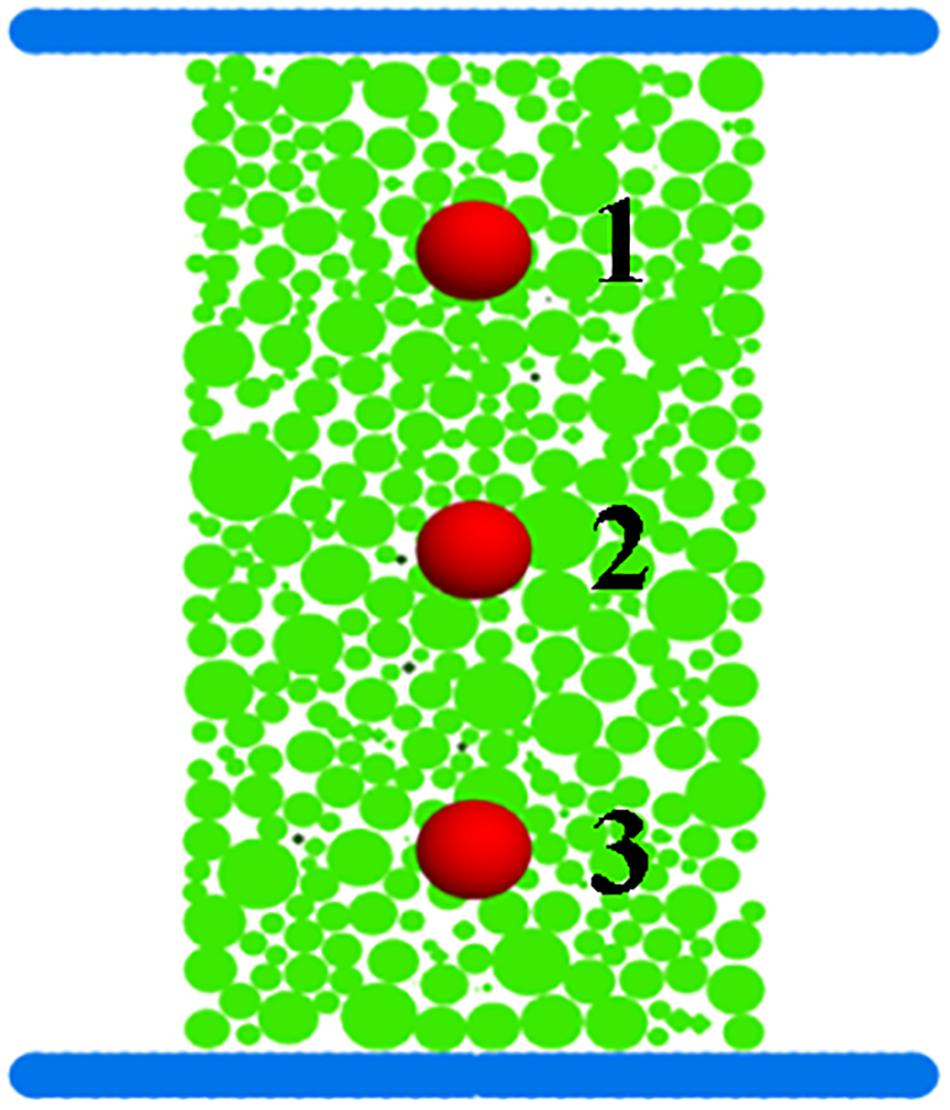
Figure 9. Schematic diagram of measurement circle distribution position.
PFC3D software stipulates that the particle rotation speed is positive in counterclockwise rotation and negative in clockwise rotation (Kong et al., 2012). During the loading process of the coarse-grained soil sample, the measurement circle 1, measurement circle 2 and measurement circle 3 were selected as the research objects, and the phenomena of particle rise, fall, and rotation during the creep of the sample were studied and analyzed. The “history” command was used to monitor the particle movement during loading, and essentially understood the change of the particle structure of the coarse-grained soil sample under the load. It can be seen from Figures 10, 11 that during the loading process, the rotation rate of each measurement circle fluctuates greatly. After 17000 steps, the displacement of all measurement circles in the z-axis direction gradually tends to be stable. At the same time, the rotation rate of the measurement circles also decreases significantly and tends to be stable. As each particle’s displacement decreases, its rotation rate slows down. The reason is that as the loading progresses, the particles continuously rise, fall, and tumble. The large pores of the sample are gradually compressed and will be filled with particles, the deformation decreases, the interparticle embedding increases, and the rotation rate decreases accordingly, which compacts the coarse-grained soil sample.

Figure 10. Displacement of particles in group B2 in the direction of Z axis.
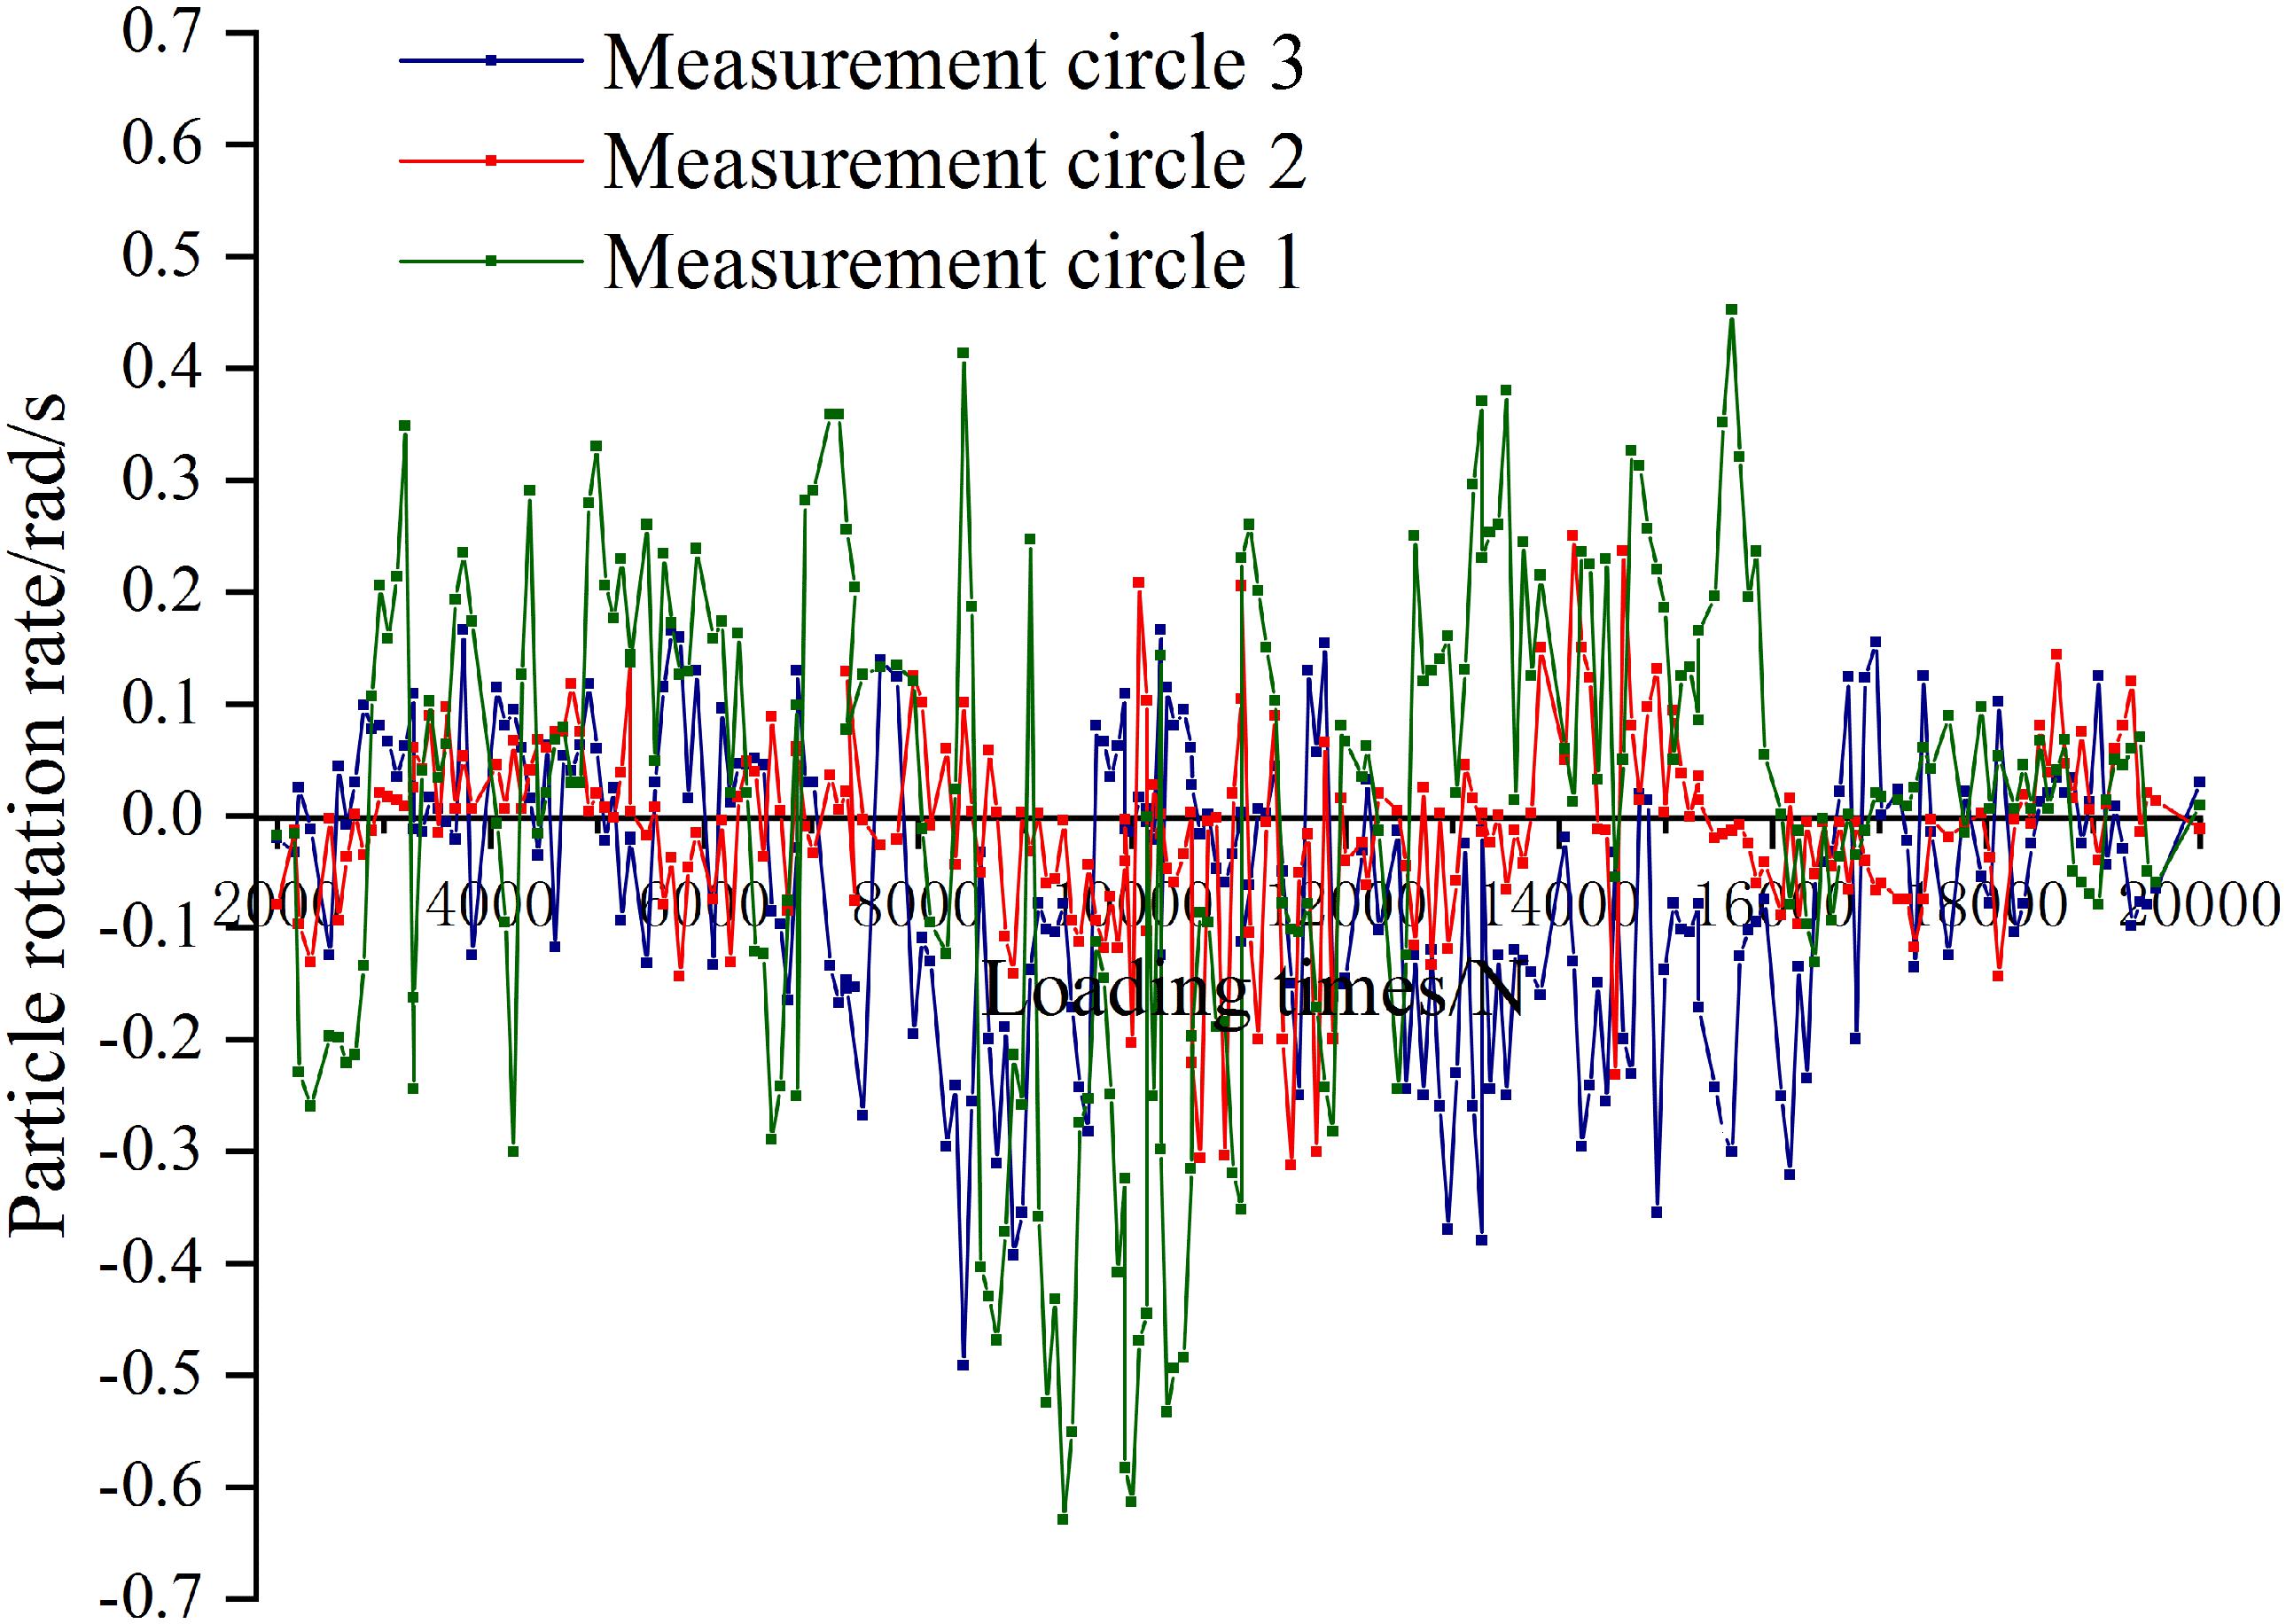
Figure 11. Variation of particle rotation rate.
In the PFC3D software, different theoretical models correspond to different energy responses. The energy response can be used to analyze the creep characteristics of coarse-grained soil. This paper selected a linear model based on the characteristics of coarse-grained soil. The linear model provided three types of energy response. The strain energy Ek defines the energy stored in the linear spring, which is the total strain energy of the particle assembly at all contact points. The sliding energy Eu defines the total energy dissipated by sliding friction. The viscosity energy Eβ defines the energy consumed by damping. Figure 12 show the three energy responses under different confining pressures.
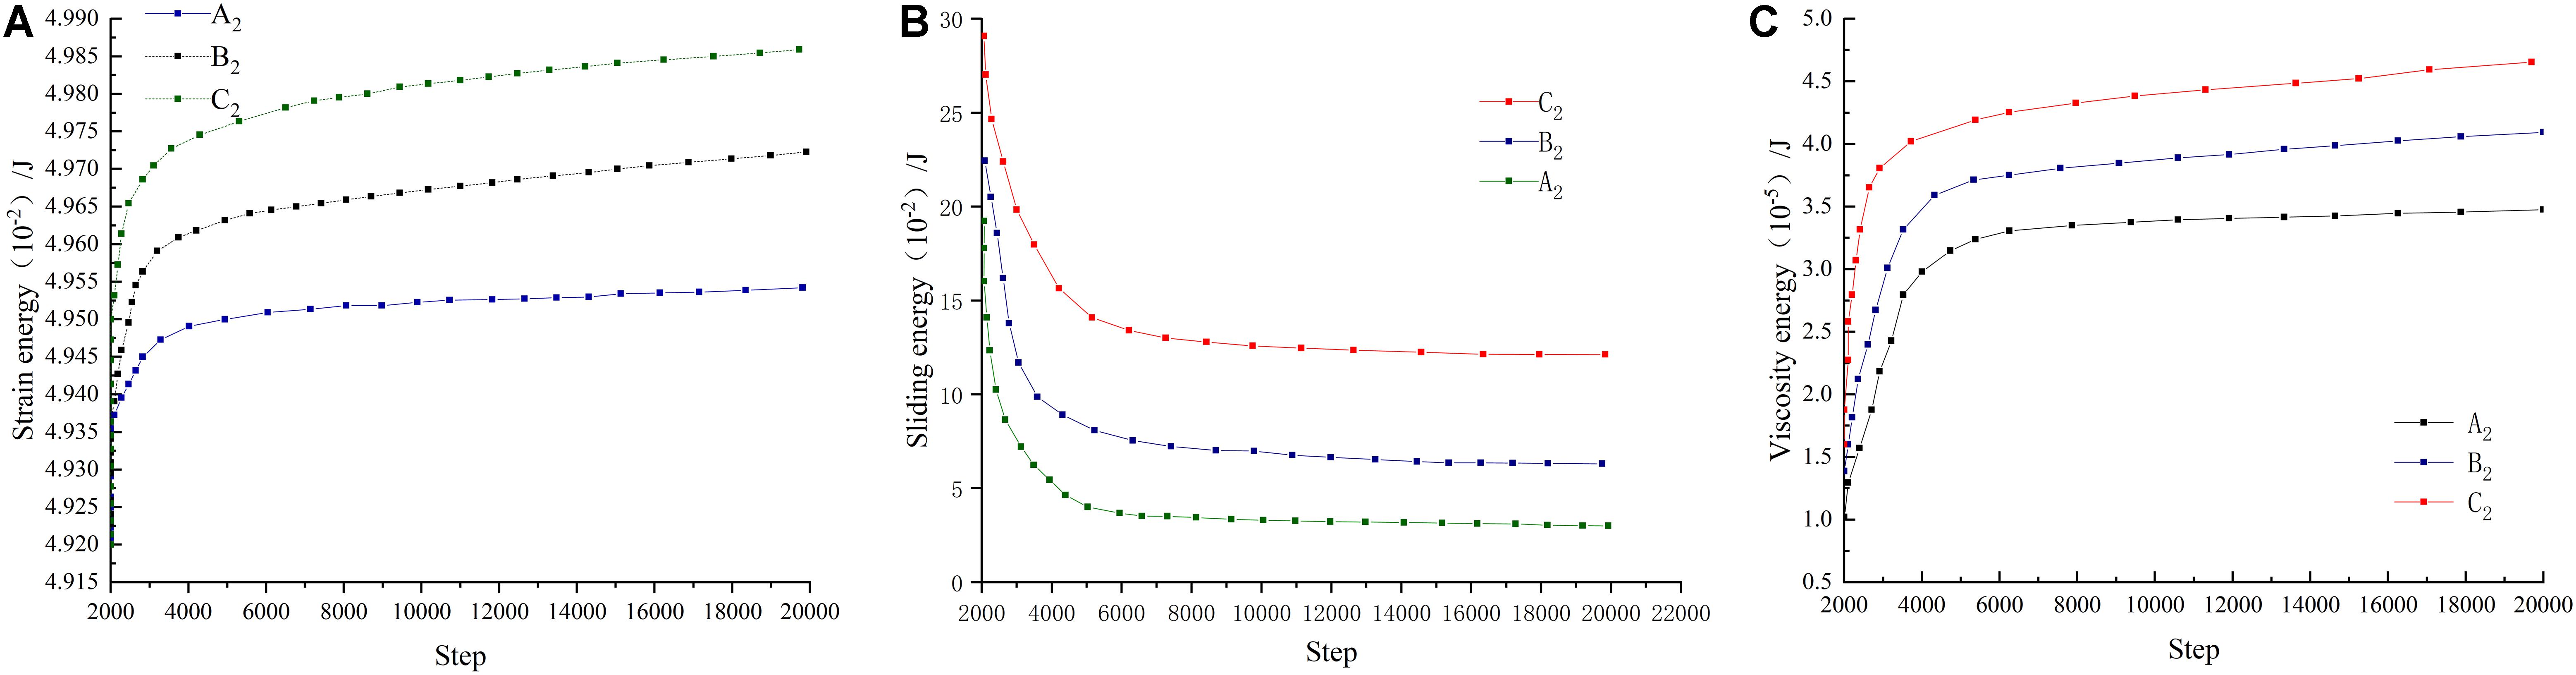
Figure 12. Variation of energy: (A) Strain energy, (B) Sliding energy, and (C) Viscosity energy.
As shown in Figure 12, the creep deformation energy increases to a certain value and then becomes gentle. It is stored between linear springs, reflecting the elastic deformation of granular materials. When the sample reaches the maximum density, the granular material changes from the elastic stage to the plastic stage, the creep deformation rate of the sample decreases, and the change of strain energy tends to be flat. In the same step, high confining pressure corresponds to a high energy value, and low confining pressure corresponds to a low energy value, because the higher the confining pressure will cause a larger external force on the sample, the larger the external force required for the sample to be destroyed, the less likely the sample is to be destroyed. The sliding energy Eu has a large change rate in the early stage and tends to be stable in the later stage. The structure of the sample is loose in the early stage of the test, and the particles are liable to rotate and slip under the load. Therefore, the sliding energy growth rate is relatively fast. As the test sample becomes denser, the intercalation effect between particles becomes stronger, and the sliding energy decreases accordingly. It is difficult for particles to move at the later stage of loading, but there is a tendency of movement between them, so the sliding energy is in a stable state, which also shows that most of the input energy is dissipated unilaterally through frictional energy dissipation, and coarse-grained soil is a strong dissipation system; Viscosity energy is a kind of plastic energy caused by a damper. During the numerical simulation, additional damping is performed to reflect plasticity. During the loading process, the sample changes from the elastic stage to the plastic stage, and the viscosity energy gradually increased and then flattened, which coincided with the actual situation.
(1) In the triaxial shear test, at the initial stage of the sample shear, the sample was in the elastic stage, showing a shear strain softening, and the stress-strain curve changes linearly; With the increase of the stress difference, the strain softening of the sample was transferred to the strain hardening, and the stress-strain curve showed a non-linear change.
(2) The creep curve can be divided into four stages: transient elastic deformation stage, fast creep stage, stable creep stage and accelerated creep stage; When the stress level is within this range (0.1 ≤ S < 0.4), The plastic deformation value is very small, and only transient elastic deformation occurs; When the stress level is within this range (0.4 ≤ S < 0.8), The sample develops from the transient elastic deformation stage to the rapid creep stage, and enters a stable creep stage as the creep deformation rate decreased; when the stress level is within this range (S ≥ 0.8), The test sample enters the accelerated creep stage in the late stage of loading, the curve tends to non-converge, and the test sample develops toward the destruction.
(3) In the early stage of the test, the structure of the sample is relatively loose, and the particles are liable to rotate, roll, rise or fall under the load. As the test sample becomes denser, the rotation rate of the particles decreases, the trend of the strain energy tends to be gentle, the sliding energy decreases accordingly, and the viscosity energy gradually increases and then becomes flat, which coincides with the creep process of the test sample.
(4) When performing numerical simulation by PFC3D, this article only analyzed the particle movement and energy change, and lacked data and pictorial diagrams of particles inside the model. However, the PFC3D discrete element software has a powerful practical prospect, which can analyze the mesoscopic characteristics of materials from many aspects and perspectives in the future.
The datasets generated for this study are available on request to the corresponding author.
ZH processed the data and wrote the manuscript. DX designed the tests and performed the simulations. YL performed the tests. All authors contributed extensively to the review and revision of this manuscript.
This research was funded by the National Natural Science Foundation of China (Nos. 51978084 and 51678073), the Practice Innovation and Entrepreneurship Enhancement Project by Changsha University of Science and Technology (No.SJCX201907).
The authors declare that the research was conducted in the absence of any commercial or financial relationships that could be construed as a potential conflict of interest.
Cai, G. J., Chen, S. H., Zhao, D. A., and Zhou, Y. (2019). Experimental study on creep characteristics of saturated sand and its influencing factors. J. Eng. Geol. 27, 1048–1055.
Guo, G. Q. (1999). Engineering Characteristics and Application of Coarse-Grained Soil. Zhengzhou: The Yellow River Water Conservancy Press.
Hu, X. H., Duan, X. L., He, Z. M., Yang, Y., and Liu, Y. X. (2018). Mechanical properties and meso mechanical performance evaluation of coarse-grained soil fillers based on dynamic triaxial CT test. China J. Highw. Transp. 31, 42–50.
Hu, X. L., Sun, M. J., Tang, M. H., Xie, N., and Guo, J. (2014). Creep tests of gravel-soil of Majiagou landslide in Three Gorges Reservoir area. Rock Soil Mech. 35, 3163–3169.
JTG D30-2015, (2015). The Chinese Code for Design of Highway Subgrades. Beijing: China Communications Press.
Kang, D. H., Yun, T. S., Lua, Y. M., and Wang, Y. H. (2012). DEM simulation on soil creep and associated evolution of pore characteristics. Comput. Geotech. 39, 98–106. doi: 10.1016/j.compgeo.2011.09.003
Kong, L., Su, Q., Wang, Y. C., and Peng, R. (2012). Mesoscopic mechanics and energy dissipation analysis of sand deformation under slow cyclic loading. Chin. J. Undergr. Space Eng. 8, 268–273.
Kwok, C. Y., and Bolton, M. D. (2013). DEM simulations of soil creep due to particle crushing. Géotechnique 63, 1365–1376. doi: 10.1680/geot.11.P.089
Liu, P. H., Jia, J. C., and Du, Y. F. (2015). Experimental study on creep behavior of marine soft clay under low frequency cyclic loading. Chin. J. Undergr. Space Eng. 11, 1193–1198.
Long, Y., Zhang, J. S., Ding, J. Y., and Wang, W. B. (2017). The cyclic load experiments and an accumulated deformation model for coarse-grained soil filling. J. Vib. Shock 36, 128–132.
Peng, K., Zhou, J., Zou, Q., and Yan, F. (2019). Deformation characteristics of sandstones during cyclic loading and unloading with varying lower limits of stress under different confining pressures. Int. J. Fatigue 127, 82–100. doi: 10.1016/j.ijfatigue.2019.06.007
Sun, M. J., Tang, H. M., Wang, X. H., Hu, L. X., Wang, M. Y., and Ni, W. D. (2017). Creep properties of sliding-zone soil from a creeping landslide. Rock Soil Mech. 38, 385–391.
Tang, L. S., Zhao, Z. L., Chen, H. K., Wu, Y. P., and Zeng, Y. C. (2019). Dynamic stress accumulation model of granite residual soil under cyclic loading based on small-size creep tests. J. Central South Univ. 26, 728–742. doi: 10.1007/s11771-019-4043-5
Wilson, J. L. (2016). The Eurasian economic union and China’s silk road: implications for the Russian–Chinese relationship. Eur. Polit. Soc. 17, (Suppl. 1), 113–132. doi: 10.1080/23745118.2016.1171288
Yang, Q., Wu, L. M., Nie, R. S., Zhou, W. Q., and Zhu, W. B. (2014). Laboratory test study of creep behavior of sandy. Chin. J. Rock Mech. Eng. 33, 4282–4286.
Yuan, J., Fang, Y. G., Gu, R. G., and Hu, G. X. (2014). Experimental study for influence of content and distribution of rheological material on soft soil creep properties. Chin. J. Rock Mech. Eng. 33, 2924–2929.
Zhang, Z. H. (2015). Mesoscopic Numerical Simulation of Triaxial Test of Coarse Grained Soil Based on PFC3D. master’s thesis, Three Gorges University, Yichang.
Zhao, Y., Wang, Y., Wang, W., Tang, L., Liu, Q., and Cheng, G. (2019). Modeling of rheological fracture behavior of rock cracks subjected to hydraulic pressure and far field stresses. Theor. Appl. Fract. Mech. 101, 59–66. doi: 10.1016/j.tafmec.2019.01.026
Zhao, Y., Wang, Y., Wang, W., Wan, W., and Tang, J. (2017). Modeling of non-linear rheological behavior of hard rock using triaxial rheological experiment. Int. J. Rock Mech. Mining Sci. 93, 66–75. doi: 10.1016/j.ijrmms.2017.01.004
Zhao, Y., Zhang, L., Wang, W., Wan, W., and Ma, W. (2018). Separation of elastoviscoplastic strains of rock and a nonlinear creep model. Int. J. Geomech. 18:04017129. doi: 10.1061/(ASCE)GM.1943-5622.0001033
Zhou, M., and Song, E. (2016). A random virtual crack DEM model for creep behavior of rockfill based on the subcritical crack propagation theory. Acta Geotechn. 11, 827–847. doi: 10.1007/s11440-016-0446-8
Keywords: coarse-grained soil, static triaxiality, particle flow, creep characteristics, meso-structure
Citation: He Z, Xiang D and Liu Y (2020) Triaxial Creep Test and Particle Flow Simulation of Coarse-Grained Soil Embankment Filler. Front. Earth Sci. 8:62. doi: 10.3389/feart.2020.00062
Received: 12 January 2020; Accepted: 20 February 2020;
Published: 10 March 2020.
Edited by:
Yanlin Zhao, Hunan University of Science and Technology, ChinaReviewed by:
Wu Qihong, Sichuan University, ChinaCopyright © 2020 He, Xiang and Liu. This is an open-access article distributed under the terms of the Creative Commons Attribution License (CC BY). The use, distribution or reproduction in other forums is permitted, provided the original author(s) and the copyright owner(s) are credited and that the original publication in this journal is cited, in accordance with accepted academic practice. No use, distribution or reproduction is permitted which does not comply with these terms.
*Correspondence: Zhongming He, aGV6aG9uZ21pbmc0NUAxMjYuY29t
Disclaimer: All claims expressed in this article are solely those of the authors and do not necessarily represent those of their affiliated organizations, or those of the publisher, the editors and the reviewers. Any product that may be evaluated in this article or claim that may be made by its manufacturer is not guaranteed or endorsed by the publisher.
Research integrity at Frontiers
Learn more about the work of our research integrity team to safeguard the quality of each article we publish.