 Jun Wang
 Qiao Liang
- Department of Building Engineering, Hunan Institute of Engineering, Xiangtan, China
The anchorage structure is a complex bearing system with undetermined failure modes. According to component characteristics, the segmented diagram for the bearing characteristics and the bearing structure at the anchorage segment were established. In addition, we described the failure patterns of the subsystems of the anchorage structure and further established the series model for the reinforced system by bolts. Moreover, according to the total displacement and the time-dependent deformation characteristics of the bolt, a non-linear creep model to analyze the viscoplastic deformation characteristics of the M-C element was established. Furthermore, considering the shear strength of the anchored soil, it was assumed that the cohesion and the internal friction angle were random variables following the Weibull distribution. Using the modified first-order second-moment method (the JC method), the analytic expression of the time-dependent index of the anchorage system was obtained. An example showed that the variable coefficients of the cohesion and the internal friction angle were exponentially and linearly related to the reliability index, respectively. Simultaneously, the reliability index was exponentially related to time.
Introduction
Anchorage, with high bearing capacity, controllable deformation, and feasibility in complex environment, has been widely used to reinforce geotechnical engineering and prevent engineering failure. More importantly, because of the improvement in the shear resistance of the soil or the rock, anchorage has been a hot Research Topic in transportation slope engineering, underground engineering, and the slope in open mine (Eisawwaf and Nazir, 2006; Ivanovi and Neilson, 2008; Sahoo and Kumar, 2012; Lin et al., 2013; Martin et al., 2013; Zhao et al., 2016). Previous studies extensively analyzed the distribution characteristics of the lateral resistance at the anchored segment, the load–displacement relation, the ultimate pulling force, the loss of the prestress, and the design optimization (Cai and Ugai, 2003; Kahyaoglu et al., 2012; Zhao et al., 2019a). Generally, the mechanical properties of the anchorage structure are assumed to be constant. Thus, the bearing capacity and stability are fixed. However, the influence of the uncertainty of the anchorage material and the creep on the mechanical properties and the selection of the design parameter are ignored. Further, this ignorance may misjudge the anchorage state and cause engineering failure. Thus, it is of great engineering value to evaluate the long-term stability of the anchorage structure and analyze the failure pattern. Underground erosion, chemical corrosion, engineering vibration, and stress release may impair the bearing capacity, accelerate the prestress release, and increase the displacement. Thus, engineering failure frequently occurs when the anchorage parameters meet the design requirement (Wang et al., 2014; Zhang et al., 2019). Considering the above complex conditions, it is a great challenge to study the corresponding failure model, the non-linear creep model, the reinforcement result, and the stability reliability.
Previous researchers have extensively investigated the failure model and the reliability of the anchorage structure. Windsor (1997) established a reliability model according to the anchorage structure in the tunnel and the stress–displacement curve of the anchorage material. They further proposed the function for reliability evaluation based on the residual stress. This model can be applied in the relatively intact surrounding rock; however, the effect of the accelerated displacement on the instability of the anchorage was ignored in soft rock engineering. Phoon and Ching (2015) obtained the distribution of characteristic parameters and the characteristics of the probability density based on the reliability analysis in anchored engineering. They revealed the differences in the application of the mode distribution, the normal distribution, the logarithmic normal distribution, and the even distribution. Further, they concluded that the extreme value distribution is more proper for the calculation of the static reliability index. However, the effect of service time on the anchorage parameters was ignored. Thus, only temporary characteristics have been investigated. Zhang et al. (2006) established a resistance reduction model by analyzing the random process of the structural function. They found that the resistance decreases with the increase in time, whereas the variance increases with the increase in time. Duzgun et al. (2003) investigated the planar failure model in the rock slope and suggested that series analysis be conducted in the reliability analysis. The above studies significantly contribute to understanding the temporary reliability instead of the time-dependent reliability of the anchorage structure. Especially, the effect of the long-term strength on the reliability lacks sufficient investigations.
In the calculation of the reliability, basic random variables are first determined according to the failure mechanism and the failure mode. Then, probability functions and distribution functions are selected to analyze the variables. Moreover, the calculation on the failure probability yields the reliability index. Currently, approximation methods, including the first-order reliability method (FORM), the second-order reliability method (SORM), the Monte Carlo method (MCS), the statistical moment method, the random finite-element method, and the optimization method, are used to analyze the reliability indexes because of the difficulty in integration. Among these methods, FORM has been widely used because of the feasibility of the determination of the function, the simplicity of the parameters and the calculation process, and the high precision. However, the large variation in the mechanical properties of the anchorage material at various segments and the effect of environmental factors may result in difficulties in determining the probability distribution. On the other hand, the precision of the JC method can meet the requirement even when the random variables are undetermined and the simulation numbers are limited. Thus, the present article analyzes the effect of the creep and time-dependent characteristics on the reliability of the anchorage system, considering the failure characteristics of the anchorage components. We established the segmented diagram for the bearing characteristics and the bearing structure at the anchorage segment and further established the series model for the bolted reinforced system. In addition, the analytic expression of the time-dependent index of the anchorage system was obtained, and the variable coefficients of the cohesion and the internal friction angle are exponentially and linearly related to the reliability index, respectively. Simultaneously, the reliability index is exponentially related to time between the variance in cohesion and internal friction angle, and the reliability indexes.
The Series Model
Bearing Structure
The tension transfer of the bolt to the mortar is achieved by the shear strength on the bolt-anchorage and anchoraged soil interfaces (Wang et al., 2017; Zhao et al., 2019a,b). Thus, the bearing capacity depends on the bond strength of the anchored segment and the shear strength of the soil. Anchorage may fail when debond or soil submit occurs. Extensive engineering examples show that common anchorage failure includes shear failure of the bolt and the mortar, the debond on the mortar–soil interface, the shear failure of the mortar, the tensile-shear failure of the soil, the tensile failure of the bolt, and the local compressive-shear failure of the anchorage end. The highly concentrated shear stresses on the mortar–soil interface and in the soil are responsible for dominating failures on the mortar–soil interface and the shear failure of the soil. According to the load transfer method and the failure pattern of the anchorage, Figure 1 shows the bearing structure of the bolt and the shear stress distribution.
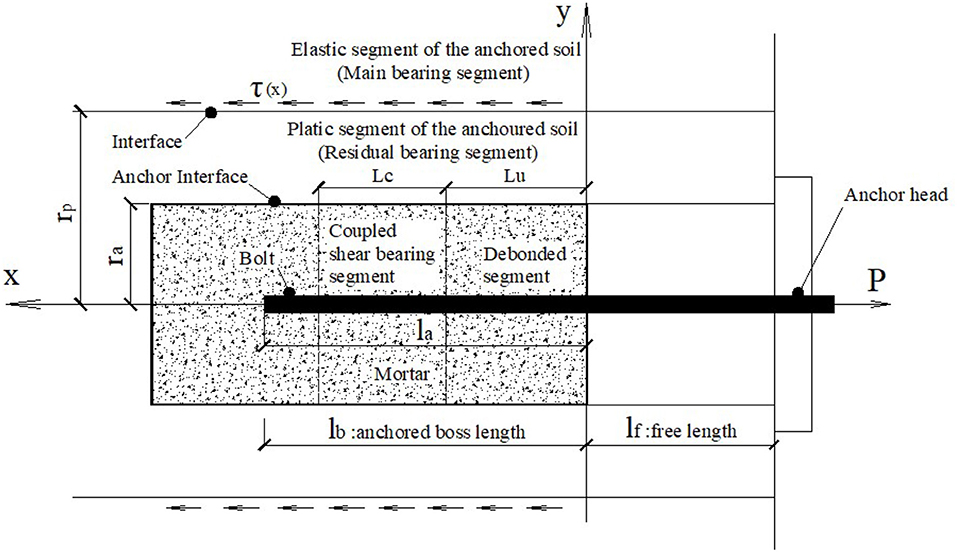
Figure 1. Shear stress and bearing structure: la, lb, lu, lf, lc, rp, and ra are the anchorage length, the anchored boss length, the debond length, the free length, the shear stress coupled length, the plastic radius of the anchored soil, and the radius of the anchorage.
The Anchorage System for the Multifailure Series Model
Figure 1 shows that the anchorage system consists of the anchorage end, the free segment, the anchored segment, the mortar, and the surrounding soil. Clearly, many internal and external factors may affect the load bearing stability. Thus, many failure modes may occur. The present article divides this system into three subsystems including the bolt system, the mortar system, and the surrounding soil system. The failure of any subsystem may result in the failure of the entire anchorage system. Thus, the failure mode of the anchorage system is a series system (Figure 2).
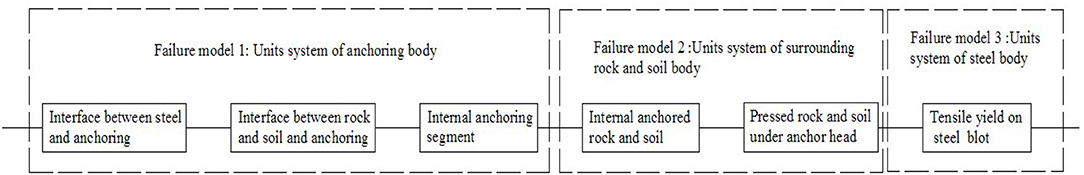
Figure 2. Series model of the anchorage structure.
To facilitate the study on the failure probability of the anchorage system, we assume that:
(1) The soil and the mortar are homogeneous materials.
(2) The loss of the prestress and the weight of the bolt are negligible.
The failure theory of the series system yields the failure probability, P(X), and Xm(m = 1, 2, ⋯⋯6) denotes the failure events.
where X1i denotes the failure mode of the mortar subsystem. i, being equal to 1, 2, and 3, correspondingly denotes the shear failures between the bolt and the mortar, the shear failure between the soil and the mortar, and the shear failure in the mortar, respectively. X2i is the failure mode of the soil subsystem. i, being equal to 4 and 5, denotes the tensile-shear failure in the soil and the local shear failure at the anchor end. X3i is the failure model of the bolt subsystem, and i, being equal to 6, denotes the tensile submit of the bolt.
According to the six independent failure modes, the failure probability is:
where Pfi denotes the failure patterns.
Considering the shear failure between the soil and the mortar and the shear failure in the soil, the failure probability of the anchorage system is (Ditlevsen and Madsen, 1996):
where Pf1 and Pf2 are the failure probabilities of the mortar subsystem and the soil subsystems, respectively.
Creep Characteristics and Time-Dependent Reliability
The Non-linear Creep Model and the Time-Dependent Shear Resistance Characteristics
The strength of the bolt is much larger than that of the soil or the mortar; thus, the elastic deformation instead of the negligible plastic deformation of the bolt dominates. In addition, the plastic deformation of the soil, characterized by accelerated deformation, is the maximum (Equation 7). In the creep analysis, the M-C plastic element is used to depict the accelerated creep deformation. Simultaneously, elastic and plastic deformation may form under the instantaneous load. The traditional plastic element can depict the corresponding plastic deformation. The total bolt displacement (ST) consists of the displacement at the free segment (Sf), the displacement at the anchored segment (Sa), and the relative shear displacement on the soil–anchorage interface (Ss).
The total displacement of the soil (ssf) consists of the displacement at the anchored segment (ssa) and the compressed displacement at the anchorage end (ssh).
Figure 3 shows the creep model of the anchorage system with three stages, considering the constituent of the structure and the displacement characteristics of the anchored material.
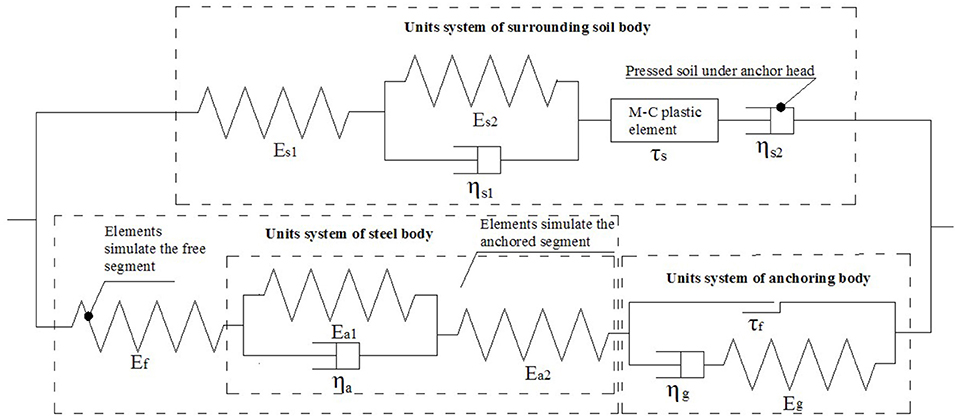
Figure 3. Creep model of the anchor structure: Es1, Es2, ηs1, ηs2, and τs are the elastic modulus, the viscoelastic modulus, the viscoelastic coefficient, the viscosity coefficient, and the shear strength of the soil, respectively; Ef is the elastic modulus of the free segment; Ea1, Ea2, and ηa are the viscoelastic modulus, the viscoelastic coefficient, and the viscosity coefficient of the anchored segment; Eg, ηg, and τf are the elastic modulus, the viscoelastic modulus, and the shear strength of the mortar.
For the elastic strain, εMC, of the soil, the one-dimensional function criterion (Mohr-Coulomb criterion) is:
The viscoplastic strain rate of the M-C plastic element is (Wang and Li, 2008):
where c, φ, and F0 are the cohesion, the internal friction angle, and the initial strength of the soil. Equations 6 and 7 yield the plastic strain.
The shear force of the bolt is responsible for the creep stress. When the shear stress is lower than the shear strength, the creep of the structure consists of attenuation creep and stable creep; otherwise, non-linear accelerated creep may occur.
The failures on the interface between soil and anchorage may damage the soil–anchorage structure. The cohesion and the internal friction angle are the main indexes for the soil strength. Extensive studies have shown that the cohesion and the internal friction angle continuously vary under constant load. In addition, shear strength frequently decreases. Thus, the creep property is critical to the stability of the anchorage structure. The time-dependent characteristics of the internal friction angle and the cohesion, the initial creep strength, and the long-term shear strength can satisfy the Mohr–Coulomb criterion (Wang and Li, 2008; Zhao et al., 2017a,b; Zhao et al., 2018):
where c0 and c∞ are the initial and long-term cohesion, respectively; φ0 and φ∞ are the initial and long-term internal friction angle, respectively; τ0f and τ∞ are the initial and long-term shear strength, respectively; σn is the normal stress.
With the shear creep results (c∞/c0 = 1/3 ~ 1/8, tanφ∞/tanφ0 ≈ 1) (Wang and Li, 2008), the ratios of the long-term values to the initial values are:
The shear creep results show that the cohesion for the specific time is non-linear to the load time and can be written as:
where ct and t are the time-dependent cohesion and the creep time, respectively; a and b are experimental coefficients, m is an experimental constant.
With the definition condition:
(1) t = 0, ct/c0 = 1;
(2) t → ∞, ct/c0 = 0.2◦
Substituting into Equation 10, the coefficients a and b can be written as:
Based on the logarithm form of Equation 10, the assumptions are as follows:
Thus, the linear equation is:
Then, the least-squares method yields the experimental constant, m. In the present article, m is equal to -1. Thus, the exponential equation of the time-dependent cohesion is:
Random Analysis of the Anchorage Parameters
The environmental variations and the uncertainties of the mechanical parameters of the soil may significantly affect the anchorage stability. The mechanical parameters of the anchorage structure include the mechanical properties of the soil, the bond strength on the interface, and the mechanical properties of the mortar and the reinforcement. Among these properties, the shear strength of the soil and the bond strength on the interface are critical. The cohesion and the internal friction angle of the soil, significantly affecting the reliability, are frequently random. The composition and the grain size of the soil, the environmental conditions, the stress conditions, the experimental methods, etc., are responsible for the randomness (Duncan, 2000). Practically, the internal friction angle and the cohesion are independently analyzed because the ignorance of the self-correlation can facilitate the calculation. In addition, the divergence on the correlation between these parameters prevents further investigation on the reliability. Moreover, the complication of the correlation coefficient hinders the calculation of the correlation coefficient. Furthermore, the design selection in the present regulations depends on the standard variation and the variation coefficient of the internal friction angle and the cohesion instead of considering the correlation coefficient.
The failure of the subsystem is responsible for the failure of the series anchorage system. Especially, the shear failure on the soil–anchorage interface significantly affects the stability of the system. Thus, the shear resistance is treated as the condition for the anchorage system stability. However, the anchorage failure depends on the minimum shear strength; in other words, the soil can reach the shear strength. Thus, in the present article, the failure mode of the subsystem, Xmn(m = 1, 2, 3; n = 1, 2, ······6), is the random variable. The cohesion and the internal friction angle are the basic random variables with a Mode III Weibull distribution.
The probability function of the Weibull III distribution is:
The distribution function is:
where x, m, a, and γ are the basic random variable, the shape parameter, the dimensional parameter, and the location parameter, respectively.
The distribution parameters are predicted based on the moment method. Then, the total moment is obtained based on the sample moment. Then, the location parameter, the shape parameter, and the dimensional parameter can be obtained based on the first-, second-, and fourth-order moment.
Principles of the JC Method
The JC method is an internationally accepted method that is used to analyze safety reliability (Ditlevsen and Madsen, 1996). The JC method, based on the modified first-order second moment, can calculate the failure probability of the most dangerous structural point. It can change the non-normal random variables into normal random variables. With the Weibull distribution, the equivalent normalization is as follows:
For the verification point X*, the distribution function of the normal random variable (X′) is equal to the distribution function of the Weibull random variable (X). In other words, is equal to :
Equation 20 yields that:
Furthermore, the average value of the equivalent normal variable is:
Similarly, the probability density function of the normal random variable is equal to that of the Weibull random variable for the verification point X*. Thus, the probability density function is:
With Equation 21, this function can be written as:
The standard deviation of the equivalent normal variable is:
Using the modified first-order second-moment method, the reliability index, β, and the failure probability, Pf, are:
where φ(·) and Φ(·) are the normal probability function and the distribution function, respectively; fX(·) and FX(·) are the probability function and the distribution function of the non-normal random variable, respectively; g(·) is the function of the anchorage structure; and are the mean value and the normal deviation of the normal variable, respectively.
The Calculation of the Time-Dependent Reliability
Currently, the reliability calculation of the anchorage structure is based on the constant load, resulting in instantaneous reliability indexes. However, the time-dependent index is non-negligible. In the load transfer process, shear stress is non-linear. However, the anchorage effect depends on the shear resistance and varies with the increase in time. Thus, the stability reliability continuously varies.
With the load distribution in Figure 1, the axial stress along the bolt at the specific point is:
where R is the distance between the anchorage end and the point in the anchorage body. P is the concentrated load at the anchorage end, obtained by the load transfer at the bolt end.
Further, the axial stress on the anchorage–soil interface is:
where is equal to y2 + z2 and σ is the axial stress.
Considering the shear failure probability, the axial stress on the residual bearing interface is (Duncan, 2000):
where is equal to y2 + z2.
According to the definition of the shear stress on the interface and of the anchored soil, Equation 30 yields the shear stress of the anchored segment:
where Gs, Gg, Gc, Eg, rp, νs, and lb are the shear modulus of the soil, the shear modulus of the mortar, the shear modulus of the anchorage body and the residual soil, the elastic modulus of the anchorage body, the radius of the residual bearing zone, Poisson's ratio, and the anchorage length, respectively.
Equation 31 infers that the shear stress gradually decreases along the bolt length and is equal to zero at the bolt end. The shear stress reaches the maximum value ahead of the anchored segment. In other words, the ultimate shear strength has been fully utilized.
According to the M-C criterion, the shear strength, considering the time-dependent effect, is:
With Equation 14, the shear strength is as follows:
The normal stress, σn, of the anchored soil is:
With Equations 33 and 34, the shear strength is as follows:
where γs, φ, and ct are the density, the internal friction angle, and the time-dependent cohesion of the soil, respectively.
In the calculation process of the structure reliability, the safety margin is used to define the function, Z, of the shear strength of the anchorage material.
The limit state equation is:
where the shear stress, τ(x), and the shear strength, τf, are determined by Equations 31 and 35.
With Equations 26 and 27, the linear analysis of the function derives the time-dependent index:
Case Study
According to the bearing characteristics of the anchorage structure, a tension-bolt anchorage structure was analyzed. The soil consists of homogeneous viscous clay with a random cohesion and an internal friction angle. To study the effect of the cohesion and the internal friction angle on the time-dependent index, the effect of the soil subsystem on the anchorage stability was mainly analyzed, considering the dominate failure characteristics. In addition, the effect of the bolt subsystem and the mortar subsystem is ignored. The soil subsystem mainly affects the variability of the cohesion and the internal friction angle. Extensive studies showed that the variability coefficient of cohesion, Vc, frequently range from 0.5 to 0.8. The corresponding variability span for the internal friction angle is 0.05–0.45. On the variability coefficient of the cohesion and the internal friction angle, for the cohesive soil, the larger value is taken, while for the sand soil, the smaller value is taken. These values are negatively related to the grain size. In the present article, the initial values of the cohesion and the internal friction angle were 20 kPa and 10°, respectively. Tables 1, 2 list the other parameters.
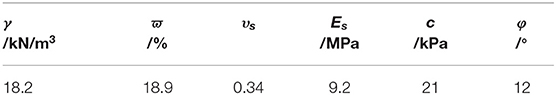
Table 1. Physical mechanical parameters of soil.

Table 2. The physical calculation parameters of anchor structure.
Figure 4 shows the relation curves of the reliability index and the main mechanical parameters. Clearly, the reliability index linearly decreases with the increase in the variability coefficient of the internal friction angle, Vϕ. Simultaneously, it exponentially decreases with the increase in the variability coefficient of cohesion, Vc. When Vc is higher than 0.3, the reliability coefficient approximates 0.4 and remains constant. Thus, the failure on the soil–anchorage interface is more sensitive to the cohesion.
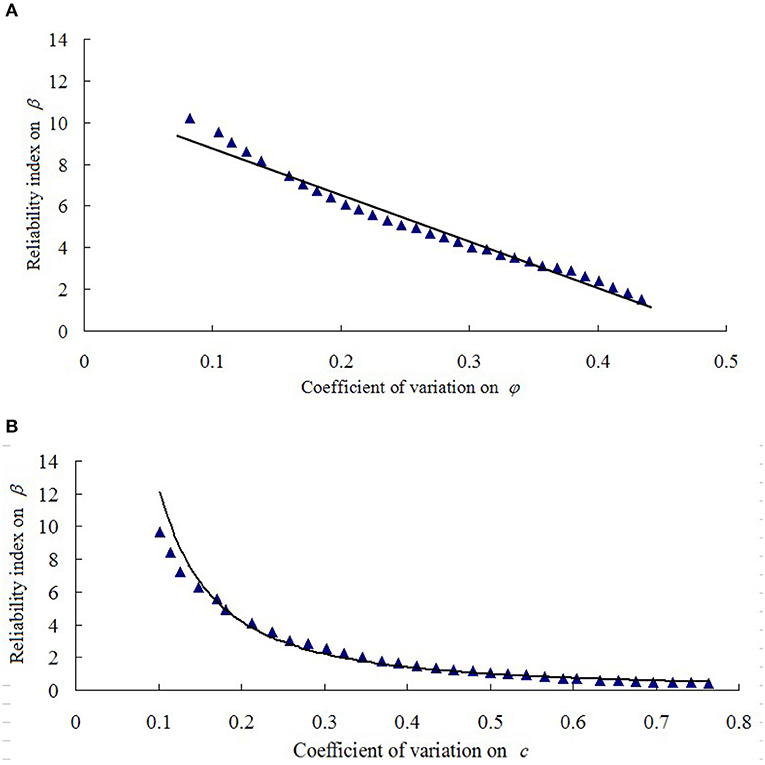
Figure 4. Curve of reliability index and shear strength: (A) Curve of the reliability index and the internal friction angle, (B) Curve of the reliability index and the cohesion.
Figure 5 shows the curve of the reliability index and the creep time. Clearly, the reliability index exponentially decreases with the increase in the creep time. In other words, the increase in the creep time can promote the failure probability.
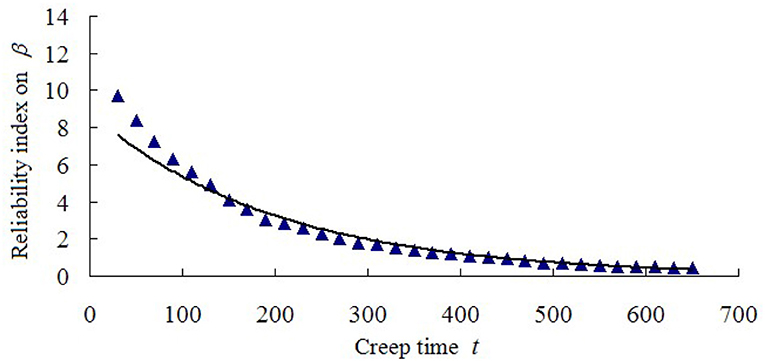
Figure 5. Curve of reliability index and creep time (Unit: h).
Conclusion
The analysis shows that the failures at the anchorage–soil interface and of the soil are dominant. According to the deformation and stress characteristics, we obtained six types of failure modes with independent failure characteristics and revealed that series failure is frequent. In addition, the non-linear creep model was established and the influence of shear stress transfer of the bolt on the accelerated creep was investigated. We further verified that the effect of the shear strength is critical to the anchorage failure mode. The shear creep results showed that the cohesion instead of the friction angle is more time-dependent. Moreover, the calculation of the random anchorage parameter and the time-dependent reliability showed that the least shear-resistant zone determines the failure scope of the anchorage. By defining the safety residual shear strength, we inferred that the reliability index is linear to the variation coefficient of the internal friction angle and is exponential to the variation coefficient of the cohesion. Furthermore, the failure at the anchorage–soil interface is more sensitive to the cohesion instead of the internal friction angle.
Data Availability Statement
The datasets analyzed in this article are not publicly available. Requests to access the datasets should be directed to the authors.
Author Contributions
JW conducted theory and application. QL conducted case. JD conducted figures.
Funding
The authors gratefully acknowledge the support from the Natural Science Foundation of Hunan Province (No. 2019JJ40056), the National Natural Science Foundation of China (No. 51804110), Scientific Research Foundation of Hunan Province Education Department (Nos. 18A345, 18B391, 19B124), and the construct program of applied specialty disciplines in Hunan province. These works are gratefully acknowledged.
Conflict of Interest
The authors declare that the research was conducted in the absence of any commercial or financial relationships that could be construed as a potential conflict of interest.
References
Cai, F., and Ugai, K. (2003). Reinforcing mechanism of anchors in slope: a numerical comparison of results of LEM and FEM. Int. J. Numer. Anal. Mech. Geomech. 27, 549–564. doi: 10.1002/nag.284
Ditlevsen, O., and Madsen, H.O. (1996). Structural Reliability Methods. New York, NY: J. Wiley & Sons.
Duncan, J. M. (2000). Factor of safety and reliability in geotechnical engineering. J. Geotech. Geoenviron. Eng. 126, 307–316. doi: 10.1061/(ASCE)1090-0241(2001)127:8(700)
Duzgun, H. S. B., Yacemen, M. S., and Korpuz, C. A. (2003). A methodology for reliability-based design of rock slopes. Rock Mech. Rock Eng. 36, 95–120. doi: 10.1007/s00603-002-0034-0
Eisawwaf, M., and Nazir, A. (2006). The effect of soil reinforcement on pullout resistance of an exiting vertical anchor plate in sand. Comput. Geotech. 33, 167–176. doi: 10.1016/j.compgeo.2006.04.001
Ivanovi, A., and Neilson, R. D. (2008). Influence of geometry and material properties on the axial vibration of a rock bolt. Int. J. Rock Mech. Min. Sci. 45, 941–951. doi: 10.1016/j.ijrmms.2007.10.003
Kahyaoglu, M. R., Onal, O., and Imanch, C. (2012). Soil arching and load transfer mechanism for slope stabilitized with piles. J. Civ. Eng. Manag. 18, 701–708. doi: 10.3846/13923730.2012.723353
Lin, H., Zhong, W. W., and Cao, P. (2013). Variational safety factors and slip surfaces of slope using three-dimensional strength reduction analysis. J. Geol. Soc. India 82, 545–552. doi: 10.1007/s12594-013-0186-4
Martin, L. B., Tijani, M., and Hadj-hassen, F. (2013). Assessment of the bolt-grout interface behaviour of fully grouted rockbolts from laboratory experiments under axial loads. Inter. J. Rock Mech. Min. Sci. 63, 50–61. doi: 10.1016/j.ijrmms.2013.06.007
Phoon, K. K., and Ching, J. (2015). Risk and Reliability in Geotechnical Engineering. London; New York, NY: Taylor & Francis, 100–455.
Sahoo, J. P., and Kumar, J. (2012). Horizontal pullout resistance for a group of two vertical plate anchors in clays. Geotech. Geol. Eng. 30, 1279–1287. doi: 10.1007/s10706-012-9537-y
Wang, Q. B., Zhang, C., and Wang, H. (2014). Study of coupling effect between anchorage force loss of prestressed anchor cable and rock and soil creep. Rock Soil Mechanics 35, 2150–2156.
Wang, Y. X., Guo, P. P., and Ren, W. X. (2017). Laboratory investigation on strength characteristics of expansive soil treated with jute fiber reinforcement. Int. J. Geomech. 17: 04017101. doi: 10.1061/(ASCE)GM.1943-5622.0000998
Wang, Z. Y., and Li, Y. P. (2008). Rheological Theory and Numerical Simulation of Rock. Mass, Beijing: Science Press.
Windsor, C. R. (1997). Rock reinforcement systems. Int. J. Rock Mech. Min. Sci. 34, 919–951. doi: 10.1016/S1365-1609(97)80004-4
Zhang, C., Pu, C., Cao, R., Jiang, T., and Huang, G. (2019). The stability and roof-support optimization of roadways passing through unfavorable geological bodies using advanced detection and monitoring methods, among others, in the sanmenxia bauxitemine in china's henan province. Bull. Eng. Geol. Environ. 78, 5087–5099. doi: 10.1007/s10064-018-01439-1
Zhang, Y. H., Wang, T. H., and Yang, J. J. (2006). Reliability analysis for existing structures considering reduction of resistances with time. J. Shandong Agric. Univ. 37, 429–435.
Zhao, Y., Wang, Y., and Tang, L. (2019a). The compressive-shear fracture strength of rock containing water based on Druker- Prager failure criterion. Arab. J. Geosci. 12:452. doi: 10.1007/s12517-019-4628-1
Zhao, Y. L., Wang, Y. X., and Wang, W. J. (2017a). Modeling of non-linear rheological behavior of hard rock using triaxial rheological experiment. Int. J. Rock Mech. Min. Sci. 93, 66–75. doi: 10.1016/j.ijrmms.2017.01.004
Zhao, Y. L., Wang, Y. X., and Wang, W. J. (2019b). Modeling of rheological fracture behavior of rock cracks subjected to hydraulic pressure and far field stresses Theor. Appli. Fract. Mech. 101, 59–66. doi: 10.1016/j.tafmec.2019.01.026
Zhao, Y. L., Zhang, L. Y., and Wang, W. J. (2017b). Transient pulse test and morphological analysis of single rock fractures. Int. J. Rock Mech. Min. Sci. 91, 139–154. doi: 10.1016/j.ijrmms.2016.11.016
Zhao, Y. L., Zhang, L. Y., Wang, W. J., Pu, C. Z., Wan, W., and Tang, J. Z. (2016). Cracking and stress–strain behavior of rock-like material containing two flaws under uniaxial compression. Rock Mech. Rock Eng. 49, 2665–2687. doi: 10.1007/s00603-016-0932-1
Keywords: anchorage, series failure mode, creep model, reliability, JC method
Citation: Wang J, Liang Q and Duan J (2020) The Creep Model of the Anchorage Structure and the Time-Dependent Reliability Analysis. Front. Earth Sci. 8:44. doi: 10.3389/feart.2020.00044
Received: 08 December 2019; Accepted: 05 February 2020;
Published: 06 March 2020.
Edited by:
Yanlin Zhao, Hunan University of Science and Technology, ChinaReviewed by:
Yixian Wang, Hefei University of Technology, ChinaJq Xiao, Anyang Normal University, China
Chunyang Zhang, Wuhan University of Technology, China
Copyright © 2020 Wang, Liang and Duan. This is an open-access article distributed under the terms of the Creative Commons Attribution License (CC BY). The use, distribution or reproduction in other forums is permitted, provided the original author(s) and the copyright owner(s) are credited and that the original publication in this journal is cited, in accordance with accepted academic practice. No use, distribution or reproduction is permitted which does not comply with these terms.
*Correspondence: Jun Wang, Mjc3MjEwNTA5JiN4MDAwNDA7cXEuY29t