 Nicolas Hawie
 Jacob A. Covault
 Zoltán Sylvester2
95% of researchers rate our articles as excellent or good
Learn more about the work of our research integrity team to safeguard the quality of each article we publish.
Find out more
ORIGINAL RESEARCH article
Front. Earth Sci. , 13 December 2019
Sec. Sedimentology, Stratigraphy and Diagenesis
Volume 7 - 2019 | https://doi.org/10.3389/feart.2019.00334
This article is part of the Research Topic Sedimentary System Responses to External Forcings: a Process-Based Perspective View all 14 articles
Submarine fans are important components of continental margins; they contain a stratigraphic record of environmental changes and host large accumulations of oil and gas. The grain size and volume of sediment supply to fans is thought to control the heterogeneity of deep-water deposits; predicting spatial variability of sandy and muddy deposits is an important applied challenge in the characterization of fans. Here, we use DionisosFlow stratigraphic-forward models to evaluate the sensitivity of submarine-fan deposition to a range of grain sizes, with corresponding diffusion coefficients ranging from 10 to 100 km2/kyr for coarse sand to silt/clay, and discharges. In general, finer grains are transported farther in our models because they have larger diffusion coefficients. Coarser grains typical of a sand-rich fan tend to pile up and compensationally stack at the mouth of a proximal feeder channel. Increasing sediment-gravity-flow discharge resulted in a thicker depositional system; however, relatively coarse sediment piled up at the mouth of the feeder channel, which created a slope that promoted basinward sediment transport. Our modeling results can be applied to predict the overall geometry, stacking, and grain-size distribution of submarine fans. Improved understanding of grain-size and discharge controls also informs interpretation of the stratigraphic record of submarine fans. For example, outcrop observations of heterogeneity and compensational stacking of depocenters can be related to changing boundary conditions, namely changes in the caliber and overall supply of sediment delivery to deep-water basin margins.
Submarine fans are deep-water depositional systems that received terrigenous sediment from canyons and channels that extend across continental margins (Piper and Normark, 2001). The deposits of fans host a relatively complete and readily dated record of environmental changes, including tectonic deformation and climate, in their upstream sedimentary systems compared to onshore records (Clift et al., 2000; Clift and Gaedicke, 2002; Romans et al., 2016). The deposits of fans are also globally important oil and gas reservoirs (Weimer and Pettingill, 2007). The reservoir properties of sandy architectural elements of submarine fans and their lateral continuity and vertical connectivity are important issues for petroleum geology (Piper and Normark, 2001). Piper and Normark (2001) suggested that the distribution of sandy architectural elements is primarily controlled by grain size and sediment supply, and the overall geometry of submarine fans is influenced by basin setting.
Forward stratigraphic modeling can be applied to predict the location and heterogeneity of depositional systems and petroleum reservoirs (Miller et al., 2008), as well as the depositional response to controlling factors (Piper and Normark, 2001). For example, in an exploration scenario with low-resolution seismic-reflection data (generally two-dimensional, 2-D, profiles with frequencies of 5–20 Hz; Normark et al., 1993; Prather et al., 2012) and no lithologic control from well penetrations, seismic-stratigraphic interpretation and structural restoration can be applied to create a paleotopographic surface for modeling the location, size, shape, and sub-seismic heterogeneity and stacking of deposits (Groenenberg et al., 2010; Aas et al., 2014; Deville et al., 2015; Hawie et al., 2017; Barabasch et al., 2019). Commonly used geostatistical methods in reservoir modeling use semivariograms, geometric parameters, and/or training images to reproduce spatial statistics from available seismic-reflection and well data (Pyrcz and Deutsch, 2014; Pyrcz et al., 2015). Recently, stratigraphic-forward modeling has been used to incorporate quantitative, process-based geologic information to constrain reservoir modeling. For example, Sacchi et al. (2016) used a depth-averaged flow in the 2-D horizontal plane, basin-scale stratigraphic-forward model called SimClast (Dalman and Weltje, 2008, 2012) to simulate fluvio-deltaic stratigraphic evolution and create a 3-D probability distribution of facies proportions. This probability cube was used as additional input for a geostatistical reservoir model. Similarly, Falivene et al. (2014) improved DionisosFlow basin-scale stratigraphic-forward model predictions of stratigraphic trap and reservoir presence by calibrating the models to independent constraints, such as thicknesses from seismic-reflection or well data.
Hawie et al. (2018) used DionisosFlow at finer temporal and spatial resolution (i.e., 103-104 yr time steps within an area of 17 × 17 km with cell sizes of 200 × 200 m) to simulate the stratigraphic evolution and sub-seismic heterogeneity of a Pleistocene submarine fan on the continental slope of tectonically active eastern Trinidad (Figure 1). A regional seismic-stratigraphic horizon was used as an initial paleotopographic surface input to the forward stratigraphic model. Over a range of time steps, compensational-stacking patterns governed the lateral continuity and vertical connectivity of sandy and muddy architectural elements of the submarine fan (Hawie et al., 2018); similar compensational stacking patterns in fans are common in other settings (e.g., Deptuck et al., 2008; Prelat et al., 2010; Jobe et al., 2017; Sweet et al., 2019). However, in all models of Hawie et al. (2018), thicknesses in the proximal areas of the models exceeded thicknesses observed in the field (Figure 2).
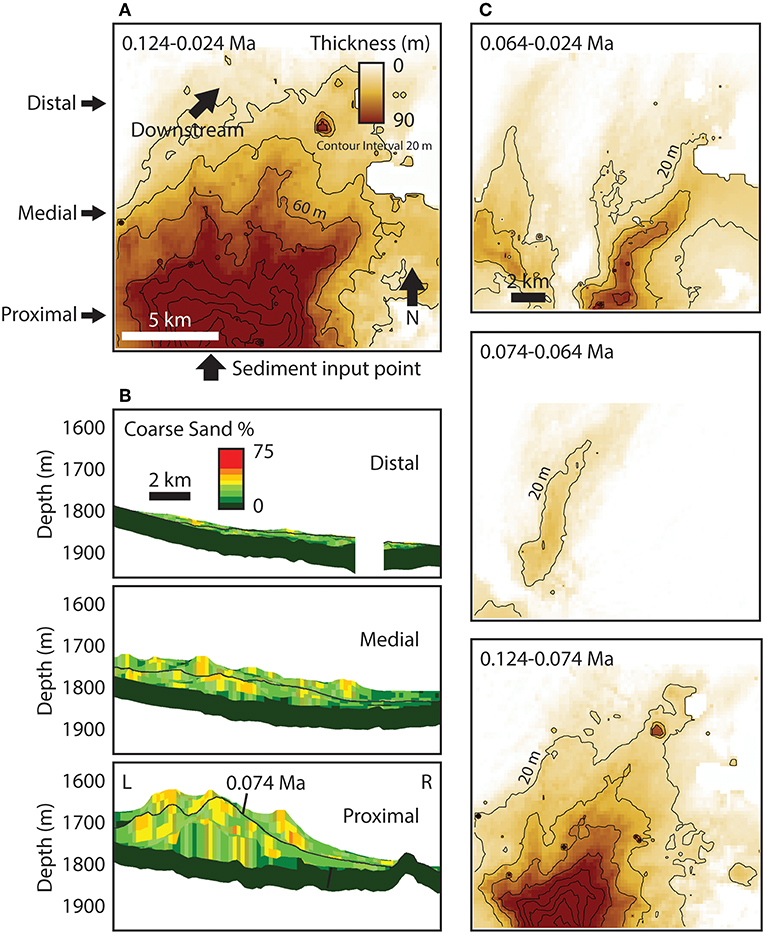
Figure 1. Reference-case model (10 kyr time step) modified from Hawie et al. (2018). (A) Isochore map of the entire model. (B) Cross sections of the model. Left (L) and right (R) orientations in cross sections are left and right in map in part (A). Cross-section locations are indicated in part (A). (C) Isochore maps of depositional sequences within the model showing major phases of sediment diversion.
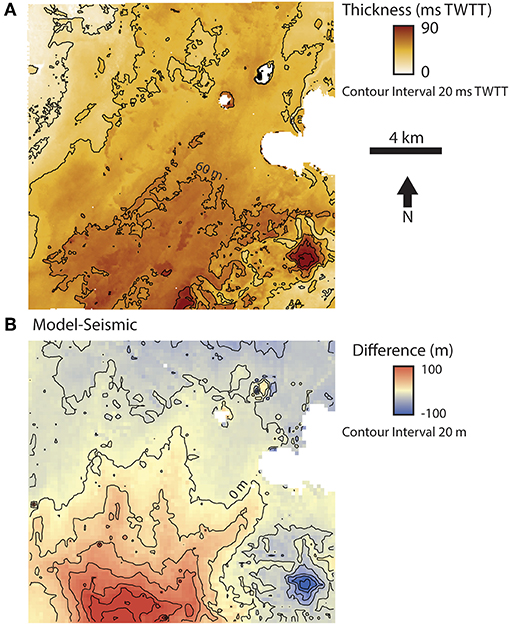
Figure 2. (A) Isochron map of the slope fan from Moscardelli et al. (2006) and Moscardelli and Wood (2008). (B) Difference in thickness between the model and the slope fan in block 25A, offshore Trinidad (modified from Hawie et al., 2018).
Here, we revise the reference-case forward stratigraphic model of Hawie et al. (2018) to achieve a better thickness match with the field example offshore Trinidad. Then, we evaluate the sensitivity of this model to input variables, namely: diffusion coefficients related to a range of grain sizes and sediment-gravity-flow discharges. We use an automated multi-simulation workflow using a Latin Hypercube Experimental Design (McKay et al., 1979) with thickness calibration to quantify the variance of thickness and sand distribution, which can be applied to de-risk petroleum-reservoir presence. Our forward stratigraphic models show the influence of key controlling factors, namely grain size, with corresponding diffusion coefficients ranging from 10 to 100 km2/kyr for coarse sand to silt/clay, and sediment supply (Piper and Normark, 2001), on fan deposition. Understanding controls can be applied to the interpretation of fan stratigraphy in outcrops and subsurface datasets (e.g., Burgess et al., 2019).
Hawie et al. (2018) used seismic-reflection horizons from the tectonically active continental slope east of the Columbus basin and along the southern margin of the Barbados accretionary wedge (Brami et al., 2000; Wood and Mize-Spansky, 2009; the “NW” depocenter between the Darien and Haydn ridges in block 25A offshore of Trinidad) to define the top and base of a submarine fan. They simulated the evolution of this fan (124.5–24.5 ka) with a series of DionisosFlow forward stratigraphic models within a domain of 17 × 17 km (200 × 200 m cell sizes), and assessed the impact of duration of time step (20, 10, 5, and 1 kyr) on sub-seismic stacking and heterogeneity of leveed-channel and lobe architectural elements (Figure 1). They used the regional seismic-reflection horizon at the base of the fan, which overlies mass-transport deposits mapped by Moscardelli et al. (2006), as the initial topography of the model. A single 300–600 m-wide feeder channel was located in the south of the model domain; it delivered grain sizes ranging from silt/clay to coarse sand. No differential subsidence was used in the model. Hawie et al. (2018) simulated the transport of relatively coarse grains: 20% coarse sand, 30% medium sand, 40% fine sand, and 10% silt/clay. The transport parameters used for the reference-case model ranged from 10 to 100 km2/kyr for water-driven diffusion (or, in the case of submarine fans, sediment-gravity-flow-driven diffusion; Kw) and 0.001–0.1 km2/kyr for slope-driven transport (Ks).
In all of the models of Hawie et al. (2018), varying the simulated time step (20, 10, 5, and 1 kyr) resulted in a similar thickness trend and compensational stacking of depocenters. All models showed three to four major phases of sediment diversion during the migration of a relatively coarse depocenter. Moreover, the overall proximal-to-distal trend from relatively coarse leveed-channel to finer lobe deposits was similar in all models. However, the proximal and distal areas of all the models exhibited thickness differences, locally greater than two-fold, compared to the field (Figure 2). In light of this previous work, we are motivated to explore two questions: (1) How can we achieve a better thickness match between model and field cases? (2) Furthermore, how do variable diffusion coefficients related to a range of grain sizes and discharges influence submarine-fan depositional patterns (Piper and Normark, 2001)?
DionisosFlow software is a 4-D process-based deterministic multi-lithology forward stratigraphic model that simulates basin filling (Granjeon, 1997, 2014; Granjeon and Joseph, 1999). A range of sedimentary processes are modeled including diffusive sediment transport, delta autoretreat, incision, large-scale avulsion, and slope failure in response to tectonic, climate, and sea-level fluctuations during millennia and longer time scales (e.g., Pinheiro-Moreira, 2000; Rabineau et al., 2005; Alzaga-Ruiz et al., 2009; Gvirtzman et al., 2014; Harris et al., 2016; Hawie et al., 2017). Detailed fluid dynamics are not considered in this model; the goal is to simulate the large-scale (102-103 m cell size) and long-term (103-105 yr time steps) evolution of basin fill.
Sediment transport equations are used to simulate the transport of various classes of grain size (e.g., clay to sand) across a basin. This stratigraphic model combines (1) linear slope-driven diffusion (transport proportional to slope), referred to as hillslope creep, and (2) non-linear water- and slope-driven diffusion, referred to as water-discharge-driven transport (Willgoose et al., 1991; Tucker and Slingerland, 1994; Granjeon, 1997; Granjeon and Joseph, 1999; Deville et al., 2015):
where Qs is sediment discharge (km3/Myr), Ks and Kw are the slope- and water-driven diffusion coefficients, respectively (km2/kyr), Qw is water discharge (m3/s), n and m are exponents that affect sediment transport capacity with values between 1 and 2 (Tucker and Slingerland, 1994), S is the dimensionless local gradient of the basin, and h (m) is topographic elevation (Granjeon, 2014). Sedimentation and erosion rates are quantified by a mass balance equation in 3-D for each class of grain size (Euzen et al., 2004). In general, if slope is not sufficiently large to promote sediment transport downstream, deposition occurs. Large Kw and Qw values can promote sediment transport across lower slopes, as indicated in Equation (1). Sediment-gravity flows, commonly turbidity currents, are the primary agents of sediment transport, erosion, and deposition in submarine fans (Bouma et al., 1985). We liken the water-driven diffusion coefficient and the water discharge to a sediment-gravity-flow-driven diffusion coefficient and gravity-flow discharge, respectively, which govern the rate of sediment transport though the system. That said, the diffusion equation (Equation 1) does not account for stratification of flow; both the velocity and concentration maxima of turbidity currents occur near the base of the flow (Sequeiros et al., 2010; Eggenhuisen and McCaffrey, 2012). Choosing Kw values for different grain sizes is a challenge because published values span orders of magnitude and they depend on many factors in addition to grain size, such as lithology, roundness, and discharge (Rivenaes, 1992; Falivene et al., 2014; Gvirtzman et al., 2014; Harris et al., 2016). Following Hawie et al. (2018), we used a range of Kw from 10 to 100 km2/kyr for coarse sand to silt/clay. In a recent publication using DionisosFlow to simulate sedimentation across a larger region offshore Trinidad, Deville et al. (2015) used a range of Kw from 100 to 1,000 km2/kyr. They used much larger Kw values in order to transport sediment across a much larger area (1,200 × 1,200 km); their individual cell sizes are nearly the size of our entire model domain (Deville et al., 2015). Ideally, we would tune diffusion coefficients to produce geometries and grain-size distribution similar to deposits of a field case (Harris et al., 2016). We created a reference-case model during an initial phase of model calibration. In lieu of grain-size information confirmed by well penetrations, we tuned the variables of the diffusion equation, Kw and Qw, to achieve a thickness trend that is similar to that published in Hawie et al. (2018) (Figure 1).
In addition to the assumptions presented above, there are limitations to the use of diffusion-based models to simulate sediment transport and deposition. For example, diffusion does not model particle-particle nor particle-fluid interactions (Equation 1). Moreover, cell size within the model domain is hundreds of meters by hundreds of meters and time steps are thousands of years; therefore, diffusion only provides an approximation of particle transport and depocenter location across the model domain during a time step. Stratigraphic forward model results should be compared to stratigraphic interpretations based on real geological and geophysical data; we compare the thickness of our model to that published in Hawie et al. (2018).
In order to achieve a better thickness match between model and the Trinidad field case of Hawie et al. (2018), we manually generated simulations of various grain sizes (i.e., sand- vs. silt/clay-rich) during 10 kyr time steps. We slightly modified some of the other input variables of Hawie et al. (2018), such as the discharges and diffusion coefficients (Table 1). Similar to Hawie et al. (2018), we used the regional seismic-reflection horizon at the base of the fan, which overlies mass-transport deposits mapped by Moscardelli et al. (2006), as the initial topography of the model. A single 300–600 m-wide feeder channel was located in the south of the model domain; it delivered grain sizes ranging from silt/clay to coarse sand. We extended the model domain 5 km to the south (17 km wide × 22 km long) to better match the feeder-channel location observed in the seismic-reflection data (Figure 3). Sediment enters the model domain from the south (Figure 3A). Once we improved the thickness match with the field case of Hawie et al. (2018), we tested two experimental designs: (1) 80–20% silt/clay proportion (22 simulations) and (2) ±20% gravity-flow discharge (22 simulations). We performed multiple automated simulations using a Latin Hypercube Experimental Design to quantify the standard deviations of thickness and sand-depositional patterns. Latin Hypercube Experimental Design samples variables from uniform distributions and ensures that the ensemble of samples is representative of the natural variability of the system, contrary to simple random sampling in Monte Carlo studies (McKay et al., 1979). In statistical sampling, a square grid containing sample positions is a Latin square if there is only one sample in each row and each column. A Latin Hypercube is the generalization of this concept to an arbitrary number of variables, whereby each sample is the only one in each axis-aligned hyperplane containing it. When sampling a function of N variables, the range of each variable is divided into M equally probable intervals. M sample points are then placed to satisfy the Latin Hypercube requirements; this forces the number of intervals, M, to be equal for each variable. The maximum number of combinations for a Latin Hypercube of N variables and M intervals can be computed with the following equation (Audze and Eglais, 1977; McKay et al., 1979; Iman et al., 1980, 1981):
The following are features of Latin Hypercube Experimental Design: (1) it treats every variable as equally important and ensures uniformly distributed sampling; (2) it samples the full range of a variable; (3) it allows for multiple, multidimensional variables (e.g., 1-D sediment load and/or 3-D topographic variables); and (4) we, the designers, determine the number of simulations, which include output grids of properties for comparison to a reference case (Hawie et al., 2017).
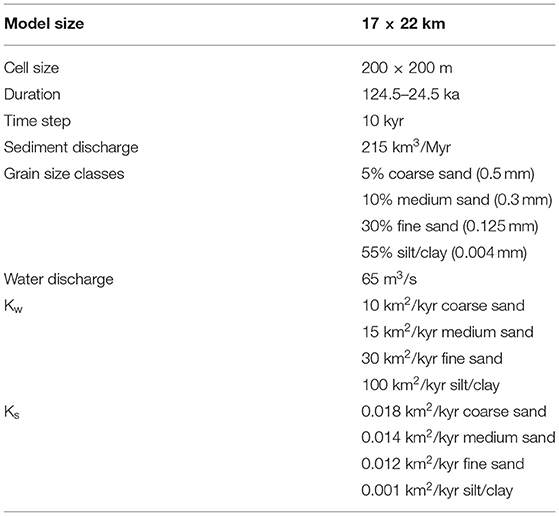
Table 1. Reference-case model inputs.
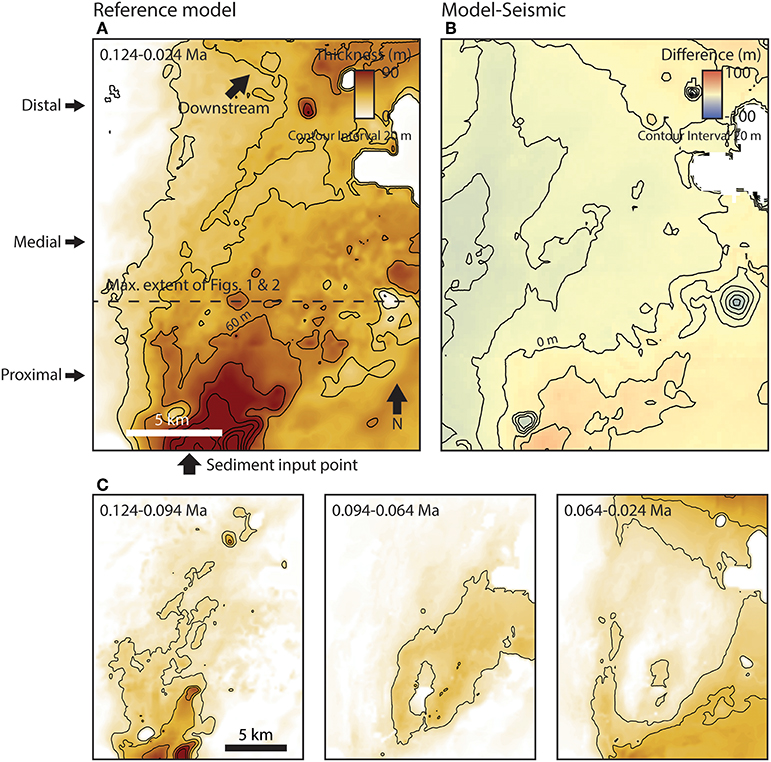
Figure 3. New extended reference-case model. (A) Isochore map of the new model. (B) Difference in thickness of the model and the slope fan in block 25A, offshore Trinidad (Hawie et al., 2018). (C) Isochore maps of depositional sequences within the model showing major phases of sediment diversion.
Some caveats to our experimental designs include: (1) we restricted our model domain to the submarine fan, excluding the upstream canyon-channel system; and (2) we opened the northern boundary of the model and closed the eastern and western boundaries. Focusing only on the submarine fan required us to strongly vary diffusion coefficients in order to achieve a fan shape (e.g., Hawie et al., 2018). For example, more diffusion is required to produce the relatively flat, sheet-like geometries of the distal fan.
We improved the thickness match between our manually calibrated stratigraphic-forward model and the field case of Hawie et al. (2018) by modifying the grain-size inputs to be 5% coarse sand (10 km2/kyr), 10% medium sand (15 km2/kyr), 30% fine sand (30 km2/kyr), and 55% silt/clay (100 km2/kyr) (Figure 3B). This grain-size distribution is more similar to mud-rich continental margins (e.g., Reading and Richards, 1994), such as offshore Trinidad, compared to the relatively sand-rich models of Hawie et al. (2018). Approximately 1/3 of the total sediment load was transported beyond the northern boundary of the model, and ~80% of this sediment load was silt/clay. Although we improved the thickness match, especially in the proximal and central parts of the model domain, with model-thickness values >75% of the field case, there is still a mismatch in the western and thinner, peripheral parts of the model (~30–60% of the field case). The overall architecture of the model is similar to the models of Hawie et al. (2018): compensationally stacked proximal leveed-channel depositional elements transition downstream to lobes (Figures 3C, 4; Supplementary Animations 1, 2). The model output shows at least four phases of depocenter migration (Figures 3C, 4; Supplementary Animations 1, 2). Initially, the depocenter was oriented southwest-to-northeast (0.124–0.104 Ma), then it shifted to the west and was oriented more south-to-north (0.104–0.094 Ma), followed by a more gradual shift to the east (0.094–0.064 Ma), where it split into three channels covering the model domain, and it was predominantly oriented southwest-to-northeast at the end of the simulation (0.054–0.024 Ma) (Figure 3C; Supplementary Animations 1, 2).
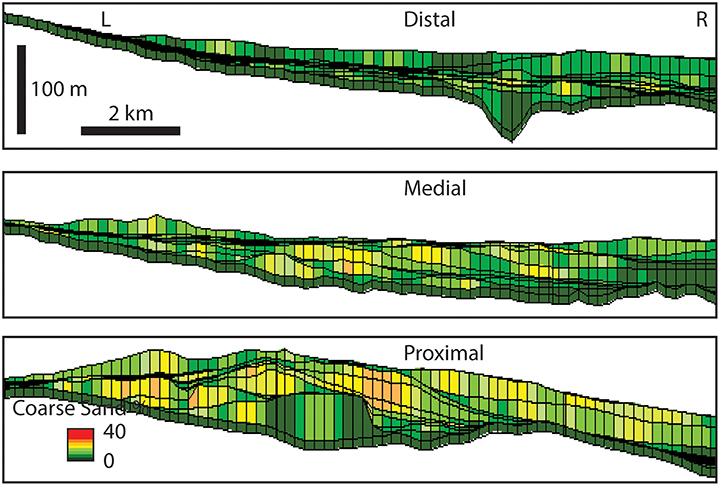
Figure 4. Cross sections of the new extended reference-case model. Left (L) and right (R) orientations in cross sections are left and right in map in Figure 3A.
Following this initial phase of manual calibration, we implemented the two experimental designs. In the first experimental design, we varied silt/clay load, hereafter simply called mud load, 80–20%. Figures 5, 6 show the thicknesses and the distributions of coarse and medium sand in the maximum and minimum mud-load simulations (Supplementary Animations 3–6). Lower mud load results in relatively thick accumulations in the northeast distal part of the model domain, immediately downstream from the feeder channel; higher mud load results in a relatively thick band across the northern, central, and eastern regions of the model (Figure 7A). Both high- and low-mud-load cases resulted in similar patterns of shifting depocenters (Figures 5, 6; Supplementary Animations 3–6). The map of thickness standard deviation of the 22 simulations shows larger variance in thickness (± nearly 20 m) near the proximal feeder channel (Figure 7C). The thickness standard deviation is also greater along channel forms extending to the northeast away from the feeder channel (Figure 7C). At first glance, the coarse and medium sand proportion maps look similar in both the high and low mud-load simulations (Figures 5, 6). However, the map of sand proportion standard deviation shows large variance (± >10%) along the boundaries of the model domain, especially the western and southeastern boundaries (Figure 7E).
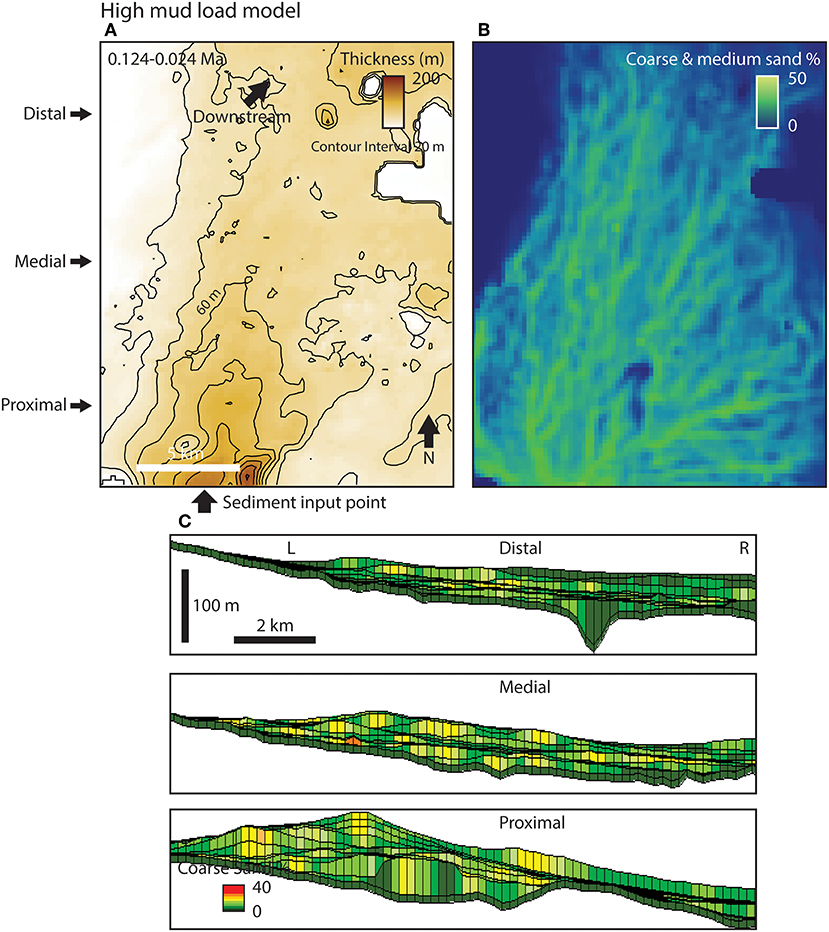
Figure 5. (A) Isochore map of the high mud load model. (B) Coarse and medium sand percentage within the model. (C) Proximal, medial, and distal cross sections showing the coarse sand content in the model. Left (L) and right (R) orientations in cross sections are left and right in maps. Cross-section locations are indicated in part (A).
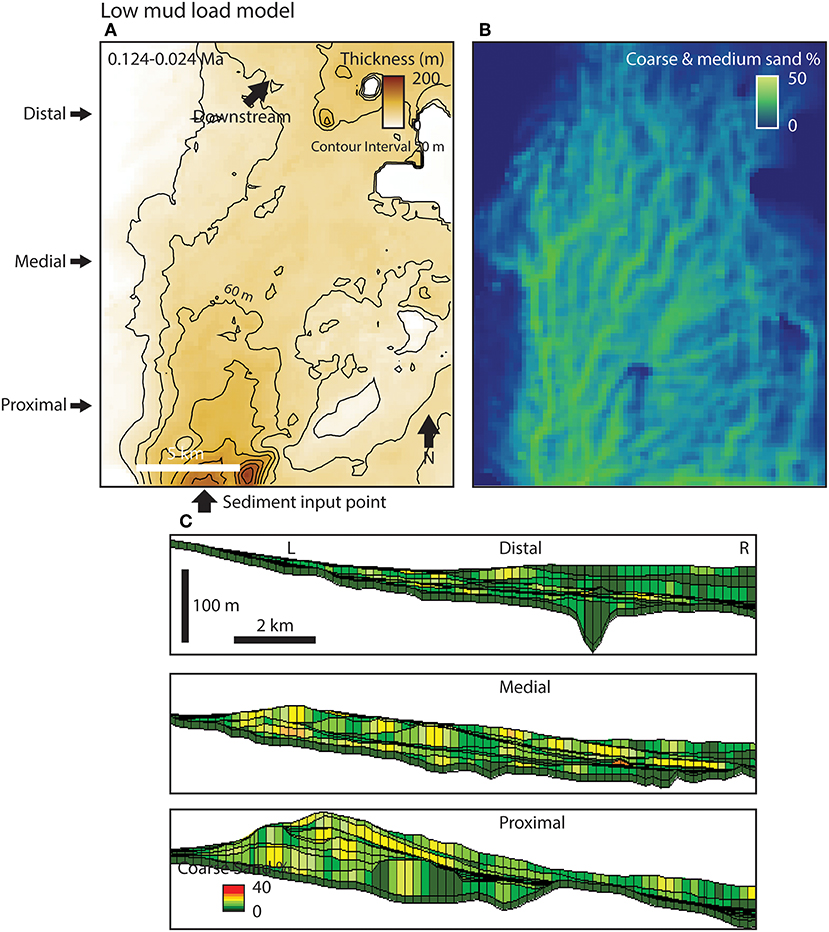
Figure 6. (A) Isochore map of the low mud load model. (B) Coarse and medium sand percentage within the model. (C) Proximal, medial, and distal cross sections showing the coarse sand content in the model. Left (L) and right (R) orientations in cross sections are left and right in maps. Cross-section locations are indicated in part (A).
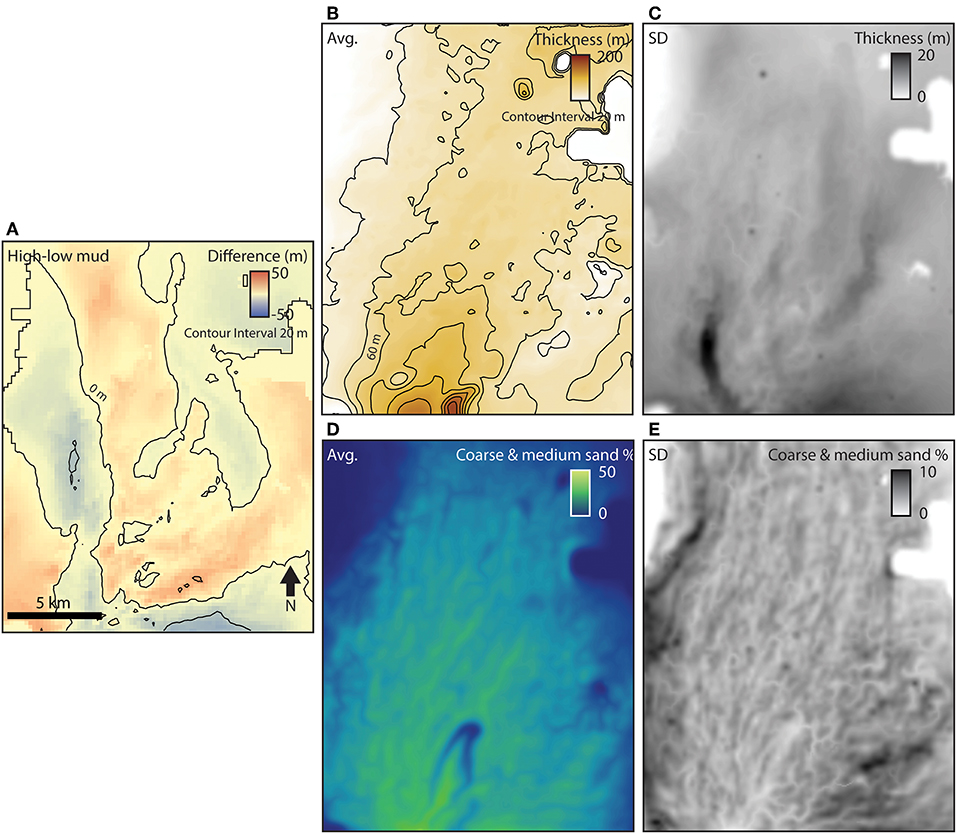
Figure 7. (A) Difference in thickness between the high and low mud load models. (B–E) Simulation results. (B) Average of thicknesses. (C) Standard deviation of thicknesses. (D) Average of coarse and medium sand percentages. (E) Standard deviation of coarse and medium sand percentages.
In the second experimental design, we varied the sediment-gravity-flow discharge ±20% relative to the manually calibrated model. Figures 8, 9 show the thicknesses and the distributions of coarse and medium sand in the maximum (+20%) and minimum (−20%) discharge simulations (Supplementary Animations 7–10). Discharge appears to play an important role in thickness difference, with nearly uniformly greater thickness corresponding with higher discharge (Figure 10A). In detail, higher discharge results in fewer major depocenters (at least two to three dominant depocenter- and channel-orientation directions) compared to lower discharge (similar to the manually calibrated model, at least four or five major depocenters) (Figures 8, 9; Supplementary Animations 7–10). Moreover, the largest difference in thickness, with excess thickness in the case of higher discharge, is observed in the most proximal and distal parts of the model (Figure 10A). The map of thickness standard deviation of the 22 simulations shows larger variance (± nearly 20 m) in the central region of the model domain, extending from the proximal feeder channel basinward to the northern distal part (Figure 10C). As in the first experimental design, the coarse and medium sand proportion maps look similar in both the maximum and minimum discharge simulations (Figures 8, 9). The map of sand proportion standard deviation of the 22 simulations shows larger variance (± nearly 10%) along the northwestern region of the model domain (Figure 10E).
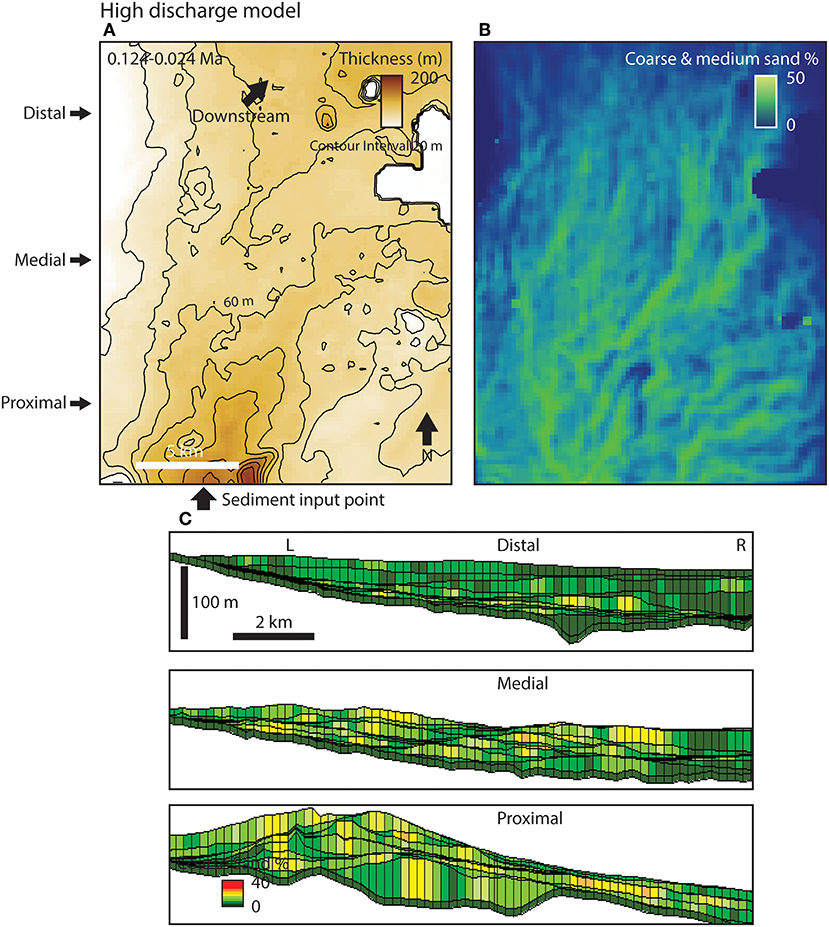
Figure 8. (A) Isochore map of the high discharge model. (B) Coarse and medium sand percentage within the model. (C) Proximal, medial, and distal cross sections showing the coarse sand content in the model. Left (L) and right (R) orientations in cross sections are left and right in maps. Cross-section locations are indicated in part (A).
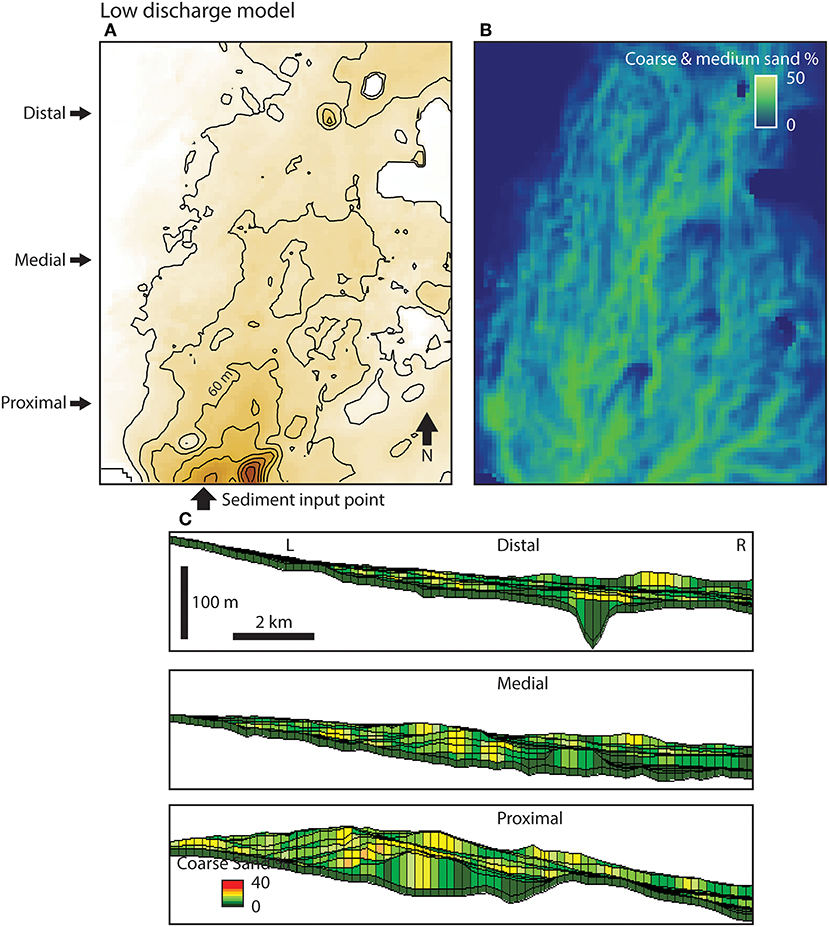
Figure 9. (A) Isochore map of the low discharge model. (B) Coarse and medium sand percentage within the model. (C) Proximal, medial, and distal cross sections showing the coarse sand content in the model. Left (L) and right (R) orientations in cross sections are left and right in maps. Cross-section locations are indicated in part (A).
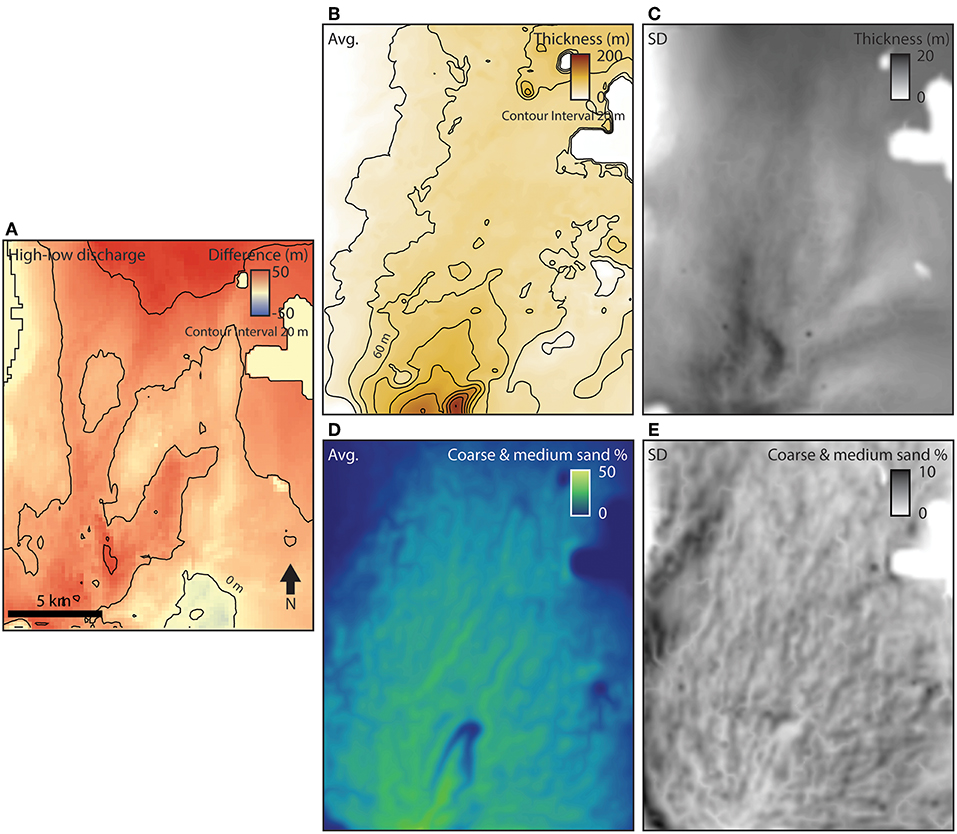
Figure 10. (A) Difference in thickness between the high and low discharge models. (B–E) Simulation results. (B) Average of thicknesses. (C) Standard deviation of thicknesses. (D) Average of coarse and medium sand percentages. (E) Standard deviation of coarse and medium sand percentages.
We improved the thickness match between our manually calibrated stratigraphic-forward model and the field case of Hawie et al. (2018) by modifying the grain-size inputs to be finer (Figure 3). In our modeling, sediment discharge is a function of the diffusion coefficient Kw (Equation 1), which is larger for smaller grain sizes (Table 1). So, larger grain sizes assigned smaller Kw values will tend to pile up at the mouth of the feeder channel, like in the models of Hawie et al. (2018). By modifying the grain sizes in our new manually calibrated model to be finer, with correspondingly larger Kw values, the sediment-transport equations of the model diffused sediment farther across the model domain and achieved a better match with the field. Similar to Hawie et al. (2018), the model shows repeated cycles of channel avulsion, compensational stacking, and unconfined deposition at the mouths of channels (e.g., Sun et al., 2010). In particular, compensational stacking is a key characteristic of submarine-fan deposits (e.g., Deptuck et al., 2008), and our results show that relatively simple diffusion-based models can produce realistic compensation patterns. In our model, topographic build up by deposition promotes compensation and depocenter migration around the model domain. However, the thickness of compensationally stacked depocenters in the proximal region of the model, near the feeder channel, is less pronounced than in the models of Hawie et al. (2018). This is because our new model comprises relatively fine grains with larger diffusion coefficients, which are more easily transported over topography and generate an overall smoother, more elongate fan geometry.
The first experimental design highlights the influence of changes in diffusion coefficients related to a range of grain sizes on fan deposition (Figures 5–7; Supplementary Animations 3–6). In the higher-mud-load case, a relatively thick band of deposits is spread across the northern, central, and eastern regions of the model as a result of the larger diffusion coefficient Kw (Equation 1) of finer sediment compared to the lower-mud-load case (Figure 7A). The larger diffusion coefficient promotes the basinward transport of finer sediment across the model. In the lower-mud-load case, coarser sediment piles up at the mouth of the feeder channel, which creates a steeper proximal slope that bypasses sediment to the distal northeast part of the model (Figure 8A). Moreover, the lower-mud-load case is relatively thick near the western and southeastern boundaries of the model domain, reflecting more compensational stacking (Figure 6). As diffusion is predominantly driven by slope and the diffusion coefficient, higher slopes and lower diffusion coefficients will promote more topographically directed, compensationally stacked deposits. The difference in depocenters in the high- vs. low-mud-load cases is also reflected in the maps of thickness and sand proportion standard deviations; the largest variance in thicknesses of the 22 simulations is at the mouth of the feeder channel in the proximal, central region of the model domain, and the largest variance in sand is at the western and southeastern boundaries of the model domain, where thicker, coarser deposits accumulated in the lower-mud-load case (Figure 7).
The second experimental design highlights the influence of sediment-gravity-flow discharge on fan deposition (Figures 8–10; Supplementary Animations 7–10). Intuitively, higher discharge (+20%) results in a thicker depositional system (Figure 10A). However, higher discharge results in fewer major depocenters because, initially, voluminous relatively coarse sediment accumulates in front of the proximal feeder channel and builds up a slope that dominates the direction of sediment transport during the simulation. The buildup of a slope in the proximal region of the model promotes bypass of finer sediment to the distal region, thereby causing some of the largest thickness differences between the high and low discharge cases along a region extending from the proximal feeder channel basinward to the northern distal part of the model (Figure 10A). Moreover, the largest variance in thicknesses of the 22 simulations is along this north-to-south region, where thickness probably depends on whether high enough discharge promotes the development of a single major north-to-south depocenter, as in the higher discharge case (Figure 10C). The large variance in sand proportions of the 22 simulations is located in the northwest because sandy depocenters did not visit that region of the model domain in every simulation (Figure 10E). In contrast, the central region is immediately down slope of the proximal feeder channel and consistently received the bulk of the relatively coarse sediment load. Mud transport is less sensitive to topography and, as a result, can more easily spread uniformly across the model.
The primary goals of our experiments were to understand the submarine-fan depositional response to changes in diffusion coefficients related to a range of grain sizes and discharges. In the models of Hawie et al. (2018), thicknesses in proximal areas exceeded thicknesses observed in the field. We increased the proportion of mud (i.e., silt/clay), with correspondingly larger Kw values, to the model by a factor of 5.5 in order to improve the thickness match between our reference-case model and the field case of Hawie et al. (2018). Rather than sand piling up in the proximal region of the model, at the mouth of the feeder channel, a mixed sediment load was more uniformly distributed across the model. Indeed, this is consistent with general models of submarine-fan run-out based on their mud- vs. sand-rich sediment supply (e.g., Reading and Richards, 1994; Richards et al., 1998). Some of the largest, longest run-out submarine fans in the world are characterized as mud rich with highly “efficient” sediment transport (Richards et al., 1998; and references therein). Finer grain sizes are transported farther in our model; this has also been demonstrated for deposition on natural submarine-fan systems, such as the Amazon fan (Pirmez and Imran, 2003), and in physical experiments (Baas et al., 2004). Simple models of sediment transport and deposition using an advection-settling scheme also predict this behavior (Straub et al., 2008; and references therein). For example:
where the distance the particle travels (x) is equal to the velocity of the particle (U) multiplied by the of the initial height of the particle above the bed (zi) divided by the particle settling velocity (ws). Although this advection-settling scheme is different than how Equation (1) diffuses sediment across our model domain, it supports our experimental results that show, in general, keeping all other variables constant, a finer, slower settling grain will be transported a longer distance compared to a coarser, faster settling grain.
We also explored an experimental design of variable mud load (80–20%). Decreasing mud load (i.e., increasing sand load) resulted in more widely distributed, coarser depocenters across the model, from the western to southeastern boundary of the model domain (Figure 7A). This is consistent with conceptual models of sandy submarine fans based on outcrops and high-resolution, shallow-subsurface data in tectonically active settings; they tend to have limited channel extension and more frequent avulsions associated with steep basin-margin slopes (Hoyal et al., 2014). These concepts have been further developed in physical experiments (e.g., Spinewine et al., 2009; Hamilton et al., 2015; Postma et al., 2016) and reduced-complexity modeling of submarine-fan evolution over an evolving topography (e.g., Burgess et al., 2019). Although our models do not capture the high-resolution detail of morphodynamic interaction between flow and topography as in some physical experiments, including a potentially important hydraulic jump flow transformation and resultant depositional architecture (Mutti and Normark, 1987), our models show sandier sediment supply associated with the general trend of more frequent avulsions resulting in a larger number of depocenters.
Increasing sediment-gravity-flow discharge had the intuitive result of overall thicker deposits. However, this also resulted in fewer depocenters because relatively coarse sediment piled up at the mouth of the feeder channel, which created a slope that promoted basinward sediment transport along a dominant south-to-north fairway. Piper and Normark (2001), in their analysis of the distribution of sandy and muddy architectural elements of submarine fans, interpreted that steepening of proximal channels promotes basinward sand bypass and the development of a pattern of sand distribution similar to detached lobes of Mutti (1979), with lobe deposition displaced from the limit of sandy channel deposition. Although this interpretation was related to depositional patterns of channels and lobes in response to avulsions on the Amazon fan (Pirmez and Flood, 1995), steeper channels appear to promote basinward sediment bypass in our models as well (Figures 8–10).
Our modeling results can be applied to predict the overall geometry, stacking, and grain-size distribution of submarine-fan oil and gas reservoirs. In tectonically active, stepped-slope profiles, like offshore eastern Trinidad, increasing sand delivery to deep water (e.g., Moscardelli et al., 2012), can result in more compensational stacking of relatively sand-rich, proximal depocenters (Piper and Normark, 2001). Increasing sediment supply, but maintaining grain-size distribution, can result in basinward sediment transport along a dominant fairway, thereby potentially producing isolated, “detached lobe” depositional architectures downstream of primary feeder channels. Our modeling also informs the interpretation of the depositional record of submarine fans. Observing some of the aforementioned depositional patterns, such as more/less frequent avulsions and compensational stacking of depocenters (e.g., Straub and Pyles, 2012), can be interpreted in the context of changing boundary conditions, namely changes in the caliber and overall supply of sediment to deep water. In order to better understand the results of our modeling experiments, we maintain our input variables (e.g., silt/clay proportion and discharge) as constant for the entire simulation time of 100 kyr. Of course, in nature, boundary conditions change during periods as long as 100 kyr, and future work will follow some of the more recent forward modeling work of Sylvester et al. (2015) and Burgess et al. (2019), which vary inputs, including substrate mobility and discharge. We also aim to pursue more numerous simulations, of the order of thousands, in order to achieve better calibration with the subsurface; new developments in high-performance parallelized computing processes can accelerate computations of high-resolution DionisosFlow models by as many as five times (Granjeon et al., 2018).
We used DionisosFlow forward stratigraphic models to understand the submarine-fan depositional response to changes in diffusion coefficients related to a range of grain sizes and discharges. Finer-grained loads were transported farther across the model domain; coarser loads resulted in the active migration of the depocenter across the model domain. This is consistent with general models of submarine-fan run-out and compensational stacking based on their mud- vs. sand-rich sediment supply. Higher discharge resulted in a thicker depositional system, but fewer channel avulsions because an initial relatively coarse-grained sediment buildup at the mouth of the proximal feeder channel promoted bypass of finer sediment to the distal region of the model domain. Our modeling results can be applied to predict the depositional architecture of submarine fans; changes in diffusion coefficients related to a range of grain sizes and discharges have an effect on the overall geometry, stacking, and heterogeneity of our models. Our results can also be applied to the interpretation of fan stratigraphy in outcrops and subsurface datasets. For example, observations of compensational stacking in outcrops can be related to changes in sediment supply to the depositional system. Our future work will evaluate the depositional response to temporally varying the inputs of more numerous simulations. We envision thousands of simulations to generate facies probability maps to be integrated in reservoir models.
All datasets generated for this study are included in the article/Supplementary Material.
NH, JC, and ZS designed the experiments and wrote the manuscript. NH performed the experiments. NH and JC created figures.
The authors declare that the research was conducted in the absence of any commercial or financial relationships that could be construed as a potential conflict of interest.
The reviewer CO declared a shared affiliation, with no collaboration, with one of the authors, JC and ZS, to the handling editor at time of review.
We thank the sponsors of the Quantitative Clastics Laboratory (http://www.beg.utexas.edu/qcl) and Beicip-Franlab for access to DionisosFlow and CougarFlow forward stratigraphic modeling and multi-simulation software. We are grateful for thought-provoking comments from Tim Demko and Mauricio Perillo, as well as recommendations from reviewers Michal Janocko, Cornel Olariu, and Ian Kane and editors David Hodgson and William Helland-Hansen.
The Supplementary Material for this article can be found online at: https://www.frontiersin.org/articles/10.3389/feart.2019.00334/full#supplementary-material
Supplementary Animation 1. Reference case model of the coarse sand distribution (overhead view).
Supplementary Animation 2. Reference case model of the coarse sand distribution (perspective view).
Supplementary Animation 3. High mud load model of the coarse sand distribution (overhead view).
Supplementary Animation 4. High mud load model of the coarse sand distribution (perspective view).
Supplementary Animation 5. Low mud load model of the coarse sand distribution (overhead view).
Supplementary Animation 6. Low mud load model of the coarse sand distribution (perspective view).
Supplementary Animation 7. High discharge model of the coarse sand distribution (overhead view).
Supplementary Animation 8. High discharge model of the coarse sand distribution (perspective view).
Supplementary Animation 9. Low discharge model of the coarse sand distribution (overhead view).
Supplementary Animation 10. Low discharge model of the coarse sand distribution (perspective view).
Aas, T. E., Basani, R., Howell, J., and Hansen, E. (2014). Forward modelling as a method for predicting the distribution of deep-marine sands: an example from the Peïra Cava Sub-basin. Geol. Soc. Lond. Spec. Publ. 387, 247–269. doi: 10.1144/SP387.9
Alzaga-Ruiz, H., Granjeon, D., Lopez, M., Seranne, M., and Roure, F. (2009). Gravitational collapse and Neogene sediment transfer across the western margin of the Gulf of Mexico: insights from numerical models. Tectonophysics 470, 21–41. doi: 10.1016/j.tecto.2008.06.017
Audze, P., and Eglais, V. (1977). New approach to design of experiments. Probl. Dyn. Strength 35, 104–107.
Baas, J. H., Van Kesteren, W., and Postma, G. (2004). Deposits of depletive high-density turbidity currents: a flume analogue of bed geometry, structure and texture. Sedimentology 51, 1053–1088. doi: 10.1111/j.1365-3091.2004.00660.x
Barabasch, J., Ducros, M., Hawie, N., Daher, S. B., Nader, F. H., and Littke, R. (2019). Integrated 3D forward stratigraphic and petroleum system modeling of the Levant Basin, Eastern Mediterranean. Basin Res. 31, 228–252. doi: 10.1111/bre.12318
Bouma, A. H., Normark, W. R., and Barnes, N. E. (1985). Submarine Fans and Related Turbidite Systems. Berlin; New York, NY: SpringerVerlag Inc. doi: 10.1007/978-1-4612-5114-9
Brami, T. R., Pirmez, C., Archie, C., Heeralal, S., and Holman, K. L. (2000). “Late Pleistocene deep-water stratigraphy and depositional processes, offshore Trinidad and Tobago,” in Deep-Water Reservoirs of the World: Gulf Coast Section Sepm 20th Annual Research Conference (Houston, TX), 104–115. doi: 10.5724/gcs.00.15.0104
Burgess, P. M., Masiero, I., Toby, S. C., and Duller, R. A. (2019). A big fan of signals? Exploring autogenic and allogenic process and product in a numerical stratigraphic forward model of submarine-fan development. J. Sediment. Res. 89, 1–12. doi: 10.2110/jsr.2019.3
Clift, P. D., Degnan, P., Hannigan, R., and Blusztajn, J. (2000). Sedimentary and geo-chemical evolution of the Dras forearc basin, Indus suture, Ladakh Himalaya, India. Geol. Soc. Am. Bull. 112, 450–466. doi: 10.1130/0016-7606(2000)112<450:SAGEOT>2.0.CO;2
Clift, P. D., and Gaedicke, C. (2002). Accelerated mass flux to the Arabian Sea during the middle to late Miocene. Geology 30, 207–210. doi: 10.1130/0091-7613(2002)030<0207:AMFTTA>2.0.CO;2
Dalman, R. A., and Weltje, G. J. (2008). Sub-grid parameterisation of fluvio-deltaic processes and architecture in a basin-scale stratigraphic model. Comput. Geosci. 34, 1370–1380. doi: 10.1016/j.cageo.2008.02.005
Dalman, R. A., and Weltje, G. J. (2012). SimClast: an aggregated forward stratigraphic model of continental shelves. Comput. Geosci. 38, 115–126. doi: 10.1016/j.cageo.2011.05.014
Deptuck, M. E., Piper, D. J., Savoye, B., and Gervais, A. (2008). Dimensions and architecture of late Pleistocene submarine lobes off the northern margin of East Corsica. Sedimentology 55, 869–898. doi: 10.1111/j.1365-3091.2007.00926.x
Deville, E., Mascle, A., Callec, Y., Huyghe, P., Lallemant, S., Lerat, O., et al. (2015). Tectonics and sedimentation interactions in the east Caribbean subduction zone: an overview from the Orinoco delta and the Barbados accretionary prism. Mar. Petroleum Geol. 64, 76–103. doi: 10.1016/j.marpetgeo.2014.12.015
Eggenhuisen, J. T., and McCaffrey, W. D. (2012). The vertical turbulence structure of experimental turbidity currents encountering basal obstructions; implications for vertical suspended sediment distribution in non-equilibrium currents. Sedimentology 59, 1101–1120. doi: 10.1111/j.1365-3091.2011.01297.x
Euzen, T., Joseph, P., Du Fornel, E., Lesur, S., Granjeon, D., and Guillocheau, F. (2004). Three-dimensional stratigraphic modelling of the Grès d'Annot system, Eocene-Oligocene, SE France. Geol. Soc. London Spec. Publ. 221, 161–180. doi: 10.1144/GSL.SP.2004.221.01.09
Falivene, O., Frascati, A., Gesbert, S., Pickens, J., Hsu, Y., and Rovira, A. (2014). Automatic calibration of stratigraphic forward models for predicting reservoir presence in exploration. AAPG Bull. 98, 1811–1835. doi: 10.1306/02271413028
Granjeon, D. (1997). Modélisation stratigraphique déterministe: conception et applications d'un modéle diffusif 3 D multilithologique (Ph.D. dissertation). Université de Rennes, Rennes.
Granjeon, D. (2014). “3D forward modelling of the impact of sediment transport and base level cycles on continental margins and incised valleys,” in Depositional Systems to Sedimentary Successions on the Norwegian Continental Margin: International Association of Sedimentologists, Vol. 46, eds A. W. Martinius, R. Ravnås, J. A. Howell, R. J. Steel, and J. P. Wonham (Chichester: John Wiley & Sons), 453–472. doi: 10.1002/9781118920435.ch16
Granjeon, D., Have, P., Coatleven, J., Pegaz-Fiornet, S., and Chauveau, B. (2018). “High performance stratigraphic modeling of shelf to deep-water plays,” in AAPG 2018 Annual Convention and Exhibition (Salt Lake City, UT).
Granjeon, D., and Joseph, P. (1999). “Concepts and applications of a 3-D multiple lithology, diffusive model in stratigraphic modeling,” in Numerical Experiments in Stratigraphy: Recent Advances in Stratigraphic and Sedimentologic Computer Simulations, Vol. 62, eds J. W. Harbaugh, W. L. Watney, E. C. Rankey, R. Slingerland, R. H. Goldstein, and E. K. Franseen (Tulsa, OK: SEPM Society for Sedimentary Geology), 197–210. doi: 10.2110/pec.99.62.0197
Groenenberg, R. M., Hodgson, D. M., Prelat, A., Luthi, S. M., and Flint, S. S. (2010). Flow–deposit interaction in submarine lobes: insights from outcrop observations and realizations of a process-based numerical model. J. Sediment. Res. 80, 252–267. doi: 10.2110/jsr.2010.028
Gvirtzman, Z., Csato, I., and Granjeon, D. (2014). Constraining sediment transport to deep marine basins through submarine channels: the Levant margin in the Late Cenozoic. Mar. Geol. 347, 12–26. doi: 10.1016/j.margeo.2013.10.010
Hamilton, P. B., Strom, K. B., and Hoyal, D. C. (2015). Hydraulic and sediment transport properties of autogenic avulsion cycles on submarine fans with supercritical distributaries. J. Geophys. Res. Earth Surface 120, 1369–1389. doi: 10.1002/2014JF003414
Harris, A. D., Covault, J. A., Madof, A. S., Sun, T., Sylvester, Z., and Granjeon, D. (2016). Three-dimensional numerical modeling of Eustatic control on continental-margin sand distribution. J. Sediment. Res. 86, 1434–1443. doi: 10.2110/jsr.2016.85
Hawie, N., Covault, J. A., Dunlap, D., and Sylvester, Z. (2018). Slope-fan depositional architecture from high-resolution forward stratigraphic models. Mar. Petrol. Geol. 91, 576–585. doi: 10.1016/j.marpetgeo.2017.12.033
Hawie, N., Deschamps, R., Granjeon, D., Nader, F. H., Gorini, C., Muller, C., et al. (2017). Multi-scale constraints of sediment source to sink systems in frontier basins: A forward stratigraphic modeling case study of the Levant region. Basin Res. 29, 418–445. doi: 10.1111/bre.12156
Hoyal, D. C. H., Demko, T., Postma, G., Wellner, R. W., Pederson, K., Abreu, V., et al. (2014). “Evolution, architecture and stratigraphy of Froude supercritical submarine fans,” in American Association of Petroleum Geologists Annual Convention and Exhibition (Houston, TX).
Iman, R. L., Davenport, J. M., and Zeigler, D. K. (1980). Latin Hypercube Sampling (Program User's Guide). Albuquerque, NM: Department of Energy, Sandia Laboratories.
Iman, R. L., Helton, J. C., and Campbell, J. E. (1981). An approach to sensitivity analysis of computer models: Part I—Introduction, input variable selection and preliminary variable assessment. J. Qual. Technol. 13, 174–183. doi: 10.1080/00224065.1981.11978748
Jobe, Z. R., Sylvester, Z., Howes, N., Pirmez, C., Parker, A., Cantelli, A., et al. (2017). High-resolution, millennial-scale patterns of bed compensation on a sand-rich intraslope submarine fan, western Niger Delta slope. GSA Bull. 129, 23–37. doi: 10.1130/B31440.1
McKay, M. D., Beckman, R. J., and Conover, W. J. (1979). Comparison of three methods for selecting values of input variables in the analysis of output from a computer code. Technometrics 21, 239–245. doi: 10.1080/00401706.1979.10489755
Miller, J. K., Sun, T., Li, H., Stewart, J., Genty, C., Li, D., et al. (2008). “Direct modeling of reservoirs through forward process-based models: can we get there?” in International Petroleum Technology Conference (Kuala Lumpur). doi: 10.2523/12729-MS
Moscardelli, L., and Wood, L. (2008). New classification system for mass transport complexes in offshore Trinidad. Basin Res. 20, 73–98. doi: 10.1111/j.1365-2117.2007.00340.x
Moscardelli, L., Wood, L., and Mann, P. (2006). Mass-transport complexes and associated processes in the offshore area of Trinidad and Venezuela. AAPG Bull. 90, 1059–1088. doi: 10.1306/02210605052
Moscardelli, L., Wood, L. J., and Dunlap, D. B. (2012). Shelf-edge deltas along structurally complex margins: a case study from eastern offshore Trinidad. AAPG Bull. 96, 1483–1522. doi: 10.1306/01241211046
Mutti, E., and Normark, W. R. (1987). “Comparing examples of modern and ancient turbidite systems: problems and concepts,” in Marine Clastic Sedimentology, eds J. K. Leggett and G. G. Zuffa (Dordrecht: Springer), 1–38.
Normark, W. R., Posamentier, H., and Mutti, E. (1993). Turbidite systems: state of the art and future directions. Rev. Geophys. 31, 91–116. doi: 10.1029/93RG02832
Pinheiro-Moreira, J. L. (2000). Stratigraphie sismique et modélisation stratigraphique des dépôts de l'Éocène du Bassin de Santos (marge brésilienne) (Ph.D. dissertation). Université de Rennes, Rennes.
Piper, D. J., and Normark, W. R. (2001). Sandy fans–from Amazon to Hueneme and beyond. AAPG Bull. 85, 1407–1438. doi: 10.1306/8626CACD-173B-11D7-8645000102C1865D
Pirmez, C., and Flood, R. D. (1995). “Morphology and structure of Amazon Channel,” in Proceedings of the Ocean Drilling Program. Initial Reports (College Station, TX: Ocean Drilling Program), 23–45. doi: 10.2973/odp.proc.ir.155.103.1995
Pirmez, C., and Imran, J. (2003). Reconstruction of turbidity currents in Amazon Channel. Mar. Petrol. Geol. 20, 823–849. doi: 10.1016/j.marpetgeo.2003.03.005
Postma, G., Hoyal, D. C., Abreu, V., Cartigny, M. J., Demko, T., Fedele, J. J., et al. (2016). “Morphodynamics of supercritical turbidity currents in the channel-lobe transition zone,” in Submarine Mass Movements and Their Consequences, Vol 41, eds G. Lamarche, J. Mountjoy, S. Bull, T. Hubble, S. Krastel, E. Lane, A. Micallef, L. Moscardelli, C. Mueller, I. Pecher, and S. Woelz (Cham: Springer International Publishing), 469–478. doi: 10.1007/978-3-319-20979-1_47
Prather, B. E., Pirmez, C., and Winker, C. D. (2012). “Stratigraphy of linked intraslope basins: Brazos-Trinity system western Gulf of Mexico,” in Application of the Principles of Seismic Geomorphology to Continental-Slope and Base-of-Slope Systems: Case Studies from Seafloor and Near-Seafloor Analogues, Vol. 99, B. E. Prather, M. E. Deptuck, D. Mohrig, B. V. Hoorn, and R. B. Wynn (Tulsa, OK: SEPM Society for Sedimentary Geology), 83–110. doi: 10.2110/pec.12.99.0083
Prelat, A., Covault, J. A., Hodgson, D. M., Fildani, A., and Flint, S. S. (2010). Intrinsic controls on the range of volumes, morphologies, and dimensions of submarine lobes. Sediment. Geol. 232, 66–76. doi: 10.1016/j.sedgeo.2010.09.010
Pyrcz, M. J., and Deutsch, C. V. (2014). Geostatistical Reservoir Modeling. Oxford: Oxford University Press.
Pyrcz, M. J., Sech, R. P., Covault, J. A., Willis, B. J., Sylvester, Z., and Sun, T. (2015). Stratigraphic rule-based reservoir modeling. Bull. Can. Petrol. Geol. 63, 287–303. doi: 10.2113/gscpgbull.63.4.287
Rabineau, M., Berné, S., Aslanian, D., Olivet, J. L., Joseph, P., Guillocheau, F., et al. (2005). Sedimentary sequences in the Gulf of Lion: a record of 100,000 years climatic cycles. Mar. Petrol. Geol. 22, 775–804. doi: 10.1016/j.marpetgeo.2005.03.010
Reading, H. G., and Richards, M. (1994). Turbidite systems in deep-water basin margins classified by grain size and feeder system. AAPG Bull. 78, 792–822. doi: 10.1306/A25FE3BF-171B-11D7-8645000102C1865D
Richards, M., Bowman, M., and Reading, H. (1998). Submarine-fan systems I: characterization and stratigraphic prediction. Mar. Petrol. Geol. 15, 689–717. doi: 10.1016/S0264-8172(98)00036-1
Rivenaes, J. C. (1992). Application of a dual-lithology, depth-dependent diffusion equation in stratigraphic simulation. Basin Res. 4, 133–146. doi: 10.1111/j.1365-2117.1992.tb00136.x
Romans, B. W., Castelltort, S., Covault, J. A., Fildani, A., and Walsh, J. P. (2016). Environmental signal propagation in sedimentary systems across timescales. Earth Sci. Rev. 153, 7–29. doi: 10.1016/j.earscirev.2015.07.012
Sacchi, Q., Borello, E. S., Weltje, G. J., and Dalman, R. (2016). Increasing the predictive power of geostatistical reservoir models by integration of geological constraints from stratigraphic forward modeling. Mar. Petrol. Geol. 69, 112–126. doi: 10.1016/j.marpetgeo.2015.10.018
Sequeiros, O. E., Spinewine, B., Beaubouef, R. T., Sun, T., García, M. H., and Parker, G. (2010). Characteristics of velocity and excess density profiles of saline underflows and turbidity currents flowing over a mobile bed. J. Hydraulic Eng. 136, 412–433. doi: 10.1061/(ASCE)HY.1943-7900.0000200
Spinewine, B., Sequeiros, O. E., Garcia, M. H., Beaubouef, R. T., Sun, T., Savoye, B., et al. (2009). Experiments on wedge-shaped deep sea sedimentary deposits in minibasins and/or on channel levees emplaced by turbidity currents. Part II. Morphodynamic evolution of the wedge and of the associated bedforms. J. Sediment. Res. 79, 608–628. doi: 10.2110/jsr.2009.065
Straub, K. M., Mohrig, D., McElroy, B., Buttles, J., and Pirmez, C. (2008). Interactions between turbidity currents and topography in aggrading sinuous submarine channels: a laboratory study. GSA Bull. 120, 368–385. doi: 10.1130/B25983.1
Straub, K. M., and Pyles, D. R. (2012). Quantifying the hierarchical organization of compensation in submarine fans using surface statistics. J. Sediment. Res. 82, 889–898. doi: 10.2110/jsr.2012.73
Sun, T., Ghayour, K., Hall, B., and Miller, J. (2010). “Process-based modeling of deep water depositional systems,” in Seismic Imaging of Depositional and Geomorphic Systems: Gulf Coast Section SEPM Foundation 30th Annual Bob F. Perkins Research Conference (Houston, TX: SEPM Society for Sedimentary Geology), 88–112. doi: 10.5724/gcs.10.30.0088
Sweet, M. L., Gaillot, G. T., Jouet, G., Rittenour, T. M., Toucanne, S., Marsset, T., et al. (2019). Sediment routing from shelf to basin floor in the Quaternary Golo System of Eastern Corsica, France, western Mediterranean Sea. Geol. Soc. Am. Bull. doi: 10.1130/B35181.1. [E-pub ahead of print].
Sylvester, Z., Cantelli, A., and Pirmez, C. (2015). Stratigraphic evolution of intraslope minibasins: Insights from surface-based model. AAPG Bull. 99, 1099–1129. doi: 10.1306/01081514082
Tucker, G. E., and Slingerland, R. L. (1994). Erosional dynamics, flexural isostasy, and long-lived escarpments: a numerical modeling study. J. Geophys. Res. Solid Earth 99, 12229–12243. doi: 10.1029/94JB00320
Weimer, P., and Pettingill, H. S. (2007). “Deep-water exploration and production: a global overview,” in Atlas of Deep-Water Outcrops: AAPG Studies in Geology 56, eds T. H. Nilsen, R. D. Shew, G. S. Steffens, and J. Studlick (Tulsa, OK: AAPG).
Willgoose, G., Bras, R. L., and Rodriguez-Iturbe, I. (1991). A coupled channel network growth and hillslope evolution model: 1. Theory Water Resour. Res. 27, 1671–1684. doi: 10.1029/91WR00935
Keywords: sediment supply, grain size, compensational stacking, forward stratigraphic modeling, deep-water depositional settings, submarine fan, diffusion coefficient, sediment transport
Citation: Hawie N, Covault JA and Sylvester Z (2019) Grain-Size and Discharge Controls on Submarine-Fan Depositional Patterns From Forward Stratigraphic Models. Front. Earth Sci. 7:334. doi: 10.3389/feart.2019.00334
Received: 15 August 2019; Accepted: 29 November 2019;
Published: 13 December 2019.
Edited by:
William Helland-Hansen, University of Bergen, NorwayReviewed by:
Michal Janocko, Equinor ASA, NorwayCopyright © 2019 Hawie, Covault and Sylvester. This is an open-access article distributed under the terms of the Creative Commons Attribution License (CC BY). The use, distribution or reproduction in other forums is permitted, provided the original author(s) and the copyright owner(s) are credited and that the original publication in this journal is cited, in accordance with accepted academic practice. No use, distribution or reproduction is permitted which does not comply with these terms.
*Correspondence: Nicolas Hawie, bmljb2xhcy5oYXdpZUBiZWljaXAuY29t
Disclaimer: All claims expressed in this article are solely those of the authors and do not necessarily represent those of their affiliated organizations, or those of the publisher, the editors and the reviewers. Any product that may be evaluated in this article or claim that may be made by its manufacturer is not guaranteed or endorsed by the publisher.
Research integrity at Frontiers
Learn more about the work of our research integrity team to safeguard the quality of each article we publish.