 Liah X. Coggins
 Anas Ghadouani
- Department of Civil, Environmental and Mining Engineering, The University of Western Australia, Crawley, WA, Australia
Traditionally, bathymetry mapping of ponds, lakes, and rivers have used techniques which are low in spatial resolution. Waste stabilization ponds (WSPs) are utilized worldwide for wastewater treatment, and throughout their operation require periodic sludge surveys. Sludge accumulation in WSPs can impact performance by reducing the effective volume of the pond, and altering the pond hydraulics and wastewater treatment efficiency. Traditionally, sludge heights, and thus sludge volume, have been measured using techniques such as the “sludge judge” and the “white towel” test. Both of these methods have low spatial resolution, are subjective in terms of precision and accuracy, are labor intensive, and require a high level of safety precautions. A sonar device fitted to a remotely operated vehicle (ROV) can improve the resolution and accuracy of sludge height measurements, as well as reduce labor and safety requirements. This technology is readily available; however, despite its applicability, it has not been previously assessed for use on WSPs. This study aimed to design, build, and assess the performance of an ROV to measure sludge height in WSPs. Profiling of several WSPs has shown that the ROV with autonomous sonar device is capable of providing bathymetry with greatly increased spatial resolution in a greatly reduced profiling time. To date, the ROV has been applied on in excess of 400 WSPs across Australia, several large lakes, stormwater retention ponds, river beds, and drinking water reservoirs. ROVs, such as the one built in this study, will be useful for not only determining sludge profiles, but also in calculating sludge accumulation rates and in evaluating pond hydraulic efficiency. As demonstrated, this technology is not limited to application in wastewater management, with the potential for wider application in the monitoring of other small to medium-sized water bodies, including reservoirs, lakes, channels, recreational water bodies, river beds, mine tailing dams and commercial ports.
Introduction
Bathymetry mapping of ponds, lakes, and rivers often use techniques which are low in spatial resolution, subjective in terms of precision and accuracy, labor intensive, and which require a high level of safety precaution. Waste stabilization ponds (WSPs) are simple, highly efficient, low-cost, low-maintenance and robust systems for treating wastewater (Mara, 2004; Nelson et al., 2004; Picot et al., 2005). In WSPs, wastewater constituents are removed by sedimentation or transformed by biological and chemical processes, and a sludge layer forms due to the sedimentation of influent suspended solids, algae, and bacteria (Nelson et al., 2004). Sludge accumulation can affect pond performance by reducing pond effective volume and changing the bottom bathymetry, thus altering pond hydraulics (e.g., Persson, 2000; Nelson et al., 2004; Coggins et al., 2017). and compromising the discharge quality (e.g., Ghadouani and Coggins, 2011). Effective, safe and sustainable operation of WSPs therefore requires detailed information about sludge accumulation, distribution, and its effect on hydraulic characteristics. Furthermore, sludge accumulation can lead to increased methane production, thus contributing to greenhouse gas emissions (Hernandez-Paniagua et al., 2014; Glaz et al., 2016). This knowledge is essential for planning pond maintenance, in particular sludge removal and disposal, which can be highly expensive and complex (Nelson et al., 2004; Picot et al., 2005; Alvarado et al., 2012a). Traditional methods of measuring sludge height, and thus total sludge volume, in WSPs include the use of a “sludge judge” (a clear plastic pipe) (Westerman et al., 2008), or the “white towel” test (Mara, 2004). Sludge surveys using these techniques are typically conducted on a rectangular grid, with height measurements taken by an operator deploying the measuring apparatus from a boat. The number of point measurements taken in each pond is dependent on both the size of the pond and the grid spacing chosen by the operator. Such surveys are time consuming and have low spatial resolution; however, data from these surveys is vital for sludge management (Peña et al., 2000; Nelson et al., 2004; Picot et al., 2005).
Small sonar devices equipped with global positioning system (GPS) technology, also known as fishfinders, are not only readily available and widely used by people in boating, but have also previously been used to determine the depth of water and sludge height in small agricultural lagoons (Singh et al., 2008). Through the use of GPS technology in conjunction with sonar, the location and vertical distance to the top of the sludge layer (or sludge blanket) can be simultaneously recorded to a memory card; this data can then be used to develop contour maps of sludge and in the determination of total sludge volume in the pond (Singh et al., 2008). However, despite this technology being highly applicable for bathymetry mapping studies, it has so far been underutilized.
Remotely operated vehicles (ROVs) are becoming increasingly popular for research applications, with ROVs being developed for water sampling (Kaizu et al., 2011), and current profiling (Kriechbaumer et al., 2015). The coupling of sonar technology with an ROV platform has several advantages over traditional sludge measurement techniques, as they:
1. Require less manual labor,
2. Reduce safety risks and occupational health and safety requirements, as it does not require launching a boat onto the WSP,
3. Reduce the subjectivity of measurements taken with traditional techniques (i.e., removes human error in reading and the differences in having different people conduct the surveys),
4. Collect many more data points in a shorter period of time (i.e., increase measuring efficiency) with greater spatial resolution (i.e., smaller grid spacing), and
5. Are relatively cost effective, widely accessible, and low maintenance.
Additionally, the combination of an ROV fitted with sonar will be a significant advantage for bathymetric surveys of many water bodies other than WSPs. ROVs may also be applied to small to medium sized water bodies, such as lakes and stormwater retention wetlands, drinking water reservoirs, rivers, pools, channels, and recreational and commercial ports. The improvement in spatial resolution of pond bathymetry data alone will greatly improve models used to understand pond hydraulics and how sludge accumulation and geometry affect performance (Passos et al., 2016; Coggins et al., 2017, 2018); these could in turn be used to develop new WSP coupled models of hydraulics and biology. Thus, the main objective of this study was to assess the performance of a ROV with GPS-equipped sonar to measure sludge height in a WSP, with the aim to develop it to a point where it could be implemented for research and within industry.
Materials and Methods
GPS Equipped Sonar Unit
For the development of the ROV, a sonar unit with GPS (model HDS-5, Lowrance Electronics, Tulsa, Oklahoma) with an 83/200 kHz transducer was selected and tested, as the built-in GPS allows for the simultaneous acquisition of water depth and map coordinate data. The unit also allows for continuous data logging, and saves files to an SD memory card; online user forums for this sonar unit report GPS accuracy between 1–6 m. This particular unit was chosen after field trials on WSPs during 2010; the unit was commercially available, and reasonable in price. At specific locations, point measurements of sludge height were taken by both the sludge judge and the sonar. As the sonar unit measures and records local water depth, sludge heights were calculated by subtracting depth measurements from the average pond depth (from pond manager asset data). There was a very strong correlation (R2 = 0.98) between the two measurement techniques (Figure 1) with a tendency for the sonar reading to be slightly higher than the corresponding sludge judge reading (Coggins et al., 2017).
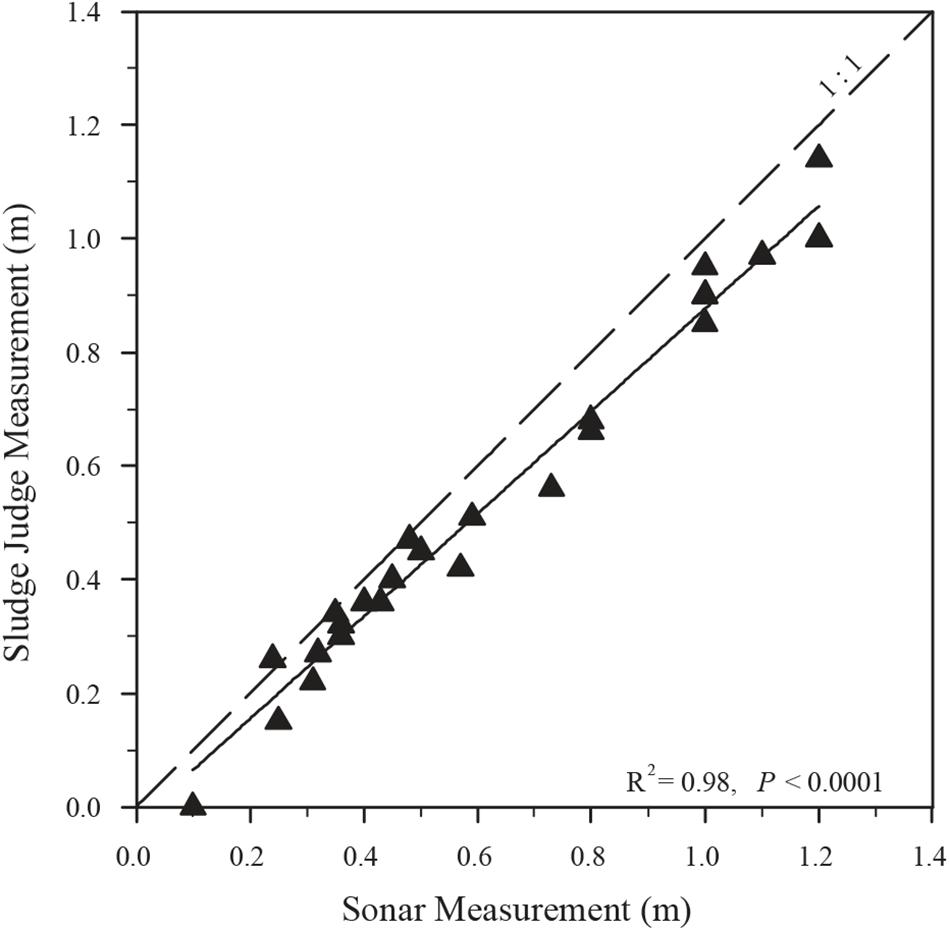
Figure 1. Sonar vs. sludge judge measurement (n = 24). The dashed line indicates the 1:1 relationship, with the relationship between sonar and sludge judge (solid line) being very close to ideal (Reprinted from Coggins et al., 2017, Page 357, Copyright (2016), with permission from Elsevier).
Remotely Operated Vehicle Design
Previous sonar profiling studies have used unmanned airboats (Singh et al., 2008; Kaizu et al., 2011), and more recently unmanned aerial vehicles (e.g., Bandini et al., 2018). WSPs in Western Australia, and Australia in general, are commonly located in cleared areas, and thus do not have any shelter from the wind. For example, weather data for August 2011 from a station near a Western Australian WSP recorded wind gusts of up to 85 km h–1 (data from Australian Bureau of Meteorology), with an average 9 am wind speed of 13 km h–1, and observing wind ripples on the pond surface is extremely common. Considering the medium to strong prevailing wind conditions at WSPs across Australia, it was decided that a boat with submerged rudder and propeller would be better suited for complete and rapid sludge profiling of ponds.
A prototype ROV was built using an off-the-shelf model boat, with the sonar mounted to a frame on top of the boat, and with outriggers to stabilize the boat when turning (Figure 2A). The ROV was controlled using a 2.4 GHz surface radio, and driven by the operator and not by a pre-determined GPS-referenced path.
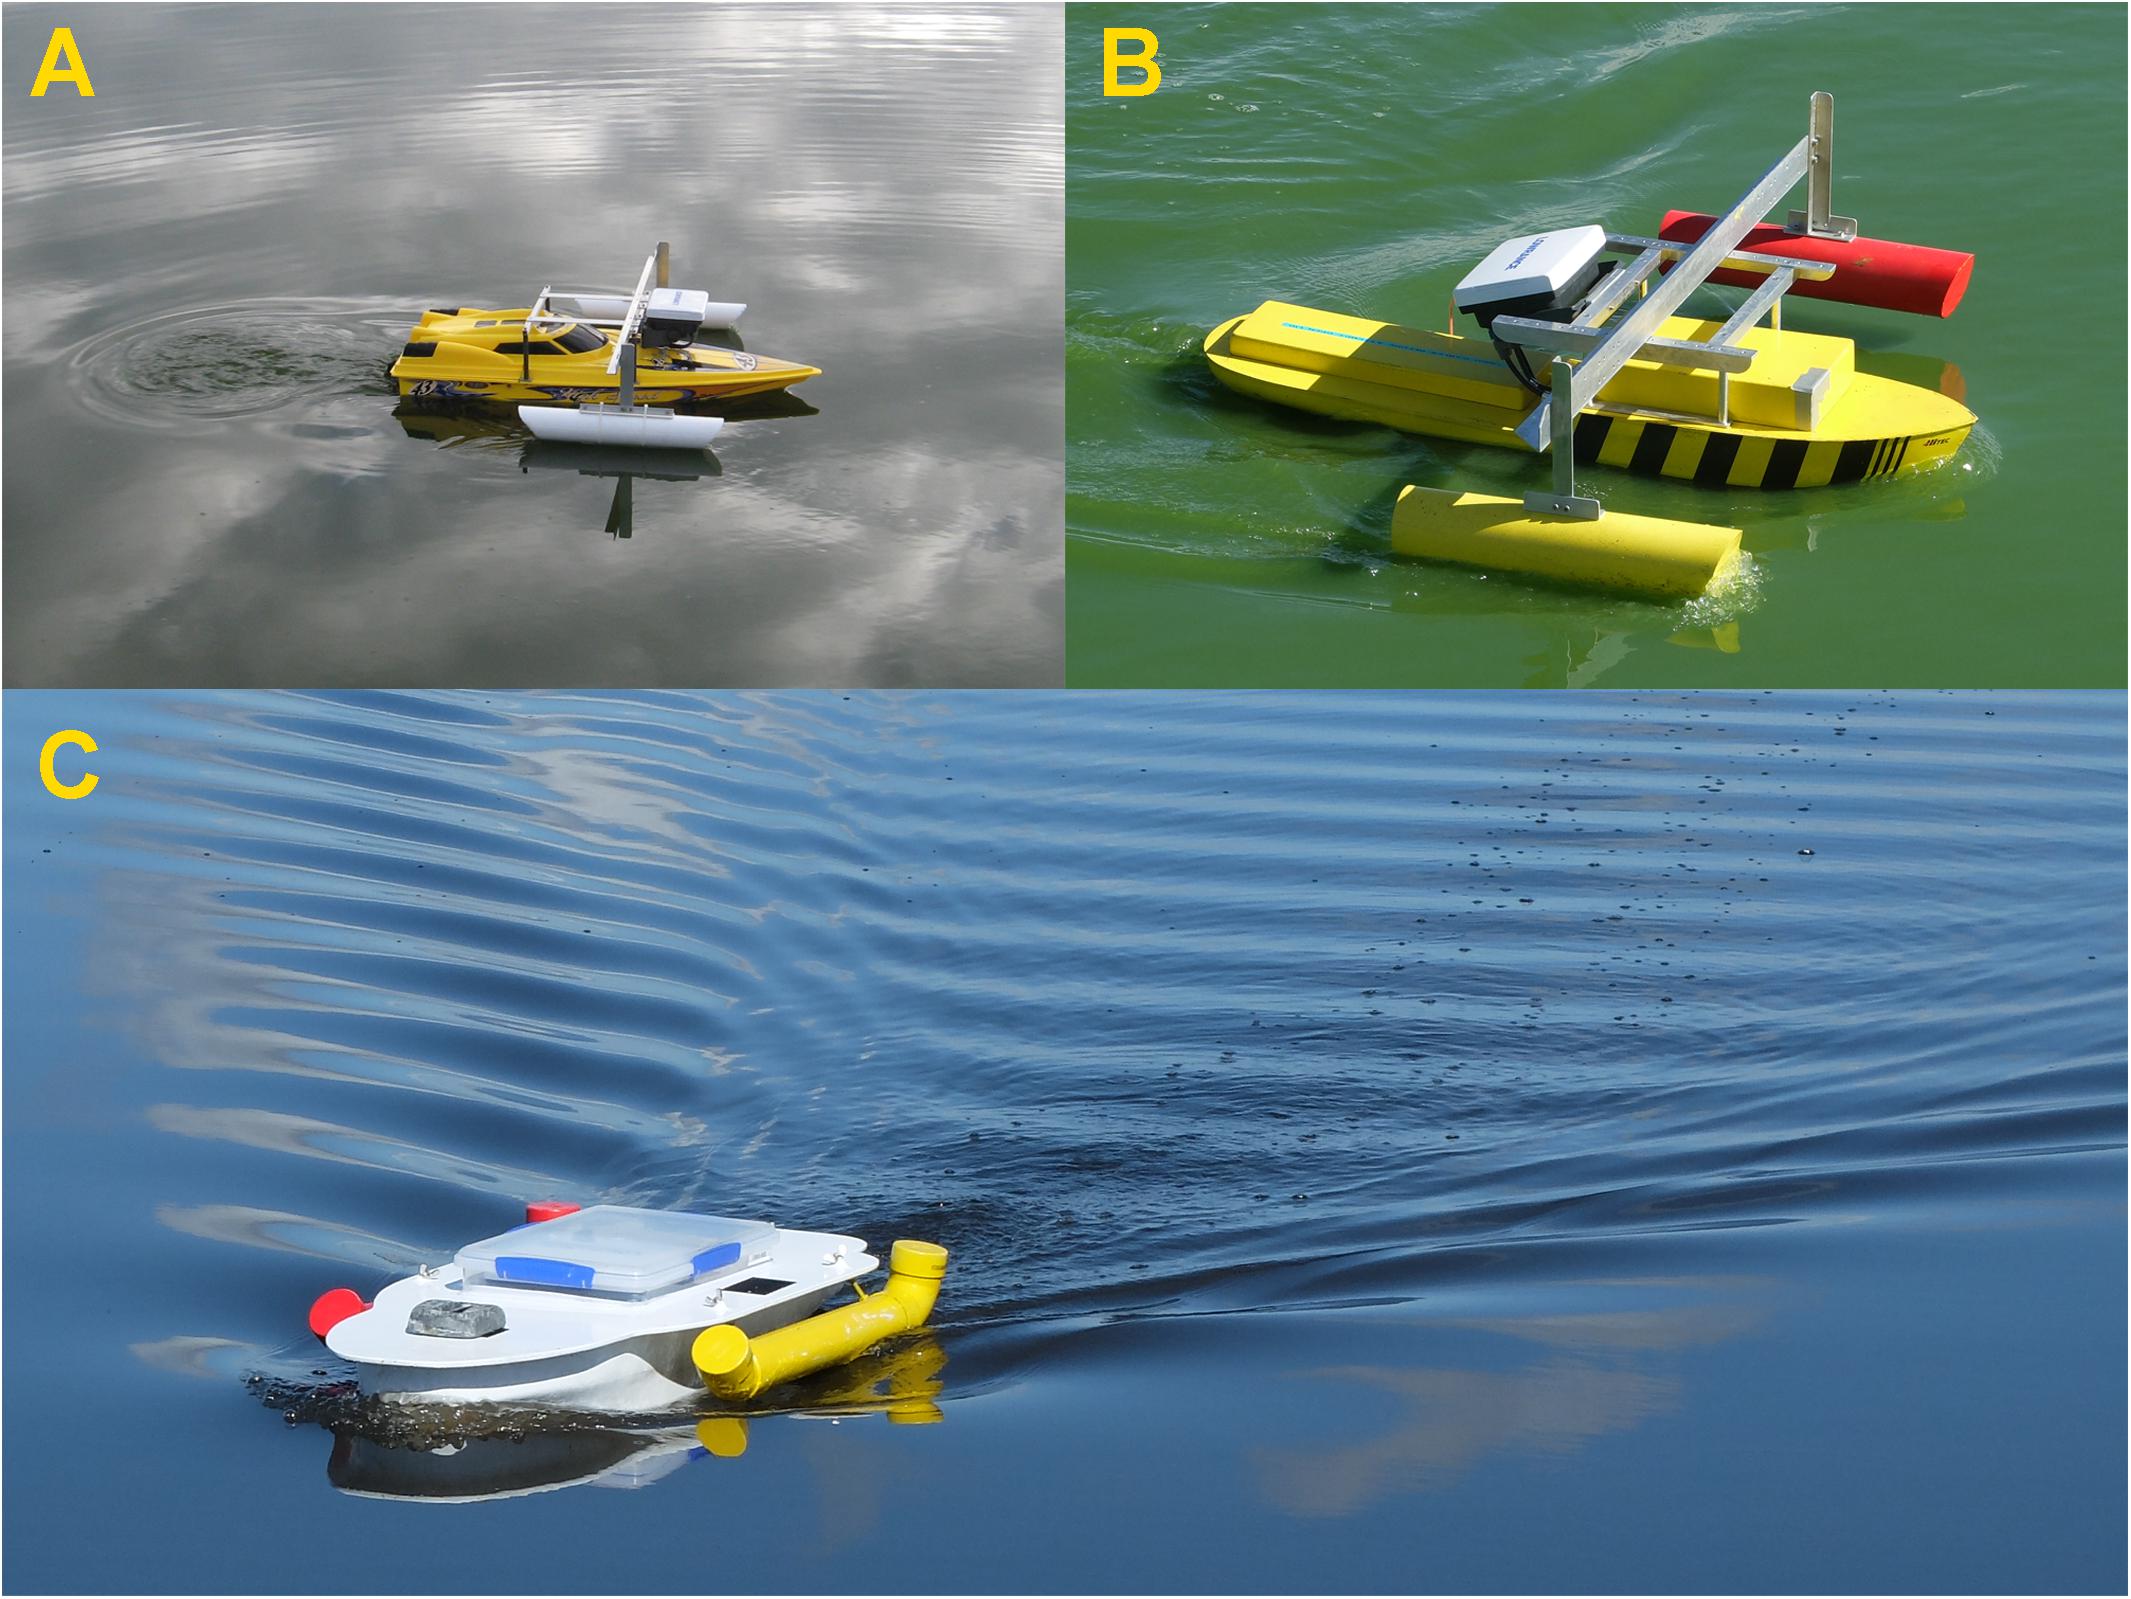
Figure 2. Design iterations of the sonar profiling ROV (detailed specifications in Table 1). (A) The prototype was an off-the-shelf speed boat, fitted with a frame to mount the sonar unit and stabilizers to the boat. (B) Redesign of the boat with a more robust deep V-shaped hull, with frame for sonar and stabilizers. (C) Current boat design with U-shaped hull and sonar mounted inside.
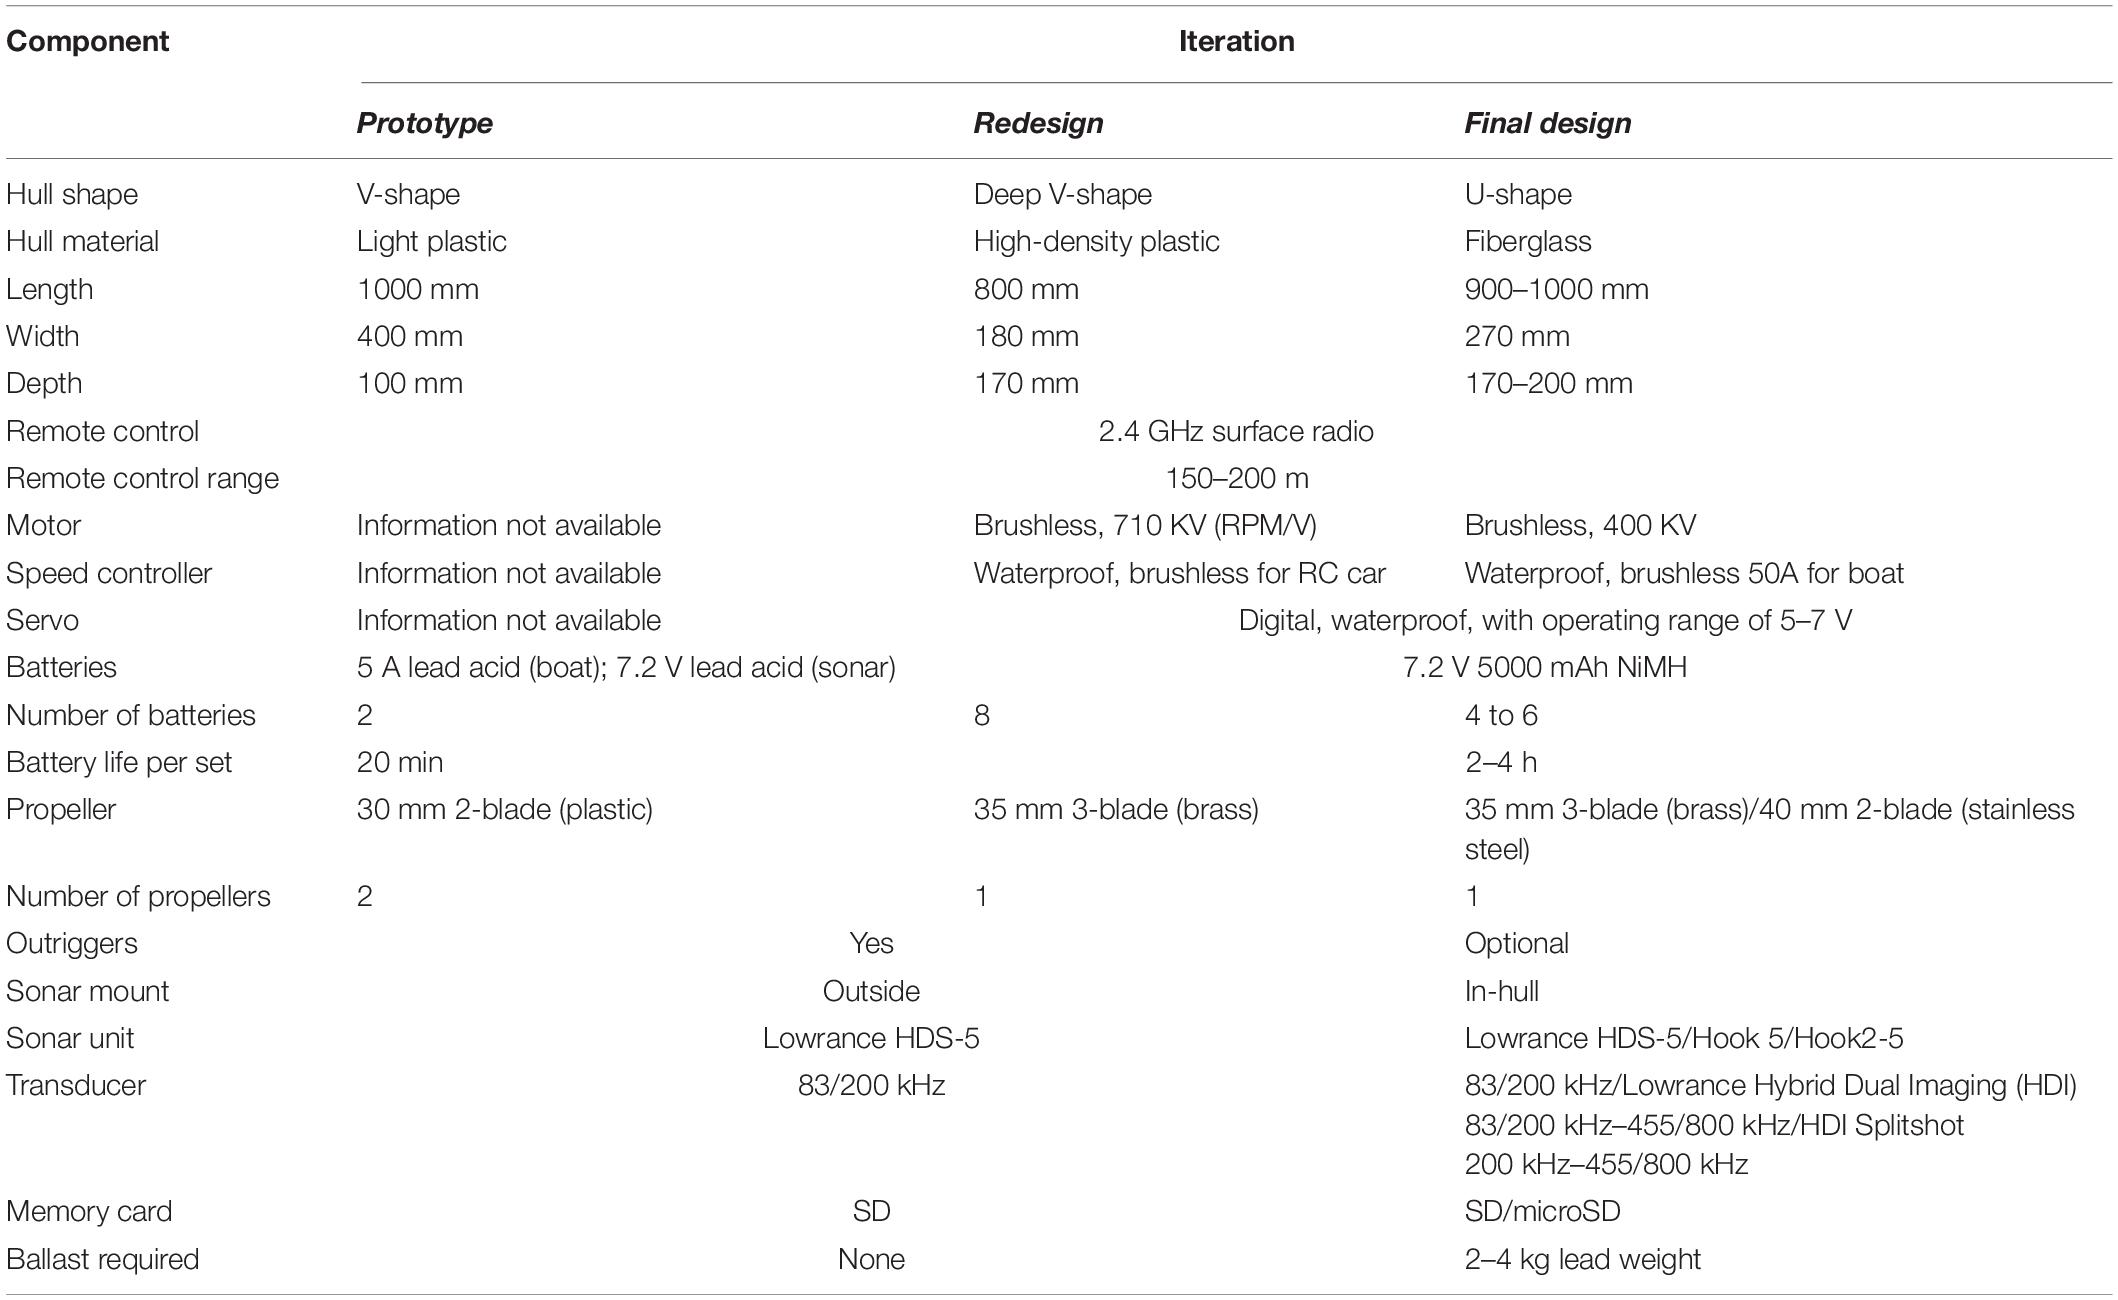
Table 1. Specifications of the remote control boats built, showing their evolution from an off-the-shelf prototype (Figure 2A), to the redesign (Figure 2B), and finally to a robust and reliable shape (Figure 2C).
Implementation in industry was always at the forefront of the development of the boat, however, after proof of concept testing it was obvious that some improvements would be required to make the ROV more suitable and robust. In trials, the optimum speed for profiling was determined to be 2–4 km h–1; however, the prototype boat, an off-the-shelf model with a shallow V-shape hull was built for speeds in excess of 30 km h–1. The non-ideal hull shape resulted in shorter battery life, as the electronic components were not suited for low-speed use. Slow moving water vessels, such as tugboats and barges, have hulls with a deeper V-shape or U-shape, designed to cut through water with very little propulsion. These types of hulls are not only more suitable for low-speed applications, but also more stable in the water. An improvement to the hull shape would thus improve both boat stability and battery life. In addition to a different hull shape, efforts were invested in making the physical and electronic components of the boat more robust and reliable to increase run-time (battery life), and decrease wear and tear. Most importantly, the boat needed to be simple for operators to be able to service and replace mechanical and electrical components as required. A summary of specifications of the boat from the prototype boat (Figure 2A), the first redesign (Figure 2B), to the final design (Figure 2C) can be found in Table 1.
The final design of the boat (Figure 2C) has a U-shaped hull made of fiberglass. The use of a brushless, low-RPM/V motor along with Nickel Metal Hydride (NiMH) batteries has extended run-time from 20 min to 2–4 h. The U-shaped hull also allows for room for the sonar to be mounted inside the boat, removing the need for a frame. The sonar unit and batteries were positioned near the center of gravity of the boat, while the sonar transducer is fixed at the front of the hull. Due to the stability provided by the hull, the use of stabilizers is optional. Displacement hull boats require a significant amount of ballast for stability; the NiMH batteries, and lead weight provide this. The fully laden boat weighs approximately 8 kg. The boat is driven manually using a 2.4 GHz surface radio with a range of up to 200 m. This boat design is: (1) durable, easily shipped on planes and in cars, (2) consistent in operation, and (3) low maintenance. In addition, we have demonstrated in the field that this ROV design is suitable in strong wind conditions (60–70 km h–1), with boat stability and data quality not being affected; however, windy conditions can reduce battery life and may not be ideal for operators.
Assessment of Prototype ROV Operation
In the prototype stage, the remote control boat with sonar was tested on several ponds to ensure that it: (1) was suitable for use on WSP, (2) was accurate in its measurement, and (3) had high reproducibility of results.
The ROV was tested at two wastewater treatment plants close to the Perth metropolitan area, Western Australia. Two ponds were chosen for testing: Pond 1, a secondary maturation, and Pond 2, a primary facultative pond; dimensions of the selected ponds were 59 × 62 m and 84 × 84 m, respectively. Pond managers profiled both ponds using a sludge judge during June 2011. The selected ponds were profiled several times during the period of June-August 2011, with data collected using the logging function on the sonar. Data was collected along transects approximately 2 m apart in both the lateral and longitudinal directions. The boat was maintained at a constant low speed (approximately 2–4 km h–1) while profiling, and kept in constant motion for as long as possible. In addition, some profiles also included a “run” around the pond perimeter to obtain measurements as close to the edge of the pond as possible. The sonar and transducer set for shallow water using the manufacturer specifications. Additionally, ping speed was set to the maximum resolution of 3200 bytes per ping.
Data Processing and Analysis
Data was downloaded from the sonar SD memory card into Sonar Log Viewer (version 2.1.2, Lowrance Electronics, Tulsa, Oklahoma), and then exported to Microsoft Excel Comma Separated Value (csv) format (Figure 3). During processing, false depth data was removed, i.e., depth readings greater than the pond depth from pond operator asset data (1–2% of total data); these false depth readings occur due to the logging of sonar data being started prior to launching the boat onto a pond. Depth measurements were converted to meters, then depths converted to sludge heights (i.e., the average depth of the pond minus the local water depth). GPS coordinates were converted to Universal Transverse Mercator (UTM) (for more details on GPS conversion, see Singh et al., 2008). It was assumed that the pond bottom surface was uniform. Coordinates of each measurement point were then defined relative to the lowest easting and northing values. Output measurement locations and sludge heights (m) were input into 3D surface mapping software Surfer (version 9.0, Golden Software Inc), to create a graph coordinate file (i.e., xyz file). This file was then run through the gridding toolbox to filter the data, where points were retained according to median z values (sludge height) for any given (x,y). Using a simple kriging interpolation, grids were generated at a spacing of 1 m in both x and y, then used to create a 3D surface plot of the sludge. Overall, processing the data using this method takes between 30–60 min; this proved time consuming when there were several profiles to process, and could not be easily done on site just in case another profile needed to be taken (e.g., if there was an error with the sonar). In addition, these processing steps require the user to have a level of familiarity with 3–4 independent standalone software packages, making processing not user friendly. Furthermore, some of these software packages require a license, of which the cost may be prohibitive for some users, e.g., small water utilities. To overcome this issue, we developed a software package with open source tools to make the process more user-friendly, and significantly quicker.
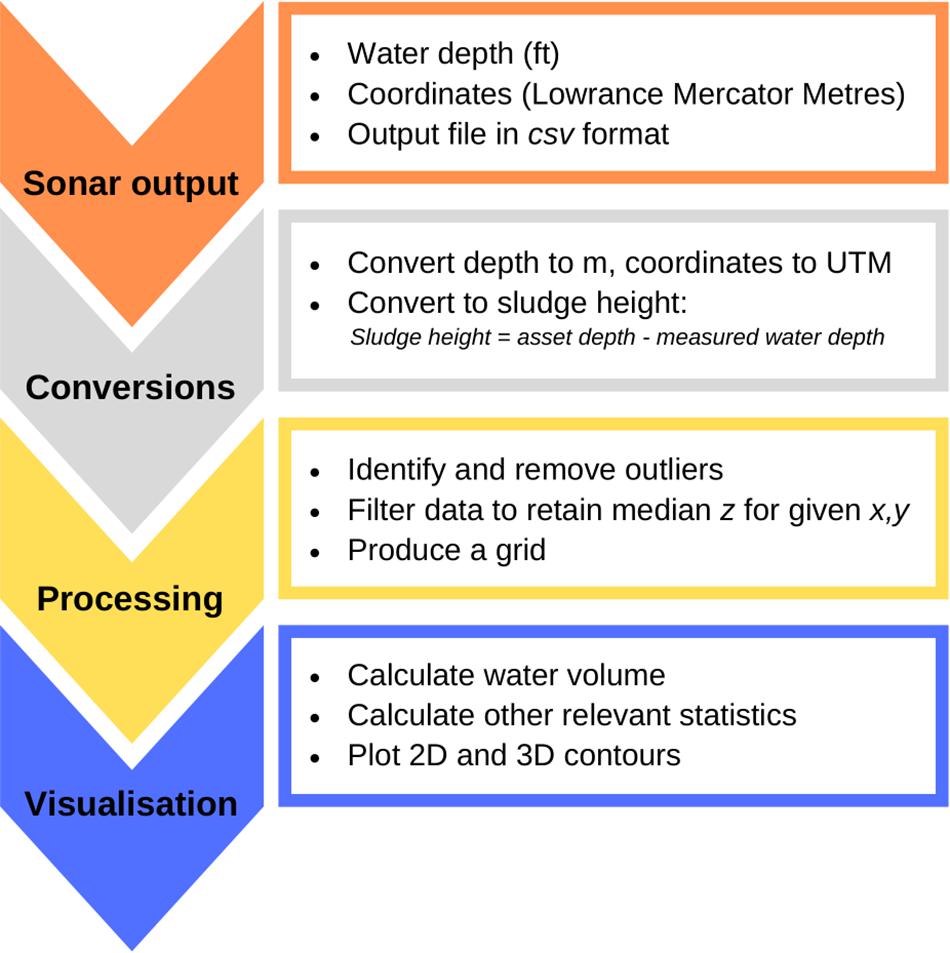
Figure 3. Summary of the data processing required after profiles are collected with the ROV. These processing steps can be achieved manually, or automated using a script.
As described in Coggins et al. (2017), the SludgePro software performs all of the filtering, analysis, and plotting of data, and can be used to produce a report suitable for use by pond managers. As a result of the development of this script, the analysis and plotting can be achieved in less than 30 s. The data processing involves a number of steps (as outlined above), including the conversion of geographical coordinates, the definition of pond boundaries, the removal of outliers or duplicated data, and visualization of data. Firstly, the script automates the conversion of the sonar map units to UTM. Using Google Earth, the pond boundaries are defined by drawing a path around the perimeter; this path is then saved as a Keyhole Markup Language (KML) file for input into the software. The software then uses the KML file to filter out points that are outside the pond boundary (i.e., those collected on land when the sonar logging is initiated). Due to the locational accuracy of the GPS being 1–6 m, there is also a tool for the user to input a shift of the data, so that all relevant data points can be included in the processing. Pond depth, from asset data, is also input into the software, and this value is used not only for the calculation of sludge volume, but also to remove the occasional outlier that is significantly out of the possible range of depth. These outliers typically occur at a frequency of 1 in 1000 points collected, and may be attributed to the boat rocking in the water while taking measurements. As the sonar has a high sampling rate, a significant number of duplicate data points are collected at each location. This amount of data per position is superfluous for the creation of a grid of the collected data. Therefore, the data is also processed to determine the median z value for each location, which is then retained for gridding; the determination of the median also helps to remove the previously mentioned outliers that may occur. Water depth is converted to sludge height by subtracting the measured water depth (the direct measurement from the sonar) from the known asset depth, assuming that the pond bottom surface is uniform. In the case of the pond depth being unknown, SludgePro has the ability to process and visualize data based upon the measured water depth only, and thus values will not be filtered out based upon pond depth. The SludgePro frontend guides the user into providing the necessary information (i.e., KML file for pond perimeter, and csv files of collected data) to process and plot the survey data (Coggins et al., 2017). Most importantly, all the files and data can be processed, read, and modified by the user without the need for any programing knowledge.
Results and Discussion
Initial Assessment of ROV Operation
Profiles of Ponds 1 and 2 were measured on four occasions between June and August 2011. Pond 1 was the first pond upon which the ROV was tested and more profiles were conducted here to ensure the reliability and reproducibility of profiling data. Each profile completed with the ROV took approximately 20 and 30 min for Ponds 1 and 2, respectively.
The profile of Pond 1 (Figure 4A) shows a reasonably uniform sludge distribution, consistent with it having been partially desludged by the pond managers in early 2011. The walls of the pond are the high points visible surrounding the edge of this plot. In comparison, the profile of Pond 2 (Figure 4B) shows more variability in sludge height. With the high-resolution data collected by the sonar, it is possible to spot the channel feature that has formed between the inlet and outlet; the average sludge height in this region is 0.3 m (color: dark blue). Sludge accumulation on the side of the pond adjacent to the inlet is also visible, with the change in sludge height from the channel to this region being abrupt (0.2 m higher than the channel itself). It is also evident that there is a very large accumulation of sludge in the southwest corner of the pond. Finally, highlighting the advantages of the increased spatial resolution of provided by the sonar, the profile shows pockets that have formed throughout the sludge blanket.
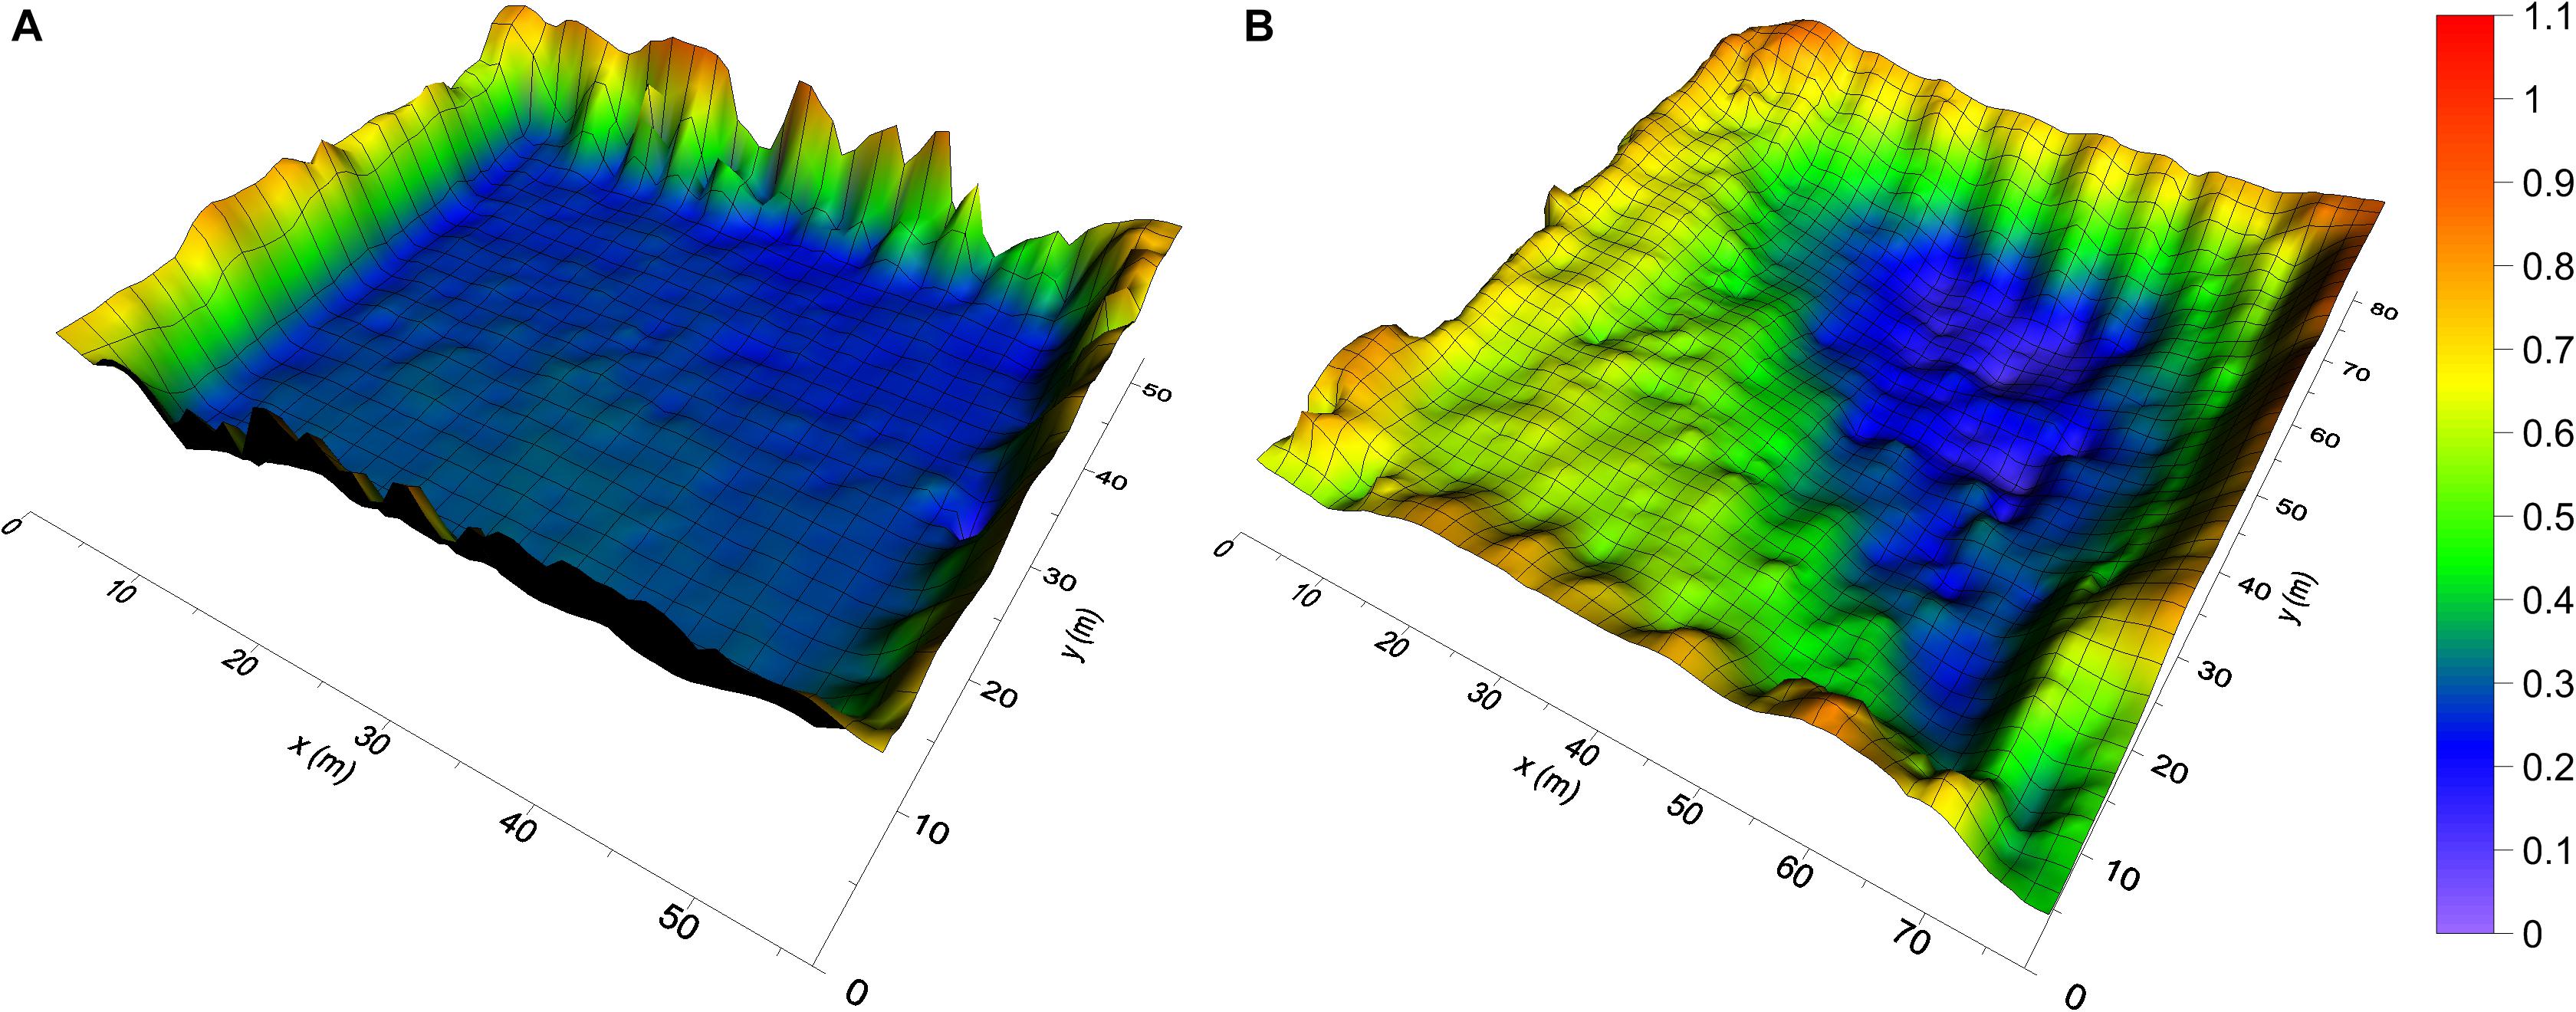
Figure 4. Sludge profiles of test ponds. (A) Pond 1, inlet located at (52,48) and outlet at (1,44), has a reasonably uniform sludge distribution. (B) Pond 2, with inlet at (77,1) and outlet at (6,80), with a highly uneven sludge distribution, with a noticeable channel feature. The color scale indicates the height of the sludge-water interface (in meters) above the bottom of the pond.
Reproducibility of sludge profile data collected was assessed by comparing data collected on different profiling days at Pond 1. Three profiles taken with the sonar were compared to the sludge judge measurement along the transect y = 35 m (for sludge surface shown in Figure 4A), and all data were normalized against the sonar survey taken on the first profiling day. This comparison shows the reproducibility of the sonar profiling, with measurements on different days being within 5% range of each other over the overall depth (i.e., within 5 cm) (Figure 5). The small differences between the sonar surveys over the sampling period could be due to GPS positioning accuracy on the day, however, overall we see that the sonar technique is consistent in its measurement. The inconsistencies between values from the two different survey methods can be attributed to the “human factor” of sludge judge surveys; here, showing that the sludge judge survey overestimates the sludge height (contrary to Figure 1). Sludge judge survey accuracy relies on a number of factors including: (1) the experience of the operator; (2) the subjectivity and accuracy of their readings (and their readings compared to other operators); (3) whether or not the sludge blanket surface is more consolidated or “fluffy”; and (4) sample position relative to the marks on the side of the pond, where for example, drift of the boat could impact the accuracy of the reading along the transect used in Figure 5.
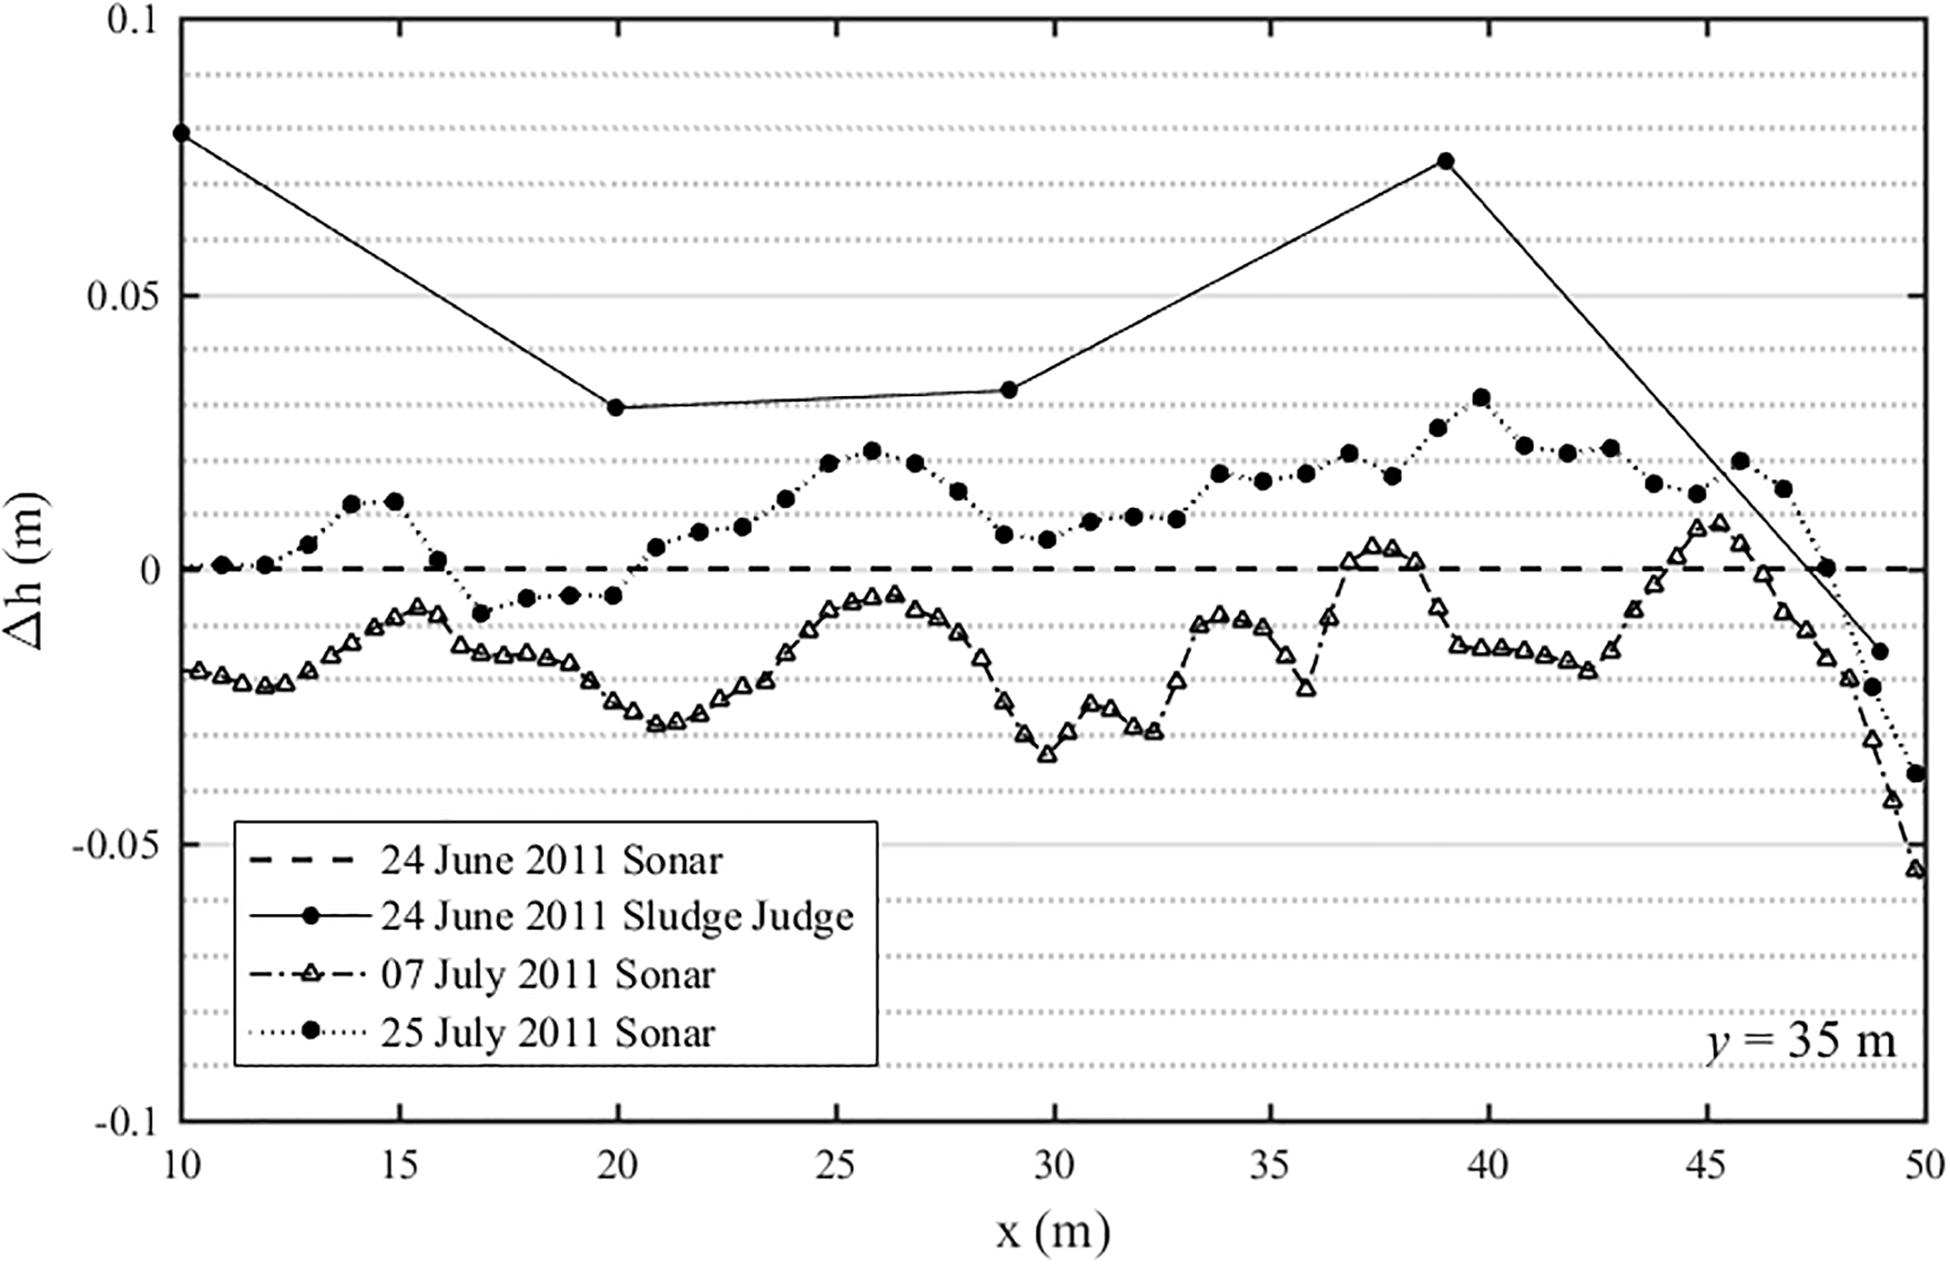
Figure 5. A comparison of sludge height data collected at Pond 1 along transect y = 35 m, on three different profiling days using both the sonar and sludge judge techniques, normalized and shown as a change in height (Δh) against the survey data collected on 24 June 2011 (Δh = 0). From this comparison, we can see that the sonar profiling technique is very comparable between surveys, with the departure only being 2–3 cm. In comparison to the sludge judge survey conducted on the same day, it can be seen that the sludge judge technique overestimated the amount of sludge in the pond. It should be noted here that these departures could be due to GPS positioning differences, however, overall, we can see that the sonar technique is consistent in measurement.
Advantages of Autonomous Profiling
Compared to a sludge judge survey, the ROV not only reduced sludge profiling time, but also greatly increased the spatial resolution of the data collected. The ROV surveys of these ponds were completed in 20 to 30 min, while sludge judge surveys for Ponds 1 and 2 took between 1 to 1.5 h. Furthermore, the sludge judge surveys for these ponds yielded 25 and 42 data points, respectively, whereas the sonar surveys yielded 27192 and 30500 data points. Of the collected sonar measurements, 1513 data points for Pond 1 and 1886 for Pond 2 were mapped to generate the grids used to create the 3D surface plots; data points were filtered for gridding using the median z value (i.e., depth) recorded at each GPS coordinate (i.e., the data points retained are unique, while duplicates are discarded). Using sludge judge, sludge volume estimates were calculated by using the average profiled sludge height, based on the number of data points taken. In comparison, estimates with sonar data were calculated with Simpson’s 3/8 rule for numerical integration, and used all of the mapped data points rather than just the average.
Overall, the low-resolution measurement using sludge judge can only capture pond-scale features of the sludge distribution, while a sonar survey determines the pond/sludge bathymetry (Figure 4), showing much higher detail and resolution of the sludge blanket, including highlighting the presence of channels and pockets. The high-resolution data collected can then be used for other purposes, such as quantifying the relationship between sludge accumulation and hydraulics, and is suitable for input into computer models. Therefore, the testing of the boat satisfied the requirements of higher resolution sludge height data collection, and removed the safety risks of going out onto WSPs with a boat.
Implementation by Australian Water Authorities and Safety
Over the past 8 years, several boat hull designs have been tested, however, all have been battery powered, and had a radio range of up to 200 m. Boat size has ranged between 800–1000 mm in length, and up to 400 mm in width, making them easily packed away into carrying cases, and easily transportable to and from site. The robustness of the boat has meant that is has now been used on >400 WSPs across Australia, ranging in size from those used in the testing phase (Ponds 1 and 2) to ponds/lagoons up to 2000 m in length. To date, four major Australian water utilities now use the ROV for sludge measurement in their WSP assets.
Overall, in addition to the operational reliability of the ROV, the boat also addressed the safety issues associated with sludge judge, and other on-pond profiling techniques. In particular, the development of the boat fits in with the “zero harm” safety policies of many Australian water utilities – many of which place high levels of safety practice when working in and around water. Due to the improvements in safety provided by the ROV, it has been shown as an exemplar for safety practice within Western Australia and nationally, having being nominated for and/or receiving several safety awards.
Part of any successfully used piece of equipment is a comprehensive, well-explained and easy to follow manual for use. Due to the safety requirements parties interested in the profiling boat, such as water utilities, government agencies, mining companies, it was necessary to invest time in writing an informative guide for safe usage. This would not only make it easier for others to use the boat, but also help to formulate the necessary risk assessments for permits to conduct ROV profiling of assets. The operation manual has been assessed and revised based on comments received from industry partners over the past 5 years. The manual includes sections on a quick start on site, information about the boat components, operation and maintenance, troubleshooting, data processing, and a manual for the use of SludgePro. Additional to that provided in the manual, step-by-step guides for adding and processing ponds have also been made for users of SludgePro. These have been designed assuming that the user has no prior knowledge of programing. These guides, along with the quick start on site, have been very successful in aiding knowledge transfer to users.
Surveys
WSP Sludge Management
The management of sludge is rarely considered in the pond design process, despite the inevitability of sludge accumulation in WSPs (Nelson et al., 2004). Reasons for overlooking sludge management in design include the lack of information about sludge distribution within ponds, sludge characteristics, and accumulation rates (Nelson et al., 2004). Sludge distribution within ponds is of particular interest and importance, as this can have a significant impact on pond hydraulics and treatment efficiency. More information and understanding about how sludge distribution affects pond characteristics will lead to better informed maintenance decisions by ponds managers, and could lead to design improvements.
The high-resolution data collected by the sonar is a significant improvement on traditional sludge profiling techniques, with output images clearly showing the formation of channels and areas of high sludge (e.g., Figure 4B). In addition, due to ability to collect the high-resolution data with the ROV rapidly, it is possible to use it for diagnostic purposes, such as in the case of operators observing abnormal hydraulic characteristics in pond after sludge removal. An example of using the ROV as a diagnostic tool is shown in Figure 6, which clearly indicates the areas where sludge has been removed. It was then determined that the sub-optimal sludge removal, coupled with the large decants of incoming water that this pond receives several times a day, had created a scour effect around the inlet end, resulting in the formation of a 10 m wide U-shaped channel, explaining the abnormal hydrodynamic behavior being observed by pond managers.
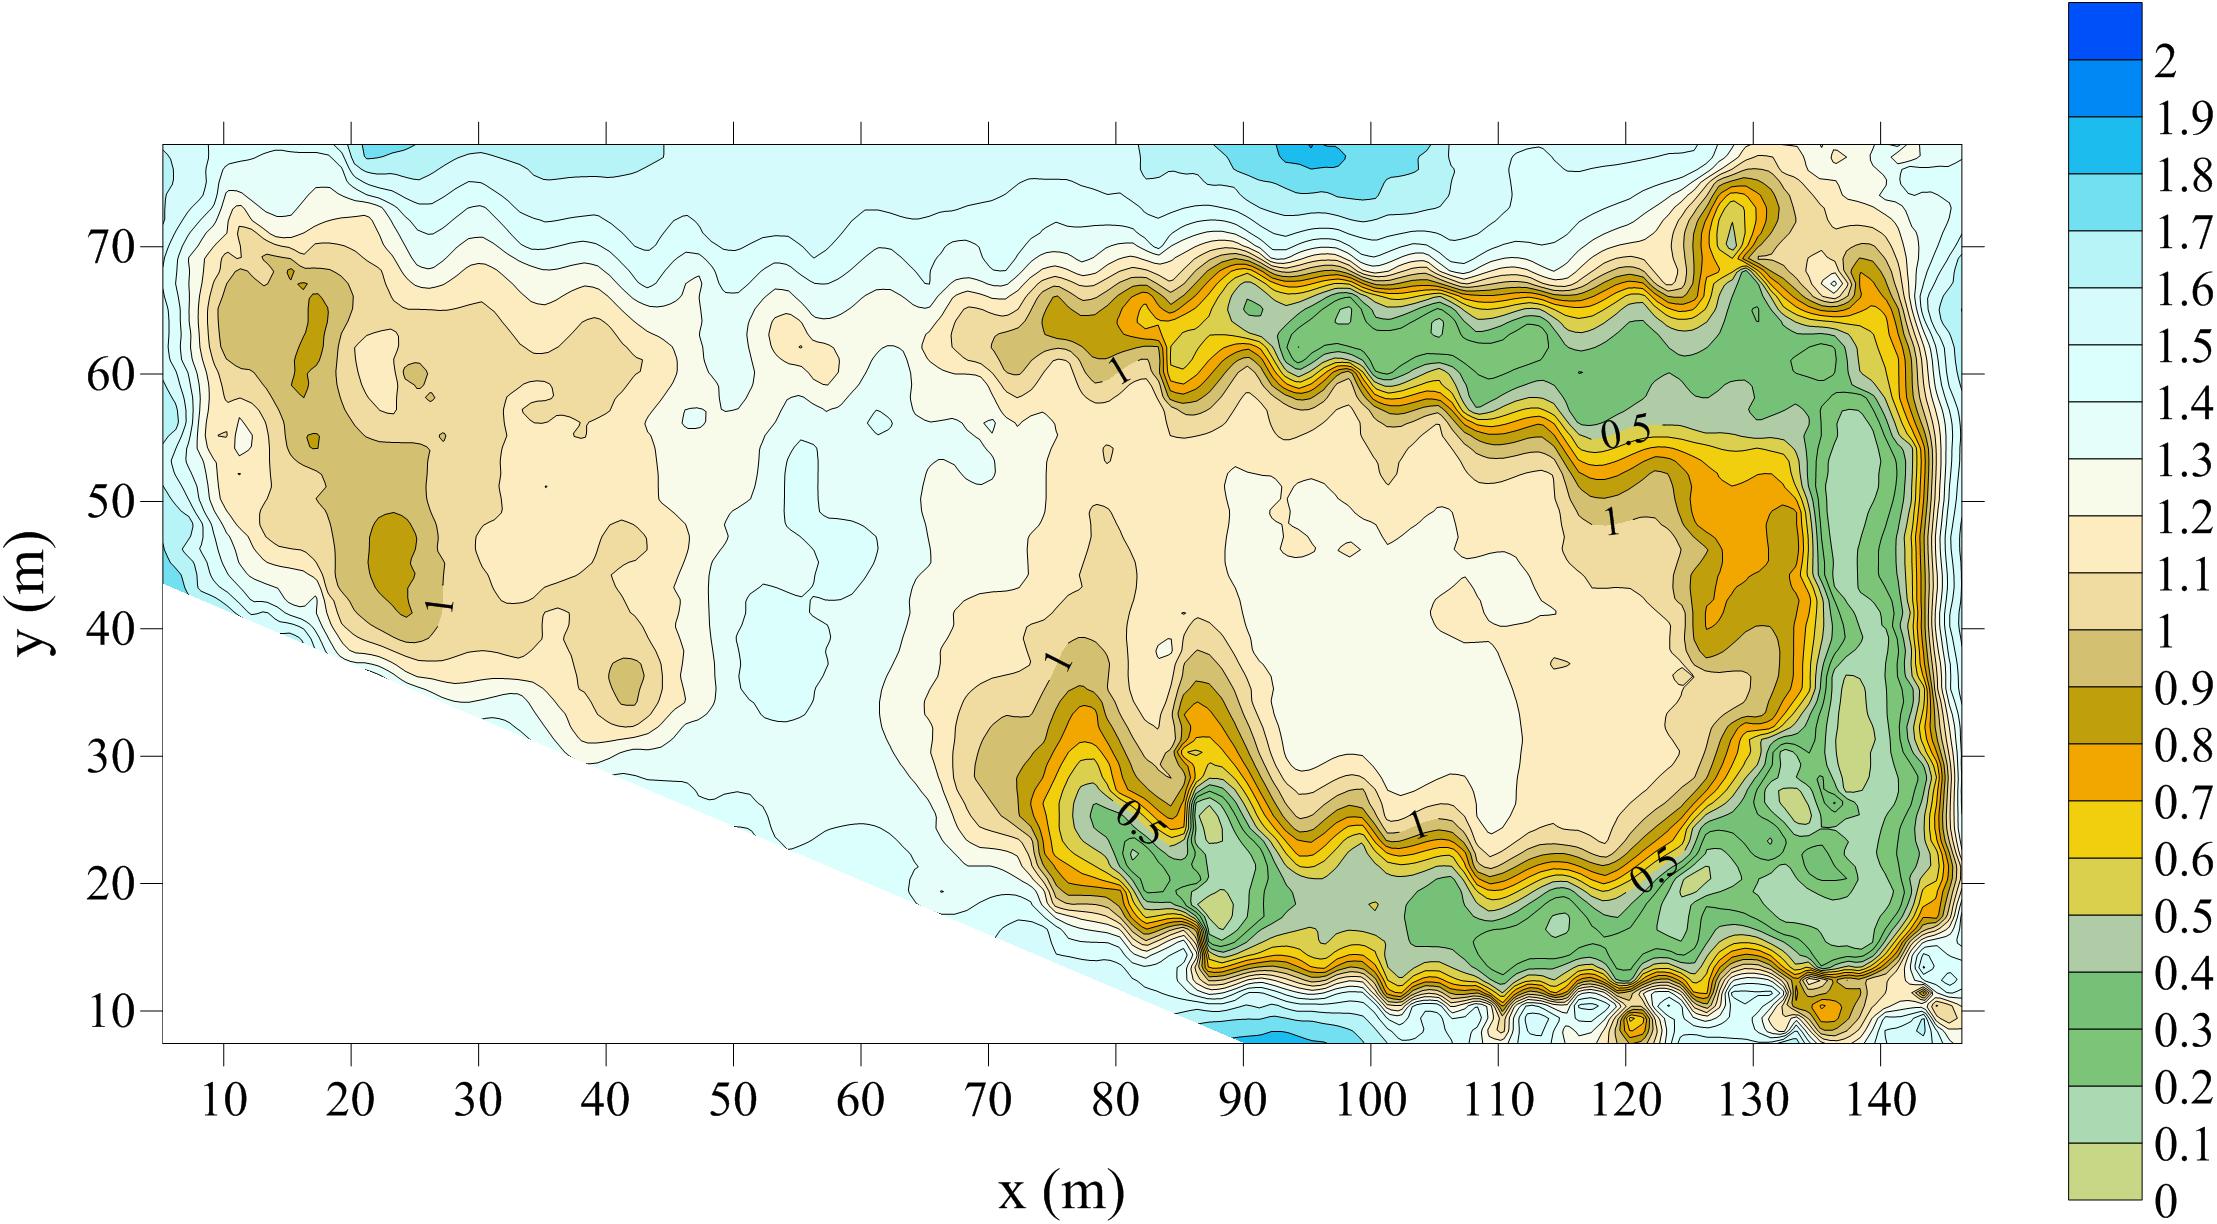
Figure 6. Sludge bathymetry in a pond that was reported to be displaying abnormal hydraulic behavior. Color scale indicates sludge height from the bottom of the pond in meters. The most significant feature in this profile is the U-shaped channel that has formed around the eastern edge of the pond. The inlet is located at approximately (142,70).
This example makes it clear that the high-resolution bathymetric data collected using sonar profiling is an extremely useful tool for the determination of sludge distribution in ponds. Using traditional profiling techniques, which can only capture pond-scale features, this discovery could have easily been missed, as channel features could be at smaller scales than the discreet sample spacing. Moreover, it shows that the sonar can be used high-resolution diagnostic tool to understand the hydraulics in ponds. Most importantly, this critical high-resolution data can be collected without the need to go out onto WSPs in a boat, addressing several safety considerations. The portability and convenience of this technology could be applied on ponds on a more frequent basis (e.g., monthly vs. yearly), to collect valuable data on sludge accumulation rates.
Previously bathymetric data from traditional sludge surveys in WSPs have been used to create computational fluid dynamics (CFD) models with varying levels of success (Olukanni and Ducoste, 2011; Alvarado et al., 2012a, 2013; Sah et al., 2012; Passos et al., 2014). Due to low-resolution of data input as bathymetry, these models have been harder to validate against actual conditions. Several studies have found that higher resolution data would significantly improve the accuracy to CFD models of WSPs (Daigger, 2011; Alvarado et al., 2012a); with the increased spatial resolution provided by profiling with sonar being an ideal solution to this. The increase in bathymetric resolution, coupled with tracer test data, will allow for better calibration and validation of models (Sah et al., 2011; Alvarado et al., 2012b; Passos et al., 2016), and will increase the reliability of model outputs. In turn these improvements to models will increase our understanding of WSP systems, and allow for more accurate modeling of the effects of pond installations, such as baffles, as well as aid in the management of ponds, including desludging.
Applying this to sludge management, a CFD model could be used to determine the differences between different sludge infill scenarios, for example, the current operating sludge distribution in a pond versus the same pond with no sludge; this has been demonstrated in Coggins et al. (2017). Modeling with high-resolution bathymetric data in WSPs is very promising, and with the addition of wind forcing (such as in: Shilton and Harrison, 2003), will become a useful diagnostic and predictive tool for existing and new systems, respectively; this could also extent to the design of baffles for existing/new systems, as demonstrated in Coggins et al. (2018). Therefore, the addition of high-resolution bathymetry data is a step in the right direction for more spatial accuracy in the CFD modeling of WSP systems.
The idea for this project was a grassroots idea from the operational level of our water industry partner. Since the inception of the project, it has relied upon the input of a large community ranging from on-site operators to executives. Unforeseen by us, and as a pleasant surprise, this initially small community has developed into a Community of Practice (CoP) across Australia, which has provided us continuous and ongoing support, as well as suggestions for improvement to the hardware, software, and training. One of the benefits of the growing CoP is the expansion of the application of the ROV beyond WSPs and the water industry, into a range of applications by local and state government, mining companies, and researchers. Recently, the CoP has extended into the upgrade and software architecture redesign of the SludgePro software through a university innovation initiative. This significant upgrade is expected to result in an improved product for analyzing and storing data, as well as possibly including machine learning to aid managers in decision making and forecasting.
Stormwater Wetlands
In addition to being used extensively on WSPs, the boat has been used on a series of stormwater retention wetlands in Melbourne, Australia. Rather than using the data collected to infer sludge height in ponds, the boat was used for bathymetry surveys of three basins along Troups Creek. For these surveys SludgePro is not used to analyze data, however, the same methodology that is used in SludgePro was used (as outlined in section “Data Processing and Analysis”). Filtered data (using a Python script) was input into ArcGIS to create a Triangular Irregular Network (TIN) for visualization. This shows that there are several different ways to analyze, visualize, and interpret collected data. The high-resolution bathymetry data (Figure 7) was also then able to input into a flow model of the creek network, to assist with the other research being carried out.
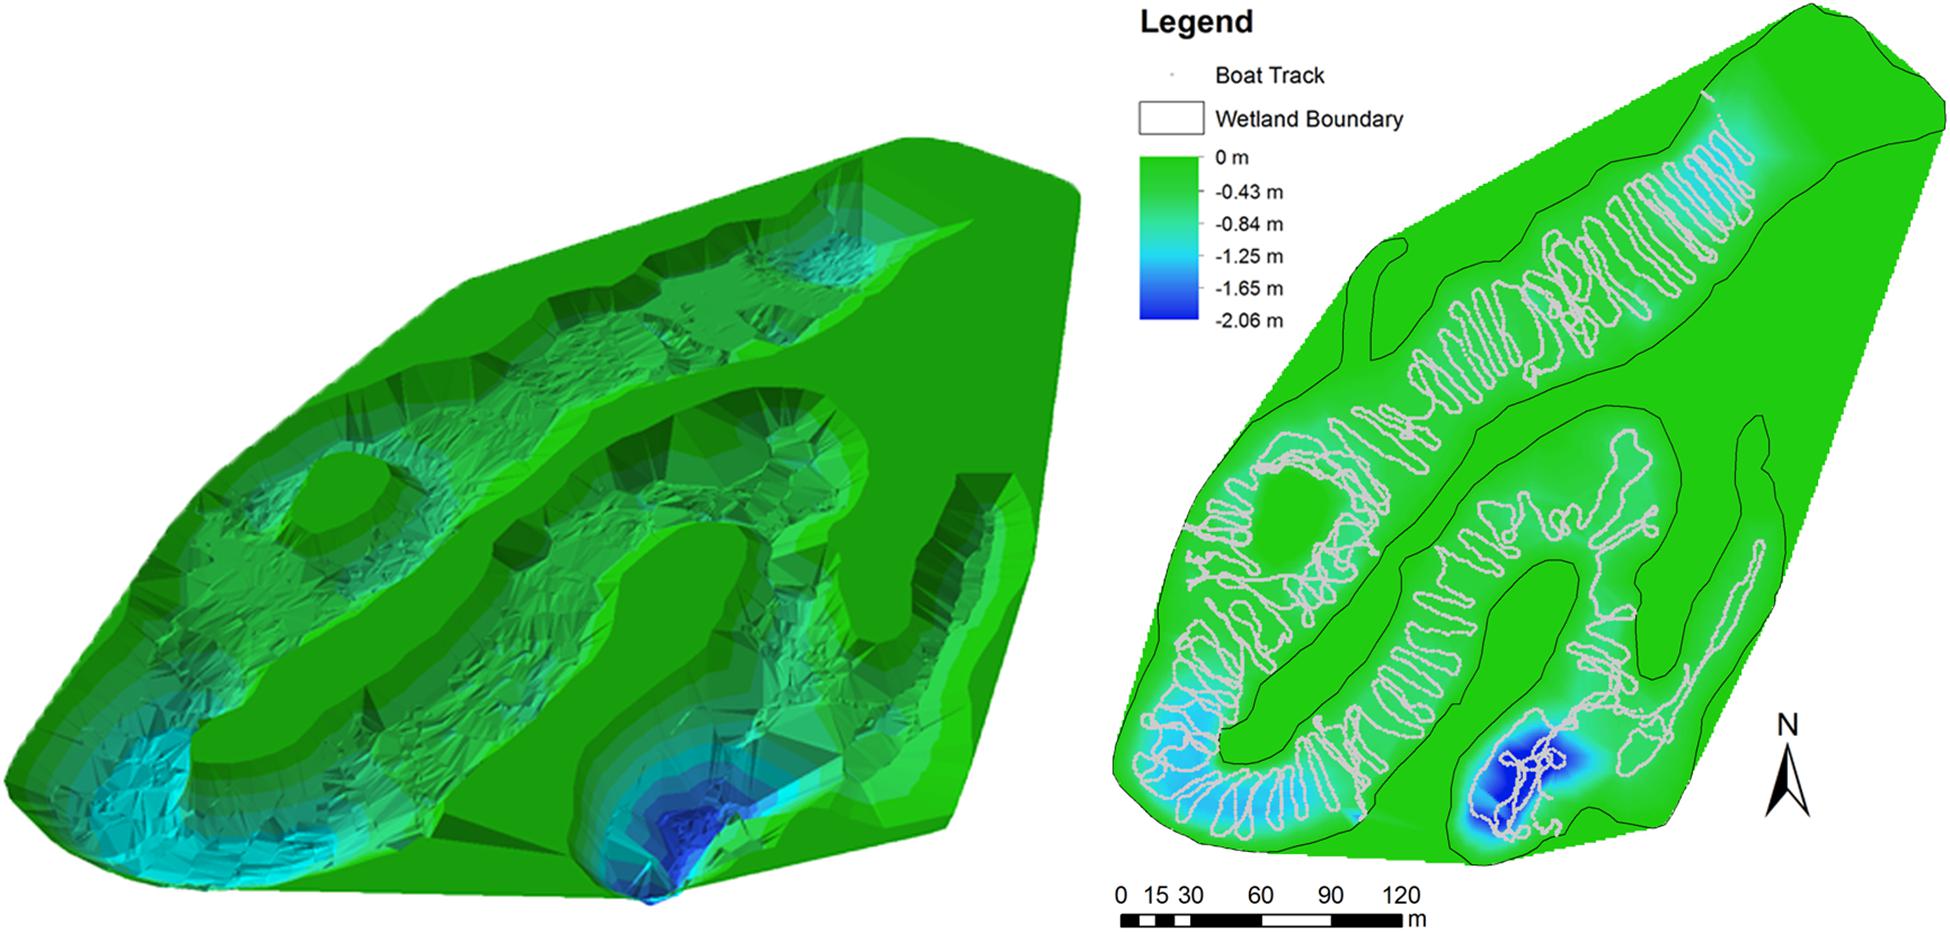
Figure 7. Bathymetric survey of the main wetland of Troups Creek, 3D (left) and plan view with scale and boat survey track (right), both showing water depth (Image: P. M. Bach).
Lakes
Rottnest Island, approximately 20 km off the coast of Western Australia, has a series of environmentally significant salt lakes, and despite a long history of people inhabiting the island, and it being a popular tourist destination, a comprehensive bathymetric survey of the lakes had never been conducted. The Rottnest Island Authority deployed the remote control boat on this series of lakes over a 1-month period in November/December 2015. The collection of this data was vital for the island authority in order to protect the unique environment of these lakes from the impacts of tourism and development on the island. The profiling of these lakes was a significant test for the boat, as these lakes were significantly larger than any of the WSPs previously profiled, with the largest lake approximately 1900 m in length, and 650 m in width. Eight lakes on the island were surveyed, and the data processed and analyzed using the statistical tools available in the ArcGIS package.
River Pools
The Canning River is a major tributary of the Swan River, in the southwest of Western Australia. In the upper reaches of the river, there are many small to medium sized natural pools. Anecdotal evidence from regular users of the river, and the River Guardians (State Government Department of Biodiversity, Conservation and Attractions, Western Australia), is that these pools are ecologically significant; however, the effect of natural sediment build-up in these pools is unknown. Due to its size and portability, the ROV with sonar is well suited for conducting surveys of these pools, with 10 pools having been profiled since mid-2015 (e.g., Figure 8).
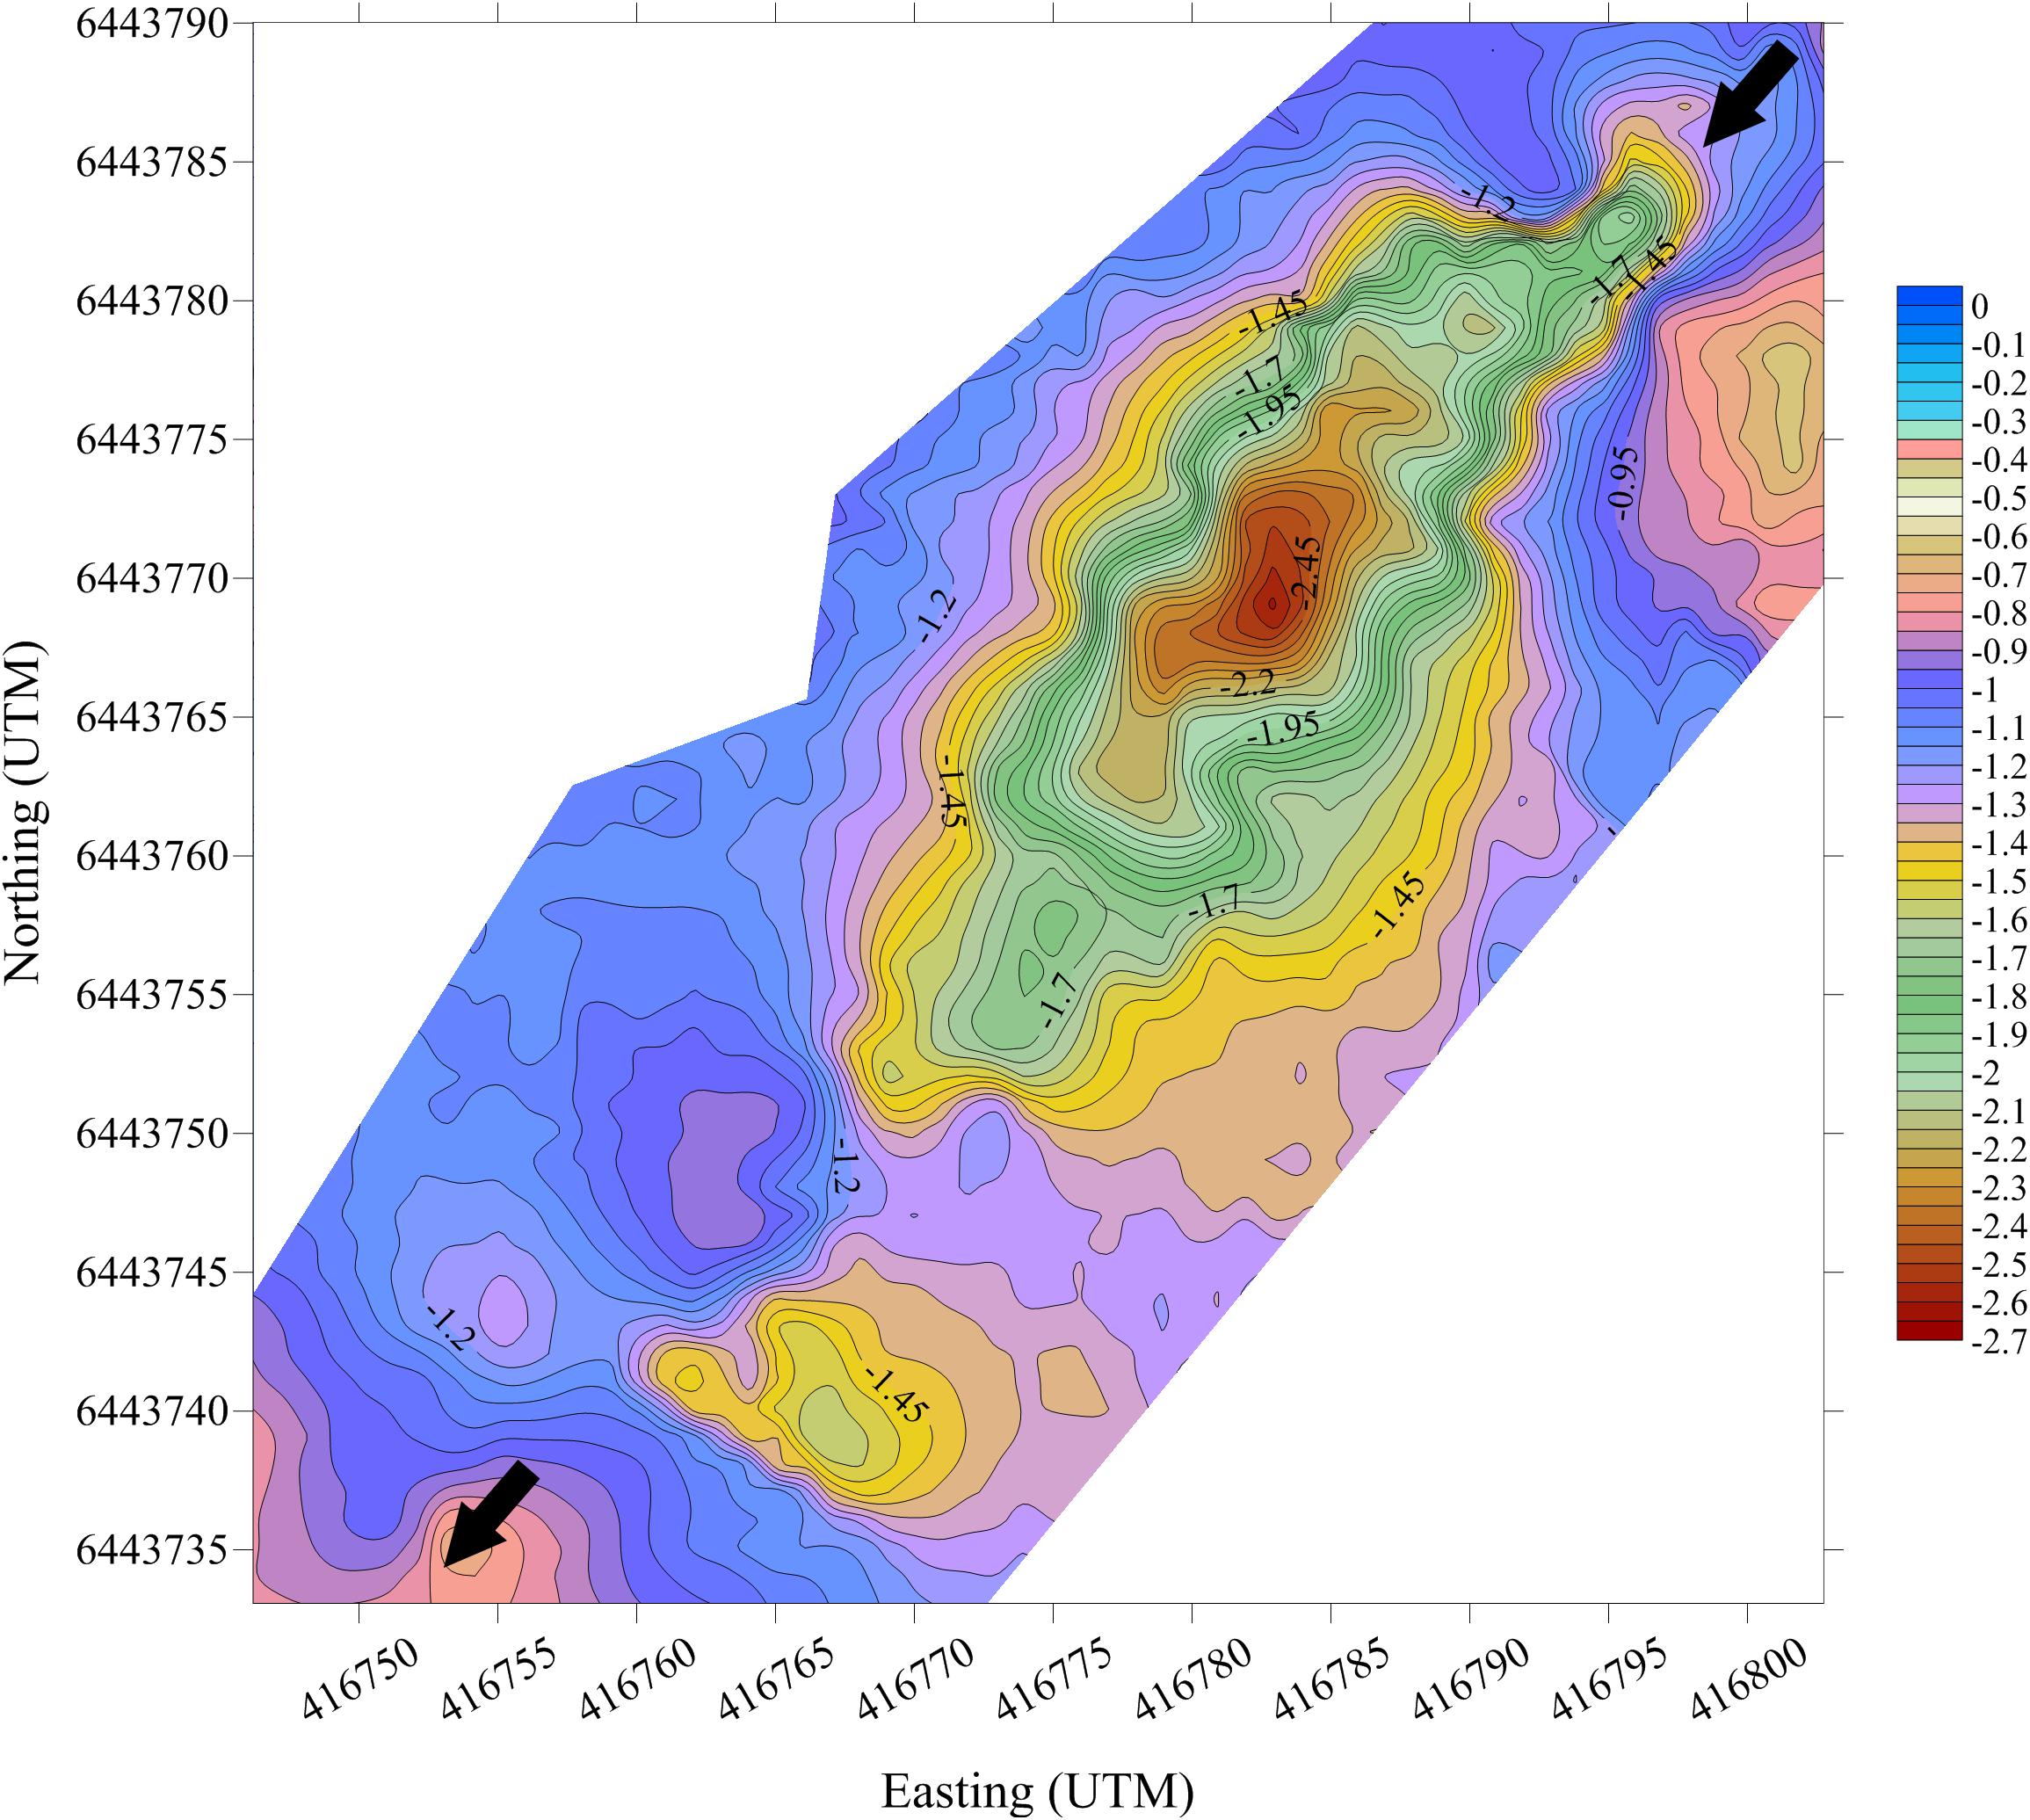
Figure 8. Bathymetry of a pool along the Canning River. Color scale indicates water depth in meters and the arrows indicate the direction of flow.
Conclusion
From this study, we can conclude that the remote control boat (or ROV) successfully measures sludge distribution with high-resolution. This then allows the construction of detailed 2D and 3D plots of the sludge blanket, showing the formation of features such as channels and pockets. Most importantly, this method allows the collection of high-resolution bathymetric data without going onto WSPs in a boat, addressing several important safety considerations. The ROV is a reliable tool that has been successfully deployed on over 400 Australian WSP of various geometries and sludge distributions, stormwater retention wetlands, lakes, and river pools. Our ability to obtain sludge distribution and accumulation data rapidly will prove invaluable in the future. This technology will help in the development of frameworks for wastewater sludge management, and could potentially have a wider application in the monitoring of other small to medium water bodies, including reservoirs, channels, recreational water bodies and commercial ports.
Author Contributions
LC and AG designed the equipment and experiments. LC collected the field data and completed the statistical analysis. LC wrote the manuscript with input from AG.
Funding
This work was supported by the Water Corporation of Western Australia and an Australian Research Council Grant (LP130100856). LC was supported by a Prescott Postgraduate Scholarship and Research Impact Grant from The University of Western Australia and a TasWater Wastewater Engineering Scholarship.
Conflict of Interest
The authors declare that the research was conducted in the absence of any commercial or financial relationships that could be construed as a potential conflict of interest.
Acknowledgments
We would like to thank A. Chua, D. Italiano, T. Rintoul, S. McPhee, B. Kerenyi, and K. Eade from the Water Corporation for all their help with fieldwork, suggestions, and sourcing information. At UWA we would like to thank F. Tan for carrying out modifications to the early boats, D. Stanley for electronics advice and help, J. J. Langan for repairs, maintenance, and enthusiastic assistance in the field, A. Stubbs for boat repairs, and E. S. Reichwaldt for advice and help with fieldwork. We would also like to thank Richard from Stanbridges Hobbies for early sourcing of different hulls and electrical work and repairs, S. Stratfold for building us robust fiberglass boat hulls in bulk, C. Bosserelle for writing the SludgePro script and design of the frontend, and S. A. A. Shah for modifications to the scripts.
References
Alvarado, A., Sanchez, E., Durazno, G., Vesvikar, M., and Nopens, I. (2012a). CFD analysis of sludge accumulation and hydraulic performance of a waste stabilization pond. Water Sci. Technol. 66, 2370–2377. doi: 10.2166/wst.2012.450
Alvarado, A., Vedantam, S., Goethals, P., and Nopens, I. (2012b). A compartmental model to describe hydraulics in a full-scale waste stabilization pond. Water Res. 46, 521–530. doi: 10.1016/j.watres.2011.11.038
Alvarado, A., Vesvikar, M., Cisneros, J. F., Maere, T., Goethals, P., and Nopens, I. (2013). CFD study to determine the optimal configuration of aerators in a full-scale waste stabilization pond. Water Res. 47, 4528–4537. doi: 10.1016/j.watres.2013.05.016
Bandini, F., Olesen, D., Jakobsen, J., Kittel, C. M. M., Wang, S., Garcia, M., et al. (2018). Technical note: bathymetry observations of inland water bodies using a tethered single-beam sonar controlled by an unmanned aerial vehicle. Hydrol. Earth Syst. Sci. 22, 4165–4181. doi: 10.5194/hess-22-4165-2018
Coggins, L., Sounness, J., Zheng, L., Ghisalberti, M., and Ghadouani, A. (2018). Impact of hydrodynamic reconfiguration with baffles on treatment performance in waste stabilisation ponds: a full-scale experiment. Water 10:109. doi: 10.3390/w10020109
Coggins, L. X., Ghisalberti, M., and Ghadouani, A. (2017). Sludge accumulation and distribution impact the hydraulic performance in waste stabilisation ponds. Water Res. 110, 354–365. doi: 10.1016/j.watres.2016.11.031
Daigger, G. T. (2011). A practitioner’s perspective on the uses and future developments for wastewater treatment modelling. Water Sci. Technol. 63, 516–526. doi: 10.2166/wst.2011.252
Ghadouani, A., and Coggins, L. X. (2011). Science, technology and policy for water pollution control at the watershed scale: current issues and future challenges. Phys. Chem. Earth Parts A/B/C 36, 335–341. doi: 10.1016/j.pce.2011.05.011
Glaz, P., Bartosiewicz, M., Laurion, I., Reichwaldt, E. S., Maranger, R., and Ghadouani, A. (2016). Greenhouse gas emissions from waste stabilisation ponds in Western Australia and Quebec (Canada). Water Res. 101, 64–74. doi: 10.1016/j.watres.2016.05.060
Hernandez-Paniagua, I. Y., Ramirez-Vargas, R., Ramos-Gomez, M. S., Dendooven, L., Avelar-Gonzalez, F. J., and Thalasso, F. (2014). Greenhouse gas emissions from stabilization ponds in subtropical climate. Environ. Technol. 35, 727–734. doi: 10.1080/09593330.2013.848910
Kaizu, Y., Iio, M., Yamada, H., and Noguchi, N. (2011). Development of unmanned airboat for water-quality mapping. Biosyst. Eng. 109, 338–347. doi: 10.1016/j.biosystemseng.2011.04.013
Kriechbaumer, T., Blackburn, K., Everard, N., and Rivas Casado, M. (2015). Acoustic Doppler current profiler measurements near a weir with fish pass: assessing solutions to compass errors, spatial data referencing and spatial flow heterogeneity. Hydrol. Res. 47, 591–605.
Nelson, K. L., Cisneros, B. J., Tchobanoglous, G., and Darby, J. L. (2004). Sludge accumulation, characteristics, and pathogen inactivation in four primary waste stabilization ponds in central Mexico. Water Res. 38, 111–127. doi: 10.1016/j.watres.2003.09.013
Olukanni, D. O., and Ducoste, J. J. (2011). Optimization of waste stabilization pond design for developing nations using computational fluid dynamics. Ecol. Eng. 37, 1878–1888. doi: 10.1016/j.ecoleng.2011.06.003
Passos, R. G., Dias, D. F. C., and von Sperling, M. (2016). Review of practical aspects for modelling of stabilization ponds using computational fluid dynamics. Environ. Technol. Rev. 5, 78–102. doi: 10.1080/21622515.2016.1251499
Passos, R. G., von Sperling, M., and Ribeiro, T. B. (2014). Hydrodynamic evaluation of a full-scale facultative pond by computational fluid dynamics (CFD) and field measurements. Water Sci. Technol. 70, 569–575. doi: 10.2166/wst.2014.265
Peña, M. R., Mara, D. D., and Sanchez, A. (2000). Dispersion studies in anaerobic ponds: implications for design and operation. Water Sci. Technol. 42, 273–282. doi: 10.2166/wst.2000.0660
Persson, J. (2000). The hydraulic performance of ponds of various layouts. Urban Water 2, 243–250. doi: 10.1016/S1462-0758(00)00059-5
Picot, B., Sambuco, J. P., Brouillet, J. L., and Riviere, Y. (2005). Wastewater stabilisation ponds: sludge accumulation, technical and financial study on desludging and sludge disposal case studies in France. Water Sci. Technol. 51, 227–234. doi: 10.2166/wst.2005.0469
Sah, L., Rousseau, D. P. L., and Hooijmans, C. M. (2012). Numerical modelling of waste stabilization ponds: where do we stand? Water Air Soil Pollut. 223, 3155–3171. doi: 10.1007/s11270-012-1098-4
Sah, L., Rousseau, D. P. L., Hooijmans, C. M., and Lens, P. N. L. (2011). 3D model for a secondary facultative pond. Ecol. Model. 222, 1592–1603. doi: 10.1016/j.ecolmodel.2011.02.021
Shilton, A., and Harrison, J. (2003). Development of guidelines for improved hydraulic design of waste stabilisation ponds. Water Sci. Technol. 48, 173–180. doi: 10.2166/wst.2003.0114
Singh, K., Worley, J., and Risse, M. (2008). Sludge measurement using global positioning system (GPS) enabled sonar equipped airboat in a lagoon. Appl. Eng. Agric. 24, 603–609. doi: 10.13031/2013.25275
Keywords: bathymetry, mapping, survey, waste stabilization ponds, lakes, ponds, remote sensing, water bodies
Citation: Coggins LX and Ghadouani A (2019) High-Resolution Bathymetry Mapping of Water Bodies: Development and Implementation. Front. Earth Sci. 7:330. doi: 10.3389/feart.2019.00330
Received: 31 January 2019; Accepted: 27 November 2019;
Published: 10 December 2019.
Edited by:
Rolf Hut, Delft University of Technology, NetherlandsReviewed by:
Ulf Mallast, Helmholtz Centre for Environmental Research (UFZ), GermanyJulia Hopkins, Delft University of Technology, Netherlands
Hessel Winsemius, Delft University of Technology, Netherlands
Copyright © 2019 Coggins and Ghadouani. This is an open-access article distributed under the terms of the Creative Commons Attribution License (CC BY). The use, distribution or reproduction in other forums is permitted, provided the original author(s) and the copyright owner(s) are credited and that the original publication in this journal is cited, in accordance with accepted academic practice. No use, distribution or reproduction is permitted which does not comply with these terms.
*Correspondence: Liah X. Coggins, bGlhaC5jb2dnaW5zQHV3YS5lZHUuYXU=; Anas Ghadouani, YW5hcy5naGFkb3VhbmlAdXdhLmVkdS5hdQ==