 Yufei Liu
 Steven A. Margulis
- Department of Civil and Environmental Engineering, University of California, Los Angeles, Los Angeles, CA, United States
A Bayesian approach to estimate bias and uncertainty in snowfall precipitation from MERRA-2 and other precipitation products was applied over High Mountain Asia (HMA), using a newly developed snow reanalysis method. Starting from an “uninformed” prior probability distribution, a posterior scaling factor applied to MERRA-2 snowfall was derived by constraining model-based estimates of seasonal snow accumulation and ablation over the water year (WY) with fractional snow covered area (fSCA) measurements derived from Landsat and MODIS (MODSCAG). Several sub-domains (nine representative 1° by 1° tiles) across HMA were examined over the period WYs 2001–2015 and compiled into an uncertainty parameterization where a lognormal distribution was fitted to the empirical posterior distribution with a mean of 1.54 (median of 1.19) and coefficient of variation (CV) of 0.83, indicating that MERRA-2 underestimates snowfall on average by ∼54% with sizeable uncertainty. For reference, the uncertainties in snowfall precipitation from the ERA5 and APHRODITE-2 precipitation products were also evaluated, and these products were found to underestimate snowfall, on average by a factor around 1.78 and 3.34 (with median scaling factors of 1.42 and 2.51), respectively. The results indicate that snowfall precipitation at high-elevations dominated by snowfall is underestimated in most existing products, especially in the gauge-based APHRODITE-2 product, where the biases were also found to exhibit geographical variations with the largest underestimation in monsoon-influenced high-elevation tiles. The derived MERRA-2 uncertainty model is being used to develop a full domain-wide HMA snow reanalysis, which will shed further light onto the space-time variations in snowfall biases in these products.
Introduction
Accurate snowfall information is vital for hydrological modeling in snow-dominated regions, as it directly affects the estimation of snow water equivalent (SWE), and also influences streamflow prediction fed by snowmelt. This is especially important in High Mountain Asia (HMA), where a significant amount of precipitation falls as snow, resulting in large contributions of snowmelt to streamflow in many of its river basins (Bookhagen and Burbank, 2010).
Snowfall is highly uncertain in HMA due to the large spatial variability in precipitation, limited ground observations, and uncertainty in satellite measured precipitation (Andermann et al., 2011; Bolch et al., 2012; Palazzi et al., 2013; Maussion et al., 2014). Meteorological stations are sparsely located in this region, generally located at lower elevations, and therefore data from these stations can lack representativeness of precipitation at unmonitored locations, most notably higher elevations (Winiger et al., 2005; Palazzi et al., 2013). Satellite observations such as TRMM (Tropical Rainfall Measuring Mission; Huffman et al., 2007) can provide spatially continuous precipitation estimates, but have been found to be uncertain and potentially biased in the HMA region (Anders et al., 2006; Bookhagen and Burbank, 2006; Andermann et al., 2011; Hussain et al., 2017; Khan and Koch, 2018; Khan et al., 2018). In addition, both remote sensing and in situ data sources generally perform worse at characterizing snowfall compared to rainfall, often with significant underestimates of snowfall rates, because their instruments are mainly designed to measure liquid rainfall rather than snow or ice (Anders et al., 2006; Viste and Sorteberg, 2015).
Precipitation can also be obtained from gridded datasets over the HMA region, including those derived from atmospheric reanalysis such as MERRA-2 (Modern-Era Retrospective analysis for Research and Applications, version 2; Gelaro et al., 2017), and those that leverage interpolated rain-gauge data such as APHRODITE (Asian Precipitation Highly Resolved Observational Data Integration Toward Evaluation; Yatagai et al., 2012). Due to their coarse resolution, these gridded datasets often do not fully capture orographic precipitation in complex terrain (Palazzi et al., 2013) and those reliant on interpolated gauge data will suffer from the same representativeness issues at high elevations. Previous studies have investigated the uncertainty and bias in precipitation datasets, where significant variability among precipitation products was found over the Hindu-Kush Karakoram Himalayas region, in both total precipitation (Andermann et al., 2011; Palazzi et al., 2013) and snowfall estimates (Viste and Sorteberg, 2015).
Recent studies, using a variety of methods, suggest that most gridded precipitation datasets underestimate high-altitude precipitation in HMA. Tahir et al. (2011) found total annual precipitation estimates in APHRODITE to be lower than precipitation observed in high-altitude stations in the Hunza River Basin over the Karakoram range. Immerzeel et al. (2015) showed, by inversely inferring precipitation from glacier mass balance, that high-elevation precipitation in the upper Indus basin is underestimated in APHRODITE, ERA-Interim, and TRMM, where ERA-Interim is a global atmospheric reanalysis from the European Centre for Medium-Range Weather Forecasts (ECMWF; Dee et al., 2011). Similarly, through evaluating runoff from glacio-hydrological modeling against observations, Wortmann et al. (2018) showed APHRODITE underestimates precipitation by a factor of 1.5–4.4 in Tarim headwater catchments. The information gleaned from these previous studies generally provides bulk bias estimates through inferring precipitation from spatially integrated variables like streamflow or glacier mass balance. Moreover, most of the studies to date have focused on the upper Indus basin or other small-scale catchments and on total precipitation, but provide less information over the broad HMA domain, and have not quantified the biases in snowfall.
In this work, we used a Bayesian approach to estimate biases and uncertainties in MERRA-2 snowfall precipitation using a newly developed snow reanalysis method (Margulis et al., 2019) that can indirectly infer precipitation estimates, by constraining prior model estimates with remotely sensed fSCA images over the HMA region. The specific motivation for this study is to generate reasonable uncertainty estimates for snowfall precipitation in order to apply the same Bayesian approach over the full HMA domain as part of the NASA HMA project. However, the goal of providing an accurate accounting of precipitation uncertainty is relevant to any hydrologic modeling study in the region and therefore should be of interest beyond generating a new snow reanalysis dataset. Herein we aim to primarily characterize the uncertainty in MERRA-2 snowfall precipitation at several sub-domains within HMA. Based on that characterization and inter-comparison with other products (e.g., APHRODITE-2 and ERA5) we address the following questions: Is MERRA-2 snowfall biased over HMA and how can its bias and uncertainty be parameterized? Is snowfall biased in other gridded precipitation products and to what extent? How do the snowfall biases vary spatially for these products and what is the spatial-temporal distribution of snowfall?
Method and Dataset
Test Tiles and Years
The goal of this research is to characterize the uncertainty (including bias) in snowfall precipitation over HMA, which is critical for snow modeling in this region. We selected 9 representative tiles (1° longitude by 1° latitude) in our study domain to perform the analysis (Figure 1). These 9 test tiles were chosen to sample across variations in physiography and climate in the HMA region in order to assess the snowfall bias in different regimes. Four tiles are located in the western part of the domain, three tiles are located in southern part of the domain, and two tiles are located in the central/northeastern part of the domain (Figure 1). The expectation is that the precipitation regime of the first four tiles are dominated by winter westerlies, the southern three are influenced heavily by the Indian summer monsoon, and the remaining two are relatively dry locations forced by a mix of these and other synoptic drivers. Most of the selected tiles have a mean elevation above 3000 m, with limited glacier and forest cover (Table 1). The test years were chosen as water years (WYs) 2001 to 2015, where both Landsat and MODIS observations are used in the reanalysis method described below. The WY spans October 1st through September 30th of the following year, where the WY label corresponds to the calendar year in which the WY ends.
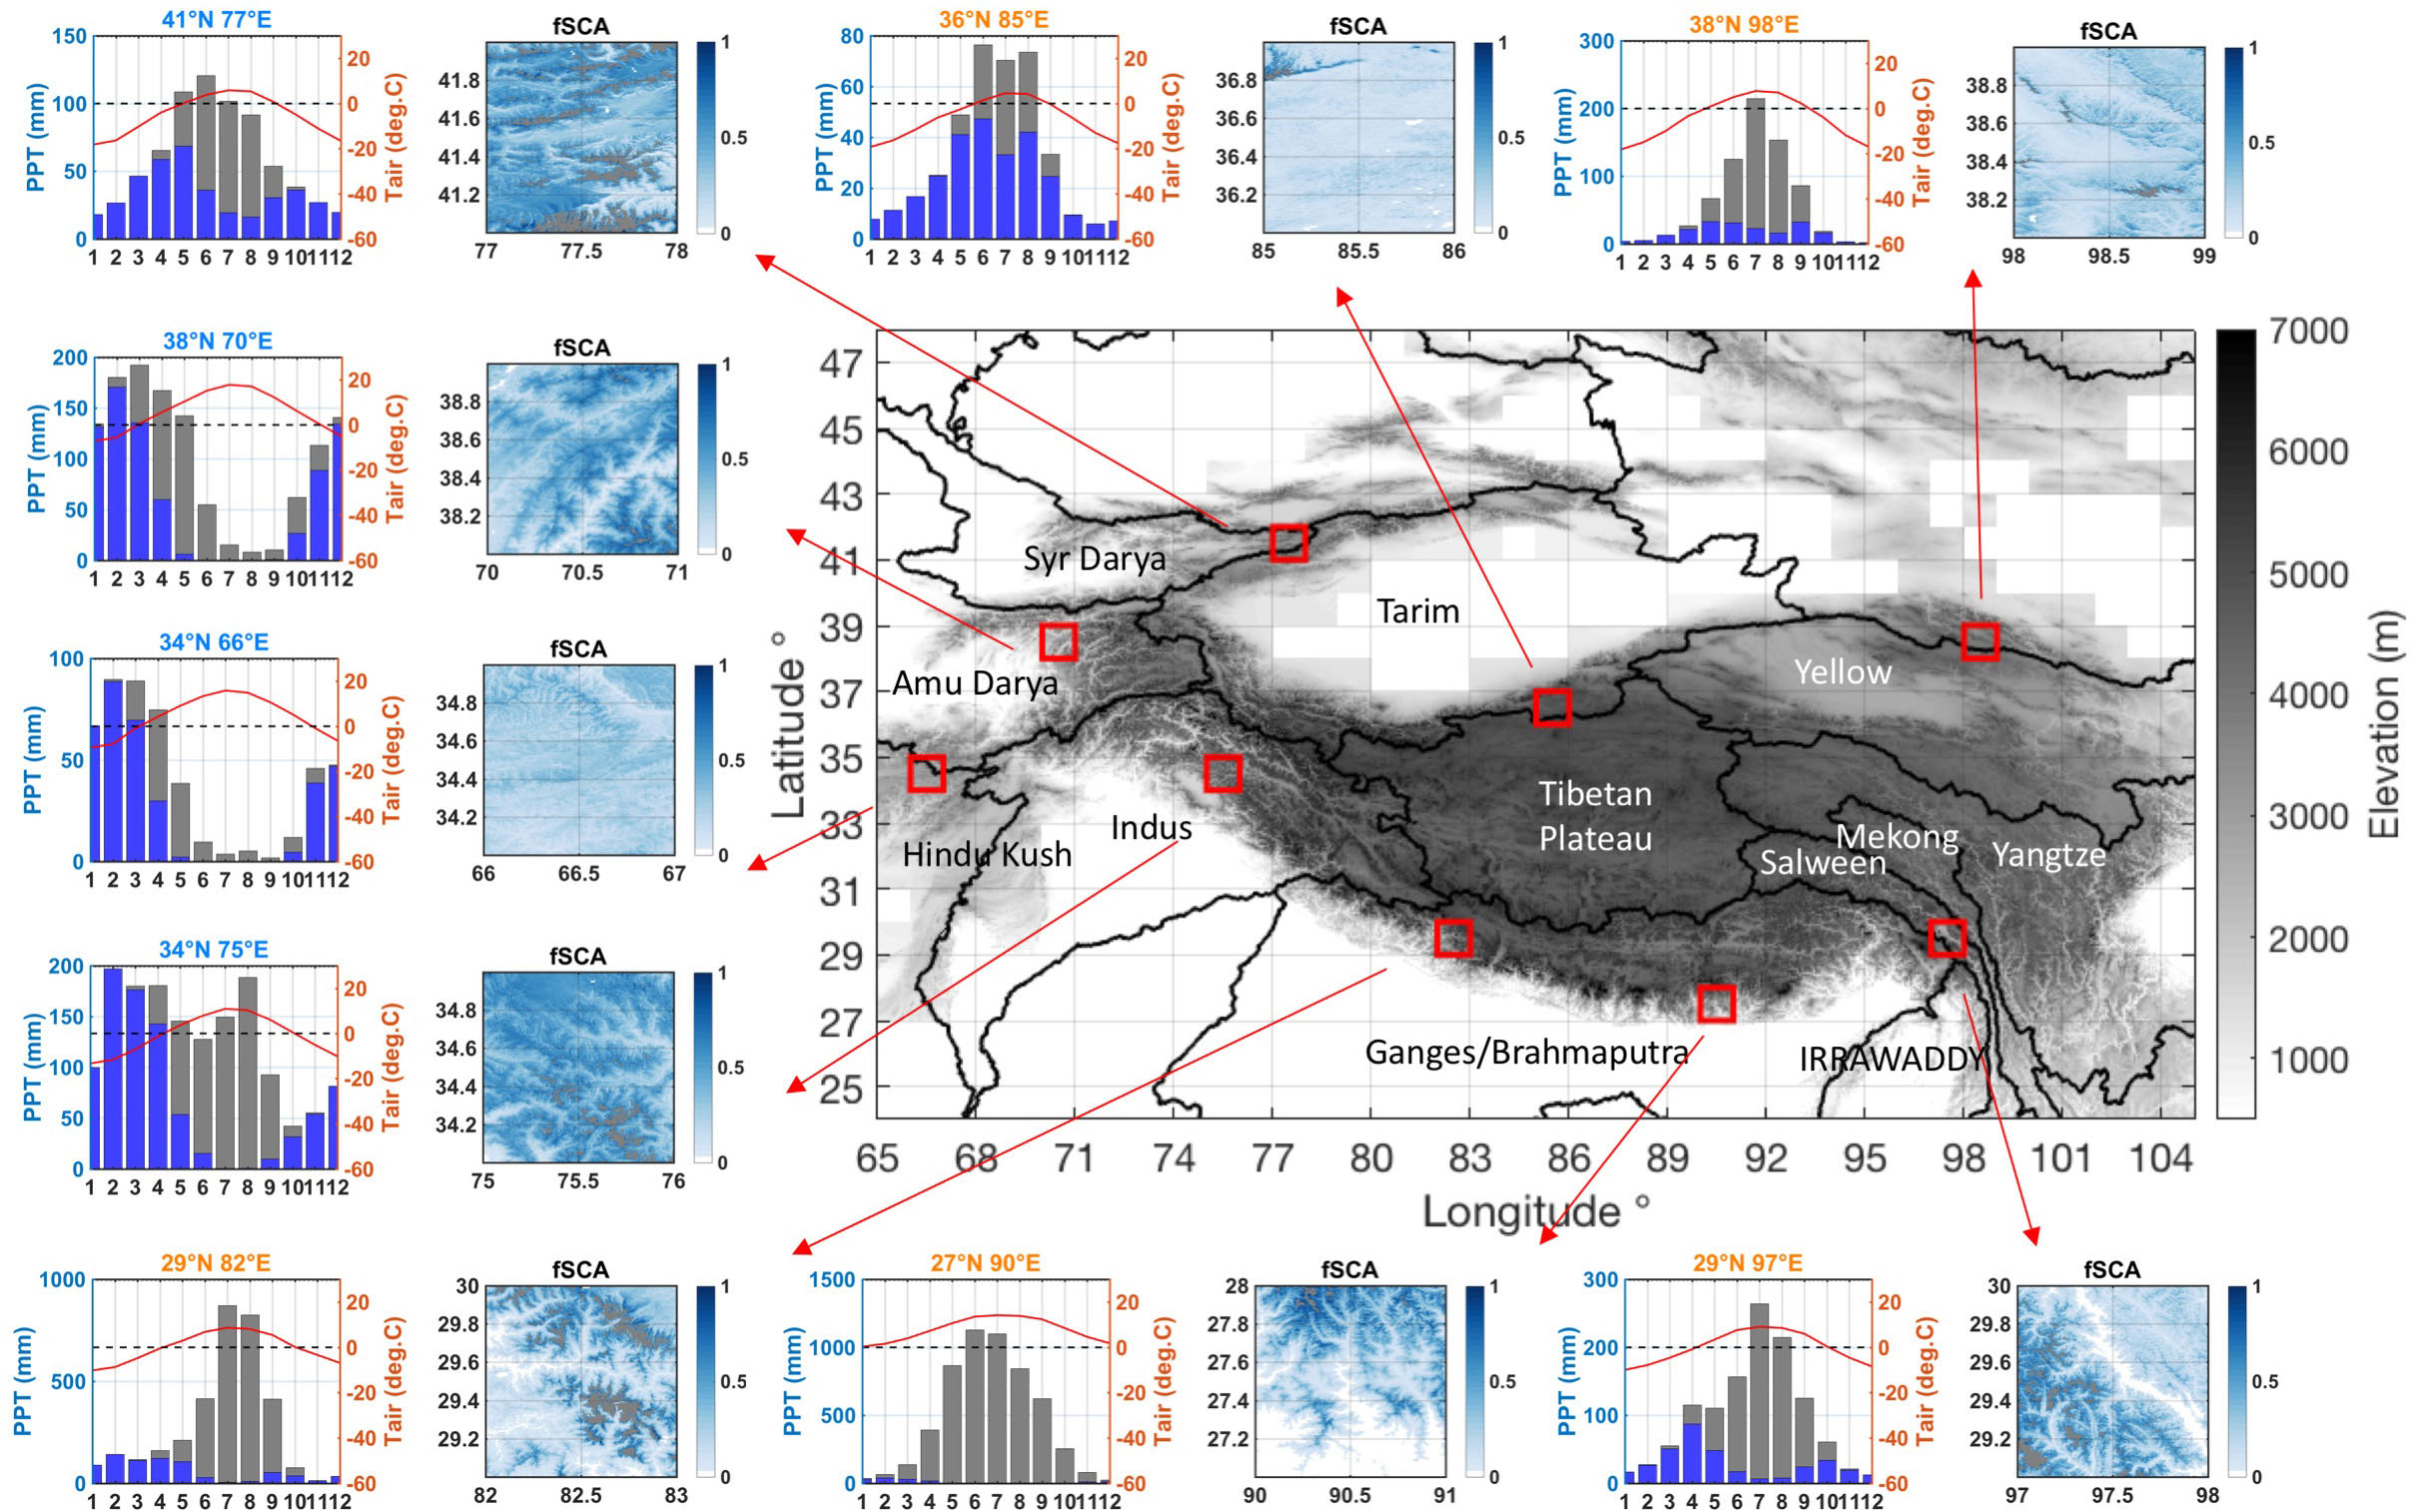
Figure 1. Elevation map of the HMA domain (middle) with locations of test tiles marked with red boxes. Major watersheds are delineated and labeled on the map, using the watershed boundaries from HydroSHEDS (Lehner et al., 2006). Corresponding to each test tile, the left panel shows the monthly climatology of precipitation (gray bars), snowfall (blue bars) and air temperature (red line), diagnosed by MERRA-2 data; the right panel shows the climatological mean fractional snow covered area (fSCA) map.
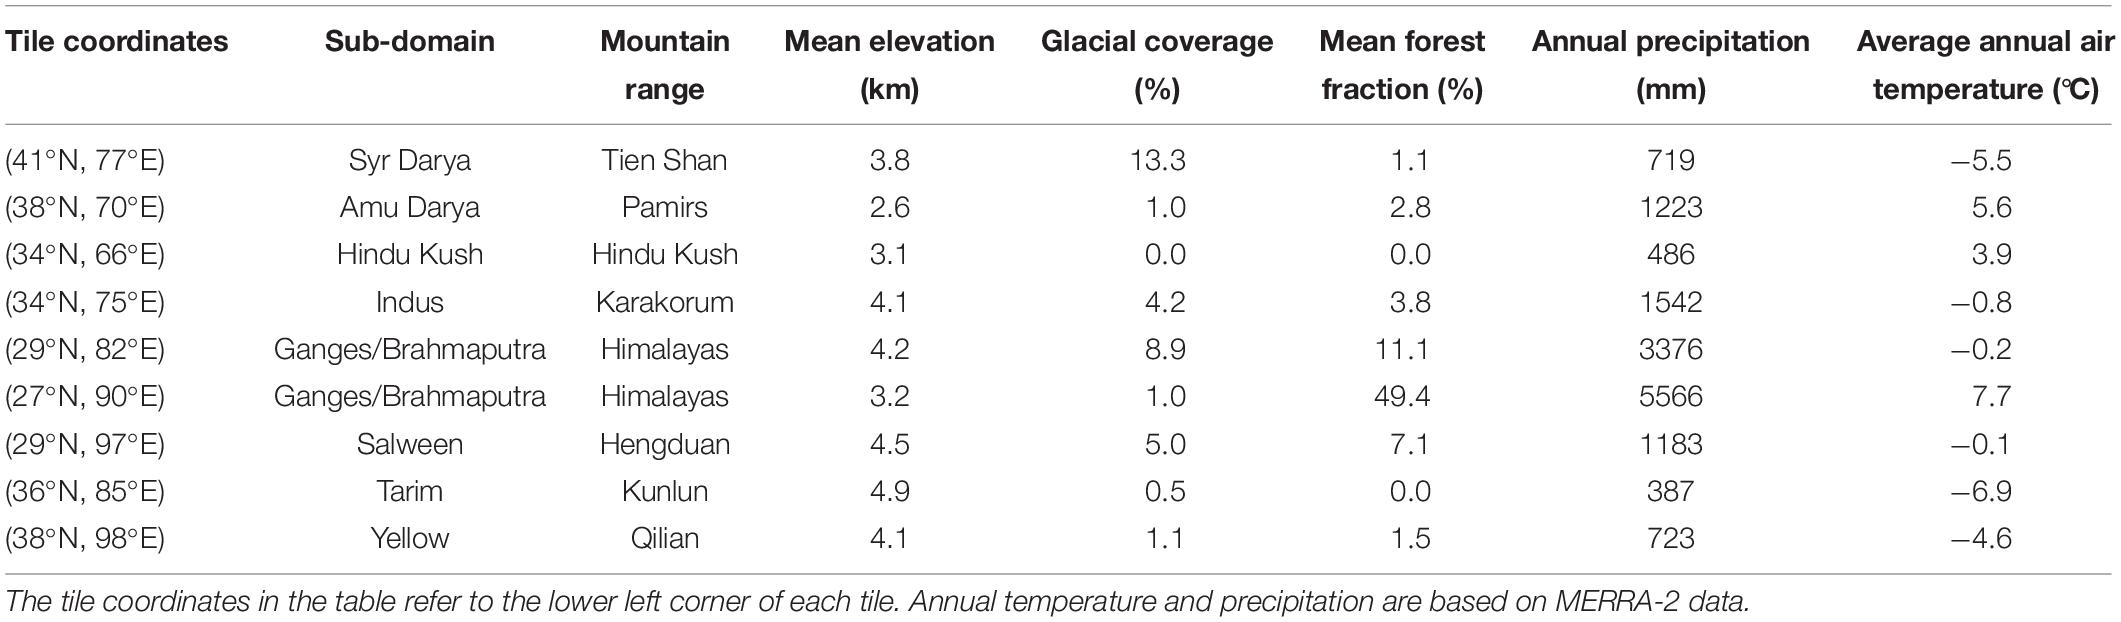
Table 1. Glaciation, climatological, and physiographic characteristics for the 9 test tiles.
Deriving the Bias and Uncertainty in MERRA-2 Snowfall Precipitation
In this paper, we used the ensemble-based snow reanalysis method (Margulis et al., 2019) as a tool for estimating unknown precipitation biases and general uncertainty. The method is designed to acknowledge the typically large prior uncertainty in precipitation in high mountain regions and use a data assimilation approach to derive a posterior estimate that is constrained by the remotely sensed fSCA depletion time series. Specifically, a scaling factor b for precipitation is employed for representing the prior uncertainty associated with the nominal precipitation estimate and its downscaling:
where j is the replicate (individual realization) index and N is the total number of replicates in the ensemble. Pj(xr,t) is the snow reanalysis precipitation in replicate j at snow reanalysis pixel and time t. In this application, the model resolution (xr) is ∼480 m (16 arcseconds). Pnom(xnom,t) is the nominal precipitation input from any precipitation data (e.g., MERRA-2 used in this study) at the nominal precipitation pixel xnom and time t. bj,nom(xr) is the scaling factor in replicate j at snow reanalysis pixel xr, with respect to the nominal precipitation input Pnom. Typically, a specific distribution for b has been used in previous snow reanalysis applications (e.g., Durand et al., 2008; Girotto et al., 2014a, b; Margulis et al., 2015, 2016; Cortés et al., 2016; Cortés and Margulis, 2017) with variations across different domains and/or with different precipitation products. For example, in the Sierra Nevada range in California (United States), b was postulated as lognormally distributed with a mean of 2.25 and CV of 0.25 when applied with NLDAS-2 (Xia et al., 2012) precipitation (Margulis et al., 2015, 2016). While in the Andes range in Central Chile, b was postulated as lognormally distributed with a mean of 1.75 and CV of 0.95 when used with MERRA (Rienecker et al., 2011) precipitation (Cortés et al., 2016; Cortés and Margulis, 2017). The b distributional parameters can be derived from in situ observation data (where available), and provide a mechanism for performing precipitation downscaling, first-order bias correction and prior uncertainty perturbation, where the snow reanalysis framework provides posterior estimates for these parameters through conditioning (a Bayesian update) on fSCA measurements.
In data scarce domains like HMA, there may be insufficient data to even postulate a prior uncertainty model for precipitation. Hence, in contrast to previous applications, herein we take the approach that we know almost nothing about the prior uncertainty in MERRA-2 precipitation (and how it should be downscaled) beyond a range of values seen in the literature. In this “uninformed” approach, the prior b distribution is specified as uniformly distributed (i.e., with equal probability) between 0.1 and 5 to reflect the wide range of biases seen in the literature as well as the potential for sub-grid heterogeneity in precipitation. Using such a distribution allows for the prior ensemble to reflect both under- and overestimation by the nominal precipitation dataset (i.e., MERRA-2), where those realizations that are most consistent with independent (fSCA) data will be determined by the Bayesian update. We used 50 replicates for the ensemble size in this study, which was deemed sufficient based on preliminary sensitivity tests.
Characterization of the uncertainty in snowfall precipitation from MERRA-2 (including bias) is derived via the reanalysis step in the particle batch smoother (PBS) approach (Margulis et al., 2019), which is achieved through the conditioning of the prior ensemble of b on independent fSCA observations to derive a posterior distribution. A schematic illustration of the method used for updating the b distribution at a particular modeling pixel in a particular WY is presented in Figure 2, which is elaborated on below.
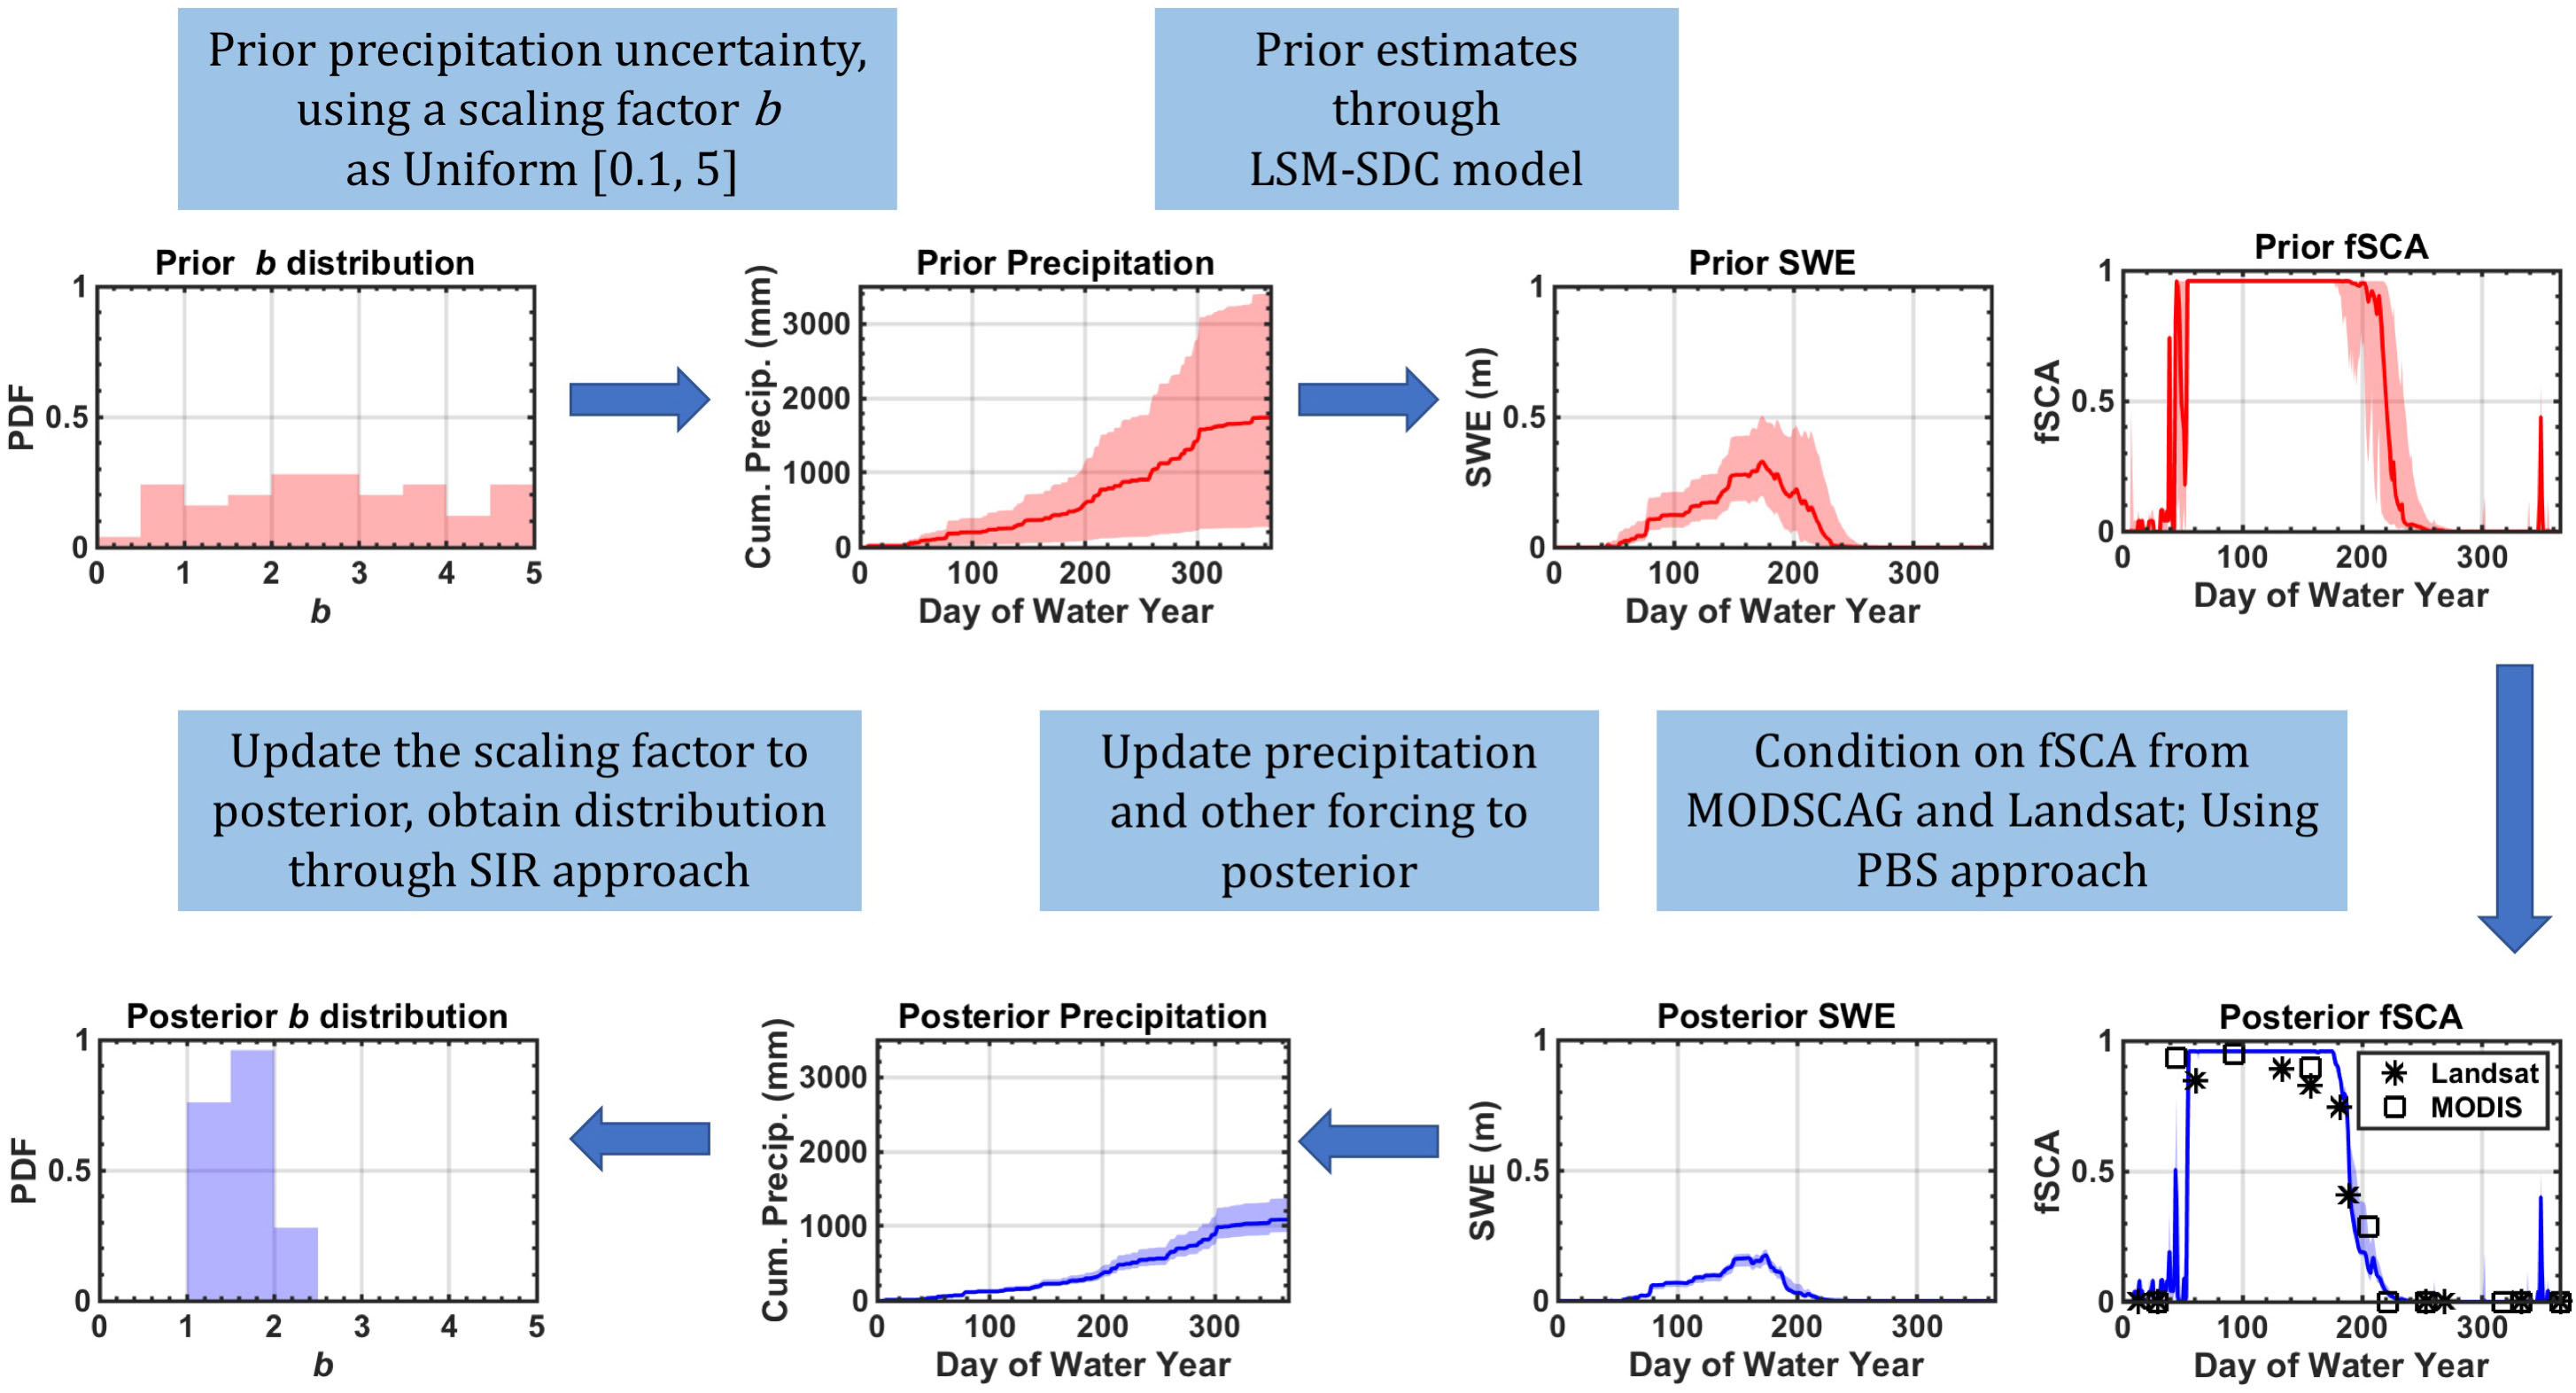
Figure 2. Flow chart highlighting how the reanalysis framework method is used to estimate uncertainty in snowfall precipitation at a particular modeling pixel in a particular water year (WY), with red indicating prior, and blue indicating posterior. In the time series plots, the shaded area shows the ensemble spread (inter-quartile range) and the solid line shows the ensemble median. Satellite retrieved fSCA from Landsat and MODSCAG are displayed in the posterior fSCA plot, and serve as the constraint that is used to infer snowfall precipitation.
In the PBS approach, all replicates in the ensemble are initialized with equal prior weights, where the weights are interpreted as the discrete probability for b and other variables in the corresponding replicate:
where is the prior scaling factor with respect to Pnom and is the prior weight in replicate j at snow reanalysis pixel xr. In this application a uniform distribution (between 0.1 and 5) is used to draw random prior samples of (Figure 2). The uncertainty in b is propagated to prior predictions of fSCA () via the ensemble LSM-SDC modeling framework (Margulis et al., 2019). Modeling variables are updated through conditioning on the collection of satellite observed fSCA over the WY (fSCAmeas):
where is the posterior scaling factor with respect to Pnom and is the posterior weight in replicate j at snow reanalysis pixel xr, andpv is the likelihood function of measurement error (with specified covariance CV), and c0 is a normalization constant through which the posterior weights sum up to one (Margulis et al., 2019).
Through conditioning on fSCA observations using the PBS approach, the modeling results are preserved in each replicate, but their corresponding weights are changed. Replicates with modeled fSCA closer to observations are assigned higher weights, and vice versa. The distribution of modeled variables (e.g., SWE, fSCA, etc.) and the b distribution at each pixel are therefore implicitly updated, due to the update in their posterior weights (Figure 2). It should be noted that, while the b scaling factor is applied to the total precipitation, since its posterior distribution is based on fSCA depletion, we would expect the posterior estimates should be most valid in snow-dominated pixels, i.e., where a sufficient fraction of annual precipitation falls as snow such that there is a clear seasonal snowpack with fSCA depletion that can be captured by the Landsat and MODSCAG measurements. It is also possible that in some instances the b scaling factor is correcting for the fact that some storms through the year were misclassified as rain or snow based on the air temperature. This would be expected to occur in transition zones where air temperature is near-freezing during snowfall events.
In order to better interpret the posterior b distribution in terms of its probability rather than its posterior weights, we used a sequential importance resampling (SIR) algorithm (Zhou et al., 2006) to resample the b values, where we obtained a set of b values with the same posterior distribution but with equal weights. At each pixel, N samples (where N is the total number of replicates) are randomly drawn from the discrete (posterior) b distribution through a Monte-Carlo method, with the posterior weight interpreted as the discrete probability to obtain the corresponding . This generates a new sample set (where the superscript R indicates “resampled”) at each pixel with N samples, and assign equal weights to each sample. This intermediate step is done for convenience in order to merge individual pixel distributions together to derive the distribution across the tile(s) as described below.
We grouped the resampled scaling factor ensemble from all N samples and from all the pixels within each (1° by 1°) test tile into an ensemble to assess its tile-specific distribution, and also merged the samples from all the test tiles into a larger ensemble to assess its “global” distribution over the HMA region, with respect to the nominal precipitation Pnom. Furthermore, both and are fitted with a lognormal probability function so as to parameterize the distributions. It should be noted that MERRA-2 is used as the nominal precipitation herein, such that the reanalysis application yields bnom = bMERRA2.
When merging the from different pixels into a large sample such as and , careful screening is performed so as to exclude the non-updated pixels from contaminating the distribution. Three types of pixels are excluded from the large sample, namely pixels with water bodies, pixels that are non-snowy at low elevations, and pixels with glaciers or persistent snow at high elevations. The water bodies are identified from the land cover types, and the non-snowy pixels are identified when there is insignificant change in the posterior weights from the prior. The glaciers or persistent snow pixels are identified when there is significant carry-over-snow that do not fully melt out in the melting season. Specifically, if, for a given pixel and year, the minimum SWE exceeds 1% of the maximum SWE, that pixel is considered to have significant carry-over-snow in that year, and that pixel-year is excluded in the large sample. It should be acknowledged that we found the posterior b distribution to be somewhat sensitive to the screening, especially for the carry-over-snow pixels at the high elevations (i.e., glacier pixels), hence the screening is meant to conservatively focus on seasonal snow pixels for the posterior b estimation.
Other Gridded Precipitation Datasets
To put the characterized MERRA-2 uncertainty results in larger context, we chose to also investigate the implicit uncertainty in two other gridded precipitation products, namely ERA5 (the fifth generation of ECMWF reanalysis product) and APHRODITE-2 (Asian Precipitation Highly Resolved Observational Data Integration Toward Evaluation; Yatagai et al., 2012).
ERA5 is the latest reanalysis dataset produced by ECMWF, which provides global estimates of atmosphere, land and ocean variables. The dataset is currently available from 1979 to present at an hourly step, gridded to a spatial resolution of 0.25°. We used its hourly total precipitation from Copernicus Climate Change Service (2017)1 to obtain surface precipitation estimates. APHRODITE-2 is produced by the Research Institute for Humanity and Nature (RIHN) and the Meteorological Research Institute of Japan Metrological Agency (MRI/JMA) and provides daily precipitation estimates regionally over Asia based on a dense gauge network, gridded to spatial resolutions of 0.25° and 0.5°. We used the latest version APHRO_MA V1801_R1 Monsoon Asia Area Daily precipitation2, which covers the period from 1998 to 2015.
Similar to MERRA-2, ERA5 is a reanalysis product that assimilates both ground and satellite observations, while APHRODITE-2 is a station-based product that derives its estimate by interpolating precipitation gauges. These datasets are recently released, but their previous versions (e.g., ERA-Interim and APHRODITE) have been commonly used in studies over HMA, and many studies have assessed their performance of precipitation estimates in this region (e.g., Palazzi et al., 2013; Immerzeel et al., 2015; Song et al., 2016; Hussain et al., 2017). Therefore, they are representative of an additional reanalysis product and gauge-based product, respectively.
We used 0.25° gridded resolution for ERA5 and 0.5° for APHRODITE-2, so as to best approximate the MERRA-2 resolution. The period chosen for analysis was WYs 2001–2015, which was the shared common period across all three precipitation products and MODIS snow products. The annual precipitation climatology maps (over WYs 2001–2015) are shown in Figure 3. While some of the large scale precipitation features are similar, it is evident there are, in some cases, large differences between products.
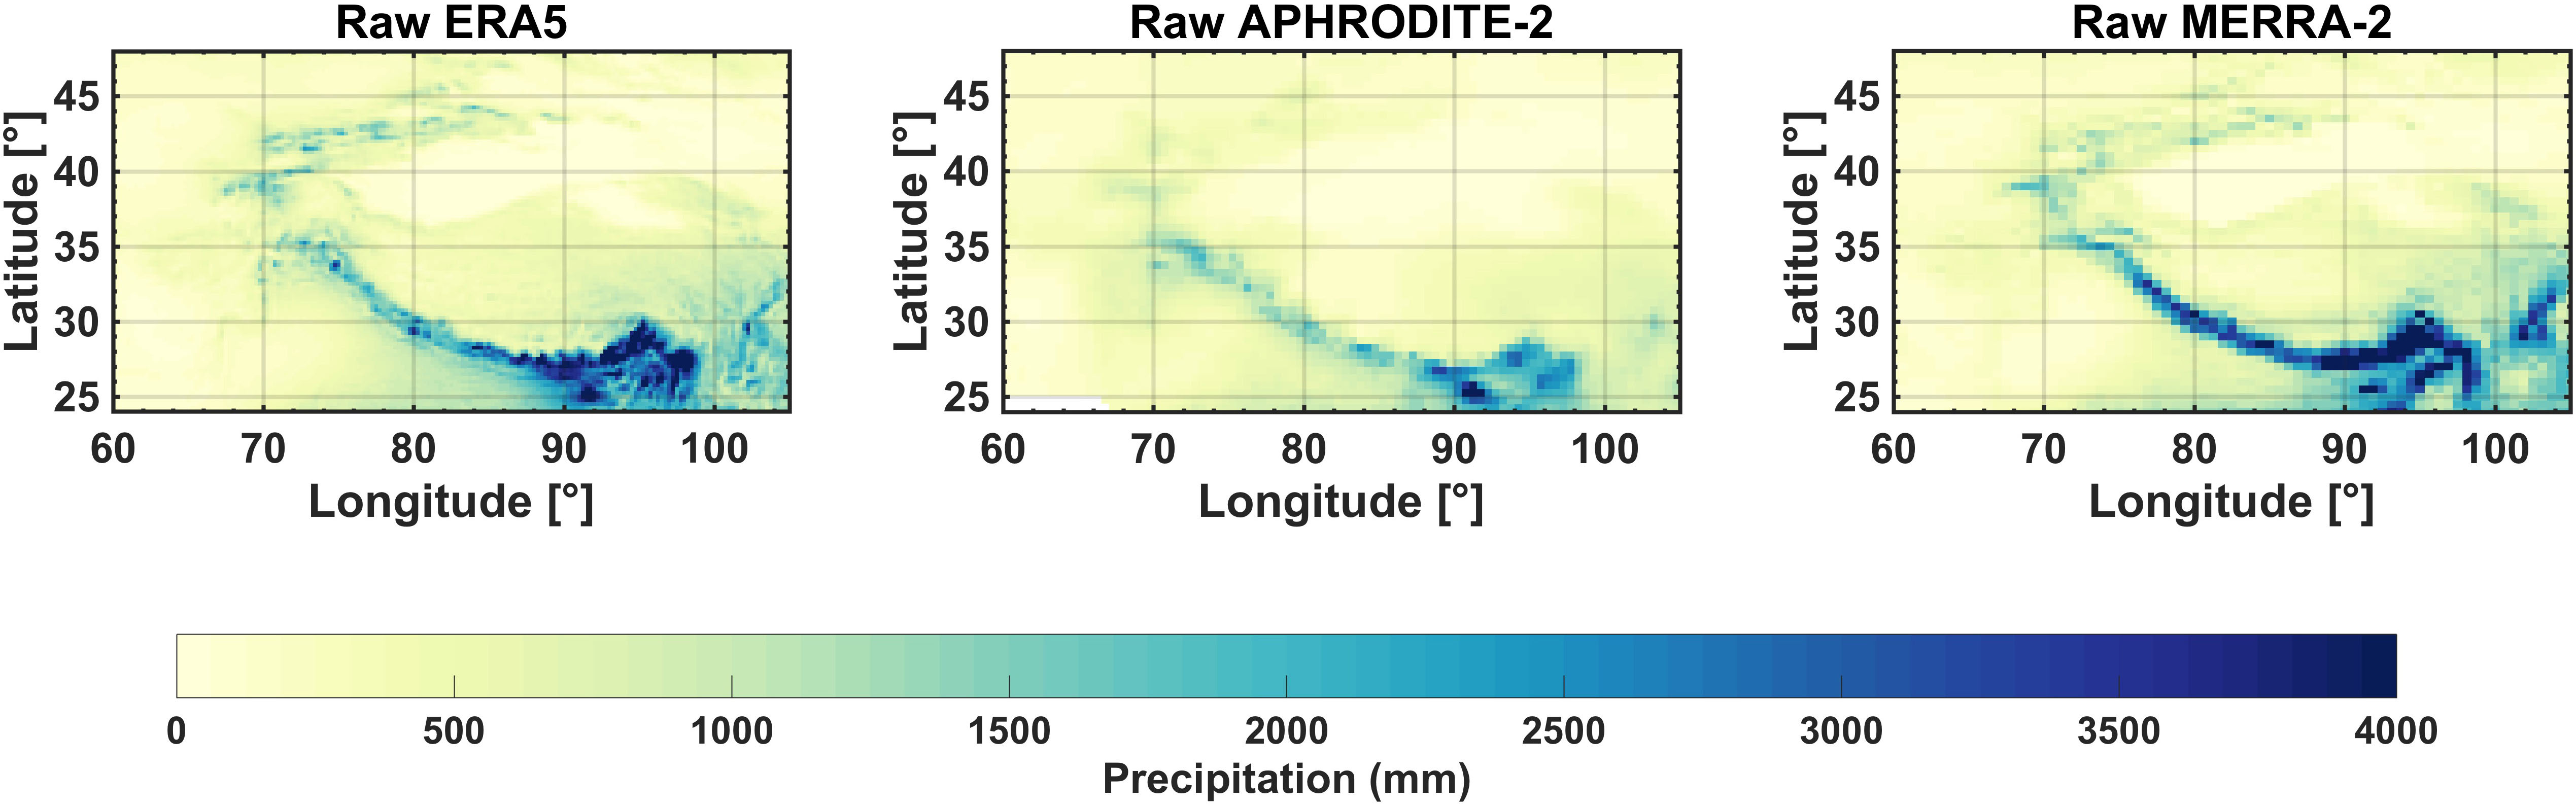
Figure 3. Annual total precipitation (in mm) climatology (WYs 2001-2015) for raw ERA5, raw APHRODITE-2, and raw MERRA-2 over the HMA region.
Deriving the Bias and Uncertainty in Snowfall Precipitation From Other Products
The primary goal of this paper is the derivation of bias and uncertainty estimates for the MERRA-2 product, which is accomplished by performing the snow reanalysis using the methodology described above. For context, bias and uncertainty estimates for the other gridded products were obtained by comparing them to the reanalysis estimates, i.e., whereby the posterior reanalysis estimates derived from MERRA-2 provide the reference. Specifically, note that the scaling factor bnom that is derived for each WY using the nominal MERRA-2 precipitation inputs (i.e., bMERRA2), can be thought of as follows by rearranging Eq. (1):
where represents the cumulative annual snow reanalysis precipitation for replicate j and represents the cumulative annual MERRA-2 precipitation. Since the scaling factor is conditioned on fSCA observations, and therefore primarily provides information on snowfall precipitation (SP), it is essentially the ratio between cumulative annual snowfall precipitation from the snow reanalysis for replicate j and that from MERRA2 .
Using the same notion we can derive scaling parameters for the other products, i.e:
To avoid large scaling factors due to very small cumulative snowfall values in the denominator of Eqs. (5) and (6), any cases with less than 5 cm of cumulative annual snowfall were excluded from the analysis. Given the derived scaling factors for each product at the pixel scale, they were then aggregated to tile-based and global distributions in the same manner as described above for comparison with MERRA-2 and the snow reanalysis.
In addition to precipitation itself, snowfall is dependent on air temperature. In the HMA snow reanalysis with MERRA-2 as the nominal forcing input, air temperature uncertainty is characterized with a normal distribution of N(−0.9°C, 1.2°C) based on the comparison to in situ observations (Margulis et al., 2019). This means that the raw MERRA-2 air temperature was found to be 0.9°C higher than in situ on average, and this warm bias is corrected before performing the snow reanalysis. Similar bias-correction should also be performed in the ERA5 and APHRODITE-2 air temperature before computing snowfall, so as to eliminate the effect of air temperature biases in the scaling factors. For consistency, we choose to commonly apply the snow reanalysis air temperature over all three products to obtain their snowfall estimates, which is essentially derived from the bias-corrected MERRA-2 air temperature. A threshold of 2°C daily mean air temperature is applied to classify snowfall vs. rain over the daily precipitation, where daily precipitation is still obtained from their original product. The obtained snowfall in ERA5 and APHRODITE-2 is further used in Eqs. (5) and (6) to derive the snowfall bias estimates.
It should be noted that snowfall biases in ERA5 and APHRODITE-2 are obtained herein by comparing to snowfall estimates from the snow reanalysis (i.e., “bias-corrected” MERRA-2 data). This necessarily ties the baseline most closely to MERRA-2 rather than the other products, although the posterior corrects the raw MERRA-2 to values that are most consistent with the independent fSCA observations. This choice was made primarily because (1) the focus of this paper is on deriving an uncertainty parameterization for MERRA-2 and (2) due to the higher computational expense of running the reanalysis with each precipitation product. We leave a more thorough multi-product reanalysis for future work, and herein use the methods described above to provide a first-order comparison of the MERRA-2 biases relative to those from ERA5 and APHRODITE-2. Potential additional uncertainties introduced using our simplified comparison method come primarily from the diagnosis of MERRA-2 snowfall (i.e., using the 2°C air temperature threshold) at the hourly time step, while for ERA5 and APHRODITE-2 we diagnose snowfall using the same threshold but at the daily time scale.
Results and Discussion
The snow reanalysis framework provides posterior pixel-wise estimates of the scaling factor bMERRA2 and the resulting seasonal precipitation time series. In the sections below, for each of the test tiles we present the resulting spatial distributions of climatological posterior precipitation and MERRA-2 tile-specific distributions for the scaling factor , and the distribution across all of the tiles examined herein as . We then compare the derived snowfall uncertainty relative to the other precipitation products examined and compare how the posterior snowfall distribution varies with time and elevation in comparison to MERRA-2 and the other products.
Snowfall Biases and Uncertainties in MERRA-2
The climatology (i.e., average over WYs 2001–2015) maps of the interpolated MERRA-2 precipitation, the downscaled MERRA-2 snowfall, the posterior snowfall from the snow reanalysis (hereafter referred to as “snow reanalysis snowfall”) and the posterior b from the snow reanalysis at each of the test tiles are shown in Figure 4 (along with the respective elevation maps for reference). The snow reanalysis derived maps (posterior snowfall and posterior b) represent the climatology of the ensemble median fields. It should be noted that the conditioning of posterior b is most effective in seasonally snow-covered regions, so non-snowy or glacierized regions are masked out in Figure 4 and all results that follow. In terms of the spatial distribution, the MERRA-2 precipitation is bilinearly interpolated to the model grid (this is what the prior model uses as nominal input), but still retains the characteristics of the raw fields, and shows a smooth (coarse) representation of the precipitation field within a given 1 degree tile. The same smoothness is propagated to the downscaled MERRA-2 snowfall, which shows a mixed pattern of precipitation gradients and terrain variation, where the latter is due to the dependence on air temperature (which is downscaled to the model resolution). In contrast, the snow reanalysis effectively downscales the coarse-scale MERRA-2 by leveraging information in the set of higher-resolution (∼480 m) fSCA images over each WY and in other model-based fields (i.e., terrain). For example, the 34°N 66°E tile in the Hindu Kush (Figure 4, third row) is characterized by a general elevation gradient from southwest to northeast, with the highest mountains in the northeast and lower lying valleys elsewhere. Due to its coarse resolution in the raw MERRA-2 fields, the spatial pattern of the interpolated MERRA-2 precipitation is nearly uniform in this tile (∼500 mm/year) and clearly does not reflect the expected heterogeneity for such complex terrain. The downscaled MERRA-2 snowfall also has a smooth field (where the heteroegeneity is introduced through air temperature dependence on elevation), with snowfall ranging between 200 and 500 mm in this tile. The snow reanalysis snowfall is significantly more heterogeneous, without preserving the continuous and smooth features from precipitation or elevation as in the downscaled MERRA-2 data. It also exhibits high snowfall estimates at high elevations in the mountains and low snowfall in the valleys, but with more dramatic gradients across elevation. The snow reanalysis snowfall is greatly enhanced in the highest elevation mountain chain on its windward side, where the orographic precipitation would be expected, and it is greatly reduced in the northeastern most valley on its leeward side, where a rain shadow would be expected. Similar heterogeneity in the snow reanalysis snowfall is seen across the other test tiles (Figure 4, fourth column), which are attributed to the heterogeneity in the fSCA data and the effects of topography on snowfall. Beyond the heterogeneity (downscaling), the snow reanalysis snowfall also contains bias correction, where most tiles (fourth column) show tile-average differences with the MERRA-2 data (third column).
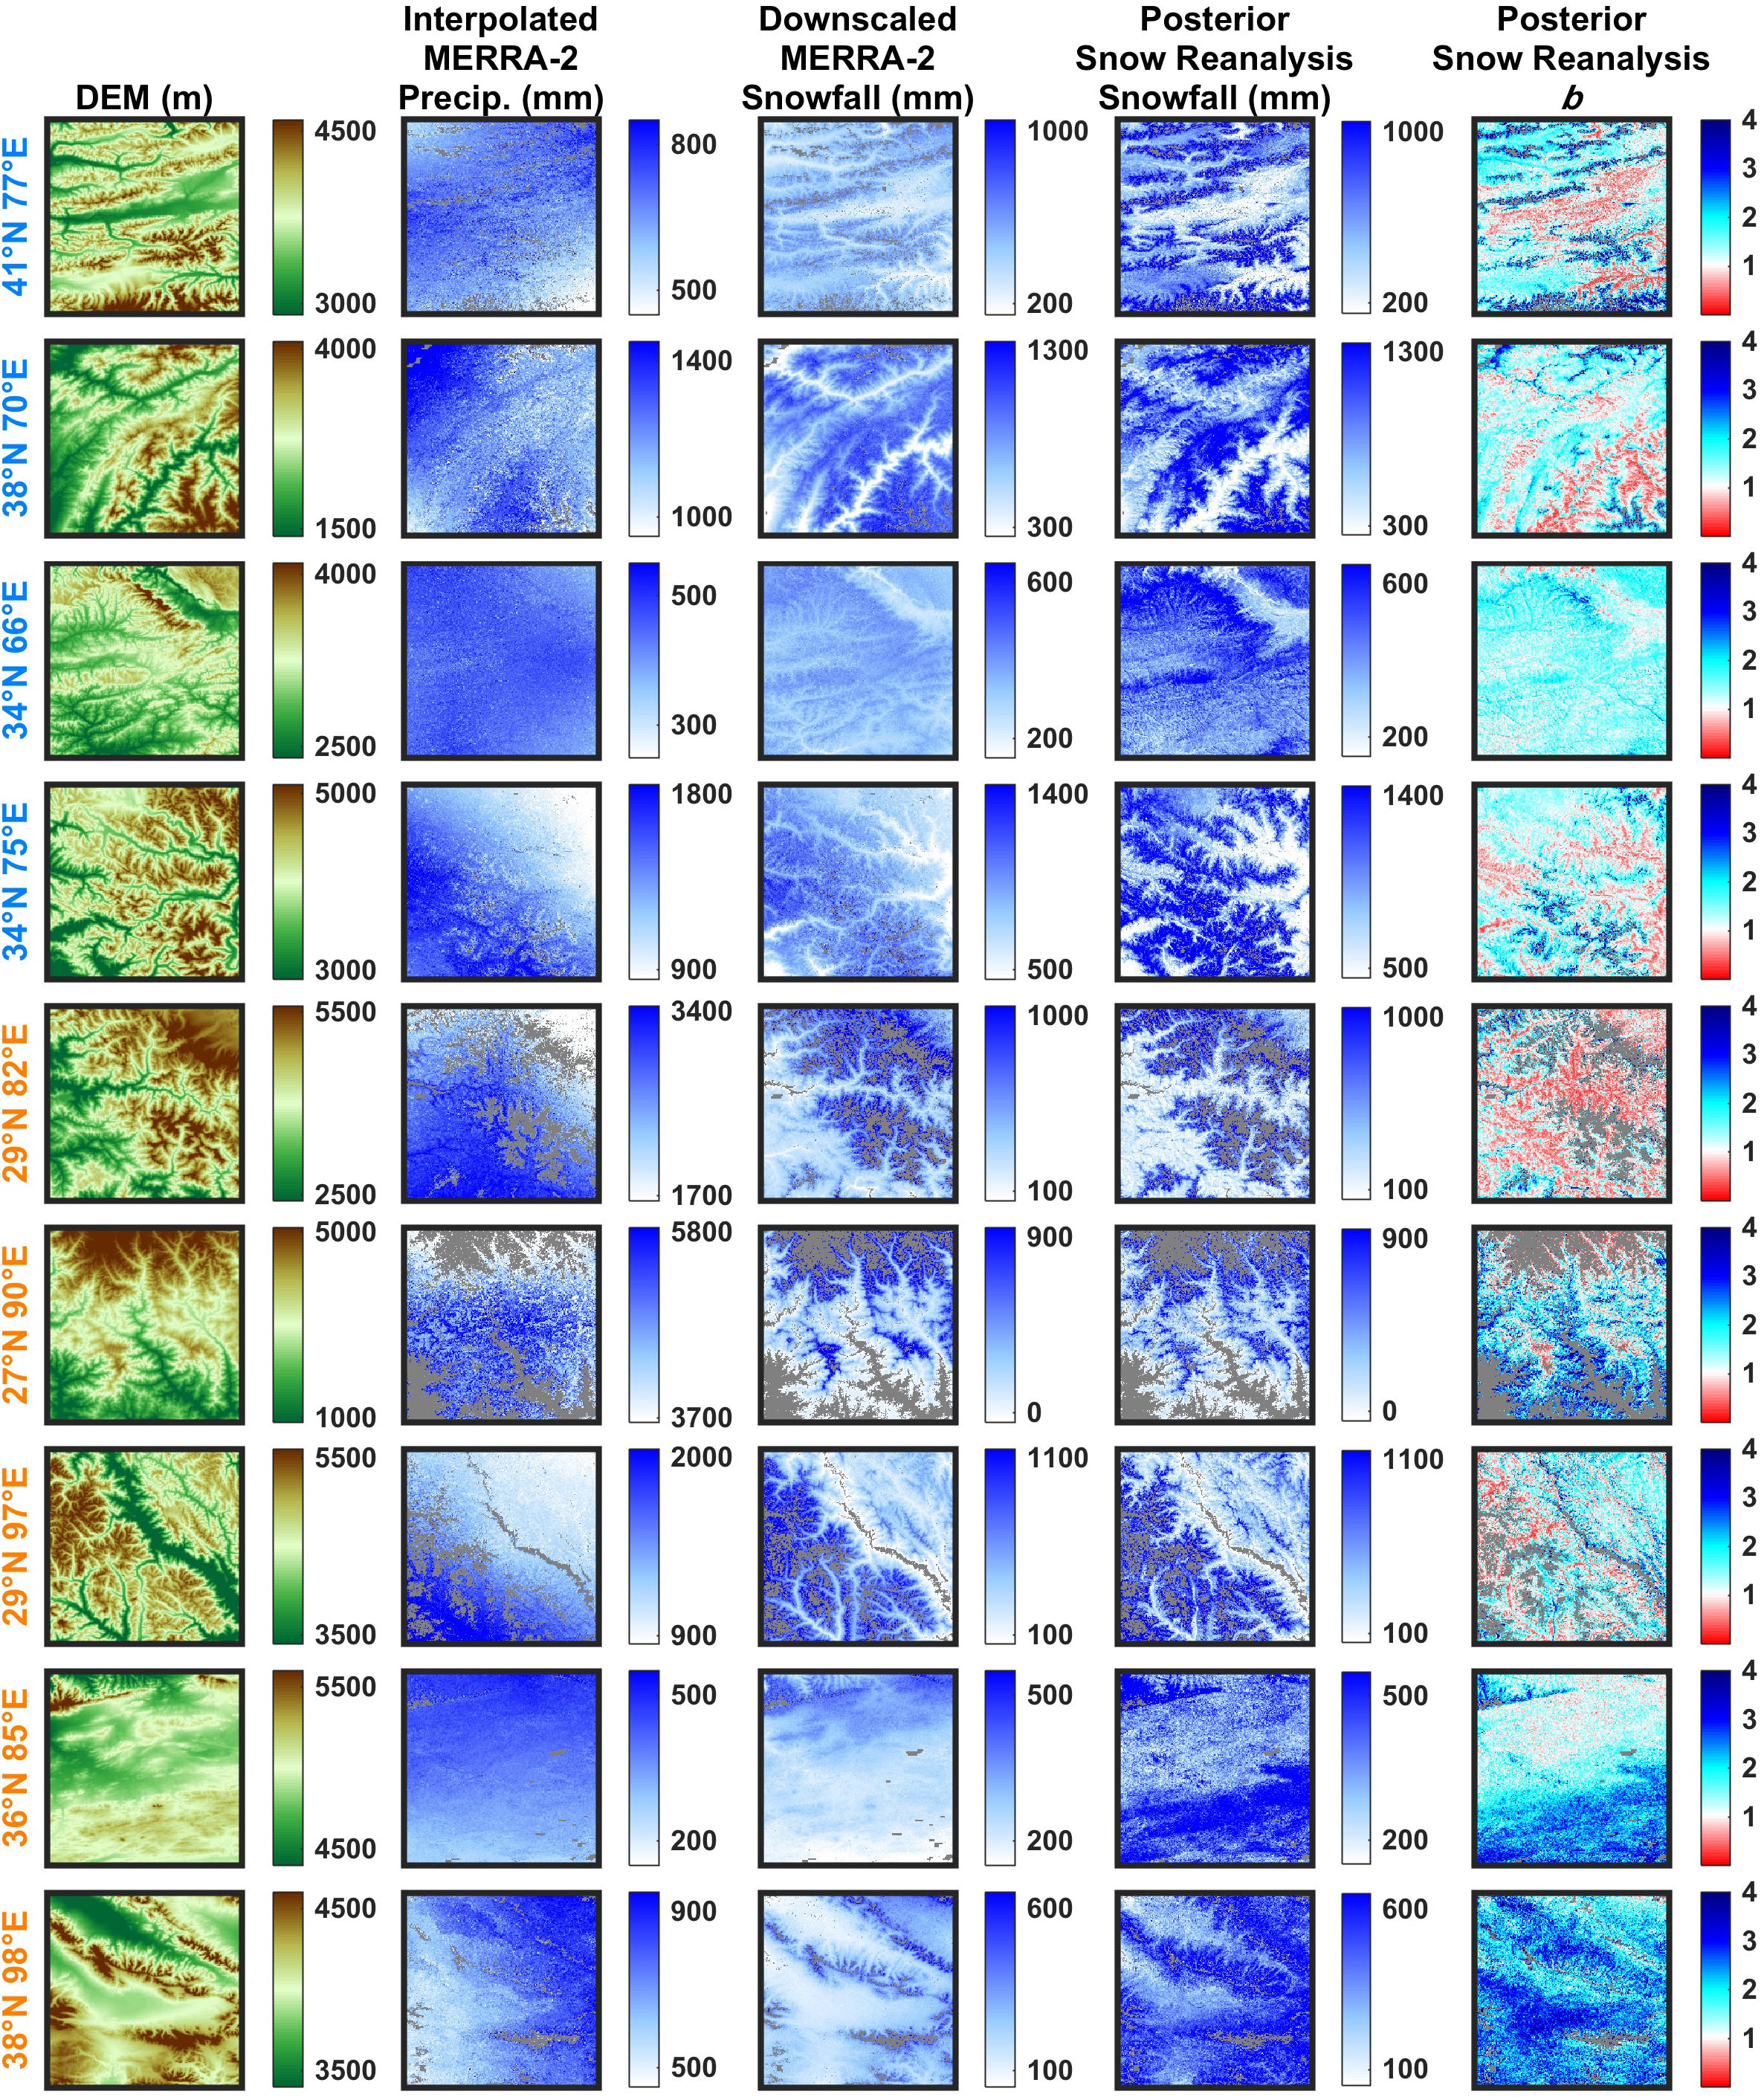
Figure 4. DEM (first column), climatology (WY 2001-2015) for the: interpolated MERRA-2 precipitation (second column), downscaled MERRA-2 snowfall (third column), posterior snow reanalysis snowfall (ensemble median) (fourth column), and posterior snow reanalysis b (ensemble median) (fifth column) in each of the test tiles. Tile labels in blue and orange text represent their locations in the western domain or central-eastern domain, respectively.
The spatial distribution of snow reanalysis snowfall (Figure 4, column 4) is a function of the spatial patterns in the posterior b maps (Figure 4, column 5), i.e., Eq (1), which are conditioned on fSCA data. The posterior b estimates are expected to be most robust in regions where there is a strong seasonal cycle in snow accumulation and ablation that is captured by the fSCA data. It shows complex patterns that reflect the combined effect of two possible corrections to the coarse scale MERRA-2 data: (i) downscaling of MERRA-2 data that is accurate in a tile-averaged sense but does not reflect the high-resolution patterns due to orography and other factors and (ii) bias-correction of large-scale errors in MERRA-2 data. For example, in tile 38°N 70°E, the posterior b (ensemble median) is generally between 1.0 and 2.0, indicating that the MERRA-2 snowfall is underestimated, and the snow reanalysis performs a bias-correction that effectively increases snowfall in this tile. However, the posterior b is also lower (and below 1.0) in certain pixels corresponding to the valleys in this tile, indicative of snowfall being overestimated in the downscaled MERRA-2 at those locations. Similar patterns are observed in other tiles, where the ensemble median of the posterior b is generally found to be between 1.0 and 2.0, but also exhibits values below 1.0 mostly in the valleys. Furthermore, the posterior median b is also found to be above 2.0 at a few locations in these tiles, and is most apparent in tiles 27°N 90°E, 36°N 85°E, and 38°N 98°E. We hypothesize that the higher posterior b observed in 36°N 85°E (over the southern side mountains) is primarily due to capturing orographically enhanced precipitation, while that observed in tile 27°N 90°E (at the foot of the mountain on the southern side) is primarily due to the misclassification of snow as rain. For tile 38°N 98°E where the posterior b is found highest in the valleys, we hypothesize that it is primarily due to the non-effective updates in the intermittent snow. This tile is characterized by more intermittent snow that in some cases lasts only for several days at a time, where the accumulation or ablation of snow is more difficult to capture in the fSCA measurement time series. As discussed earlier, the update in posterior b is most effective for seasonal snow pixels, which feature a distinct snow accumulation and ablation cycle that is reflected in fSCA observations.
To provide a bulk assessment of the uncertainties, the posterior b distribution climatology across each tile () is shown in Figure 5 (blue bars). Note for reference that the prior distribution was uniform (dashed line) across the range so that the posterior distribution reflects the update in knowledge based on the assimilated fSCA measurements. The common feature seen in the empirical distributions is that they all are skewed to the right, and most tiles are distinctly unimodal. To parameterize the empirical distributions, we chose to use a lognormal distribution. The lognormal distribution is commonly used in the literature to characterize the uncertainty distribution in precipitation, because it ensures non-negative precipitation, and the logarithm is suitable to characterize the extremely high precipitation amounts occurring at a low frequency. The fitted lognormal functions (using maximum likelihood estimation) are shown in Figure 5 (red curves), which match the empirical distributions well in most of the tiles (with the exception of 38°N 98°E) For example, in tile 38°N 70°E, the posterior is highly right skewed with a mean of ∼1.3 with most samples falling within a range of 0 to 2.5. In terms of the reanalysis procedure, this is indicative that replicates with values above 2.5 essentially have zero posterior weight and those near the mode have higher weights than the equal weights implicit in the prior uniform distribution. The other tiles in the western part of the domain (41°N 77°E, 34°N 66°E, 34°N 75°E), those in the south and east (29°N 82°E, 27°N 90°E, 29°N 97°E), and one in the northern Tibetan Plateau (36°N 85°E) similarly show unimodal skewed distributions with mean values ranging from 1.0 to 1.9 and CVs ranging from 0.5 to 1.2. The tile in the northeastern Tibetan Plateau (38°N 98°E, Figure 1) is an exception in that, while right skewed, the peak is not as distinctive and has much heavier tails on the right. As a result, it has a higher mean value of ∼2.5. From the empirical distribution it is clear that many of the higher prior values remain in the posterior distribution with non-negligible weights, where we hypothesize that the posterior b update may not be as effective in this tile due to intermittent snow, so that the distribution still retains some of the features of the prior uniform distribution.
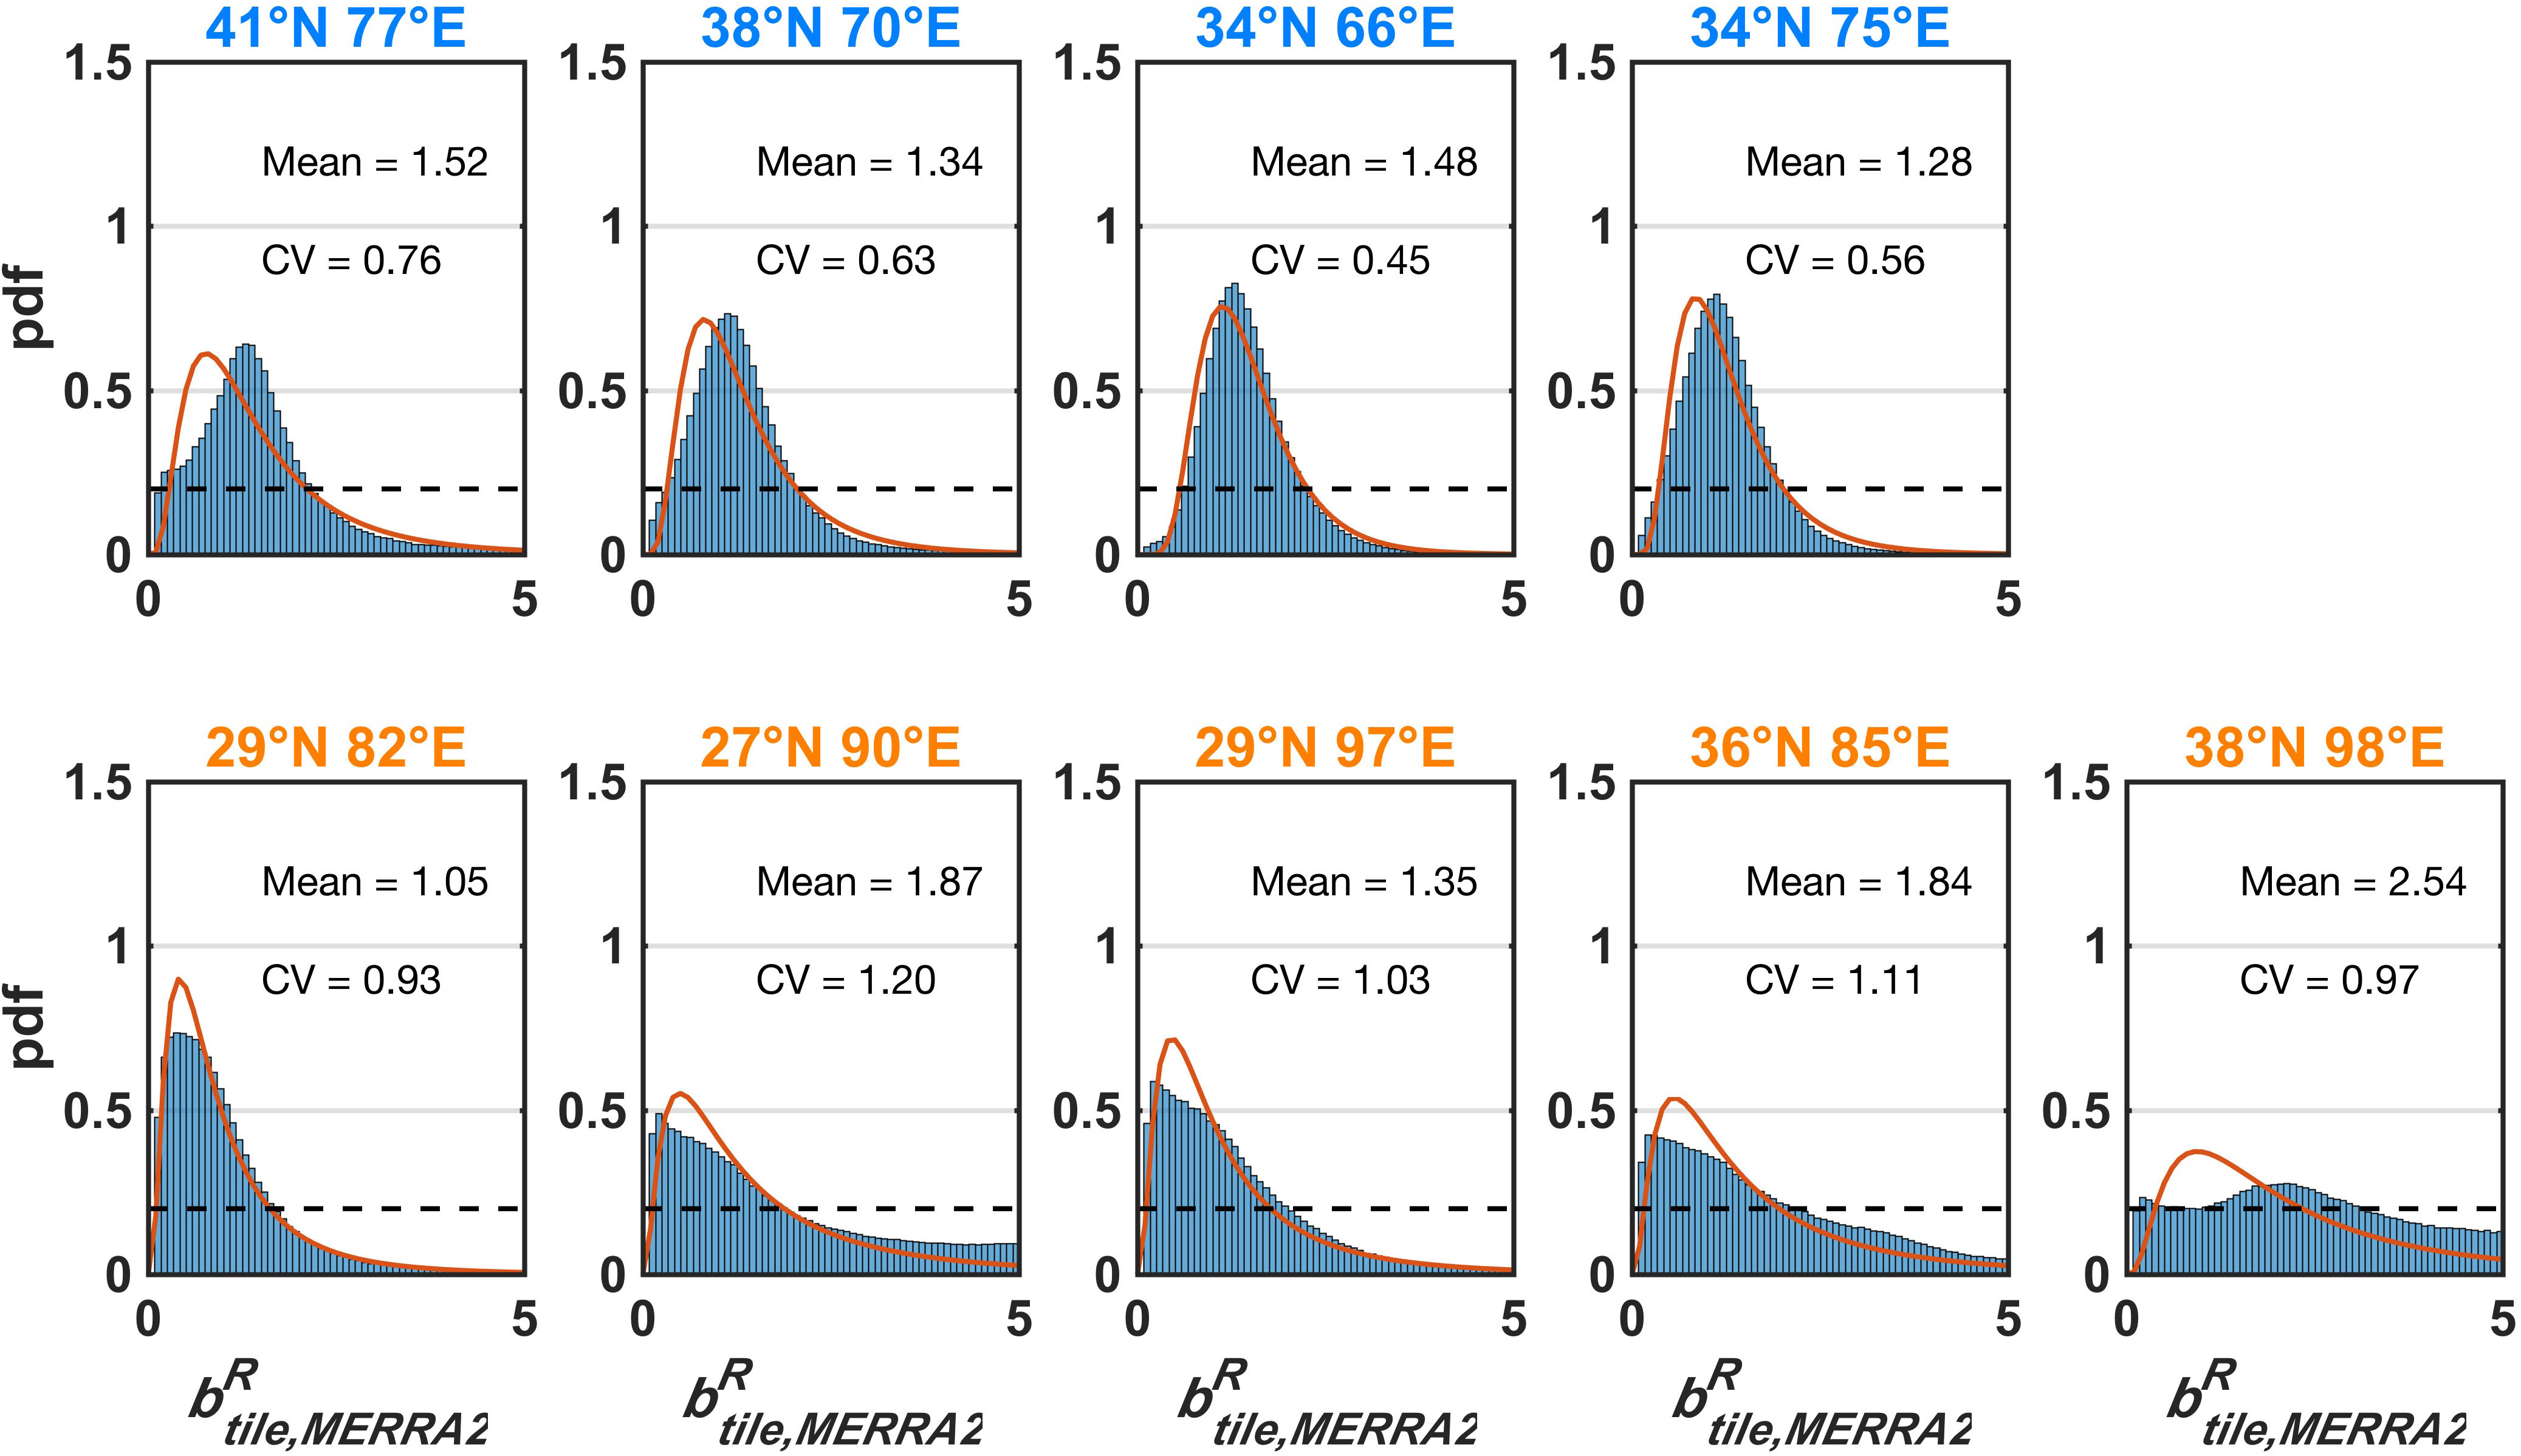
Figure 5. Distribution of obtained from the snow reanalysis. The blue bars represent the empirical (posterior) distribution, the solid line is the fitted lognormal distribution, and the dashed line shows the prior uniform distribution for reference. The fitted lognormal parameters are displayed in each panel. Tile labels in blue and orange text represent their locations in the western domain or central-eastern domain, respectively.
For the purposes of applying the snow reanalysis (or for other modeling applications) over the full HMA domain, it is useful to derive a single “global” distribution for b that could serve as a prior estimate of uncertainty in MERRA-2 precipitation (snowfall). The global distribution of MERRA-2, i.e., , is presented in Figure 6 (left). It is the composite of the tile-specific distributions and therefore is also highly right skewed with a single mode around 1, with most of the values between 0.1 and 3. We again fit a lognormal function to the empirical global distribution, where it fits reasonably well but with a slightly higher and narrower peak than the empirical distribution (mostly due to the one tile described above). The lognormal distribution exhibits a mean value of 1.54 (median value of 1.19) and CV of 0.83 for the distribution. This implies that, on average, the magnitude of raw MERRA-2 snowfall is 54% too low compared to the snowfall diagnosed from the snow reanalysis over the HMA region. Moreover, the CV implies that there is significant uncertainty that should be considered when using MERRA-2 data for snow modeling in HMA. In other words, using MERRA-2 deterministically in snow modeling over HMA is likely to underestimate the snowfall distribution in terms of both the mean and its uncertainty. This global distribution is currently being used as the prior uncertainty model for precipitation inputs in applying the snow reanalysis over the full HMA domain shown in Figure 1. The posterior estimates from that application will ultimately yield additional insight into the snowfall distribution over HMA that could be used to derive a more robust estimate of snowfall uncertainty and how it depends on physiographic, climatological, or other factors.
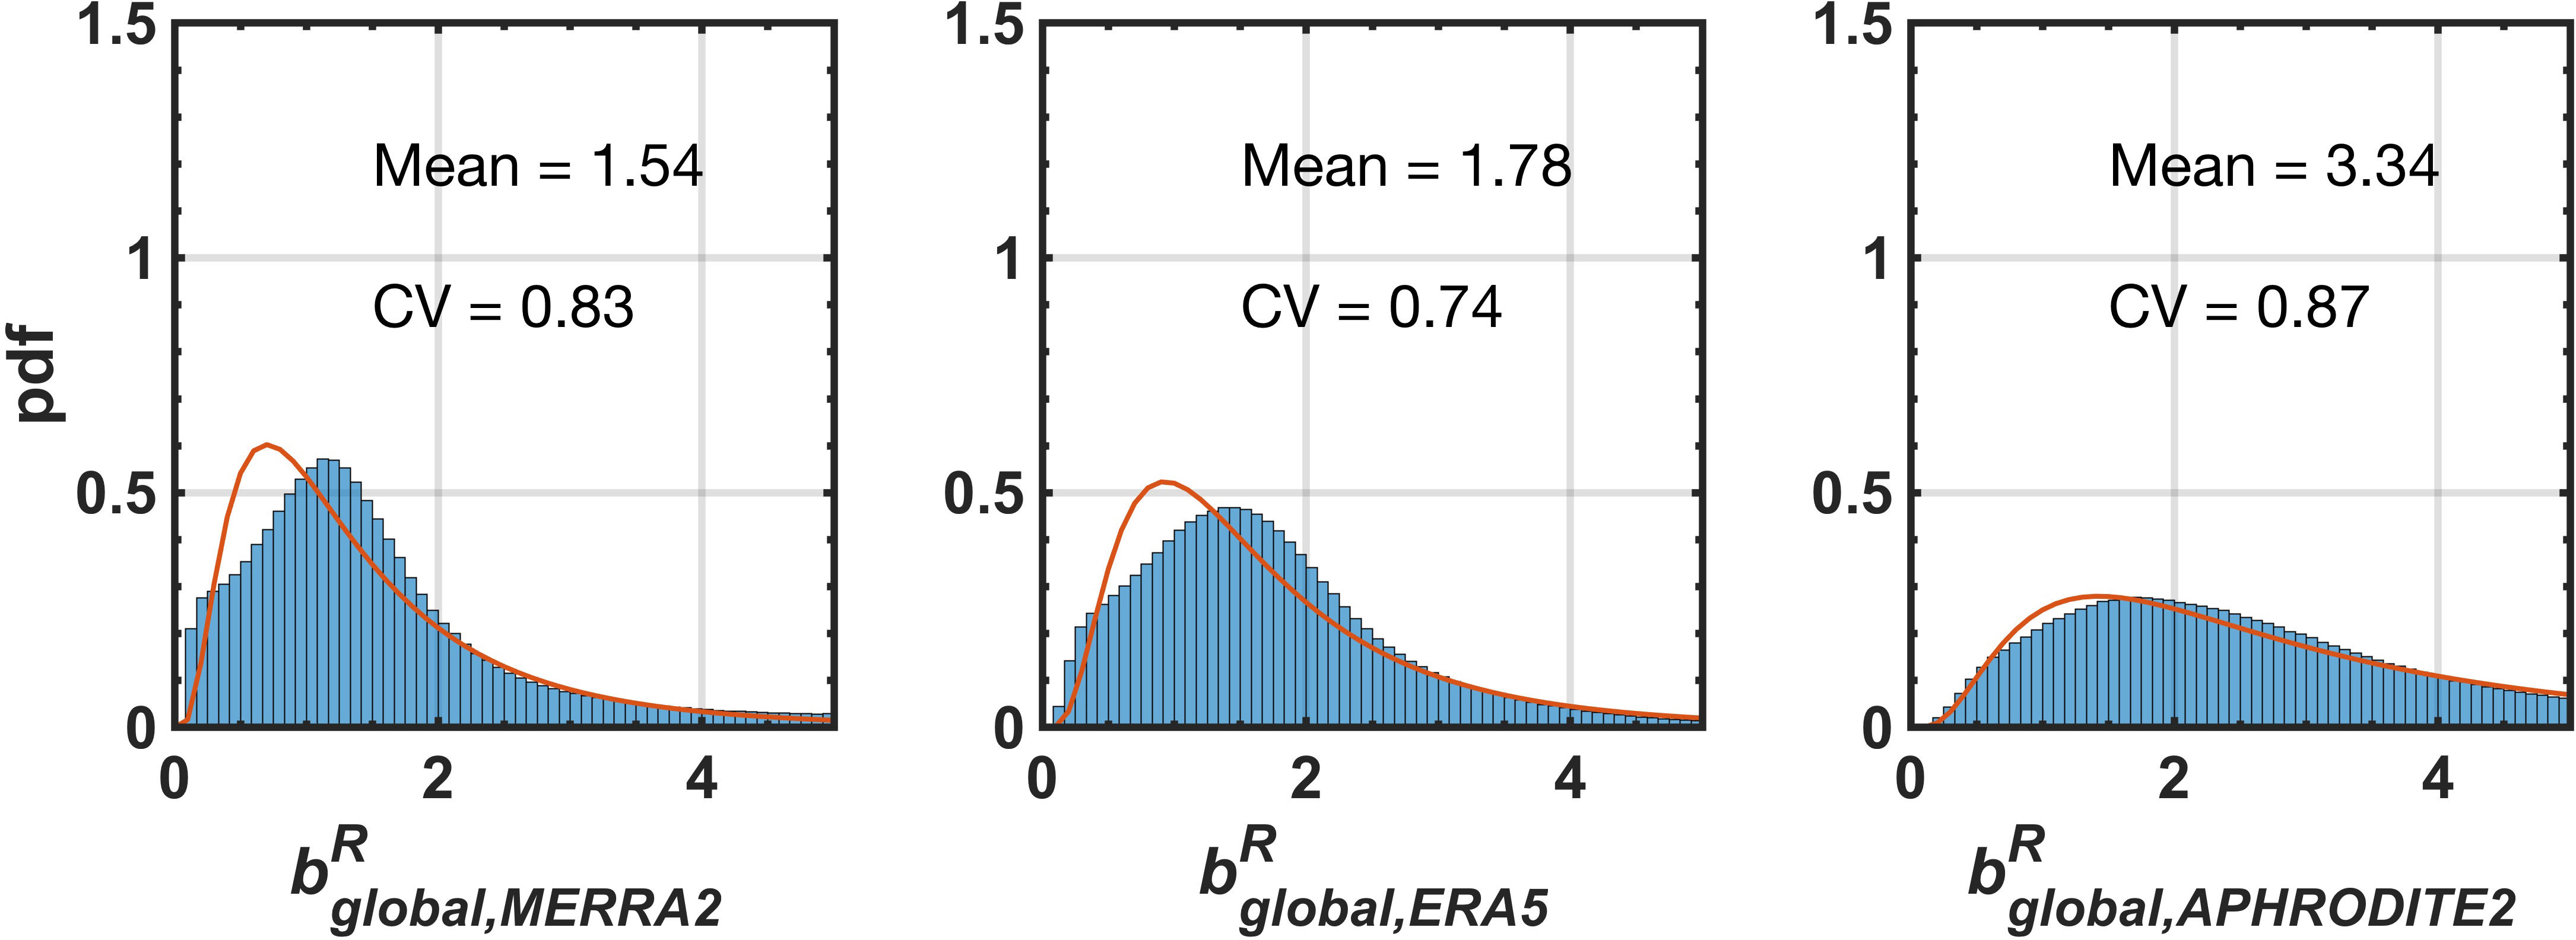
Figure 6. Derived distributions of the global precipitation scaling factor for (, left), ERA5 (, middle), and APHRODITE-2 (, right). The blue bars represent the empirical (posterior) distribution, the solid line is the fitted lognormal distribution, and the dashed line shows the prior uniform distribution for reference. The fitted lognormal parameters are displayed in each panel [note the Bayesian reanalysis approach is used to directly derive the scaling factors for MERRA-2 precipitation, while those for ERA5, and APHRODITE-2 are derived through comparing to posterior snow reanalysis results using Eqs. (5) and (6)].
Snowfall Biases and Uncertainties in Other Gridded Precipitation Products
The posterior snowfall biases and uncertainties provide a mechanism (i.e., reference baseline) to also provide a first-order characterization of uncertainty in other gridded precipitation products (ERA5 and APHRODITE-2) using Eqs. (5) and (6). For clarity it should be noted that posterior b values represent a bias-correction relative to the nominal product such that b values larger than 1.0 represent a negative bias (underestimate) by the product and vice versa. The equivalent global uncertainty (i.e., resampled across all nine tiles) in snowfall precipitation in the other gridded products is shown in Figure 6 (middle and right). Based on the fitted lognormal distributions, we found that ERA5 has a comparable mean value of ∼1.78 (median of 1.42), while APHRODITE-2 has a much higher mean value of ∼3.34 (median of 2.51). This indicates that ERA5 is ∼80% too low compared to the snowfall from the snow reanalysis, while APHRODITE-2 underestimates snowfall precipitation by more than a factor of 3. The CV values across all three products are comparable (∼0.74–0.87), but the higher mean values in APHRODITE-2 imply a larger range of uncertainty. The large mean value for APHRODITE-2 is influenced in part by geographic differences across the domain. In particular, in the tiles east of 82°E (i.e., those most influenced by the Indian monsoon), the biases are generally above 4. Previous studies have pointed out that MERRA-2 snowfall is much greater than CRU TS (Climatic Research Unit Time series; Harris et al., 2014), TRMM and APHRODITE snowfall in the HMA region (Viste and Sorteberg, 2015), which is therefore consistent with larger underestimates in APHRODITE-2 compared to MERRA-2. The underestimation of snowfall in the gauge-based APHRODITE-2 product, may be caused by not only the interpolation of gauges at lower elevations, but also the undercatch of snow and ice by traditional instruments in those gauges (Palazzi et al., 2013; Viste and Sorteberg, 2015). It should be noted that the analysis herein, by construct focuses on snowfall (not rainfall) by selecting high-elevation/snow-covered pixels, so that biases in APHRODITE-2 precipitation in lower elevation/rain-dominated (i.e., monsoon influenced) regions might be substantially lower.
The geographic variation in the (tile-specific) biases across products is illustrated in Figure 7, where the biases are generally greater than 1 across all tiles in all datasets. It is apparent that the implied snowfall bias corrections in all datasets are smallest (less than ∼2) in the three western tiles (38°N 70°E, 34°N 66°E, 34°N 75°E) and the southwestern tile (29°N 82°E) of the domain. The snowfall biases in all datasets are relatively larger (greater than ∼2) in the northwestern tile (41°N 77°E) and the northeastern tile (38°N 98°E). For the remaining three tiles in the southern (27°N 90°E, 29°N 97°E) and central-northern (36°N 85°E) part of the domain, it is only APHRODITE-2 that show significantly large biases greater than 3. In contrast, the snowfall biases in MERRA-2 and ERA5 are relatively small (less than 2) in these tiles and are comparable to the other tiles. For the one tile (38°N 98°E) with more intermittent snow, where we hypothesize this leads to less robust posterior estimates, the biases are generally largest across products as shown in Figure 7. Whether these high biases are meaningful still needs further investigation. However, larger bias correction factors in areas like these tiles, where snowfall is very low, may not be as impactful as in other areas where snowfall is large.
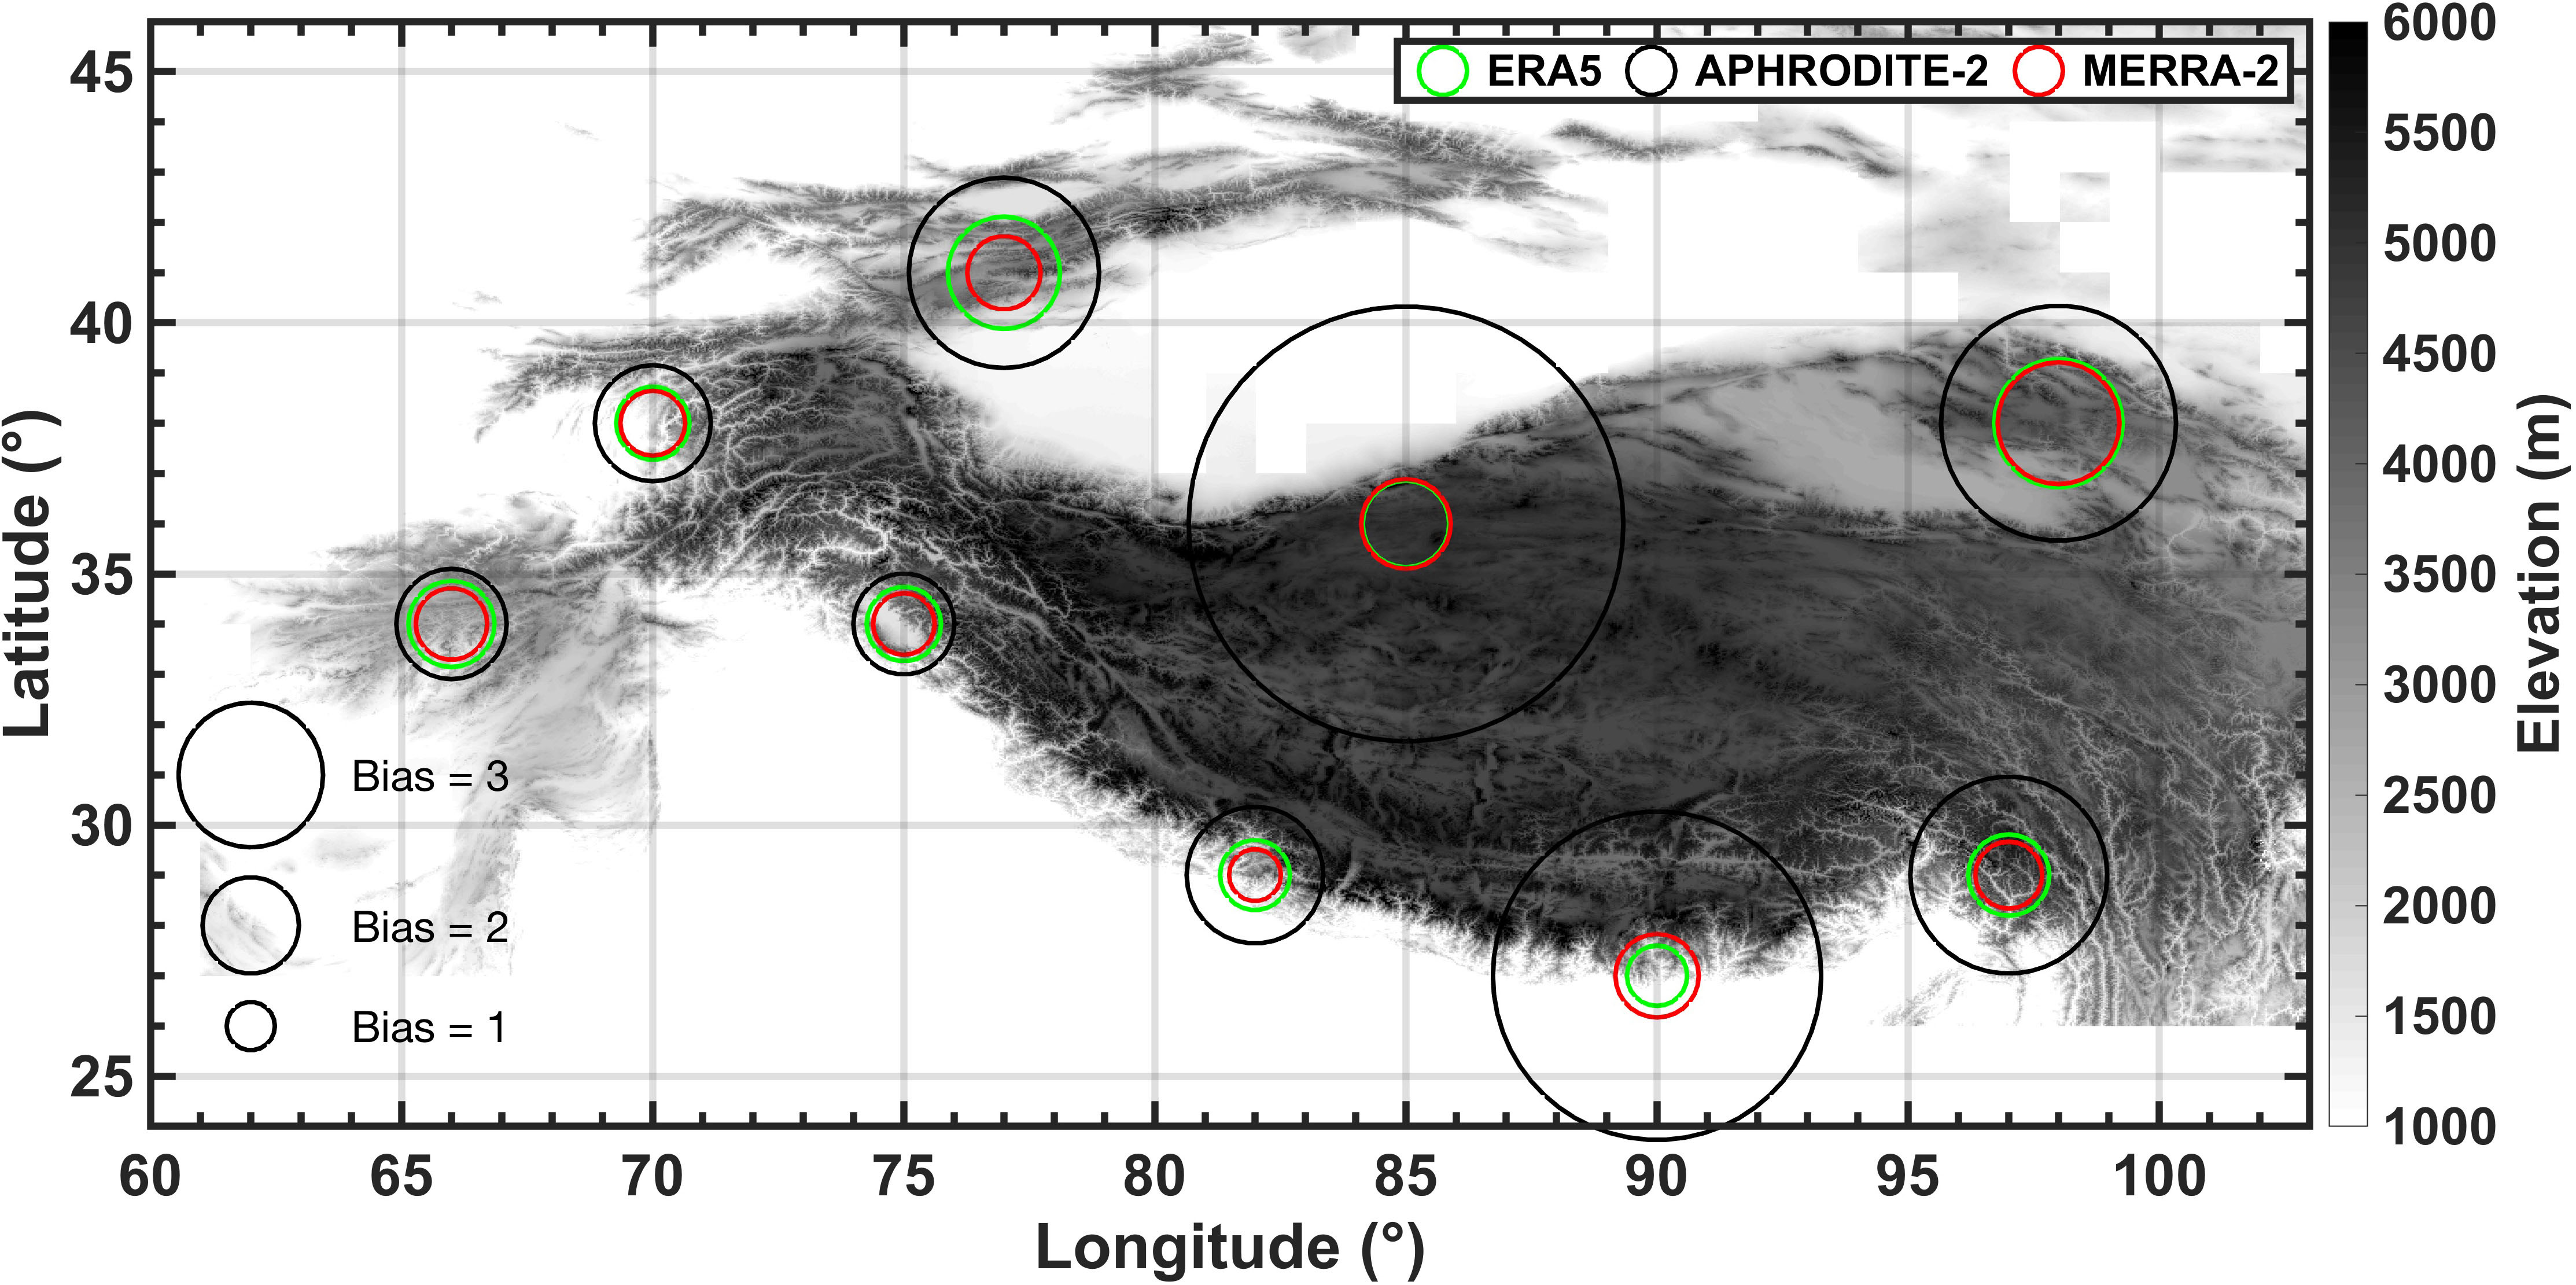
Figure 7. Geographic distribution of the snowfall bias correction (mean of ) at each tile location across all precipitation datasets, including ERA5 (, green), APHRODITE-2 (, black), and MERRA-2 (, red). The size of the circle is proportional to the value of the bias correction in each dataset, where a larger circle means greater bias (snowfall is more heavily underestimated in that dataset) and vice versa.
In summary, when compared to the posterior snow reanalysis, the MERRA-2 is less biased than the other products in most tiles (7 out of 9 tiles) followed by ERA5 (2 out of 9 tiles) (Figure 7). In contrast, APHRODITE-2 shows the highest bias in all of the tiles, which is consistent with the global distributions shown in Figure 6. The magnitudes of snowfall biases in all three products are more consistent in the western part of the domain, but less consistent in the central and eastern part of the domain. The most obvious differences are seen in the central part of the domain (36°N 85°E, 27°N 90°E), where the snowfall biases from MERRA-2 and ERA5 are comparable and lower, while the snowfall biases from APHRODITE-2 are higher.
Annual Snowfall Time Series Among Different Products
The posterior snowfall in the snow reanalysis was compared to the other precipitation products over the period of WYs 2001–2015 at each test tile (Figure 8). We found that the overall snowfall magnitude in the downscaled MERRA-2 is lower than that in snow reanalysis estimates at most tiles. Taking the tile 34°N 66°E as an example, the snow reanalysis (blue line) snowfall is generally between 300 and 600 mm, while the MERRA-2 snowfall (red line) is between 200 and 500 mm, and around 100 mm lower than the snow reanalysis. Similar patterns between MERRA-2 and the snow reanalysis snowfall can be observed in the other tiles, where MERRA-2 is generally lower than reanalysis snowfall in overall magnitude, which is consistent with the tile-specific and global distributions discussed above. The differences in snowfall between MERRA-2 and snow reanalysis is smallest in the two southern tiles (29°N 82°E, 27°N 90°E), where MERRA-2 shows a comparable magnitude of snowfall relative to the snow reanalysis. The largest differences are observed in the northeastern tile (38°N 98°E), where snowfall in MERRA-2 is around 200 mm smaller than that in snow reanalysis. Since we hypothesize the posterior estimates are less robust in this 38°N 98°E tile with more intermittent snow, the posterior snowfall from snow reanalysis may be less reliable in this tile, explaining the large discrepancy between snow reanalysis and MERRA-2 in this tile.
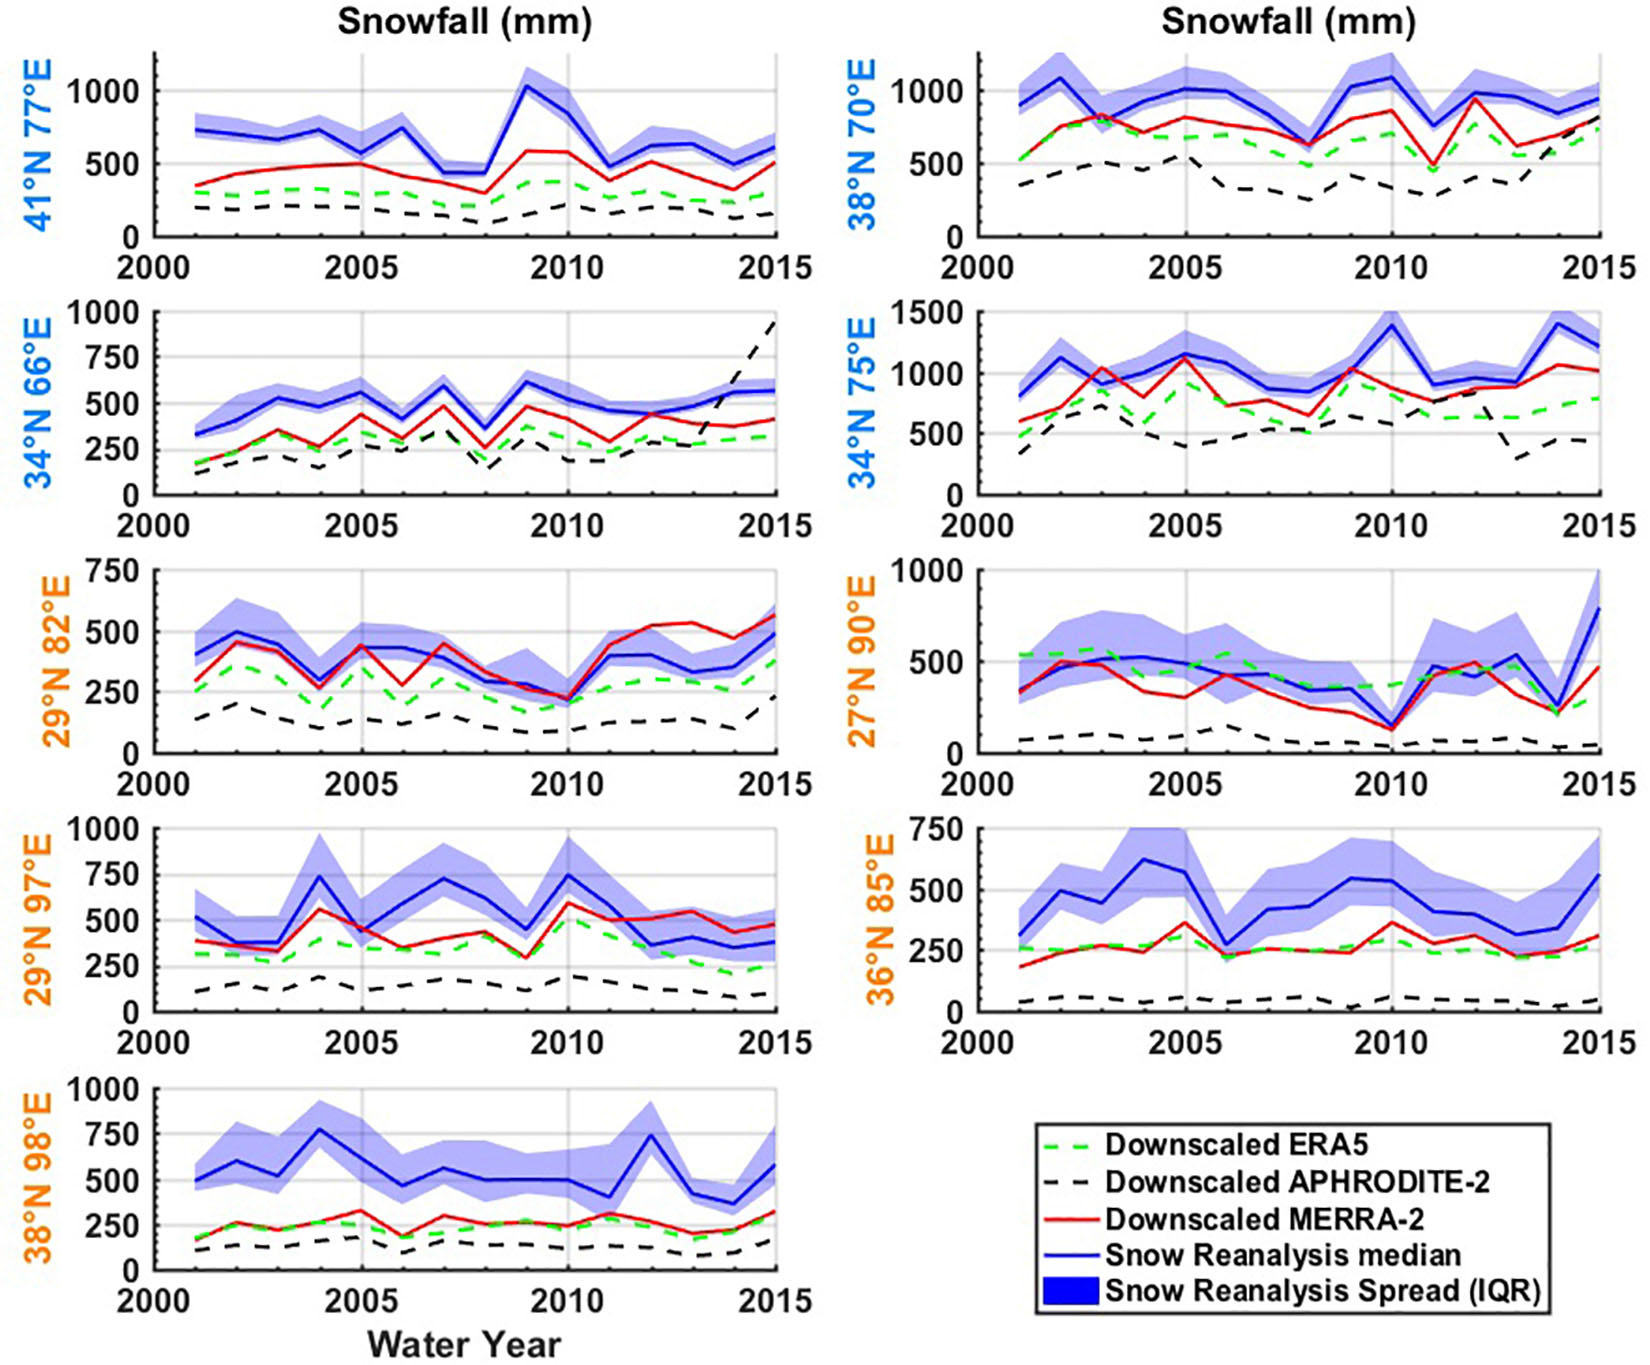
Figure 8. Tile-averaged annual total snowfall time series from downscaled ERA5, downscaled APHRODITE-2, and downscaled MERRA-2 vs. the snow reanalysis (ensemble median and interquartile range). Tile labels in blue and orange text represent their locations in the western domain or central-eastern domain, respectively.
Snowfall time series estimates from other gridded products (ERA5 and APHRODITE-2) are also generally lower than the snow reanalysis. The magnitude of snowfall in ERA5 is comparable and slightly lower than MERRA-2, while that in APHRODITE-2 is significantly lower than all the products, which is consistent with the snowfall biases discussed above (Figure 6). ERA5 snowfall is lower than both MERRA-2 and snow reanalysis in the western tiles, while in the central-eastern domain it is sometimes comparable to MERRA-2 but lower than snow reanalysis (36°N 85°E and 38°N 98°E), or comparable to the snow reanalysis (27°N 90°E) and higher than MERRA-2. APHRODITE-2 shows the minimum snowfall across all products, and the differences between APHRODITE-2 and other products are most apparent in the two southern tiles (27°N 90°E, 29°N 97°E) and one central-northern tile (36°N 85°E), which is also consistent with the tile specific snowfall biases shown in Figure 7. Our results suggest that snowfall at these high-altitude tiles is generally underestimated in the gauge-based products over HMA, which is consistent with Immerzeel et al. (2015) and Wortmann et al. (2018), where high-altitude precipitation was found to be underestimated in many existing products. Since the gauge-based products derive their estimates primarily by interpolating rain-gauges located at lower elevations, it is possible that those gauges undercatch precipitation and do not capture orographic effects, which consequently underestimates snowfall.
The ensemble uncertainty in snowfall estimated from the snow reanalysis varies across the tiles (Figure 8). In general, the ensemble spread is relatively low in the western tiles, corresponding to the lower CV values in the (∼0.4–0.8 in Figure 5), and relatively high in the central and eastern tiles, corresponding to the higher CV values in the (∼0.9–1.2 in Figure 5). As discussed earlier, the conditioning of the posterior b is most effective for seasonal snow. The western tiles are dominated by westerlies, and therefore receive most snowfall in winter when precipitation occurs; while the central-eastern tiles are more affected by monsoons, and receive less snowfall in winter but more in spring or summer (Figure 1). As a result, there is a strong seasonal cycle in the fSCA observations over the western tiles, resulting in better conditioning of the posterior b and lower uncertainties in snowfall. In the central-eastern tiles, the fSCA observations are less seasonal, resulting in less effective conditioning of the posterior b and higher uncertainties in snowfall.
In terms of the temporal correlations, snowfall in the gridded precipitation products are almost all positively correlated with snowfall from the snow reanalysis (Table 2). One exception is the correlation between APHRODITE-2 and the snow reanalysis, where a negative correlation coefficient of −0.13 exist in tile (34°N 75°E). Looking at individual tiles, the highest correlation coefficient averaged across all products is 0.76 for tile 34°N 66°E. The lowest average correlation coefficient is 0.31 for tile 34°N 75°E, mainly due to the negative coefficient from APHRODITE-2. On average, the correlation coefficient with the snow reanalysis annual time series is highest for ERA5 (0.63), followed by MERRA-2 (0.57), and APHRODITE-2 (0.42). These averaged coefficient values, indicate that snowfall variability from the reanalysis is not fully explained by snowfall from the input products. This is not surprising, and not necessarily a drawback, because the reanalysis snowfall is conditioned on independent fSCA observations; therefore its variations should reflect the temporal variation in fSCA, which are more directly connected to snow dynamics than any of the precipitation products.
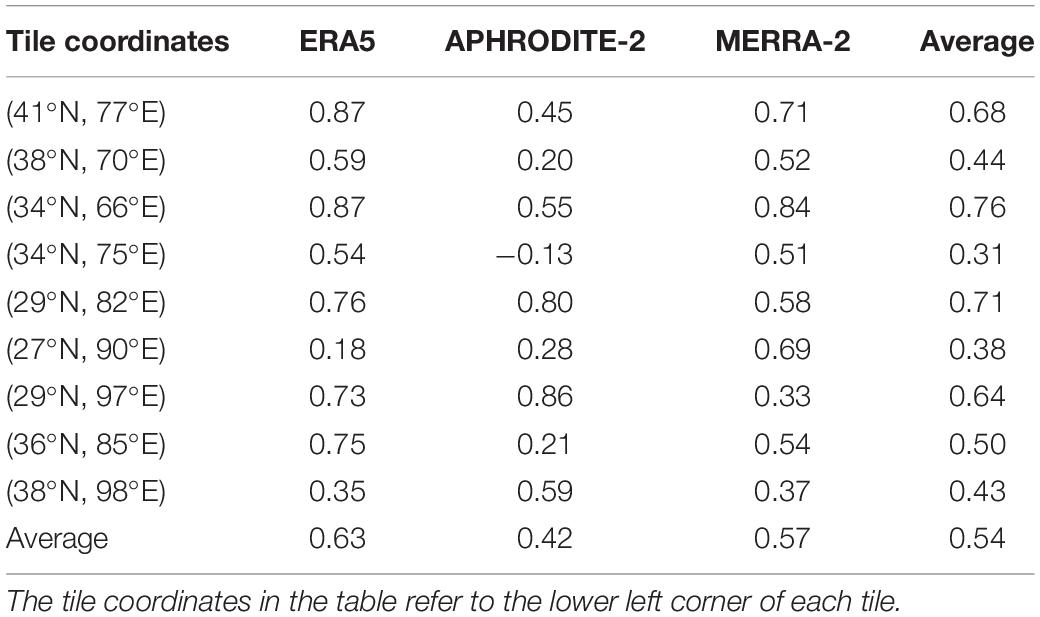
Table 2. Correlation coefficient of annual total snowfall between the snow reanalysis snowfall (ensemble median) and snowfall from other precipitation products (ERA5, APHRODITE-2, and MERRA-2).
Snowfall Distribution With Elevation
Finally, we investigated the snowfall distribution with elevation in each tile. All the coarse gridded precipitation products (MERRA-2, ERA5, and APHRODITE-2) were bilinearly interpolated to the reanalysis model grid, and downscaled with the reanalysis-derived air temperature to obtain snowfall estimates in each elevation bin (Figure 9). The solid lines represent the snowfall distribution from the downscaled MERRA-2 (red) and snow reanalysis (ensemble median, blue), respectively, and the two dashed lines represent the snowfall distribution from the downscaled ERA5 (green), and APHRODITE-2 (black). It should be acknowledged that none of the coarse products are expected to accurately resolve elevational snowfall distributions (beyond large-scale precipitation variations resolved by the coarse grids); the comparison herein is mainly to identify differences in localized elevational snowfall gradients within a tile.
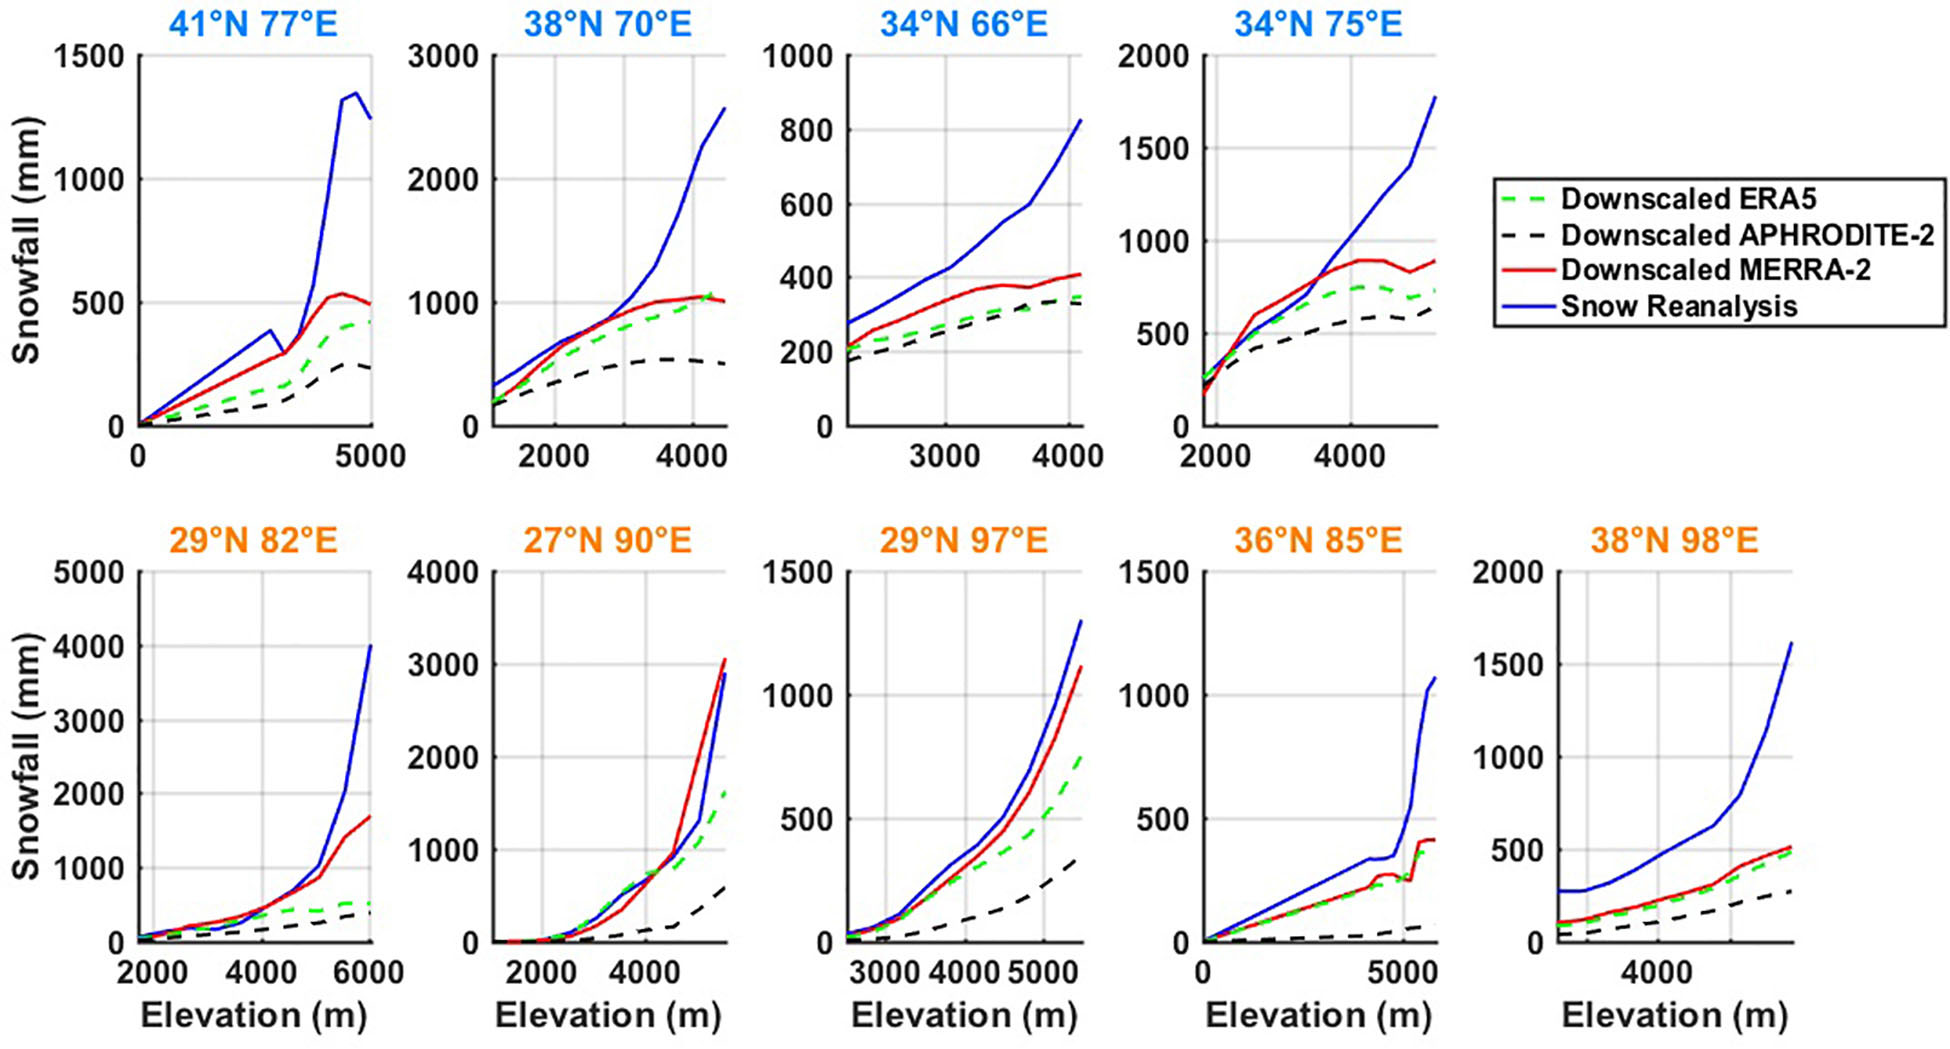
Figure 9. Elevational distribution of annual total snowfall climatology (WY 2001–2015) from downscaled ERA5, downscaled APHRODITE-2, and downscaled MERRA-2 vs. the snow reanalysis (ensemble median). Tile labels in blue and orange text represent their locations in the western domain or central-eastern domain, respectively.
As expected, the snowfall exhibits positive elevational gradients across all products, where the gradient is highest for the snow reanalysis compared to other products (Figure 9). Taking tile 41°N 77°E as an example, snowfall from the snow reanalysis is 0 mm at the lowest elevations, but rapidly increased to around 1300 mm at the highest elevations (5000 m). For the other products in the same tile, while starting from 0 mm at the lowest elevations, snowfall at the highest elevations only ends up around 500 mm for MERRA-2, 400 mm for ERA5 and 250 mm for APHRODITE-2. The most notable differences in snowfall is observed in the elevation range between 4000 and 5000 m, where the magnitude of snowfall is comparable at 4000 m, but almost 2∼3 times higher in the snow reanalysis than other products at 5000 m. A similar feature is observed in other tiles, where the snow reanalysis shows the largest amount of snowfall in most elevation bins, followed by MERRA-2, ERA5, and APHRODITE-2. The magnitude of snowfall across all products are comparable at low-mid elevations, but diverge at high elevations, with a mild slope observed in MERRA-2, ERA5, and APHRODITE-2, with a steeper slope observed in the snow reanalysis. Exceptions are two southern tiles (27°N 90°E, 29°N 97°E) that snowfall estimates are consistent among snow reanalysis, MERRA-2 and ERA5 across all elevation bins, and a steep slope is also observed in the latter two products at the highest elevation ranges. This indicates the potential of bias-correction in snowfall from the snow reanalysis especially at high elevations, where fSCA information exist, but precipitation gauges do not.
Fitted with a linear regression (Table 3), the gradient of snowfall against elevation is highest in the snow reanalysis (451 mm/km), followed by MERRA-2 (252 mm/km), ERA5 (174 mm/km), and APHRODITE-2 (91 mm/km) on average. Overall, the snowfall gradients are highest (>300 mm/km) in one western tile (38°N 70°E), two southern tiles (29°N 82°E, 27°N 90°E), and one north-eastern tile (38°N 98°E). Specifically, the two southern tiles are strongly affected by the Indian monsoon thereby receiving significant amounts of precipitation in the summer. The phase of summer precipitation is therefore more sensitive to elevation, as lower elevations receive more rainfall and higher elevations receive more snowfall. In the other tiles that are affected by winter westerlies, the phase of winter precipitation may not be as dependent on elevation because of colder winter temperatures. In addition, the magnitude of precipitation brought by the Indian monsoon is much greater than the westerlies (Figure 3). Therefore, the southern tiles may still receive significant amounts of snowfall even in summer at the very high elevations, which accounts for the large snowfall gradients in these tiles.
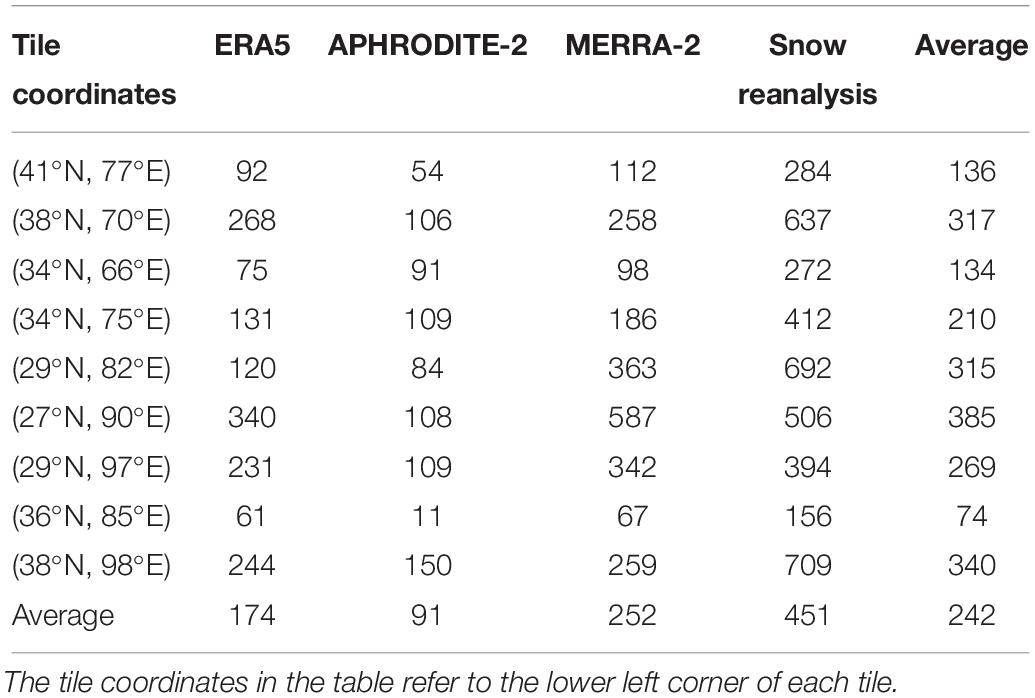
Table 3. Snowfall gradients with elevation (mm/km) from the snow reanalysis (ensemble median) and other precipitation products (ERA5, APHRODITE-2, and MERRA-2) fitted with a linear regression.
Conclusion
Using an “uninformed” prior estimate in a Bayesian snow reanalysis method, we parameterized the snowfall biases and uncertainties in MERRA-2 precipitation over the HMA region. The method was applied over 9 test tiles and spanned the WYs 2001–2015. The posterior scaling factor associated with using MERRA-2 as the nominal precipitation input () is effectively updated (from the prior uniform distribution) in most tiles featuring seasonal snow, which yields unimodal skewed uncertainty distributions that when fitted using lognormal distributions, exhibited tile-specific mean values ranging from 1.0 to 1.9 and tile-specific CV values ranging from 0.5 to 1.2. One tile in the northeastern Tibetan Plateau is an exception with mean values around 2.5, which is likely indicative of a less robust parameterization due to the fact that intermittent snow plays a more significant role in that tile. By merging the results across tiles, we were able to quantify a global uncertainty model in snowfall using a lognormal distribution with a mean of 1.54 (median of 1.19) and a CV of 0.83. The parameterized distribution indicates that MERRA-2 underestimates snowfall precipitation by ∼54% on average (when compared to the posterior reanalysis estimates) with significant uncertainty.
Estimates of the biases and uncertainty in snowfall from other gridded products (ERA5 and APHRODITE-2) were also derived in this study. Compared to the reanalysis snowfall, we found ERA5 and APHRODITE-2 generally, on average, underestimate snowfall by a factor of ∼1.78 (with a median scaling factor of 1.42) and ∼3.34 (with a median scaling factor of 2.51), respectively, over the HMA domain. The snowfall biases in MERRA-2 and ERA5 have similar magnitudes (where ERA5 is slightly larger), while that in APHRODITE-2 are much larger than the other two products, especially in the monsoon-influenced tiles. The biases in all datasets are generally lower in the western tiles compared to those in the central and eastern part of the domain.
In addition to the biases and uncertainties in b, we also examined the spatial-temporal distribution of snowfall in the snow reanalysis and other products used in this study. Significant heterogeneity is observed in the snow reanalysis snowfall compared to the downscaled MERRA-2, showing the snow reanalysis effectively downscales the coarse MERRA-2 by leveraging information in the higher-resolution fSCA data observed in each WY and in other model-based fields (i.e., terrain). In terms of annual snowfall time series, snowfall from the snow reanalysis is generally greater than that from MERRA-2, where ERA5 shows similar magnitudes as MERRA-2 and APHRODITE-2 significantly smaller than other products. The temporal correlation of snowfall between snow reanalysis and other products are mostly positive, and the averaged correlation coefficient across all tiles are between 0.42 and 0.63 for these products. The fact that the correlation is not higher is likely indicative of the impact of other factors (i.e., fSCA measurements) in the temporal variations in the posterior reanalysis estimates. Based on examination of the elevational distribution of snowfall, we found the snowfall gradients largest in the snow reanalysis followed by MERRA-2, ERA5, and APHRODITE-2.
Overall, this study shows the potential for using satellite snow observations as a constraint on models to infer biases and uncertainties in snowfall precipitation in remote regions and complex terrain where in situ stations are very scarce. The results indicate that snowfall precipitation is underestimated in most precipitation products, and the biases are higher in the gauge-based precipitation product. One limitation in this study is that the method relies on the seasonal cycle of snow accumulation and ablation captured by fSCA observations to condition snowfall. Therefore, it is expected that the Bayesian update will be more effective in snow-dominated regions that feature a clear seasonal signal, but less effective in regions with intermittent snow. The approach is best suited to estimating high elevation precipitation where snowfall dominates, but likely not very informative of low elevation precipitation where rainfall dominates. In this sense, this effort is complementary to gauge-based estimates, which are expected to perform best in lower elevations where the gauges reside, but may have difficulty extrapolating precipitation information to higher elevations. Results from this work are being used in the development of a snow reanalysis dataset over the full HMA domain. That effort should lead to a more complete picture of snowfall biases and space-time variations across the domain and could be used to further inter-compare products more broadly. Additionally, while this work focused on using MERRA-2 as the baseline input to the snow reanalysis scheme, future work could examine the usage of ERA5 and/or products in combination to more thoroughly represent the uncertainty in precipitation in such domains.
Data Availability Statement
The datasets generated for this study are available on request to the corresponding author.
Author Contributions
YL led the implementation of the method and analysis, and contributed to writing of the manuscript. SM supervised the project, provided overall guidance, and contributed to writing of the manuscript.
Funding
This work was funded by the NASA High Mountain Asia Program Grant #NNX16AQ63G.
Conflict of Interest
The authors declare that the research was conducted in the absence of any commercial or financial relationships that could be construed as a potential conflict of interest.
Acknowledgments
We would like to thank those responsible for the creation of the datasets used in this study as well as members of the NASA High Mountain Asia Team (HiMAT) who have helped to shape the overall direction of the work. G. Cortes is acknowledged for pre-processing some of the input data used in the snow reanalysis over the HMA domain. The reviewers are acknowledged for their helpful comments which greatly improved the manuscript.
Footnotes
References
Andermann, C., Bonnet, S., and Gloaguen, R. (2011). Evaluation of precipitation data sets along the Himalayan front. Geochem. Geophys. Geosyst. 12:Q07023. doi: 10.1029/2011GC003513
Anders, A. M., Roe, G. H., Hallet, B., Montgomery, D. R., Finnegan, N. J., and Putkonen, J. (2006). Spatial patterns of precipitation and topography in the Himalaya. Spec. Paper Geol. Soc. Am. 398, 39–53. doi: 10.1130/2006.2398(03)
Bolch, T., Kulkarni, A., Kaab, A., Huggel, C., Paul, F., Cogley, J. G., et al. (2012). The state and fate of Himalayan glaciers. Science 336, 310–314. doi: 10.1126/science.1215828
Bookhagen, B., and Burbank, D. W. (2006). Topography, relief, and TRMM-derived rainfall variations along the Himalaya. Geophys. Res. Lett. 33:L08405. doi: 10.1029/2006GL026037
Bookhagen, B., and Burbank, D. W. (2010). Toward a complete Himalayan hydrological budget: spatiotemporal distribution of snowmelt and rainfall and their impact on river discharge. J. Geophys. Res. 115:F03019. doi: 10.1029/2009JF001426
Copernicus Climate Change Service (2017). ERA5: Fifth Generation of ECMWF Atmospheric Reanalyses of the Global Climate. Available at: https://cds.climate.copernicus.eu/cdsapp#!/home (accessed June 27, 2019).
Cortés, G., Girotto, M., and Margulis, S. (2016). Snow process estimation over the extratropical Andes using a data assimilation framework integrating MERRA data and Landsat imagery. Water Resour. Res. 52, 2582–2600. doi: 10.1002/2015WR018376
Cortés, G., and Margulis, S. (2017). Impacts of El Niño and La Niña on interannual snow accumulation in the Andes: results from a high-resolution 31 year reanalysis. Geophys. Res. Lett. 44, 6859–6867. doi: 10.1002/2017GL073826
Dee, D. P., Uppala, S. M., Simmons, A. J., Berrisford, P., Poli, P., Kobayashi, S., et al. (2011). The ERA-Interim reanalysis: configuration and performance of the data assimilation system. Q. J. R. Meteorol. Soc. 137, 553–597. doi: 10.1002/qj.828
Durand, M., Molotch, N. P., and Margulis, S. A. (2008). A Bayesian approach to snow water equivalent reconstruction. J. Geophys. Res. 113:D20117. doi: 10.1029/2008JD009894
Gelaro, R., McCarty, W., Suárez, M. J., Todling, R., Molod, A., Takacs, L., et al. (2017). The modern-era retrospective analysis for research and applications, version 2 (MERRA-2). J. Clim. 30, 5419–5454. doi: 10.1175/JCLI-D-16-0758.1
Girotto, M., Cortés, G., Margulis, S. A., and Durand, M. (2014a). Examining spatial and temporal variability in snow water equivalent using a 27 year reanalysis: Kern river watershed, sierra nevada. Water Resour. Res. 50, 6713–6734. doi: 10.1002/2014WR015346
Girotto, M., Margulis, S. A., and Durand, M. (2013). Probabilistic SWE reanalysis as a generalization of deterministic SWE reconstruction techniques. Hydrol. Process. 28, 3875–3895. doi: 10.1002/hyp.9887
Girotto, M., Margulis, S. A., and Durand, M. (2014b). Probabilistic SWE reanalysis as a generalization of deterministic SWE reconstruction techniques. Hydrol. Process. 28, 3875–3895. doi: 10.1002/hyp.9887
Harris, I., Jones, P. D., Osborn, T. J., and Lister, D. H. (2014). Updated high-resolution grids of monthly climatic observations - the CRU TS3.10 Dataset. Int. J. Climatol. 34, 623–642. doi: 10.1002/joc.3711
Huffman, G. J., Bolvin, D. T., Nelkin, E. J., Wolff, D. B., Adler, R. F., Gu, G., et al. (2007). The TRMM multisatellite precipitation analysis (TMPA): quasi-global, multiyear, combined-sensor precipitation estimates at fine scales. J. Hydrometeorol. 8, 38–55. doi: 10.1175/JHM560.1
Hussain, S., Song, X., Ren, G., Hussain, I., Han, D., and Zaman, M. H. (2017). Evaluation of gridded precipitation data in the Hindu Kush–Karakoram–Himalaya mountainous area. Hydrol. Sci. J. 62, 2393–2405. doi: 10.1080/02626667.2017.1384548
Immerzeel, W. W., Wanders, N., Lutz, A. F., Shea, J. M., and Bierkens, M. F. P. (2015). Reconciling high-altitude precipitation in the upper Indus basin with glacier mass balances and runoff. Hydrol. Earth Syst. Sci. 19, 4673–4687. doi: 10.5194/hess-19-4673-2015
Khan, A., and Koch, M. (2018). Correction and informed regionalization of precipitation data in a high mountainous region (Upper Indus Basin) and its effect on SWAT-modelled discharge. Water 10:1557. doi: 10.3390/w10111557
Khan, A., Koch, M., and Chinchilla, K. (2018). Evaluation of gridded multi-satellite precipitation estimation (TRMM-3B42-V7) performance in the Upper Indus Basin (UIB). Climate 6:76. doi: 10.3390/cli6030076
Lehner, B., Verdin, K., and Jarvis, A. (2006). HydroSHEDS Technical Documentation. Washington, DC: World Wildlife Fund US.
Margulis, S. A., Cortés, G., Girotto, M., and Durand, M. (2016). A Landsat-Era Sierra Nevada snow reanalysis (1985–2015). J. Hydrometeorol. 17, 1203–1221. doi: 10.1175/JHM-D-15-0177.1
Margulis, S. A., Girotto, M., Cortés, G., and Durand, M. (2015). A particle batch smoother approach to snow water equivalent estimation. J. Hydrometeorol. 16, 1752–1772. doi: 10.1175/JHM-D-14-0177.1
Margulis, S. A., Liu, Y., and Baldo, E. (2019). A joint landsat- and MODIS-based reanalysis approach for midlatitude montane seasonal snow characterization. Front. Earth Sci. 7:272. doi: 10.3389/feart.2019.00272
Maussion, F., Scherer, D., Mölg, T., Collier, E., Curio, J., and Finkelnburg, R. (2014). Precipitation seasonality and variability over the Tibetan plateau as resolved by the high Asia reanalysis∗. J. Clim. 27, 1910–1927. doi: 10.1175/JCLI-D-13-00282.1
Palazzi, E., Hardenberg, von, J., and Provenzale, A. (2013). Precipitation in the Hindu-Kush Karakoram Himalaya: observations and future scenarios. J. Geophys. Res. Atmospheres 118, 85–100. doi: 10.1029/2012JD018697
Rienecker, M. M., Suárez, M. J., Gelaro, R., Todling, R., Bacmeister, J., Liu, E., et al. (2011). MERRA: NASA’s modern-era retrospective analysis for research and applications. J. Clim. 24, 3624–3648. doi: 10.1175/JCLI-D-11-00015.1
Song, C., Huang, B., Ke, L., and Ye, Q. (2016). Precipitation variability in High Mountain Asia from multiple datasets and implication for water balance analysis in large lake basins. Glob. Planet. Change 145, 20–29. doi: 10.1016/j.gloplacha.2016.08.005
Tahir, A. A., Chevallier, P., Arnaud, Y., and Ahmad, B. (2011). Snow cover dynamics and hydrological regime of the Hunza River basin, Karakoram Range, Northern Pakistan. Hydrol. Earth Syst. Sci. 15, 2275–2290. doi: 10.1016/j.scitotenv.2014.10.065
Viste, E., and Sorteberg, A. (2015). Snowfall in the Himalayas: an uncertain future from a little-known past. Cryosphere 9, 1147–1167. doi: 10.5194/tc-9-1147-2015
Winiger, M., Gumpert, M., and Yamout, H. (2005). Karakorum-Hindukush-western Himalaya: assessing high-altitude water resources. Hydrol. Process. 19, 2329–2338. doi: 10.1002/hyp.5887
Wortmann, M., Bolch, T., Menz, C., Tong, J., and Krysanova, V. (2018). Comparison and correction of high-mountain precipitation data based on glacio-hydrological modeling in the Tarim River headwaters (High Asia). J. Hydrometeorol. 19, 777–801. doi: 10.1175/JHM-D-17-0106.1
Xia, Y., Mitchell, K., Ek, M., Sheffield, J., Cosgrove, B., Wood, E., et al. (2012). Continental-scale water and energy flux analysis and validation for the North American land data assimilation system project phase 2 (NLDAS-2): 1. Intercomparison and application of model products. J. Geophys. Res. 117:D03109. doi: 10.1029/2011JD016048
Yatagai, A., Kamiguchi, K., Arakawa, O., Hamada, A., Yasutomi, N., and Kitoh, A. (2012). APHRODITE: constructing a long-term daily gridded precipitation dataset for Asia based on a dense network of rain gauges. Bull. Am. Meteorol. Soc. 93, 1401–1415. doi: 10.1175/BAMS-D-11-00122.1
Keywords: snowfall, precipitation, bias, data assimilation, High Mountain Asia
Citation: Liu Y and Margulis SA (2019) Deriving Bias and Uncertainty in MERRA-2 Snowfall Precipitation Over High Mountain Asia. Front. Earth Sci. 7:280. doi: 10.3389/feart.2019.00280
Received: 30 April 2019; Accepted: 17 October 2019;
Published: 01 November 2019.
Edited by:
Sujay V. Kumar, National Aeronautics and Space Administration, United StatesReviewed by:
Melissa Wrzesien, University of North Carolina at Chapel Hill, United StatesLawrence Mudryk, Environment and Climate Change, Canada
Copyright © 2019 Liu and Margulis. This is an open-access article distributed under the terms of the Creative Commons Attribution License (CC BY). The use, distribution or reproduction in other forums is permitted, provided the original author(s) and the copyright owner(s) are credited and that the original publication in this journal is cited, in accordance with accepted academic practice. No use, distribution or reproduction is permitted which does not comply with these terms.
*Correspondence: Steven A. Margulis, bWFyZ3VsaXNAc2Vhcy51Y2xhLmVkdQ==