 David W. Beilman1*
 Charly Massa1
 Jonathan E. Nichols2
 Oliver Elison Timm3
 Russel Kallstrom4Stephanie Dunbar-Co4
- 1Department of Geography and Environment, University of Hawai‘i at Mānoa, Honolulu, HI, United States
- 2Lamont-Doherty Earth Observatory, Columbia University, Palisades, NY, United States
- 3Department of Atmospheric and Environmental Sciences, University at Albany, Albany, NY, United States
- 4The Nature Conservancy, Moloka‘i Program, Kualapu‘u, HI, United States
The Hawaiian Islands are the only high land in a vast stretch of the North Pacific where past climatological and ecological processes can be reconstructed from terrestrial Earth system archives. We measured hydroclimatic proxies and carbon accumulation in an organic sediment core from the windward montane peatland Pēpē‘ōpae on the Island of Moloka‘i, Hawai‘i using radiocarbon, leaf wax geochemistry, and stable isotopes of carbon and hydrogen in addition to historical pollen records. Following a period of soil development, substantial carbon accumulation began around 10 ka BP (thousands of years before present) under wet conditions. Peat formation was continuous but variable throughout the Holocene, including maxima in carbon accumulation around 9 and 3 ka and a minimum around 1.5 ka that has resulted in a belowground carbon storage today of 144 kg C m-2. From this core we generated a new chronology for previously published pollen spectra from the study site and a Wetness Index that shows increases in dry-adapted taxa in upwind forests during periods of decreased carbon accumulation in the peatland. Shifts in the distribution of sedimentary n-alkane chain lengths in the context of 14 species of modern bog plant n-alkanes suggests litter inputs have been derived from a diverse plant community that changed in dominant species in response to climate. Hydrogen stable isotope ratios of sedimentary C29 n-alkanes show negative departures around 9 and 3 ka consistent with increases in storm-derived rainfall likely related to the position and strength of the northern jet stream. This study is the first to provide a continuous organic sedimentary record of links between hydroclimate, vegetation, and montane belowground carbon sequestration for this part of the North Pacific.
Introduction
Knowing the history of hydroclimatic change from a network of sites across the Pacific is important to understanding the external and internal drivers critical to the long-term future of rainfall in the region. Owing to their size, elevation, and isolation, the Hawaiian Islands are the sole location in the central Pacific for comparison to other important freshwater terrestrial proxy records across the region. Despite a growing number of studies of past environments and climates that have studied pollen (e.g., Selling, 1948; Burney et al., 1995; Hotchkiss and Juvik, 1999; Crausbay et al., 2014), sediment geochemistry (Uchikawa et al., 2010; Crausbay et al., 2014), and sea surface temperatures (SSTs) (Lee and Slowey, 1999) much remains to be learned about hydroclimate change in Hawai‘i and the north central Pacific. For example, the two synoptic atmospheric circulation patterns today that produce the most rainfall in Hawai‘i are orographically lifted trade winds and so-called “Kona storms” (Chu et al., 1993), yet we do not know the long-term history of these patterns. It has been shown that drier leeward locations of the islands have experienced increasingly arid conditions over the last several thousand years (Uchikawa et al., 2010), but high quality Holocene records of hydroclimate from wet windward locations in Hawaii have not yet been developed in detail.
Montane freshwater peatlands in the Tropics are useful for reconstruction of climate and ecosystem change owing to their relatively widespread distribution and their high organic matter (OM) content for measurement of organic geochemical proxies and radiocarbon. While the largest tropical peatlands occur in rainforest lowlands of Southeast Asia (Page et al., 2011), Africa (Dargie et al., 2017), and South American Amazonia (Lähteenoja et al., 2013), low-latitude peatland ecosystems can also be found in mountainous terrain, where waterlogged soils are maintained in locally flat areas of heavy rainfall. Such ecosystems and organic deposits are found, for example, in Papua New Guinea (Hope, 2014), West Kalimantan (Anshari et al., 2004), South American Andes (Benavides et al., 2013) and the Guyana Highlands (Zinck and Huber, 2011) and various Pacific Islands (Rieley and Page, 2015). In the Hawaiian Islands, freshwater lakes and sediments are rare owing to steep and permeable volcanic terrain (Maciolek, 1969) but many small mountain peatlands are found on the main islands (Carlquist, 1970), long noted biogeographically for rare plants of cold evolutionary origins (e.g., Rock, 1913). In addition to holding archives of past hydroclimatic change, mountain peatlands in Hawai‘i provide the opportunity for ecological reconstructions of OM cycling and carbon sequestration relevant to understanding long-term tropical peatland carbon dynamics in general, as well as processes affecting Hawai‘i mountain forests.
In this paper, we reconstruct environmental changes in Hawai‘i using carbon and leaf wax geochemistry in modern plant leaf tissue and in peat deposits from the Island of Moloka‘i. We also analyze previously published fossil pollen from East Moloka‘i and the Island of Maui. Other studies have reconstructed Holocene environment in Hawai‘i from a dry, leeward coastal site (Uchikawa et al., 2010) and high elevations at the trade wind inversion layer (Burney et al., 1995; Crausbay et al., 2014). Our goal here is to develop a multi-proxy picture of hydroclimatic and ecological variations at a mid-elevation windward wet forest.
Materials and Methods
Study Site and Field Collections
The Island of Moloka‘i (Figure 1), formed of two shield volcanoes in the Maui Nui group, is situated geographically in the middle of the main Hawaiian Archipelago. Moloka‘i is high (1506 m) for its size (673 km2) owing in part to mass wasting events on its north shore (Moore et al., 1989), that have created some of the world‘s highest sea cliffs. The upper flows of the East Moloka‘i Volcanic Series are mugearitic basalt that are 1.3–1.5 Ma old (Macdonald et al., 1983). Wet rainforest on Moloka‘i, typically above 600 m (Jacobi, 1989), have wet soils and can form small open wetlands where topography flattens. Pēpē‘ōpae is a montane peatland at 1310 m elevation, ∼11,550 m2 in area, situated leeward of the western rim of Pelekunu Valley, 3.6 km northwest of the island‘s summit at Kamakou, and 5 km from the windward north coast (Figure 1). Estimates of mean monthly air temperature at the site ranges from 13 to 17°C, and mean annual rainfall is ∼3400 mm, about two-thirds of which falls during the rainy season from November to April (Giambelluca et al., 2014). Pēpē‘ōpae was known to early botanists for its rare plants and thick deposits (Hillebrand, 1888; MacCaughey, 1916) and was a focus of the Hawaiian Bog Survey 1938 (Skottsberg, 1940) that resulted in the seminal palynological study of the Hawaiian Islands by Selling (1948).
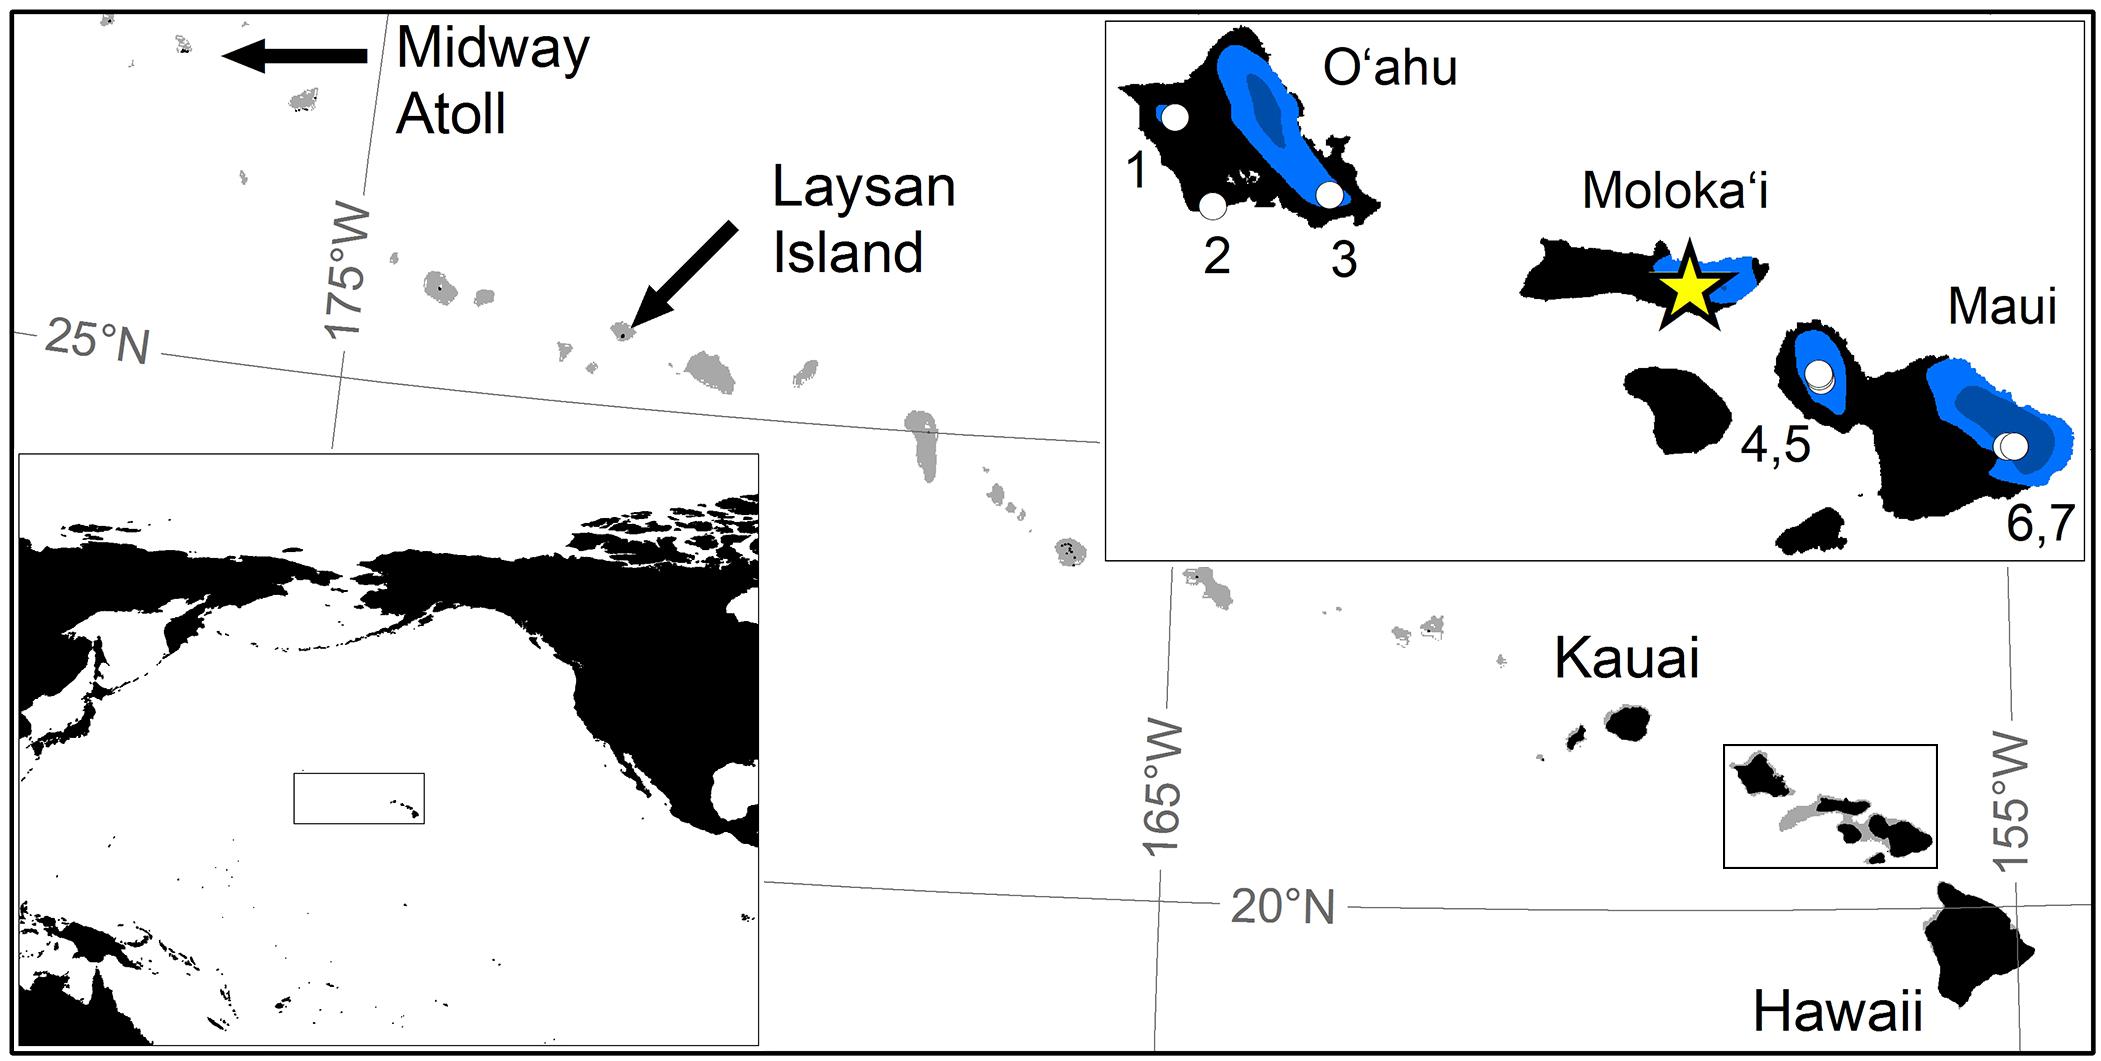
Figure 1. Map of the North Pacific region and the study site. The Hawaiian Island chain in the North Pacific (inset) from Midway Atoll to the Island of Hawai‘i with bathymetry to 130 m shown in gray. Islands of O‘ahu and of the Maui Nui complex shown with annual rainfall over 1500 mm (blue) and 4000 mm (dark blue) with the location of the study site at Pēpē‘ōpae (star) on the Island of Moloka‘i and sites mentioned in the text (circles): (1) Ka‘ala, (2) Kalaeloa and Ordy Pond (Uchikawa et al., 2010), (3) Ka‘au Crater (Hotchkiss and Juvik, 1999), (4) and (5) summit and lowest bog Pu‘u Kukui sites (Selling, 1948), (6) Wai‘anapanapa Pond (Crausbay et al., 2014), and (7) Flat Top Bog (Burney et al., 1995).
Today, Pēpē‘ōpae has an open vegetation and diverse community of sedges, dwarf woody plants, ferns, lycopods, and mosses in a gently sloping hummocky terrain (Figure 1; Supplementary Table S2). The peatland lacks pools, but temporary standing water can be found in small depressions. The site lies within the Kamakou Nature Preserve, granted to the Nature Conservancy in 1982, and within a network of protected areas covering more than one hundred acres of contiguous ecosystems.
A sediment core (PEP1) was raised from the upper part of Pēpē‘ōpae (21° 7′ 8.6″N, 156° 54′ 2.3″ W, 1262m ASL) on May 28, 2013 using a Russian-style side-cut peat corer with a 50-cm long and 5-cm diameter barrel. Core sections were frozen within 3 h of collection, transferred frozen to the laboratory at the University of Hawai‘i at Mānoa and stored at -20°C. Plant leaf tissue samples from 14 common bog species were collected at the site on May 14, 2018 (Supplementary Table S1). Leaf samples from multiple individuals were collected and composited from both the upper and lower areas of the main bog, resulting in duplicate measurements for each species. Tissues were frozen within 3 h of collection and freeze dried. A rainwater collector was made of a five-gallon plastic bucket with a funnel set in the lid and a 1-cm mineral oil layer to prevent evaporation, and was sampled opportunistically between May and December 2018.
Core Chronology
The age of organic carbon in the profile was determined based on the top of the core (assigned as the year of collection, 2013) and the radiocarbon (14C) dating of peat samples. Subsamples for 14C measurement were carefully removed from the center of core slices, dispersed in 18.0 MΩ water, and OM free of visible roots was hand-picked using a 50× Zeiss Stemi 2000 microscope. To remove exogenous organic carbon and inorganic carbon, OM samples were prepared by Acid-Base-Acid pretreatment and rinsed to circum-neutral pH before drying to constant mass at 65°C. Dry OM was combusted to CO2 at 1000°C for 6 h in evacuated quartz tubes in the presence of copper oxide and silver powder. CO2 ampules were graphitized and 14C/12C ratios determined at the Lawrence Livermore National Lab Center for Accelerator Mass Spectroscopy (LLNL-CAMS). The 14C ages were calibrated to calendar years using the IntCal13 dataset (Reimer et al., 2013) and age-depth modeling was implemented in the R package BACON 2.3.4 (Blaauw and Christen, 2018).
Geochemistry
The PEP1 core was sliced frozen at 1-cm resolution on a band saw with a stainless steel blade. A 2–3 cm3 subsample of known volume was dried at 100°C to constant mass to determine bulk density, and then homogenized with a Retsch MM200 ball mill and sieved at 250 μm. OM content was determined by loss-on-ignition of a 1–2 cm3 subsample combusted in a muffle furnace at 550°C for 4 h. Elemental concentrations of carbon and nitrogen and the carbon stable isotope composition (δ13C values reported in values of per mille vs. VPDB; Vienna Pee Dee Belemnite) of 2.4–15 mg subsamples (depending on OM content to target a consistent response) were loaded in tin capsules and determined by Elemental Analyzer (EA)-Cavity Ring-Down Spectrometer (CRDS) using a Costech ECS 4010 EA coupled to a Picarro G2201-i CRDS. Plant δ13C and δ15N values were determined by Isotope Ratio Mass Spectroscopy (IRMS) using an ECS 4010 coupled to a Thermo Scientific Finnigan Delta Plus XP at the Stable Isotope Laboratory at the University of Hawai‘i at Mānoa. Long-term accuracy and precision of δ13C and δ15N is better than ±0.2‰.
Sedimentary n-alkanes were extracted from 2-cm thick composited samples from 31 depths in core PEP1. Plant leaf wax n-alkanes were extracted from ∼650 mg leaf samples. Total lipids were extracted by sonication in hexane and separated into four molecular fractions based on polarity using silica gel flash columns following the method of Nichols (2011) and Nichols et al. (2014) at the University of Hawai‘i at Mānoa. Hydrocarbons were analyzed using an Agilent GC (Gas Chromatograph) equipped with programed temperature vaporization (PTV) inlet, 30 m DB-5 column, flame ionization detector (FID) and Agilent Mass Selective Detector (MSD). The oven temperature holds at 60°C for the first minute, ramps at 22°C min-1 to 200°C, ramps at 7.5°C min-1 to 320°C, and dwells for 10 min (Nichols et al., 2014). Hydrogen isotopes of individual n-alkanes were measured by GC-IRMS. Compounds eluting from the GC (column and program parameters same as above) were routed through a Thermo GC Isolink pyrolysis reactor at 1420°C. Compounds were pyrolized to hydrogen gas and routed through a Thermo Conflo IV continuous flow device to a Thermo Delta V Plus IRMS. Values of δ2H are reported in per mille VSMOW. Absolute delta values are determined by comparison with certified reference standards (A. Schimmelmann, University of Indiana). Long-term mean analytical uncertainty of δ2H measurements on individual alkanes is ±2‰. Analysis of n-alkanes was conducted at the Organic Geochemistry Laboratory at Lamont-Doherty Earth Observatory. Water isotope measurements of collected rainwater were made on a Picarro L20130-i at the University of Hawai‘i Stable Isotope Biogeochemistry Lab.
Literature Forest Pollen and Peat Depth Data
Selling (1948; hereafter referred to as the OHS1948 data) produced microfossil diagrams for 14 peat cores from Kauai, Moloka‘i, and Maui, which summarized relative pollen and spore abundances for 17 dominant genera. This seminal work includes 60 assemblages from a 330-cm core raised from Pēpē‘ōpae in 1937 (Ser. 1; hereafter OHS1948-01) raised likely within 20 m of our core PEP1. We also included OHS1948 pollen from Pu‘u Kukui on West Maui in our analysis (Figure 1). We digitized the pollen percent relative abundances for OHS1948-01 (Pēpē‘ōpae) and OHS1948-33, -34, -60, and -80 (West Maui) by scanning the published diagrams at high-resolution and generating data with PlotDigitizer 2.6.8. From Selling’s (1948) original survey sketches, the 33 peat depths they measured along three transects at Pēpē‘ōpae were also digitized. We established a chronology for OSH1948-01 based on correlations between pollen concentrations in OSH1948-01 and the carbon accumulation rate in PEP1.
Statistical Analysis
The percentage distributions of n-alkanes in plants and peat were summarized by calculating index values for average chain length (ACL) and the carbon preference index (CPI; Marzi et al., 1993). The ACL is a concentration-weighted average of chain lengths of odd-numbered chains between 17 and 35. A Principle Components Analysis (PCA) of odd-numbered n-alkane percentages in the 24 plant and 31 peat samples aided the interpretation of the contribution of leaf litter types to the sedimentary n-alkanes. The OSH1948 data was analyzed in two ways. First, we put the Pēpē‘ōpae pollen assemblages in context of nearby OHS1948 data by ordinating assemblages from Pēpē‘ōpae and sites on West Maui using orthogonalized Non-metric Multidimensional Scaling (NMDS) based on the Bray–Curtis dissimilarity measure. Second, we generated a climatic Wetness Index by scoring the 17 OHS1948 pollen genera by their habitat wetness (Supplementary Table S3) as provided by Wagner et al. (1996) and Palmer (2008) and a Weighted Average (WA) ordination to produce a Wetness Index value for each assemblage (Hotchkiss and Juvik, 1999). Multivariate analyses were run using PC-ORD (McCune and Mefford, 2016).
Results
Core
Core PEP1 was 272 cm in total length and the peat section from the surface with living plants to a sharp interface with basal clay was 232 cm (Figure 2). The core consists of highly humified peat of high OM and carbon content (means of 97 and 53%, respectively) and low bulk density (mean of 0.11 g cm-2). The δ13C values of bulk peat ranged from -28.1 to -25.3‰. Eight radiocarbon measurements (Supplementary Table S1) show the age of OM at the clay-peat transition to be about 11.5 ka BP (thousands of years Before Present, where present is AD1950), with rapid peat formation occurring after ∼9.6 ka. Estimated carbon storage (carbon density per unit area) was 56 kg C m-2 at 100-cm depth, and 144 kg C m-2 for the entire profile (Figure 2). Peat depths at the site during the 1937 surveys ranged from 40 to 335 cm with a mean of 184 cm. An estimate for belowground carbon storage for the site, based on the mean peat carbon density (0.60 kg C m-3; PEP1 average, this study), the mean peat depth (1.84 m; n = 33, Selling, 1948), and the peatland area (11,550 m2), is 12.8 Mg C. The reconstructed rate of apparent carbon accumulation since 9.6 ka BP varied from 4.1 to 48.7 g C m-2 year-1.
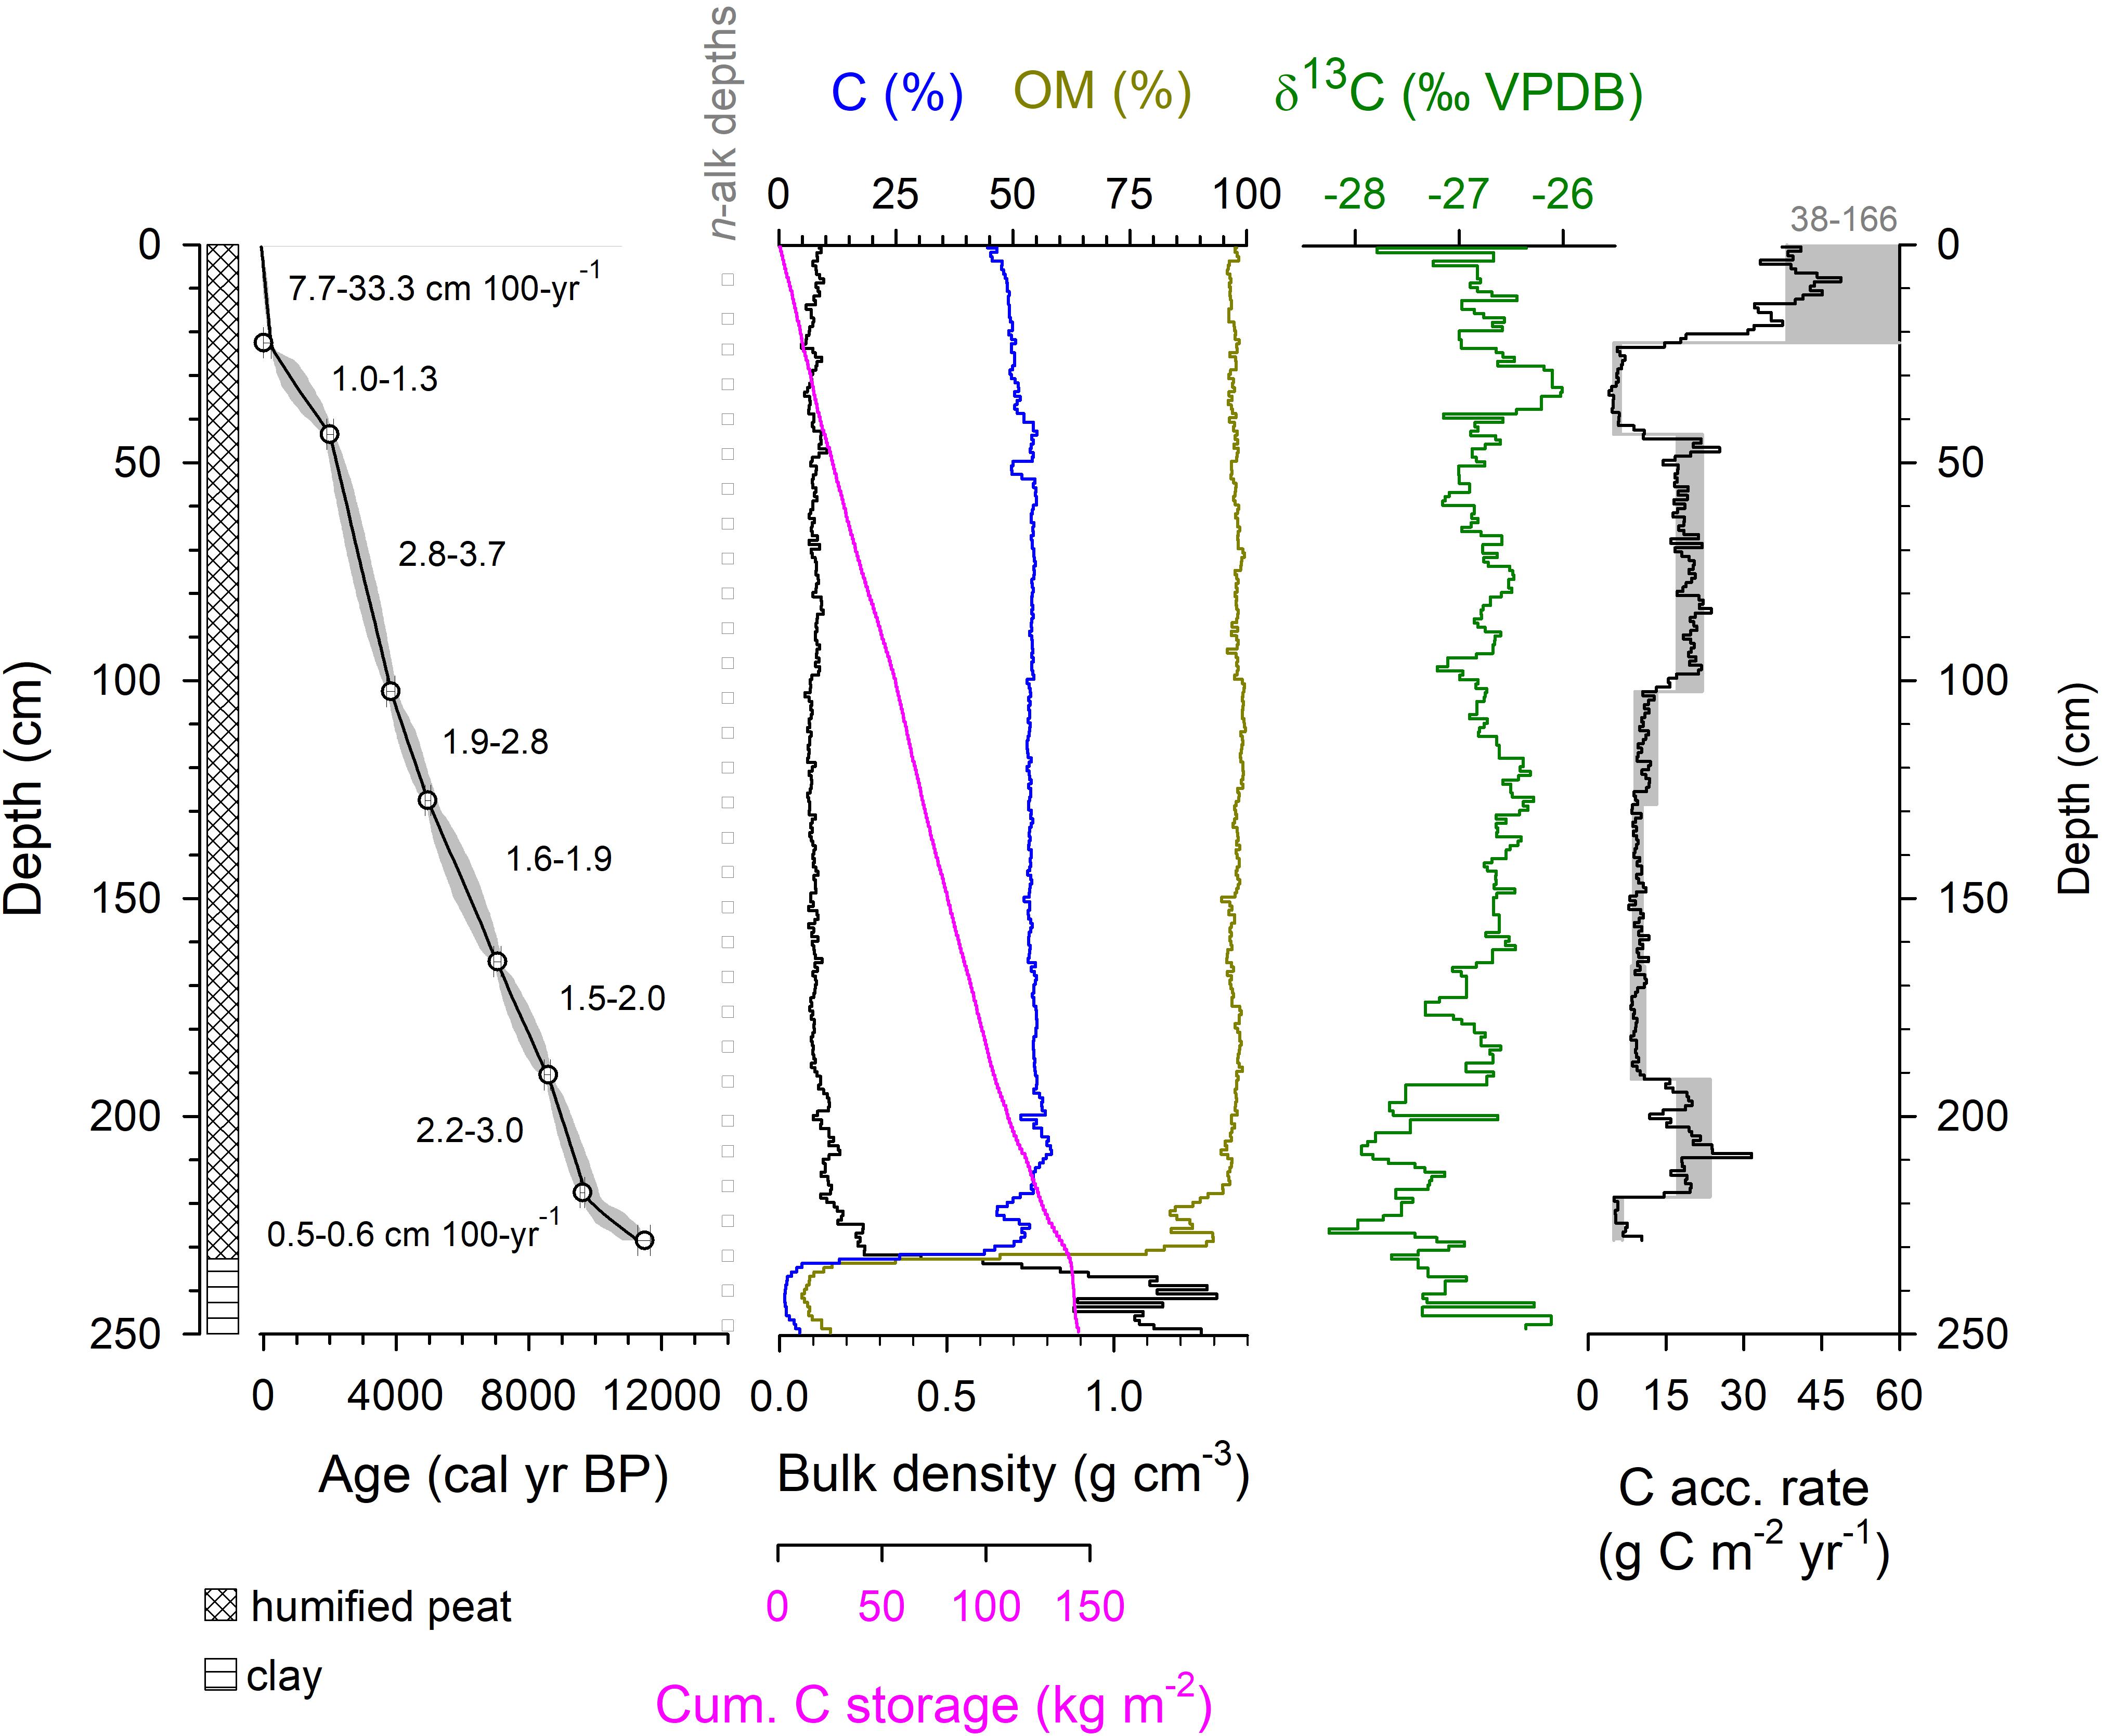
Figure 2. Physical and carbon characteristics of bulk peat from core PEP1. The apparent carbon accumulation rate is calculated two ways: using the BACON-derived weighted average age of each contiguous 1-cm mid-point (black line) and using a linear interpolation between the minimum and maximum age of the 2-sigma calibrated range of each dated level (gray shading). Radiocarbon dates are provided in Supplementary Table S1.
n-Alkane Distributions in Peat and Leaf Tissue
The relative abundance of n-alkane chain lengths (C15–C37) were quantified for both peat samples and modern plant samples from Pēpē‘ōpae. The ACL of peat samples ranged from 26.4 to 30.4 with a median of 27.9 (Figure 3). In the modern leaf tissue samples, ACL ranged from 24.2 to 32.0 (Supplementary Table S2). Duplicate collection and measurement of plants from two areas of the study site showed that within-species variation was less typically than between species (Supplementary Table S2), although within-species variation was high in Plantago pachyphylla. CPI values of the peat samples (3–19) were within the range of the modern leaf values (2–24; Figure 3, Supplementary Table S2) but show an overall decreasing trend with depth. The PCA of the combined dataset of peat and leaf tissue had 56% of variation explained by the first two axes, PC1 and PC2, 41 and 15%, respectively, and axis scores for peat samples that fell within the range of leaf tissues (Figure 4). The PEP1 peat scores of PC1 are correlated linearly with ACL (p < 0.0001, R2 = 0.85). Because flowering plants produce n-alkanes in far greater amounts than other plant types (Bush and McInerney, 2013) they dominate the sedimentary signal at Pēpē‘ōpae, and we therefore do not over-interpret potential contributions of ferns, lycopods, and bryophytes based on n-alkane relative abundances.
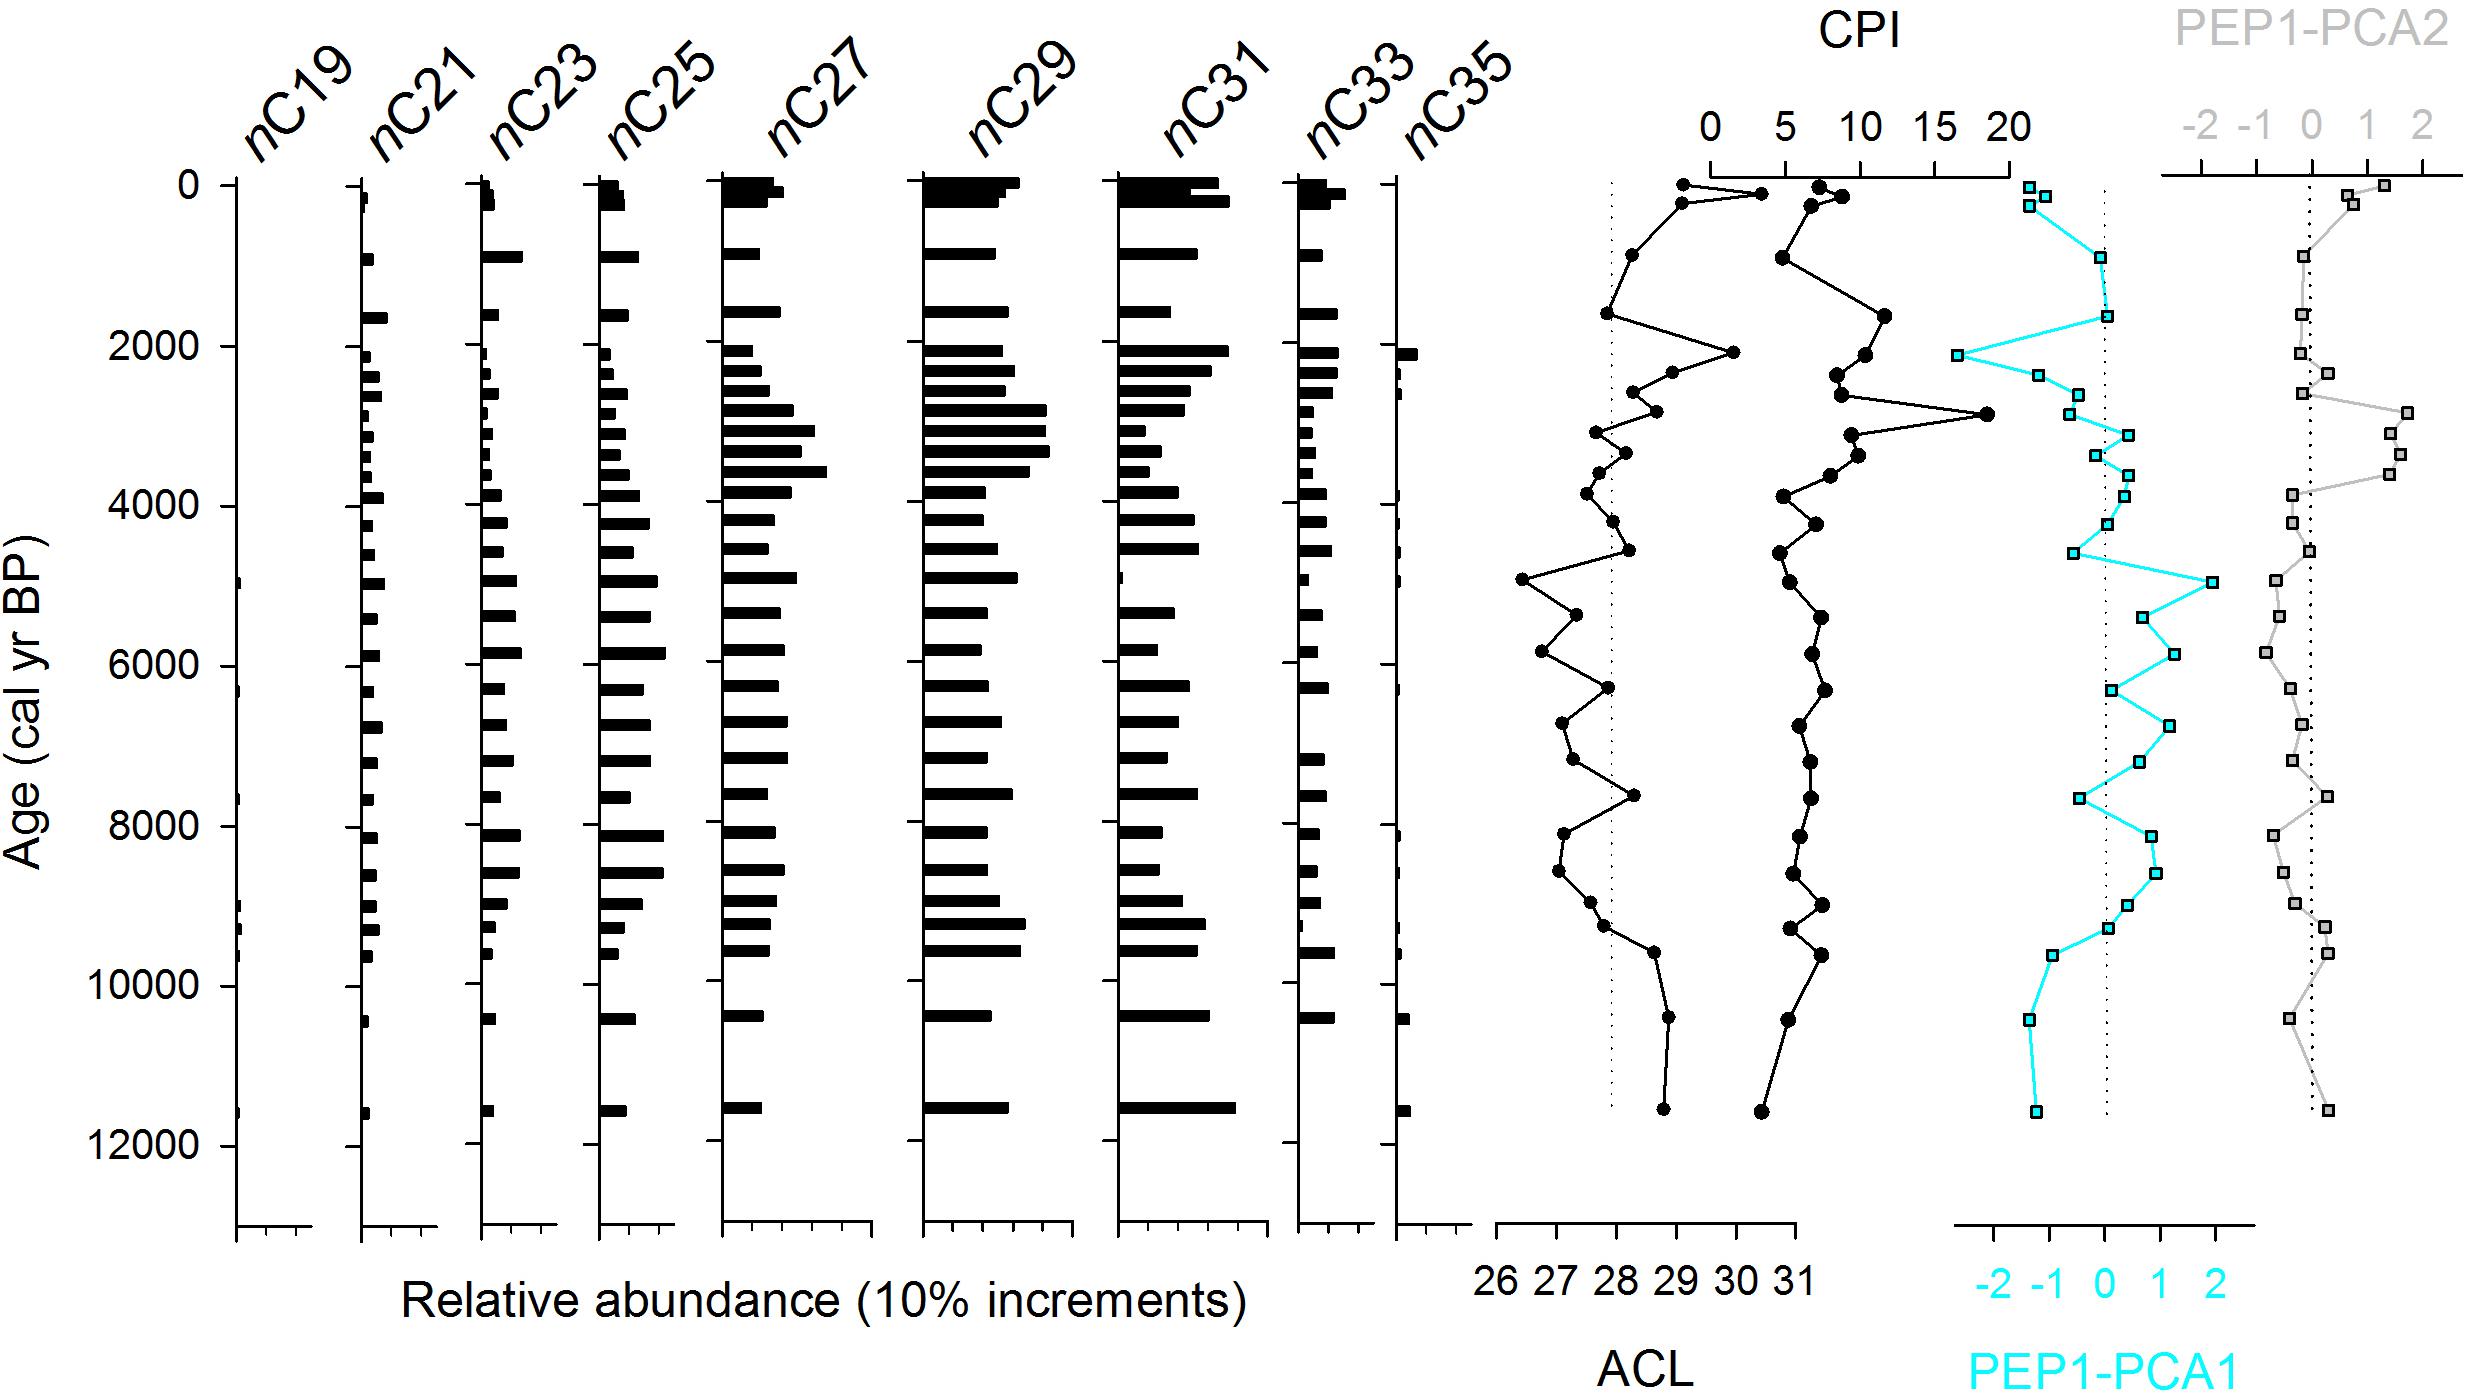
Figure 3. Relative abundance of n-alkanes in 29 peat samples from core PEP1 including index values for average chain length (ACL) and the carbon preference index (CPI). PCA scores for the first two axes of an analysis of peat and leaf tissue distributions from the study site (Figure 4) are shown.
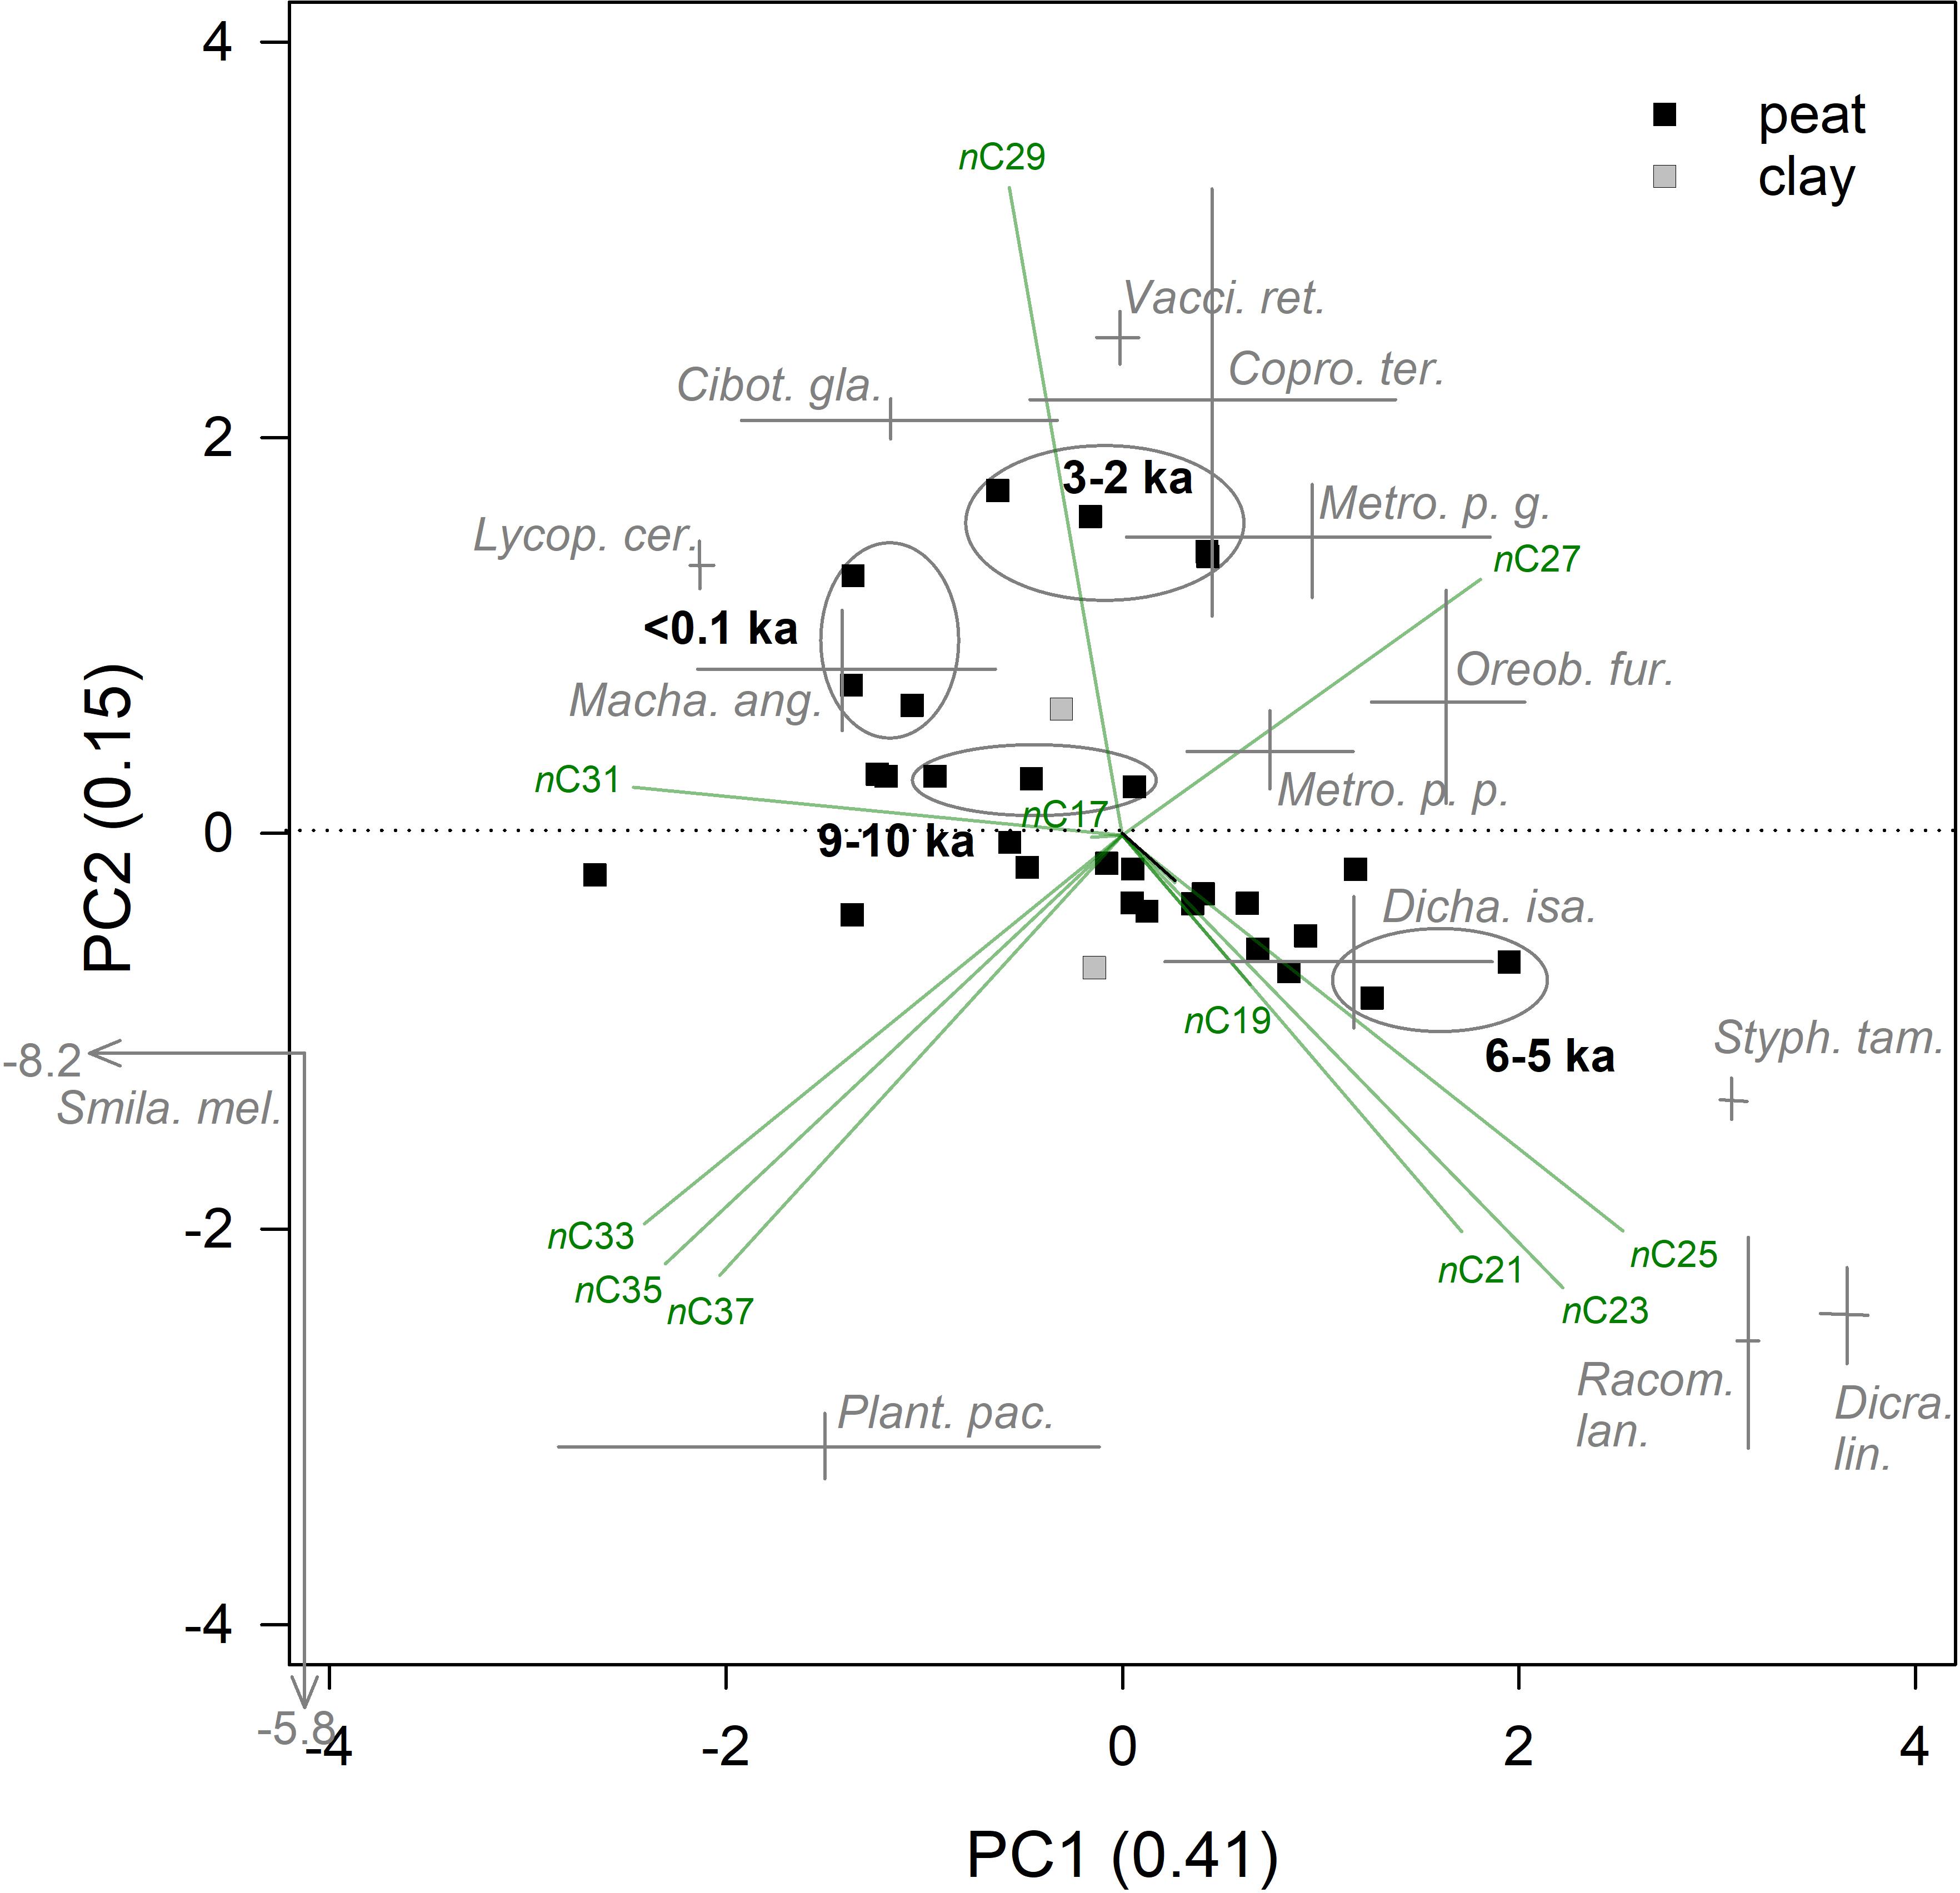
Figure 4. Principle components analysis (PCA) of n-alkane relative abundances in sedimentary samples from core PEP1 and modern plant leaf tissue at Pēpē‘ōpae explained 41 and 15% of the variance on PC1 and PC2, respectively. Scores for sedimentary samples (squares) show peat (solid, n = 29) or underlying clay (filled, n = 2). Ellipses show the region in biplot space of important periods in the mutli-proxy record (ka = thousands of years before present). Modern leaf tissue scores for dominant plant species at the study site (n = 14, Supplementary Table S2) are shown where the height and length of the crosses span the axis scores of duplicate composited plant collections.
Hydrogen Stable Isotope Values in Sedimentary n-Alkanes and Waters
Median values of δ2H measured in the abundant C29 n-alkane in Holocene peat samples (>80% OM) ranged 26‰ from -164 to -202‰ VSMOW (Figure 5). Average values in the underlying clay layer were 44‰ more enriched than the mean Holocene peat value. The most depleted sedimentary n-alkane δ2H values were observed ∼9.3 and ∼3.1 ka. A trend of overall increasing enrichment beginning around 9.3 ka reached a maximum value at 5 ka. To reconstruct the δ2H value of peatland waters from sedimentary n-alkane values, we used values of apparent fractionation (𝜀l/w) between modeled precipitation δ2H values (Bowen and Revenaugh, 2003) and observed leaf wax values of tropical angiosperms between 30°S and 30°N in the database compiled by Sasche et al. (2012). No difference was observed between means of 𝜀l/w(± SD) for tropical dicots (-137 ± 30, n = 21) and monocots (-137 ± 19, n = 4), therefore we used a single value for 𝜀l/w(-137 ± 28) for all vascular plant types in this study. Reconstructed peatland water δ2H values were between -22 and -48‰. The δ2H value of rainwater collected at Pēpē‘ōpae was –8.6 to –15.6‰ (n = 4) which is within the range of values estimated by the OIPC (Bowen, 2018) for this location (-8 to -36‰) and those reported by Scholl et al. (2002) for windward East Maui (-7 to -22‰ VSMOW).
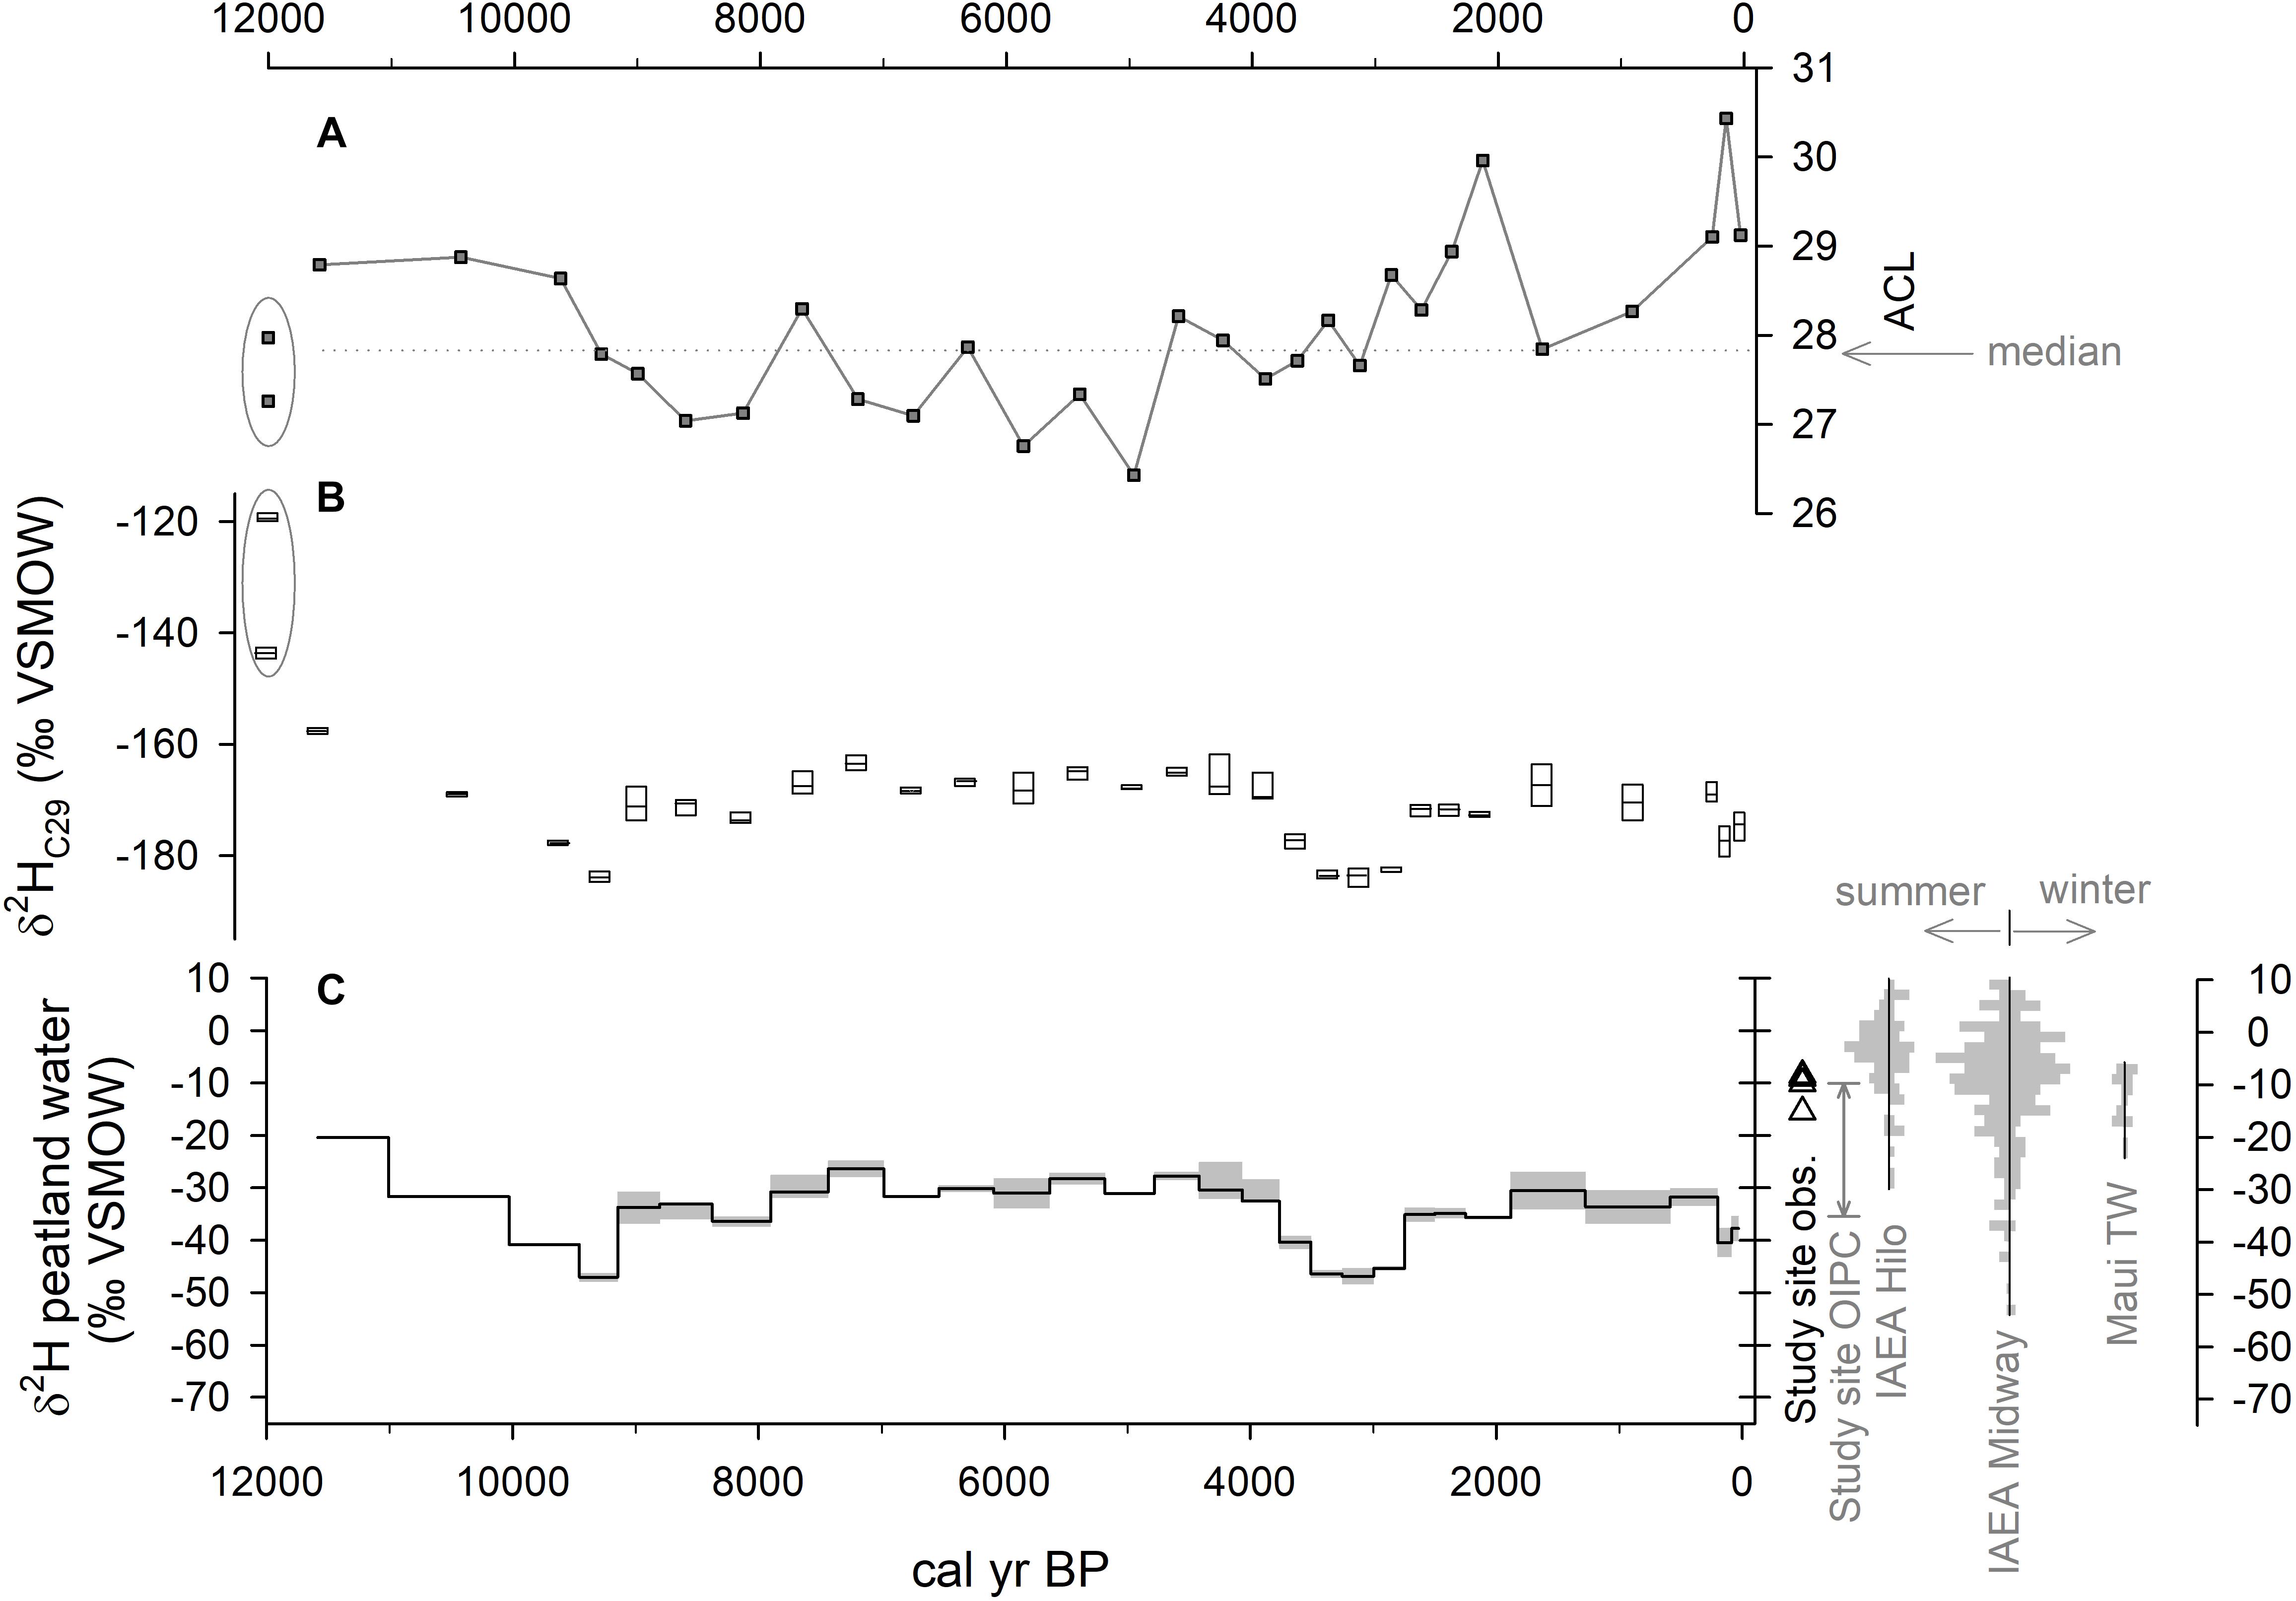
Figure 5. Values for ACL, δ2H of sedimentary leaf waxes, and reconstructed peatland water δ2H in core PEP1. (A) ACL values. (B) δ2H of nC29 where boxes are the interquartile range and horizontal lines show the median. (C) Reconstructed plant-available peatland water δ2H values. Shown to the right are direct measurements of rainwater (triangles) as well as the seasonal range of modeled values for the study site from the online isotopes in precipitation calculator (OIPC). Also shown are distributions of seasonal IAEA monthly observations of δ2H for Hilo and Midway (IAEA/WMO, 2018; Figure 1), and for windward East Maui (Scholl et al., 2002), where winter is November–April.
Forest Pollen
At the study site, dominant pollen types were present throughout the profile (Supplementary Table S3), showing that rainforest vegetation characterized by Metrosideros and Cibotium has been present throughout the Holocene, albeit with substantial shifts in abundance, and including changes in dry-adapted vegetation upwind (Selling, 1948). The two-dimensional NMDS had a final stress of 11.6 and scores for OHS-1948-01 pollen assemblages that fall within the range of scores from the other sites, showing an overall representativeness of upwind valley vegetation on East Moloka‘i relative to similar elevations (1300–1700 m) on West Maui, but with some noteable differences. For example, the East Moloka‘i Holocene pollen spectra is dominated more by Metrosideros and nearly absent is Acacia compared to rainforests on Pu‘u Kukui (Figure 6). We developed a chronology for OSH1948-01, which was published before the development of radiocarbon dating, by assuming a common basal age with our core (Supplementary Table S1), an estimate for the uppermost OSH1948-01 sample at 25 cm (collected in 1938) based on the rate of near-surface accumulation in our core, and matching independent changes in total pollen abundance OHS1948-01 (Supplementary Table S4) with changes in sedimentation rate in PEP1. This approach assumes the rate of microfossil influx to the surface is relatively consistent on multi-centennial scales, and that the dominant influence on concentration is the rate of peat accumulation, i.e., the effect of microfossil concentration/dilution driven by the balance of plant production vs. OM decomposition. Specifically, the timing of two carbon accumulation minima in PEP1 were assigned to two pollen concentration maxima at 265 and 50 cm in OHS1948-01. An age-depth model was derived in BACON 2.3.4 (Blaauw and Christen, 2018) from these four temporal tie-points and a prescribed age uncertainty of ±100 year, and the ages of the mid-points of each sampled pollen depth is given in Supplementary Table S4. Drier pollen types were most abundant, and Wetness Index values were at their lowest, from 12–11, ∼5.5, and ∼1.5 ka (Figure 7).
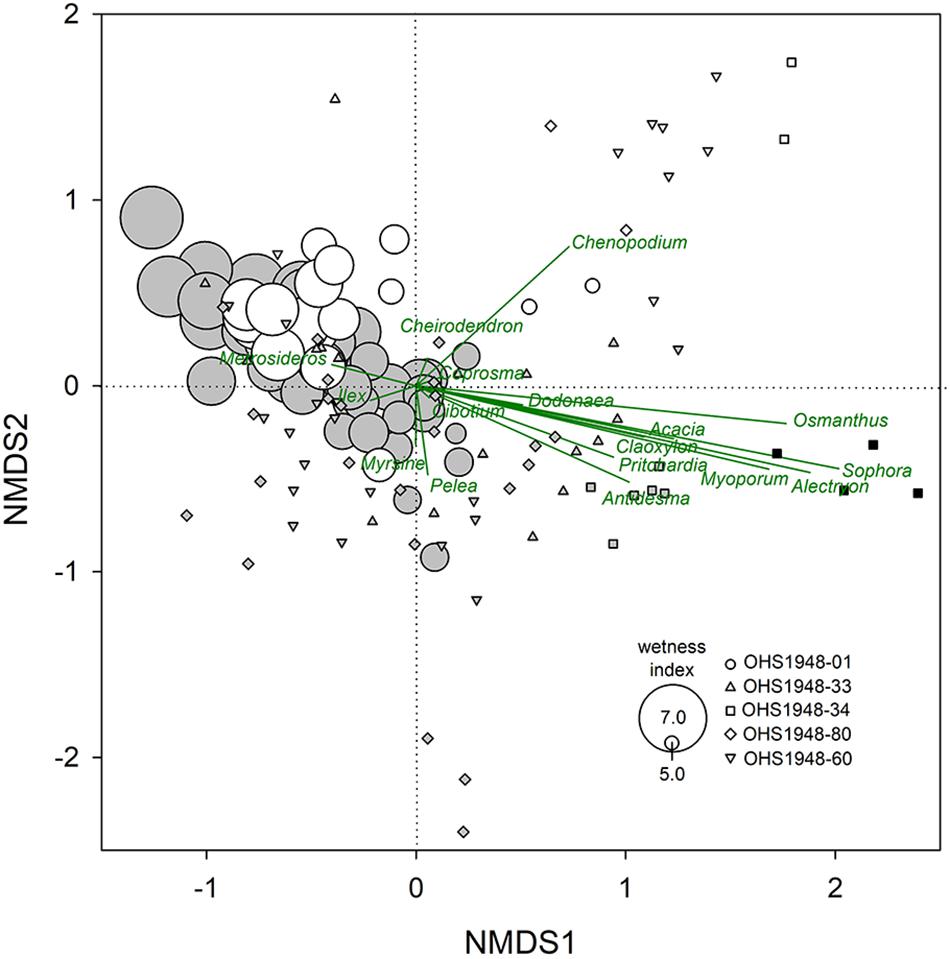
Figure 6. Non-metric multidimensional scaling (NMDS) ordination of fossil pollen abundance from five sites in Maui Nui (Selling, 1948). Pēpē‘ōpae (1262 m elevation) axis scores shown with symbol size scaled to values of the pollen Wetness Index (Supplementary Table S3, see section “Materials and Methods”) and four sites from East Maui (Figure 1) near the summit (1703 m; OHS1948-33 and -34), a mid-elevation site (OHS1948-80), and a lowest bog (1390 m; OHS1948-60). Shading shows Selling (1948) original pollen Periods; the oldest Period 1 (black) drier vegetation with rain forest restricted, Period 2 (gray) with rain forest extended, and the youngest Period 3 (white) with drier vegetation.
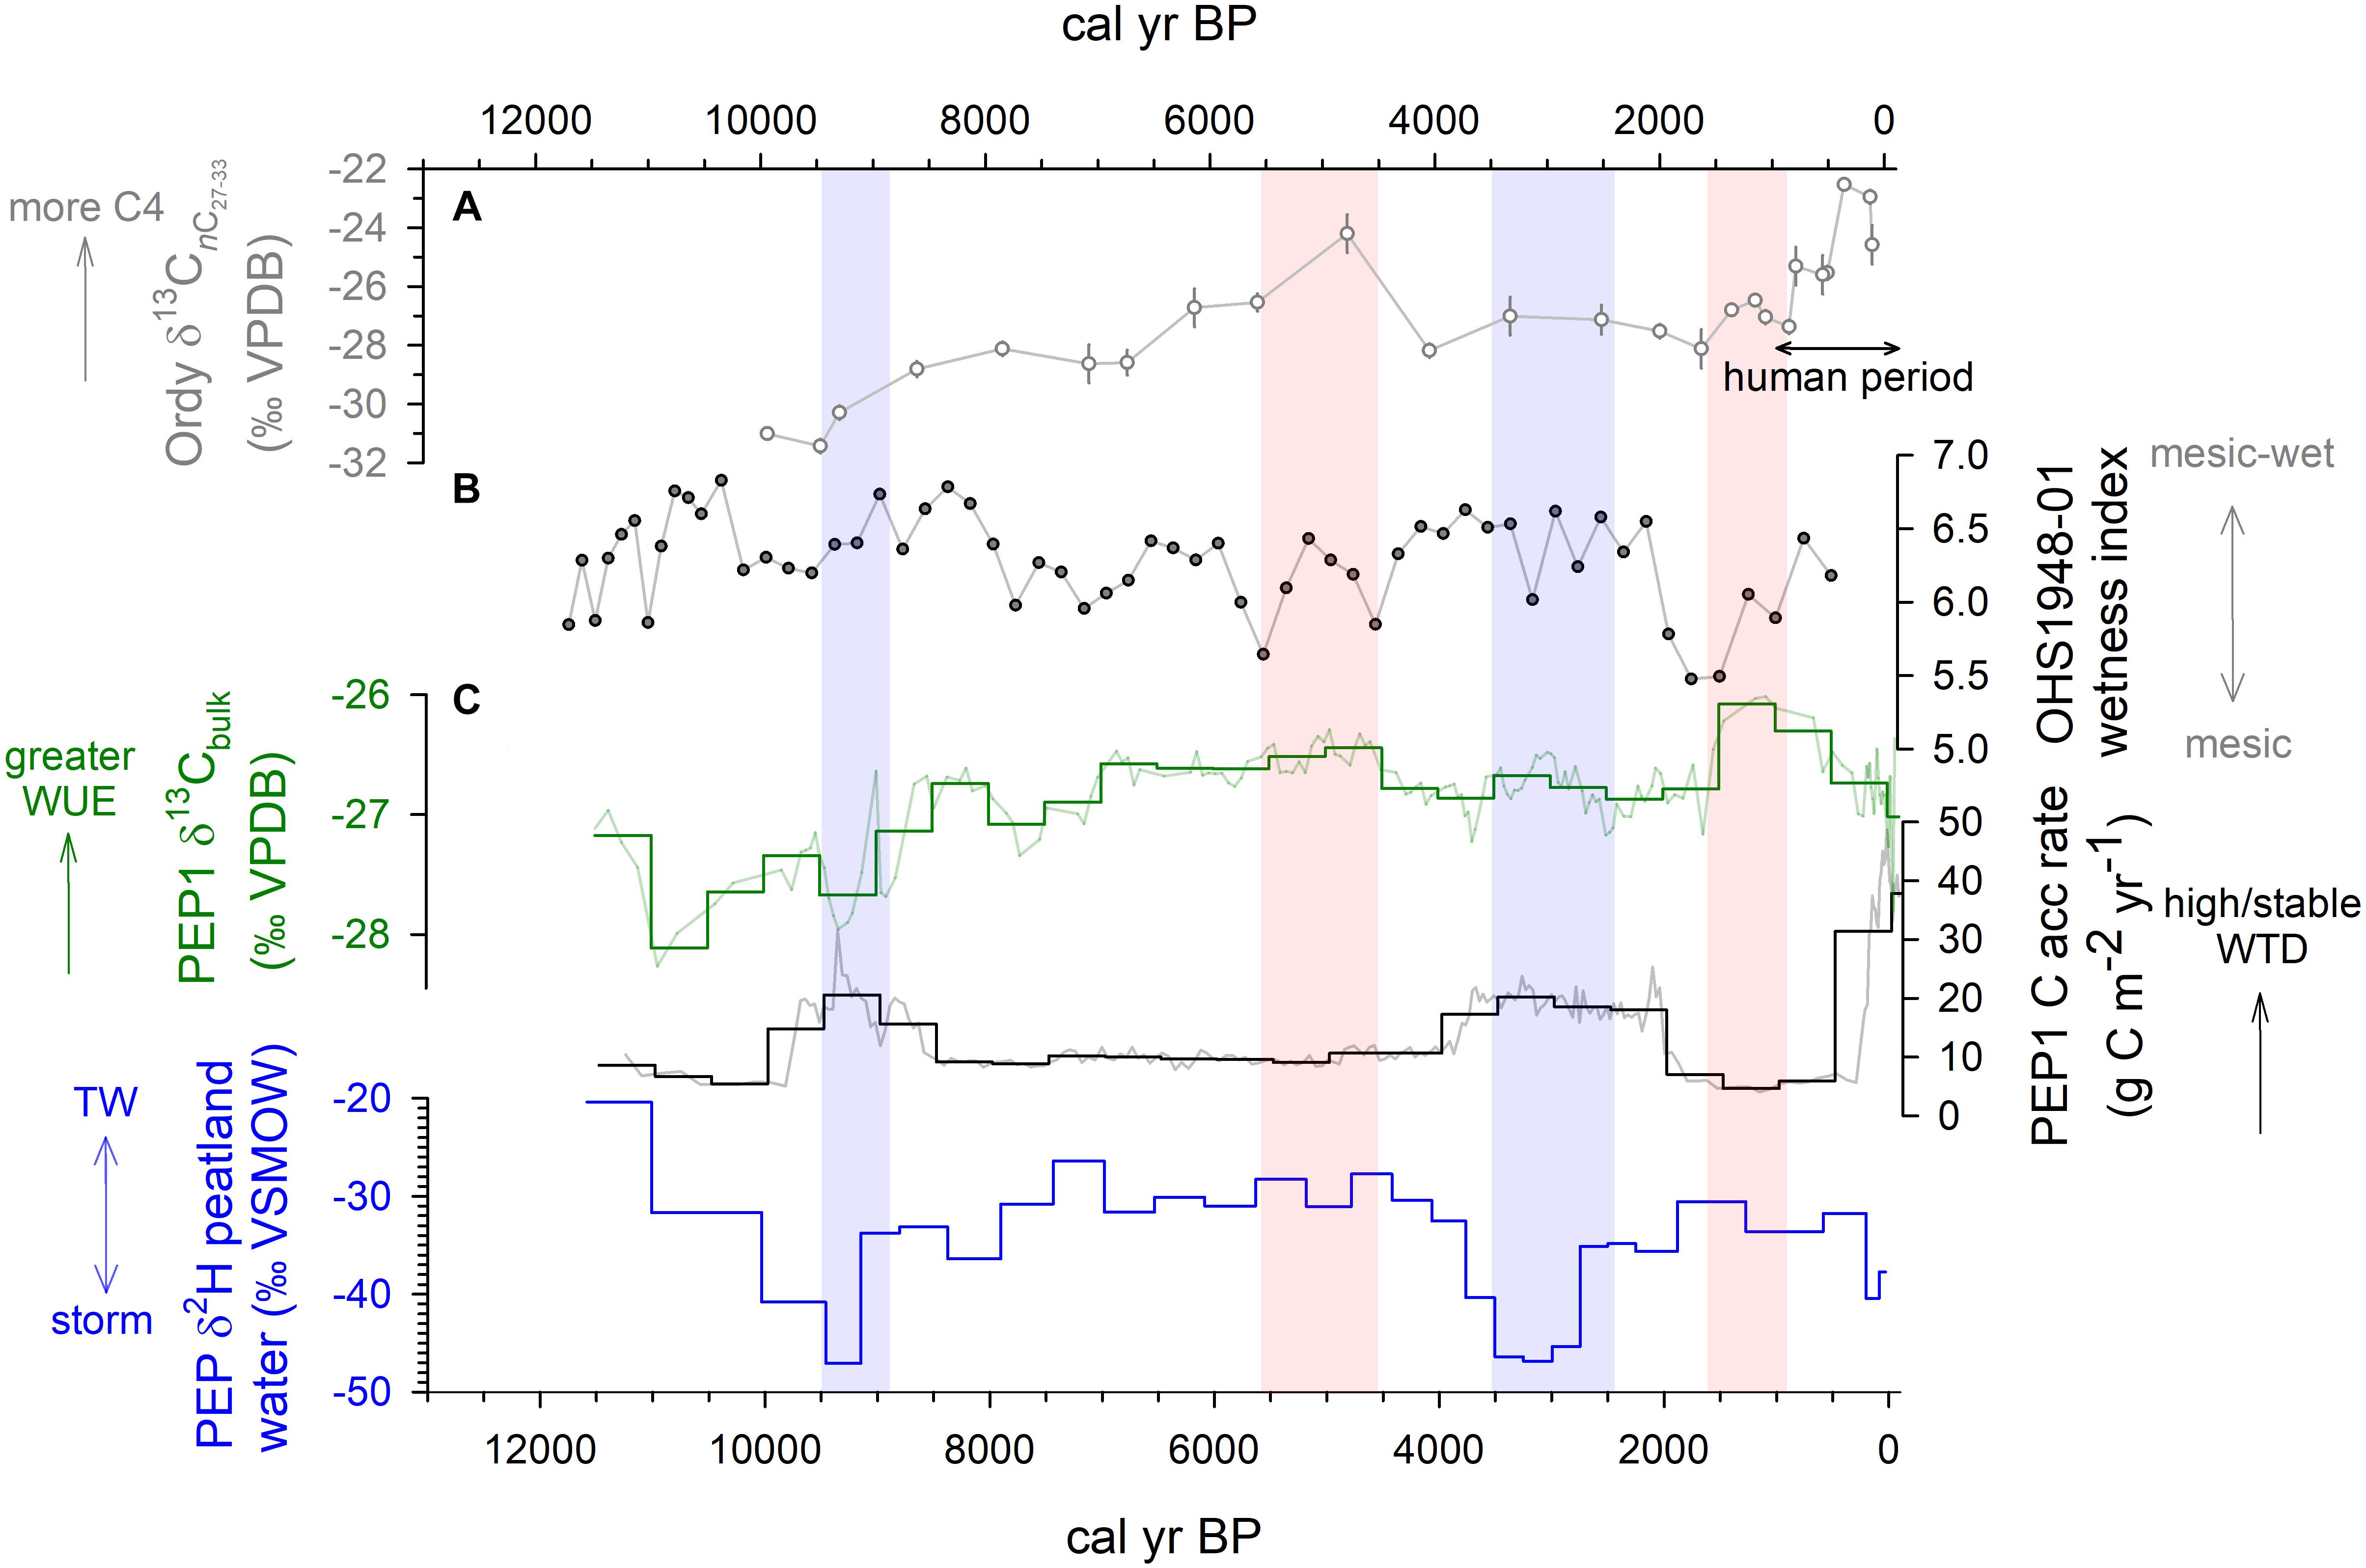
Figure 7. Comparison of hydroclimate changes at Pēpē‘ōpae and East Moloka‘i and aridity changes on the leeward coastal plain of Oahu (Figure 1). (A) Variation in reconstructed abundance of C4-photosynthesis plants in sediments of Ordy Pond, leeward O‘ahu (Uchikawa et al., 2010). (B) A Wetness Index derived from fossil pollen in core OHS1948-01 (Selling, 1948) reflecting vegetation and habitat wetness in upwind valleys on east Moloka‘i. (C) Data from core PEP1, including δ13Cbulk shown as raw data and as mean values in 500-year bins, the rate of C accumulation shown in 500-year bins, and the reconstructed δ2H values of plant-available water (Figure 5). Hydroclimate proxy interpretations include increases in C3-plant water use efficiency (WUE), the stability of wetland water table depth (WTD), changes in the contribution from storm-derived vs. tradewind (TW) rain, and wetter periods (blue shading) and drier periods (red shading).
Discussion
Carbon Accumulation and Holocene Hydroclimate
Carbon accumulation at Pēpē‘ōpae increased rapidly around 10 ka and continued without hiatus but with faster and slower periods until the present (Figures 2, 7). The long-term capacity for this low-latitude peatland ecosystem to sequester carbon belowground is substantial (144 kg C m-2 total; 56 kg C m-2 to 1 m depth) compared to soil organic carbon storage in native mesic-wet forests in Hawai‘i generally (18.7 kg C m-2 on average; Selments et al., 2017). Plant growth in tropical wetlands can be rapid, with NPP values between 560 and 2438 g C m-2 year-1 (Sjögersten et al., 2014; sites with organic soils). Yet, mean Holocene tropical peat carbon accumulation rates are broadly similar to their cold region counterparts (∼5–60 g C m-2 year-1; Yu et al., 2010) despite cold peatlands having substantially lower NPP. Anaerobic conditions below the water table are a key factor stabilizing peat OM (Clymo, 1984) although chemical recalcitrance may be important (Hodgkins et al., 2018), and in Hawai‘i wet forest environments depress decomposition overall relative to drier conditions (Schuur, 2001). However, the rate of near-surface OM decomposition can be high in tropical peatlands (Chimner, 2004) when conditions promote soil carbon loss, i.e., when water tables are lowered (Kurnianto et al., 2015). In this way, we interpret changes in long-term carbon accumulation rate to reflect shifts in water table position and stability, with faster rates showing higher, stable water tables that promote the stabilization and sequestration of OM, and slower rates showing lower or variable water table conditions.
Multiple lines of evidence suggest wet conditions in Hawai‘i around 10–9 and 3 ka BP. At Pēpē‘ōpae, a carbon accumulation maximum around 9 ka occurs contemporaneously with an increase in the pollen-derived Wetness Index (Figure 7). The bulk δ13C values during this period are more negative than any other time after 10 ka. Because plants that use the C3 photosynthetic pathway dominate higher mountain elevations in Hawai‘i (Rundel, 1980; Edwards and Still, 2008) and all of the dominant plants at the site today are C3 (Supplementary Table S2), negative δ13C departures are consistent with more-frequently open stomata in vascular plant leaves and lower water use efficiency during wet conditions. On the Island of O‘ahu, a pulse of wetter-than-present vegetation between 9 and 11 14C kyr BP in the Ka‘au Crater pollen record is reported by Hotchkiss and Juvik (1999). Around Kalaeloa on the leeward plain of O‘ahu, Uchikawa et al. (2010) suggest that the proportion of C4 plants was at its Holocene minimum around this time. During the late Holocene, an increase in carbon accumulation at Pēpē‘ōpae suggests wet conditions around 3.5–2 ka. This time period includes departures in the peat δ13C values toward more negative values (Figures 2, 7). On East Maui, the well-dated Holocene lake sediments from Wai‘ānapanapa, show an abrupt increase in sedimentation rate at 3.2 ka (Crausbay et al., 2014) and the initiation of high-OM peat formation at Flat Top Bog by 2.3 ka (Burney et al., 1995).
Prolonged drier conditions lasting centuries have occurred at Pēpē‘ōpae. The carbon accumulation rate was overall low between 8.5 and 4.5 ka. During this time, values of peat δ13C increased and reached least-negative values around 5 ka, and the pollen Wetness Index decreased (Figure 7). This pattern matches the aridification of leeward O‘ahu over this same period, argued by Uchikawa et al. (2010) to be associated with the warming of eastern equatorial Pacific (EEP) Ocean waters, extended upper level westerly jet, fewer extratropical storms entering the Hawaiian sector, and thus diminished winter rainfall. Drying may have been widespread across the north-central Pacific region, as pond sediments on Laysan Island (Figure 1) also show a decrease in palm (Pritchardia) pollen around 5 ka (Athens et al., 2007), consistent with the “El Niño-like” response pattern in connection with the EEP positive SST anomalies. The apparent carbon accumulation rate at Pēpē‘ōpae reached a Holocene minimum around 1.5–1 ka (Figure 7), which is a strong signal given its relatively young position in the upper part of the profile and far less time for decomposition than deeper levels of OM. Peat δ13C values reach a maximum at this time consistent with greater water use efficiency of vascular plants under drier conditions and lower mountain humidity. Dry pollen types in OHS1948-01 (Dodonea and Chenopodium; Figure 6) increase in abundance around 1.5 ka that drive the Wetness Index to its Holocene minimum at this time (Figure 7). Thus, East Moloka‘i experienced relatively dry Holocene conditions just before and during the earliest period of arrival of Polynesian settlers around 1 ka (Wilmshurst et al., 2011; Dye, 2015).
Vegetation Change Evident in Geochemistry and Pollen
The few studies of montane peatland vegetation in Hawai‘i describe peat derived from sedge litter, e.g., Oreobolus peat (Selling, 1948; Carlquist, 1970). However, the fossil leaf wax ACL in core PEP1 varied substantially from 26.4 to 30.4 (Figure 3) compared to the ACL of Oreobolus furcatus was 26.3–27.0. This variation in peat ACL suggests changes in contributions from various litter types rather than dominance by a single short-chain type such as Oreobolus. The similarity of ACL and CPI values between the modern leaf tissue and the peat samples also suggests that the leaf waxes of these plants are dominating the sedimentary n-alkanes, and that inputs from other sources like bacteria and algae biomass that have shorter chain lengths and CPI values (Bush and McInerney, 2013) are minor at Pēpē‘ōpae.
Periods of rapid carbon accumulation during wet conditions around 9 and 3 ka, have PC1 axis scores around zero (Figure 4), consistent with a mixture of plant litter types from a diverse plant community. Of these wet periods, the peat samples from the 3–2 ka period have a greater abundance of C29 and more positive PC2 scores, suggesting greater inputs from Cibotium and Vaccinium leaf tissue and more Metrosideros polymorpha var. glaberrina (Figure 4). Crausbay et al. (2014) report that glabrous-leafed M. polymorpha (var. macrophylla) abundant in wet forests of Hawai‘i have relatively long ACL (30.6 on average) compared to pubescent-leafed M. polymorpha (var. incana) growing in drier forests with shorter ACL (26.9 on average). Although the ACL values for the dwarf M. polymorpha varieties at Pēpē‘ōpae are not as clearly separated (Supplementary Table S2), the period around 3 ka may have had more glabrous ‘ōhi‘a and been wetter than 9 ka BP. During drier conditions around 5 ka, the peat has abundant C21–C25 (Figure 4) and among the shortest ACL values in the profile (Figure 3), possibly with more leaf litter from Dicranopteris ferns, Styphelia shrubs and small graminoids (Oreobolus and Dichanthelium; Figure 4). The n-alkane distributions suggest a vegetation that responded sensitively to wet vs. dry conditions with shifts in plant community abundance at Pēpē‘ōpae, and that these shifts occurred on a multi-millennial scale.
At the mountain forest scale, vegetation composition in upwind valleys (e.g., Pelekunu and Wailau) observed in the OSH1948-01 pollen shows changes in the dominance of forest community species over the Holocene. Our chronology for OSH1948-01 shows the wetter-drier transition between Selling’s (1948) Period 2 (wetter with rainforest extended) and Period 3 (drier vegetation) occurred around 4.3 ka. Selling’s oldest Period 1 (drier vegetation with rainforest restricted) is not observed at Pepeopae, and thus must have occurred before 11.5 ka, and Period 2 can be viewed to have a minimum onset age of 11.5 ka. The NMDS analysis of OHS1948 pollen shows that the East Moloka‘i and West Maui Period 2 and 3 pollen occupies generally the same ordination space. However, the East Moloka‘i forests have been dominated more by Metrosideros over the Holocene with nearly absent Acacia, consistent with modern observations of a lack of Acacia koa forest on Moloka‘i despite a suitable climate (Price et al., 2012). It is noteworthy that the overall composition of upwind forests did not dramatically change in East Moloka‘i over the last 12,000 years, but changes in abundance and shifting dominance of forest species occurred multiple times. It is noteworthy that the dry vegetation of Selling’s (1948) Period 1, evident in pollen in shallow peat at the summit of Pu‘u Kukui, was substantially different (Figure 6). Although it is not dated, it is likely a dry episode(s) during the complex glacial period in Hawaii (Anslow et al., 2010) characterized by abundant dry-adapted genera (Dodonaea and Chenopodium) clearly separated from the rest of the pollen spectra (Figure 6).
The pollen Wetness Index values follow the wet–dry trend of the OHS1948 data along the first NMDS axis (Figure 6). Because the Index values are strongly affected by variations in the percentage contribution of dry taxa as well as the large variations in Metrosideros, it is possible that the pollen reflects internal ecosystem dynamics, or a combination of ecosystem and direct climate influences. Mueller-Dombois (1986) argued that the Holocene decreases in Metrosideros pollen abundance in East Moloka‘i are driven by ecological forest dieback of like-aged cohorts. Our chronology for OHS1948-01 suggests that Metrosideros minima are separated by one or two thousand years (between 1100 and 2400 years) and do not seem truly cyclical. Although M. polymorpha trees in wet forests of Hawaii can be long-lived, e.g., Hart (2010) reports 14C ages of mature trees between 100 and 600 years old, the return interval of Metrosideros minima is substantially longer than the longest tree age, showing influence of some external factor such as climate perturbation (Boehmer et al., 2013). The Wetness Index can thus be interpreted in a hydroclimatic context.
Decreases in the pollen-derived Wetness Index tend to track increases in the ACL of PEP1 sedimentary n-alkanes (Figures 3, 7), suggesting that peatland vegetation and ecosystem processes are similarly responsive as forests to changes in rainfall in Hawai‘i. For example, the abrupt decrease in the Wetness Index around 2 ka is the period with the greatest ACL in PEP1. Peatland carbon cycling also appears to be sensitive to regional hydroclimate changes on this quasi-millennial scale, e.g., increases in the carbon accumulation rate around 9 and 3 ka. Although the apparent carbon accumulation rate is rather flat in the mid Holocene, it is possible that the dry conditions around 5 ka may have had a lowered water table for long enough that mineralization of organic carbon in deeper peat layers “erased” some of the record of previous carbon sequestration. Model experiments show that decomposition losses may be substantial in tropical peatlands when water tables drop for long periods (Kurnianto et al., 2015), and montane peatlands in Hawaii may also be sensitive to large carbon losses with drying. Sedimentary n-alkane CPI values theoretically decrease with greater microbial decomposition (Buggle et al., 2010). CPI values are low around 5 ka and are at their highest around 3 ka, consistent with increased decomposition and carbon loss during drier periods and depressed decomposition playing an important role for belowground carbon sequestration during wetter periods.
Holocene North Pacific Climate
Peat formation accelerated initially around 10 ka when wintertime insolation was generally at its minimum (Figure 7). Uchikawa et al. (2010) argued that this low top-of-atmosphere shortwave energy flux during early Holocene winter was a driver of cooler SST in the equatorial Pacific that weakened the Hadley circulation and diminished subtropical subsidence. The data from Pēpē‘ōpae show the period between 10 and 8.5 ka was particularly wet and includes reconstructed peatland water δ2H values that are relatively depleted (Figure 5). Monthly rain δ2H values from sites at sea level at Midway Atoll and Hilo (Figure 1) in the Global Network of Isotopes in Precipitation (GNIP) database (IAEA/WMO, 2018) and at higher elevations (229–1295 m) on trade-wind-affected windward East Maui (Scholl et al., 2002) do not exhibit a strong seasonal pattern (Figure 5C). However, storm rain δ2H values has been observed to be depleted relative to trade-wind rain in Hawai‘i (Scholl et al., 1996), and thus storms may have increased during the period around 9 ka and been a driver of rapid peat accumulation. An enhanced temperature gradient between tropical and extratropical latitudes during the early Holocene, caused by larger negative temperature anomalies in the polar latitudes owing in part to remnant ice sheets, further suggests that storm activity and atmospheric heat transport from the subtropics to the high latitudes was enhanced. However, at Pēpē‘ōpae the peat layer would have been relatively thin at this time, suggesting that summer (dry) season rainfall was also sufficient to maintain saturated soil conditions year-round in the absence of a thicker peat layer of low hydraulic conductivity that can buffer OM decomposition from summer drought conditions. Shifts in the ITCZ position in response to orbital forcing could have played a role for the overall water table balance during the Holocene (McGee et al., 2014; Reimi and Marcantonio, 2016).
A trend of aridification during the early Holocene has been observed in multiple proxy records in Hawai‘i (e.g., Gavenda, 1992; Hotchkiss and Juvik, 1999). In our record from Pēpē‘ōpae, the overall drying from 9 to 4.5 ka follows this trend where δ13C is least negative, accumulation rates are diminished, and the Wetness Index is lowest at 5.5–4.5 ka (Figure 7). Uchikawa et al. (2010) argued this drying in Hawai‘i was primarily a response to eastern tropical Pacific Ocean SST anomalies, resembling the present-day ENSO teleconnection mode. In that mechanism the anomalous warming in the eastern tropical Pacific (relative to the Pacific average SST trend) drives an atmospheric circulation response similar to that observed during the El Niño events in modern times.
Our interpretation of the general drying at Pēpē‘ōpae is in that sense consistent with the previous model-based mechanisms (Uchikawa et al., 2010). In addition, we find new evidence for a trend toward isotopically heavier precipitation from the early to mid Holocene. The values of reconstructed peatland water δ2H values in PEP1 reach peak enrichment during this interval (Figures 5, 7). In modern-day climate, extratropical winter storms (Kona Lows and frontal systems) contribute isotopically depleted precipitation during the cold season, compared with the prevailing trade-wind induced precipitation (Scholl et al., 1996). Our data suggest the mid Holocene was most likely an era with decreased extratropical storm activity near the Hawaiian Islands. In modern times this is an analog to El Niño events (Chu and Chen, 2005; Elison Timm et al., 2011) and relates to circulation in the upper troposphere.
The position and strength of the upper level jet stream controls the path of synoptic storm systems across the Pacific. During El Niño years, a more intense and zonally extended jet north of Hawai‘i steers storm systems and their fronts from the dateline toward the North American continent. Adopting this modern analog to the early to mid-Holocene trend depicts a relatively consistent picture. A positive eastern tropical Pacific SST anomaly trend induces a strengthening and eastward extension of the upper level jet, a more organized west to east propagation of synoptic storm systems, and with that fewer extratropical storms and fronts have the opportunity to develop rain-producing disturbances over Hawai‘i. Further support comes from Risi et al. (2012); winter months with the most 2H-enriched rain (the top three Januaries) over Moloka‘i have a sea level pressure pattern characterized by a large and deep low-pressure center in the eastern North Pacific (Figure 8). Such pressure anomalies are tightly connected with an extension of the upper level westerly wind jets (Linkin and Nigam, 2008).
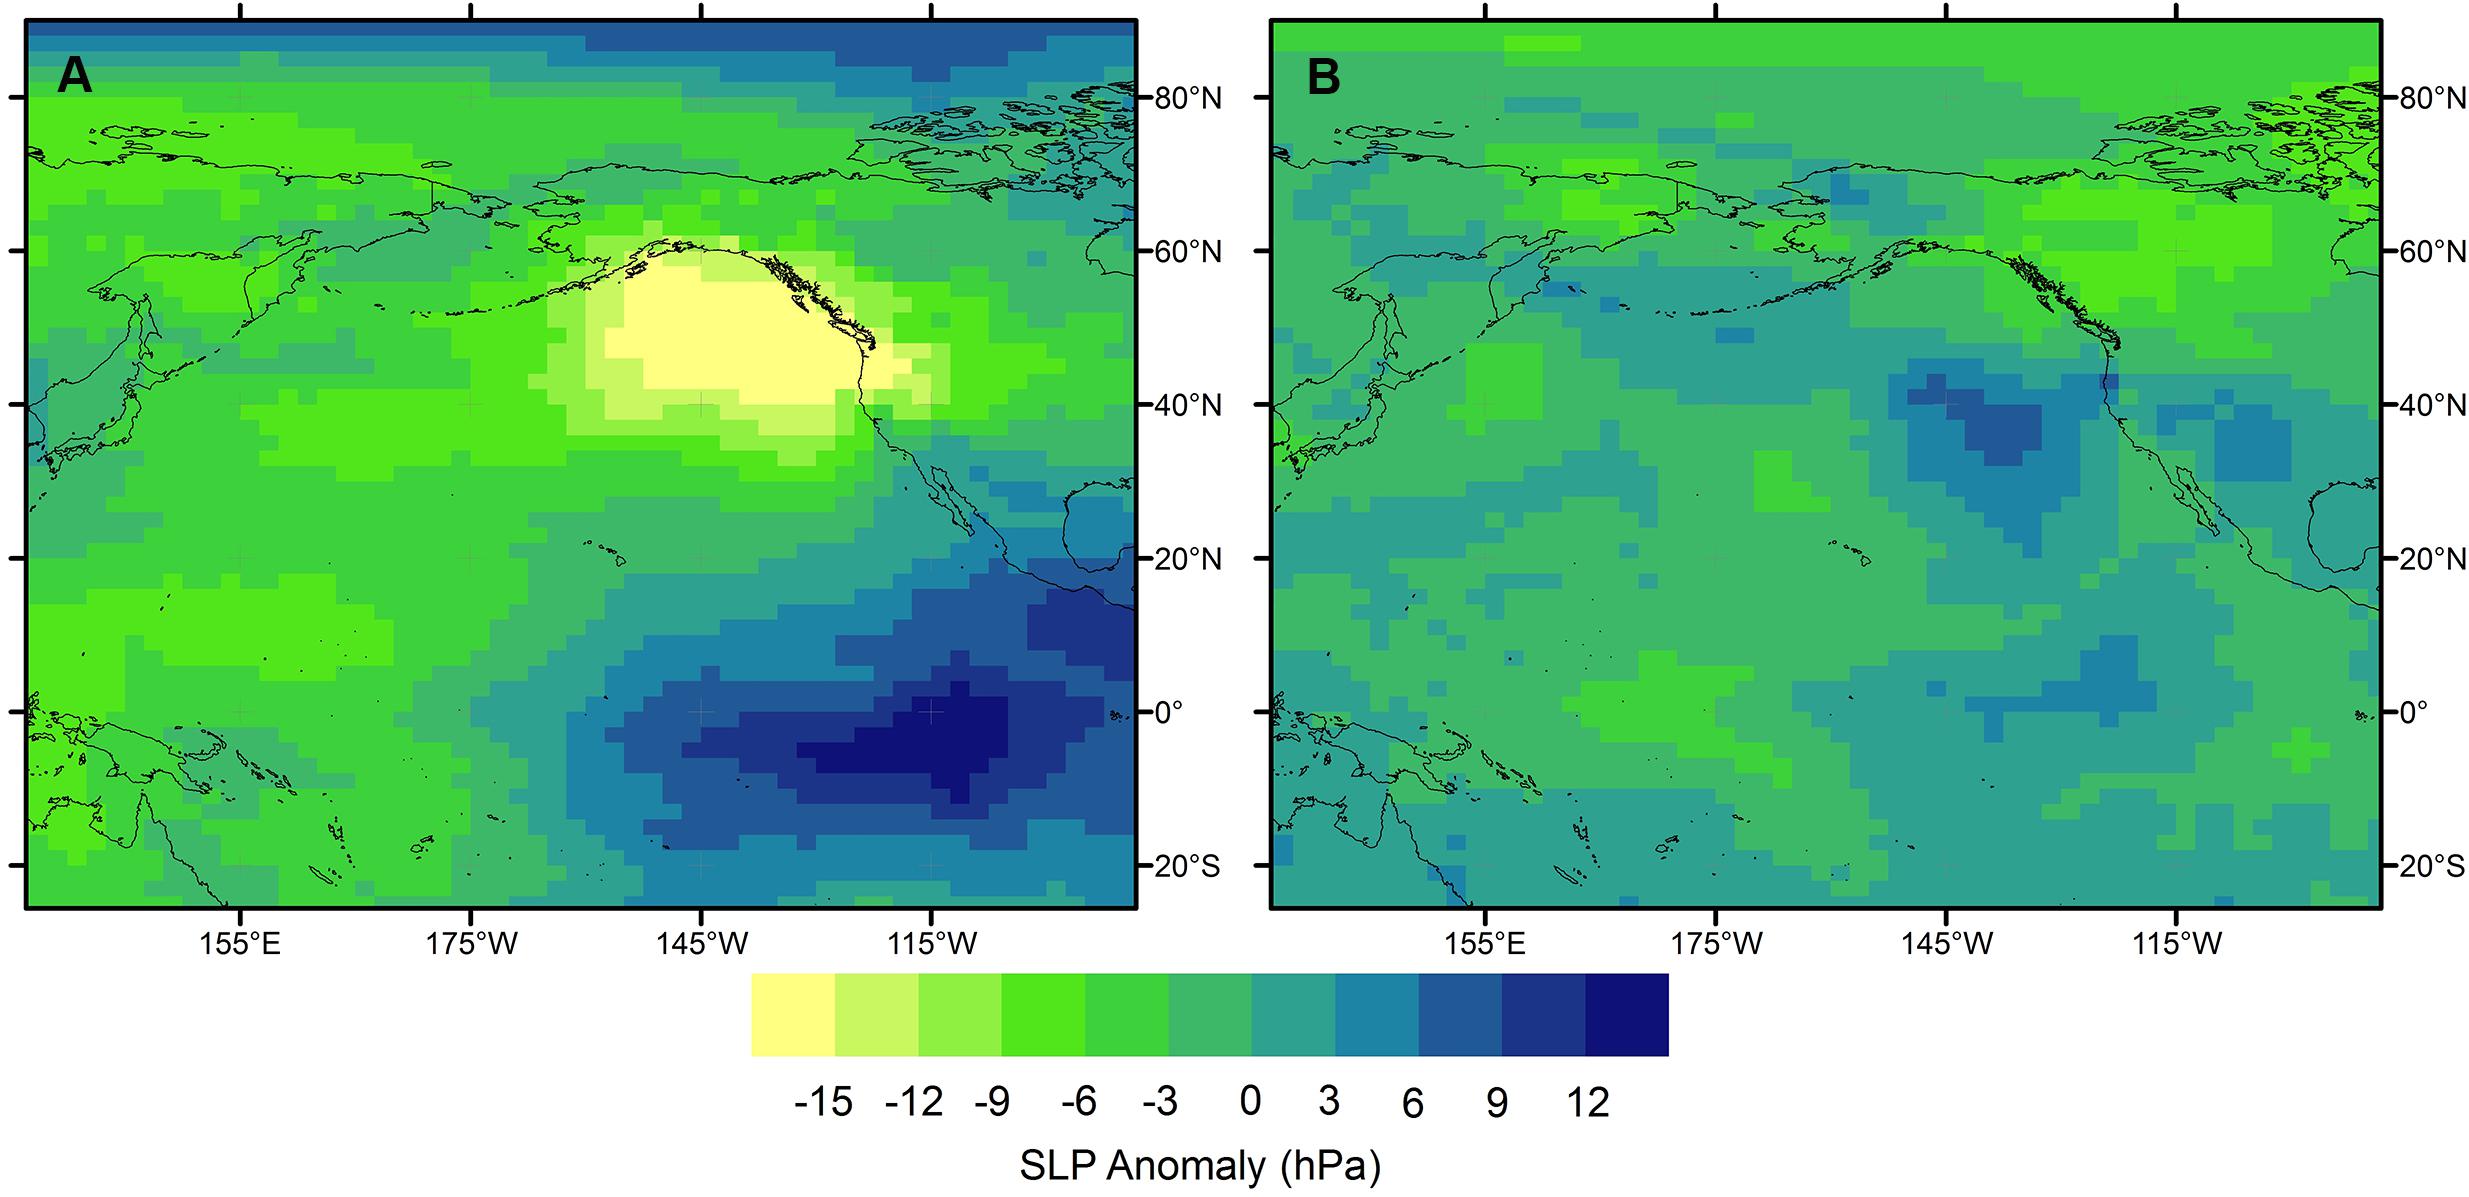
Figure 8. Sea level pressure (SLP) anomalies in the North Pacific region averaged for the three January periods with the most enriched (A) and most depleted (B) δ2H values of rainfall for the grid box spanning the islands of Maui Nui (Risi et al., 2012).
It is noteworthy that, relative to leeward coastal proxy sites, the wet windward location of Pēpē‘ōpae can experience topographically induced trade-wind precipitation in all months, which can contribute substantially to annual totals. Therefore, the trends found in the isotopic proxy time series at Pēpē‘ōpae could also reflect changes in the warm season (May–September). Although no seasonal differences are detectable in modern rainfall (Figure 5C) the warm season precipitation regime during the Holocene is less well understood. Interactions between tropical Pacific zonal SST gradients and interhemispheric tropical SST gradients affect not only the position of the Intertropical Convergence Zone in terms of shifts in the latitude position (Donohoe et al., 2013; McGee et al., 2014) but also the strength of the Hadley Cell circulation and potentially the meridional width of the Hadley circulation. All these factors could affect precipitation in Hawai‘i during the warm season and thus play an important role in the hydroclimatic changes during the Holocene.
Our new data show that early Holocene aridification at Pēpē‘ōpae was interrupted by wet conditions around 3 ka. It has been argued that the dominant climate forcing mechanism in the Pacific since about 4 ka has switched from external influence of insolation to internal influence by ENSO and PDO-like modes of circulation (Conroy et al., 2008; Anderson et al., 2016). Reconstructed peatland water δ2H values decrease by more than 30‰ and reach a minimum around 3 ka (Figure 7), reflecting a shift toward more isotopically depleted extratropical/subtropical storms at the study site (Scholl et al., 1996). In the Risi et al. (2012) data set, cold months with the most 2H-depleted rain (the bottom three Januaries) over Moloka‘i show higher pressure to the northeast (Figure 8). The high pressure anomaly indicates an atmospheric pattern that can enhance storm activity west of the ridge. The decreased peatland water δ2H values during the period around 3 ka suggest that wintertime North Pacific circulation shifted toward a retracted upper level westerly wind jet that enabled more frequent intrusion of extratropical storm activity into the central subtropical Pacific (Seager et al., 2010). Alternative mechanisms should be also considered, and ideally supported by model simulations, in the interpretation of these millennial scale regional signals, e.g., changes in the Hadley cell or Walker circulation impacts on summer precipitation. Finding ways to disentangle winter and summer precipitation signals from multivariate proxy data is a worthwhile goal for future research projects.
Hydroclimatic conditions at Pēpē‘ōpae are generally drier after 2 ka. Reconstructed peatland water δ2H values suggest tradewind-dominated rainfall, similar to rainfall values at the site today. The millennium preceding arrival of the first people in Hawai‘i was drier than previous times with potentially an increased frequency of stronger Aleutian Low conditions in the North Pacific (Bailey et al., 2018). Recent analysis of rainfall observations since 1920 show an overall drying in Hawai‘i, including East Moloka‘i (Frazier and Giambelluca, 2017), that appears to be continuing an overall drying trend in Hawaii since 1500 (Diaz et al., 2016). The hydroclimate proxy data from Pēpē‘ōpae suggest that this overall drying began as early as 2 ka BP.
Conclusion
The environmental proxy data from Pēpē‘ōpae provide a high quality continuous record of Holocene ecological and hydroclimatic change from a windward mid-elevation wet forest in Hawai‘i. The montane peatland is a carbon hot-spot today, storing 144 kg C m-2, but has had a dynamic history of carbon accumulation. The distribution of n-alkanes in peat and modern plants suggests that leaf litter inputs in the peatland over time have not been static, but shifted among dominant plant types in response to climate. We generated a best-estimate chronology for a previously published but undated fossil pollen record from the site, that showed increases in dry-adapted taxa in upwind forests during periods of reduced carbon accumulation at Pēpē‘ōpae. Wet hydroclimatic periods around 9 and 3 ka corresponded to negative departures in the hydrogen stable isotope ratios of sedimentary C29 n-alkanes, consistent with increases in storm-derived rainfall that promoted more stable water table levels. Multi-centennial dry periods have occurred since the mid-Holocene that lack a strong storm rain signal in leaf wax hydrogen stable isotope values. Varying contributions of storm rain to annual totals at the study site are likely tied to the strength and position of the upper level jet stream. This study is the first in Hawai‘i to provide a continuous organic sedimentary record of links between hydroclimate, vegetation, and montane belowground carbon sequestration for this part of the North Pacific. Developing a network of sites across gradients in the Hawaiian Islands should be a research priority to better understand North Pacific circulation using the terrestrial proxy view from these isolated islands.
Author Contributions
DB and OET acquired funding. DB, RK, and SD-C obtained the samples. DB, CM, and JN conducted the laboratory analyses. DB wrote the manuscript with input from all authors.
Funding
This work was supported by the National Science Foundation (United States) Grant AGS-1502984 to DB and AGS-1502951 to OET.
Conflict of Interest Statement
The authors declare that the research was conducted in the absence of any commercial or financial relationships that could be construed as a potential conflict of interest.
Acknowledgments
Access to Pēpē‘ōpae was made possible by The Nature Conservancy Moloka‘i and Ed Misaki. We thank Axel Timmermann, Niklaus Schneider, Karl Hsu, and Derek Ford for their help in the field.
Supplementary Material
The Supplementary Material for this article can be found online at: https://www.frontiersin.org/articles/10.3389/feart.2019.00188/full#supplementary-material
Additional data can be found in the EarthChem library at: http://dx.doi.org/10.1594/IEDA/111334.
References
Anderson, L., Berkelhammer, M., Barron, J. A., Steinman, B. A., Finney, B. P., and Abbot, M. B. (2016). Lake oxygen isotopes as recorders of North American Rocky Mountain hydroclimate: holocene patterns and variability at multi-decadal to millennial scales. Glob. Planet. Change 1377, 131–148. doi: 10.1016/j.gloplacha.2015.12.021
Anshari, G., Kershaw, A. P., van der Kaars, S., and Jacobsen, G. (2004). Environmental change and peatland forest dynamics in the Lake Sentarum area, West Kalimantan, Indonesia. J. Quat. Sci. 19, 637–655. doi: 10.1002/jqs.879
Anslow, F. S., Clark, P. U., Kurz, M. D., and Hostetler, S. W. (2010). Geochronology and paleoclimatic implications of the last deglaciation of the Mauna Kea Ice Cap, Hawaii. Earth Planet. Sci. Lett. 297, 234–248. doi: 10.1016/j.epsl.2010.06.025
Athens, J. S., Ward, J. V., and Blinn, D. W. (2007). Vegetation history of Laysan Island, Northwest Hawaiian Islands. Pac. Sci. 61, 17–37. doi: 10.1371/journal.pone.0136773
Bailey, H. L., Kaufman, D. S., Sloane, H. J., Hubbard, A. L., Henderson, A. C. G., Leng, M. J., et al. (2018). Holocene atmospheric circulation in the central North Pacific: a new terrestrial diatom and d18O dataset from the Aleutian Islands. Quat. Sci. Rev. 194, 27–38. doi: 10.1016/j.quascirev.2018.06.027
Benavides, J. C., Vitt, D. H., and Wieder, R. K. (2013). The influence of climate change on recent peat accumulation patterns in Distichia muscoides cushion bogs in the high-elevation tropical Andes of Columbia. J. Geophys. Res. Biogeosci. 118, 1627–1635. doi: 10.1002/2013jg002419
Blaauw, M., and Christen, J. A. (2018). Rbacon: Age-Depth Modelling using Bayesian Statistics. R package version 2.3.4. Available at: https://CRAN.R-project.org/package=rbacon
Boehmer, H. J., Wagner, H. H., Jacobi, J. D., Gerrish, G. C., and Mueller-Dombois, D. (2013). Rebuilding after collapse: evidence for long-term cohort dynamics in the native Hawaiian rain forest. J. Veg. Sci. 24, 639–650. doi: 10.1111/jvs.12000
Bowen, G. J. (2018). The Online Isotopes in Precipitation Calculator, version 3.1. Available at: http://www.waterisotopes.org
Bowen, G. J., and Revenaugh, J. (2003). Interpolating the isotopic composition of modern meteoric precipitation. Water Resourc. Res. 39:1299. doi: 10.1029/2003WR002086
Buggle, B., Wiesenberg, G. L. B., and Glaser, B. (2010). Is there a possibility to correct fossil n-alkane data for postsedimentary alteration effects? Appl. Geochem. 25, 947–957. doi: 10.1016/j.apgeochem.2010.04.003
Burney, D. A., DeCandido, R. V., Burney, L. P., Kostel-Hughes, F. N., Stafford, T. W., and James, H. F. (1995). A Holocene record of climate change, fire ecology and human activity from montane Flat Top Bog, Maui. J. Paleolimnol. 13, 209–217. doi: 10.1007/bf00682765
Bush, R. T., and McInerney, F. A. (2013). Leaf wax n-alkane distriubtions in and across modern plants: implications for paleoecology and cheotaxonomy. Geochim. Cosmochim. Acta 117, 161–179. doi: 10.1016/j.gca.2013.04.016
Chimner, R. A. (2004). Soil respiration rates of tropical peatlands in Micronesia and Hawaii. Wetlands 24, 51–56. doi: 10.1672/0277-5212(2004)024[0051:SRROTP]2.0.CO;2
Chu, P.-S., and Chen, H. (2005). Interannual and interdecadal rainfall variations in the Hawaiian Islands. J. Clim. 18, 4796–4813. doi: 10.1175/jcli3578.1
Chu, P.-S., Nash, A. J., and Porter, F. (1993). Diagnostic studies of two contrasting rainfall episodes in Hawaii: dry 1981 and wet 1982. J. Clim. 15, 2678–2689.
Clymo, R. S. (1984). The limits to peat bog growth. Philos. Trans. Royal Soc. London B 303, 605–654. doi: 10.1098/rstb.1984.0002
Conroy, J. L., Overpeck, J. T., Cole, J. E., Shanahan, J. M., and Steinitz-Kannan, M. (2008). Holocene changes in eastern tropical Pacific climate inferred from a Galapagos lake sediment record. Quat. Sci. Rev. 27, 1166–1180. doi: 10.1016/j.quascirev.2008.02.015
Crausbay, S., Genderjahn, S., Hotchkiss, S., Sachse, D., Kahmen, A., and Arndt, S. (2014). Vegetation dynamics at the upper reaches of a tropical montane forest are driven by disturbance over the past 7300 years. Arct. Antarct. Alp. Res. 46, 787–799. doi: 10.1657/1938-4246-46.4.787
Dargie, G. C., Lewis, S. L., Lawson, I. T., Mitchard, E. T. A., Page, S. E., Bocko, Y. E., et al. (2017). Age, extent, and carbon storage of the central Congo Basin peatland complex. Nature 542, 86–90. doi: 10.1038/nature21048
Diaz, H. F., Wahl, E. R., Zorita, E., Giambelluca, T. W., and Eischeid, J. K. (2016). A five-century reconstruction of Hawaiian Islands Winter Rainfall. J. Clim. 29, 5661–5674. doi: 10.1175/jcli-d-15-0815.1
Donohoe, A., Marshall, J., Ferreira, D., and McGee, D. (2013). The relationship between ITCZ location and cross-equatorial atmospheric heat transport: from the seasonal cycle to the Last Glacial Maximum. J. Clim. 26, 3597–3618. doi: 10.1175/jcli-d-12-00467.1
Dye, T. S. (2015). Dating human dispersal in remote oceania: a Bayesian view from Hawai‘i. World Archaeol. 47, 661–676. doi: 10.1080/00438243.2015.1052845
Edwards, E. J., and Still, C. J. (2008). Climate, phylogeny and the ecological distribution of C4 grasses. Ecol. Lett. 11, 266–276. doi: 10.1111/j.1461-0248.2007.01144.x
Elison Timm, O., Diaz, H. F., Giambelluca, T. W., and Takahashi, M. (2011). Projection of changes in the frequency of heavy rain events over Hawaii based on leading Pacific climate modes. J. Geophys. Res. Atmos. 116:12.
Frazier, A. G., and Giambelluca, T. W. (2017). Spatial trend analysis of Hawaiian rainfall from 1920-2012. Int. J. Climatol. 37, 2522–2531. doi: 10.1002/joc.4862
Gavenda, R. T. (1992). Hawaiian quaternary paleoenvironments: a review of geological, pedological, and botanical evidence. Pacific Sci. 46, 295–307.
Giambelluca, T. W., Shuai, X., Barnes, M. L., Alliss, R. J., Longman, R. J., Miura, T., et al. (2014). Evapotranspiration of Hawai‘i. Washington, DC: U.S. Army Corps of Engineers.
Hart, P. J. (2010). Tree growth and age in an ancient Hawaiian wet forest: vegetation dynamics at two spatial scales. J. Trop. Ecol. 26, 1–11. doi: 10.1017/s0266467409990320
Hodgkins, S. B., Richardson, C. J., Dommain, R., Wang, H., Glaser, P. H., Verbeke, B., et al. (2018). Tropical peatland carbon storage linked to global latitudinal trends in peat recalcitrance. Nat. Commun. 9:3640. doi: 10.1038/s41467-018-06050-2
Hope, G. S. (2014). The sensitivity of the high mountain ecosystems of New Guinea to climate change and anthropogenic impact. Arct. Antarct. Alp. Res. 46, 777–786. doi: 10.1657/1938-4246-46.4.777
Hotchkiss, S., and Juvik, J. O. (1999). A Late-Quaternary pollen record from Ka‘au Crater, O‘ahu, Hawai‘i. Quat. Res. 52, 115–128. doi: 10.1006/qres.1999.2052
IAEA/WMO (2018). Global Network of Isotopes in Precipitation. The GNIP Database. Vienna: Agence Internationale de L”Energie Atomique.
Jacobi, J. D. (1989). Vegetation Maps of the Upland Plant Communities on the Islands of Hawai‘i, Maui, Moloka‘i, and Lana’i. Technical Report 68. Honolulu, HI: University of Hawai‘i at Mānoa.
Kurnianto, S., Warren, M., Talbot, J., Kauffman, B., Murdiyarso, D., and Frolking, S. (2015). Carbon accumulation of tropical peatlands over millennia: a modeling approach. Glob. Change Biol. 21, 431–444. doi: 10.1111/gcb.12672
Lähteenoja, O., Flores, B., and Nelson, B. (2013). Tropical peat accumulation in Central Amazonia. Wetlands 33, 495–503. doi: 10.1007/s13157-013-0406-0
Lee, K. E., and Slowey, N. C. (1999). Cool surface waters of the subtropical North Pacific Ocean during the last glacial. Nature 397, 512–514. doi: 10.1038/17357
Linkin, M. E., and Nigam, S. (2008). The North Pacific Oscillation-west Pacific teleconnection pattern: mature-phase structure and winter impacts. J. Clim. 21, 1979–1997. doi: 10.1175/2007jcli2048.1
Macdonald, G. A., Abbot, A. T., and Peterson, F. L. (1983). Volcanoes in the Sea: the Geology of Hawaii: University of Hawaii Press.
Maciolek, J. A. (1969). Freshwater lakes in Hawaii. Verhandlungen des Internationalen Verein Limnologie 17, 386–391. doi: 10.1080/03680770.1968.11895863
Marzi, R., Torkelson, B. E., and Olson, R. K. (1993). A revised carbon preference index. Org. Geochem. 20, 1303–1306. doi: 10.1016/0146-6380(93)90016-5
McCune, B., and Mefford, M. J. (2016). PC-ORD. Multivariate Analysis of Ecological Data. Version 7.04. Gleneden Beach, OR: MjM Software.
McGee, D., Donohoe, A., Marshall, J., and Ferreira, D. (2014). Changes in the ITCZ location and cross-equitorial heat transport at the last glacial maximum, Heinrich Stadial 1, and the mid-Holocene. Earth Planet. Sci. Lett. 390, 69–79. doi: 10.1016/j.epsl.2013.12.043
Moore, J. G., Clague, D. A., Holcomb, R. T., Lipman, P. W., Normark, W. R., and Torresan, M. E. (1989). Prodigious submarine landslides on the Hawaiian Ridge. J. Geophys. Res. Solid Earth 94, 17465–17484. doi: 10.1029/JB094iB12p17465
Mueller-Dombois, D. (1986). Perspectives for an etiology of stand-level dieback. Annu. Rev. Ecol. Syst. 17, 221–243. doi: 10.1146/annurev.ecolsys.17.1.221
Nichols, J. E. (2011). Procedures for extraction and purification of leaf wax biomarkers from peats. Mires Peat 7, 1–7.
Nichols, J. E., Peteet, D. M., Moy, C. M., Castañeda, I. S., McGeachy, A., and Perez, M. (2014). Impacts of climate and vegetation change on carbon accumulation in a south-central Alaskan peatland assessed with novel organic geochemical techniques. Holocene 24, 1146–1155. doi: 10.1177/0959683614540729
Page, S. E., Rieley, J. O., and Banks, C. J. (2011). Global and regional importance of the tropical peatland carbon pool. Glob. Change Biol. 17, 798–818. doi: 10.1073/pnas.1806003115
Price, J. P., Jacobi, J. D., Gon, S. M. III, Matsuwaki, D., Mehrhoff, L., Wagner, W., et al. (2012). Mapping Plant Species Ranges in the Hawaiian Islands - Developing a Methodology and Associated GIS layers: U.S. Geological Survey Open-File Report 2012–1192. Reston, VA: United States Geological Survey, 34.
Reimer, P. J., Bard, E., Bayliss, A., Beck, J. W., Blackwell, P. G., Bronk Ramsey, C., et al. (2013). IntCal13 and MARINE13 radiocarbon age calibration curves 0-50000 years cal BP. Radiocarbon 55, 1869–1887. doi: 10.2458/azu_js_rc.55.16947
Reimi, M. A., and Marcantonio, F. (2016). Constraints on the magnitude of the deglacial migration of the ITCZ in the Central Equatorial Pacific Ocean. Earth Planet. Sci. Lett. 453, 1–8. doi: 10.1016/j.epsl.2016.07.058
Rieley, J., and Page, S. (2015). “Tropical peatland in the world,” in Tropical Peatland Ecosystems, eds M. Osaki and N. Tsuji (Tokyo: Springer), 3–32. doi: 10.1007/978-4-431-55681-7_1
Risi, C., Noone, D., Worden, J., Frankenberg, C., Stiller, G., Kiefer, M., et al. (2012). Process-evaluation of tropospheric humidity simulated by general circulation models using water vapor isotopologues: 1. comparison between models and observations. J. Geophys. Res. 117:D05303. doi: 10.1029/2011JD016621
Rock, J. F. (1913). The Indigenous Trees of the Hawaiian Islands. Honolulu: Bibliolife DBA of Bibilio Bazaar II LLC, 547.
Rundel, P. W. (1980). The ecological distribution of C4 and C3 grasses in the Hawaiian Islands. Oecologia 45, 354–359. doi: 10.1007/BF00540205
Sasche, D., Billault, I., Bowen, G. J., Chikaraishi, Y., Dawson, T. E., Feakins, S. J., et al. (2012). Molecular paleohydrology: interpreting the hydrogen-isotopic composition of lipid biomarkers from photosynthesizing organisms. Annu. Rev. Earth Planet. Sci. 40, 221–249. doi: 10.1146/annurev-earth-042711-105535
Scholl, M. A., Gingerich, S. B., and Tribble, G. W. (2002). The influence of microclimates and fog on stable isotope signatures used in interpretation of regional hydrology: East Maui, Hawaii. J. Hydrol. 265, 170–184. doi: 10.1016/s0022-1694(02)00073-2
Scholl, M. A., Ingebritsen, S. E., Janik, C. J., and Kauahikaua, J. P. (1996). Use of precipitation and ground water isotopes to interpret regional hydrology on a tropical volcanic island: Kilauea volcano area, Hawaii. Water Resour. Res. 32, 3525–3537. doi: 10.1029/95wr02837
Schuur, E. A. G. (2001). The effect of water on decomposition dynamics in mesic to wet Hawaiian montane forests. Ecosystems 4, 259–273. doi: 10.1007/s10021-001-0008-1
Seager, R., Naik, N., Ting, M., Cane, M. A., Harnik, N., and Kushnir, Y. (2010). Adjustment of the atmospheric circulation to tropical Pacific SST anomalies: variability of transient eddy propagation in the Pacific-North America sector. Q. J. R. Meteorol. Soc. 136, 277–296. doi: 10.1002/qj.588
Selling, O. H. S. (1948). Studies in Hawaiian Pollen Statistics. Honolulu, HI: Bishop Museum Special Publication, 154.
Selments, P. C., Giardina, C. P., Jacobi, J. D., and Zhu, Z. (2017). “Baseline and projected future carbon storage and carbon fluxes in ecosystems of Hawai‘i,” in Paper Presented at the U.S. Geological Survey Professional Paper 1834, (Reston, VA: U.S. Geological Survey).
Sjögersten, S., Black, C. R., Evers, S., Hoyos-Santillan, J., Wright, E. L., and Turner, B. L. (2014). Tropical wetlands: a missing link in the global carbon cycle? Glob. Biogeochem. Cycl. 28, 1371–1386. doi: 10.1002/2014GB004844
Skottsberg, C. (1940). “Report on Hawaiian Bogs”, in Proceedings of the 6th Pacific Science Congress, IV, (Berkeley: University of California Press), 659–661.
Uchikawa, J., Popp, B. N., Schoonmaker, J. E., Timmermann, A., and Lorenz, S. J. (2010). Geochemical and climate modeling evidence for Holocene aridification in Hawaii: dynamic response to a weakening equatorial cold tongue. Quat. Sci. Rev. 29, 3057–3066. doi: 10.1016/j.quascirev.2010.07.014
Wagner, W. L., Herbst, D. R., and Sohmer, S. H. (1996). Manual of the Flowering Plants of Hawai‘i: Revised Edition. Honolulu: University of Hawai‘i Press.
Wilmshurst, J. M., Hunt, T. L., Lipo, P., and Anderson, A. J. (2011). High precision radiocarbon dating shows recent and rapid initial human colonization of East Polynesia. Proc. Natl. Acad. Sci. U.S.A. 108, 1815–1820. doi: 10.1073/pnas.1015876108
Yu, Z., Loisel, J., Brosseau, D. P., Beilman, D. W., and Hunt, S. J. (2010). Global peatland dynamics since the last glacial maximum. Geophys. Res. Lett. 37:L13402. doi: 10.1029/2010GL043584
Keywords: tropical peatland, Hawai‘i, Moloka‘i, leaf wax, pollen, deuterium, Holocene
Citation: Beilman DW, Massa C, Nichols JE, Elison Timm O, Kallstrom R and Dunbar-Co S (2019) Dynamic Holocene Vegetation and North Pacific Hydroclimate Recorded in a Mountain Peatland, Moloka‘i, Hawai‘i. Front. Earth Sci. 7:188. doi: 10.3389/feart.2019.00188
Received: 19 December 2018; Accepted: 04 July 2019;
Published: 06 August 2019.
Edited by:
Lesleigh Anderson, United States Geological Survey, United StatesReviewed by:
Daniel B. Nelson, University of Basel, SwitzerlandNadia Solovieva, University College London, United Kingdom
Copyright © 2019 Beilman, Massa, Nichols, Elison Timm, Kallstrom and Dunbar-Co. This is an open-access article distributed under the terms of the Creative Commons Attribution License (CC BY). The use, distribution or reproduction in other forums is permitted, provided the original author(s) and the copyright owner(s) are credited and that the original publication in this journal is cited, in accordance with accepted academic practice. No use, distribution or reproduction is permitted which does not comply with these terms.
*Correspondence: David W. Beilman, YmVpbG1hbkBoYXdhaWkuZWR1