 Thomas DeBell
 Luke Goertzen
 Lars Larson
 William Selbie2
 Chet Udell
95% of researchers rate our articles as excellent or good
Learn more about the work of our research integrity team to safeguard the quality of each article we publish.
Find out more
BRIEF RESEARCH REPORT article
Front. Earth Sci. , 31 May 2019
Sec. Hydrosphere
Volume 7 - 2019 | https://doi.org/10.3389/feart.2019.00137
This article is part of the Research Topic MacGyver in Geosciences View all 13 articles
In Earth science, we must often collect data from sensors installed in remote locations. Retrieving these data and storing them can be challenging. Present options include proprietary commercial dataloggers, communication devices, and protocols with rigid software and data structures that may require ongoing expenses. While there are open-source solutions that include telemetry, such as EnviroDIY’s Mayfly, none presently generate real-time, remotely accessible workbooks (Aufdenkampe et al., 2017; EnviroDIY, 2018). The Openly Published Environmental Sensing (OPEnS) Lab developed the OPEnS Hub, a new approach to using low-power, open-source hardware and software to achieve real-time data logging from the field to the web. The Hub is an order of magnitude less expensive than commercial products, inherently modular and flexible, and aims to reduce technical barriers for users with little programming experience (DeBell, 2019). Data can be collected remotely using a host of transmission protocols to relay data from distributed in situ monitoring devices. The Hub mesh-networks with several nodes and backs up to an onboard microSD card. Telemetry options include 900 MHz Long Range Radio (LoRa) with up to 25 km range and Nordic Radio Frequency (nRF) for higher data rates (Feather, 2018). Ongoing transmissions from the Hub to the internet currently employ Ethernet with potential support for Wi-Fi and the cell network. The Hub engages a dynamic, low-latency portal to Google Sheets via the free Application Programming Interface (API), PushingBox, and an adaptable Google Apps Script. This framework was tested on 12 individual sensors nodes at remote sites in Oregon. This manuscript details our methods and evaluates PushingBox, Google Apps Script, Adafruit Industries’ open-hardware Feather development boards, the Hypertext Transfer Protocol (HTTP), and the aforementioned modes of data transfer.
Advancements in sensing technology have sparked a new age of data acquisition that continues to change how we understand the world around us. However, proprietary data loggers can be prohibitively expensive for distributed in situ sensing. These systems often store data onboard, demanding intermittent retrieval from the field or requiring ongoing fees for remote access with satellite telemetry (Communications, 2018). Proprietary systems often require separate data loggers at each sensor location, making spatially distributed sensing costly (CR1000, 2018). Although commercial loggers come preassembled and tested, by using open source alternatives, users gain an ever-growing community of collaborators and a robust, inexpensive platform. The OPEnS Hub is less than one-tenth the price of common commercial options with a hardware cost of $128, neglecting the cost of assembly time and testing which varies depending on the user’s technical background (DeBell, 2019).
One solution to the problem of logging data from remote locations leverages the “Internet of Things” (IoT) movement: everything can be connected to the internet. Specifically, the OPEnS Lab has established an “Internet of Agriculture” (IoA) initiative using open-source IoT-enabled devices to collect scientific data on environmental conditions. A significant challenge to the IoA is that systems are deployed in remote areas where Wi-Fi is not accessible. Existing open-source dataloggers such as the Northern Widget LLC ALog are proven as reliable tools for automated field data acquisition, but still lack telemetry (Wickert, 2014). However, a more recent open-source development by a University of North Texas research group supports the Zigbee telemetry protocol with an Xbee module and hosts data to the web using a Raspberry Pi and custom web interface (Ferdoush and Li, 2014; Raspberry and Pi Foundation, 2019). Additionally, EnviroDIY’s Mayfly offers an Arduino-based system with onboard telemetry options such as Xbee (900 MHz and 2.4 GHz), LoRa, and WiFi that interfaces with cloud-based data platforms including the Model My Watershed Web app (Hicks et al., 2019).
To build on the existing open source systems above, the goal of the OPEnS Hub was to create an inherently modular, cost-effective platform with a continuous, real-time link to Google Sheets. This process allows for data to be shared, viewed, and analyzed by anyone of the two billion active Google account users in the familiar Google ecosystem (Popper, 2017). We sought to develop a device that accommodates a variety of long-range wireless telemetry options and to provide open-source documentation (see GitHub) at a technical level such that a farmer, scientist, or student would be able to replicate our work (DeBell, 2019). Tutorials, computer-aided design files (CAD), code and other supporting documentation for the Hub are located at the project GitHub repository, https://github.com/OPEnSLab-OSU/OPEnS-Hub_Frontiers. A release of the GitHub repository was deposited in Zenodo for archival purposes (DeBell et al., 2019). The OPEnS Hub stands to simultaneously lower the cost of experimentation and data collection while breaking down traditional technical barriers.
The physical components of the Hub rely on an open-hardware suite of development boards produced by Adafruit Industries and driven by the ATMEGA32u4 microcontroller (Feather, 2018). We chose the Adafruit Feather line of development boards for their low power requirements (∼0.7 mA standby), smaller form factor, and embedded telemetry options, when compared to the ubiquitous Arduino Uno (∼15 mA standby) (SparkFun, 2015; DeBell, 2019). Variants of the Feather include onboard modules enabling 900 MHz Long Range Radio (LoRa) transmissions or Wi-Fi/Ethernet connectivity. Stackable “FeatherWing” extensions for the development boards include the Global System for Mobile Communication (GSM), 2.4 GHz Nordic Radio Frequency (nRF), and Bluetooth modules. Feathers are programmed using C++ (International Organization for Standardization, 2013) in the Arduino platform (Arduino, 2019). The boards selected for field implementation were the Ethernet FeatherWing (Adafruit Industries, 2019) to connect the Hub to the web, the real-time clock FeatherWing (Adafruit Industries, 2018b) to make accurate timestamps of transmissions, and the LoRa-enabled development board (Adafruit Industries, 2018a) which accesses a non-licensed 900 MHz radio band to transmit data from the sensors to the logger. A 3-ft-long, 8-dB, 50-Ohm impedance, omnidirectional radio antenna was used to improve transmission strength. Custom, 3D-printed enclosures were designed in Autodesk’s Fusion 360 (A360, 2019) to protect the Hub from field conditions. This produced a housing that could be rapidly modified to meet varying configurations with a production cost of $12 (DeBell, 2019). A comprehensive list of hardware can be found in the bill of materials included in the Section Supplementary Materials.
A cloud service was utilized to process, store, and provide users with remote access to the collected data. Google’s App Script was chosen because it is free and can be easily modified in a language similar to JavaScript. This application also makes data available in a simple, familiar environment and displays near real-time updates using Google’s reliable spreadsheet interface. The Google ecosystem lends itself well to open data and readily pairs with open-hardware.
The process of getting field data to a Google spreadsheet requires several steps. Data must first be packaged into a format that can be sent and parsed, the device must connect to the internet, and a Hypertext Transfer Protocol (HTTP) request containing the data triggers an Application Programming Interface (API), PushingBox (PushingBox, 2018). This API was primarily chosen because it is free to use, compatible with open-hardware, and it does not require a secure connection to move data into its “scenarios” before offloading this information into Google Sheets (see Pushingbox folder on GitHub).
Each sensor node sends the spreadsheet ID, tab ID, and column names alongside the data so that the App Script can create any number of Google Sheets from a single Hub. To achieve this, each node sends data in key-value pairs (KVP). For every data point sent, the Hub specifies the origin of the data (i.e., the column in the spreadsheet) to be correctly organized, coupled with the data value itself. As a result, each data point requires two HTTP GET arguments. Although sending these KVPs adds to the total packet size, this protocol enables dynamic addition or removal of sensors without needing to change the App Script.
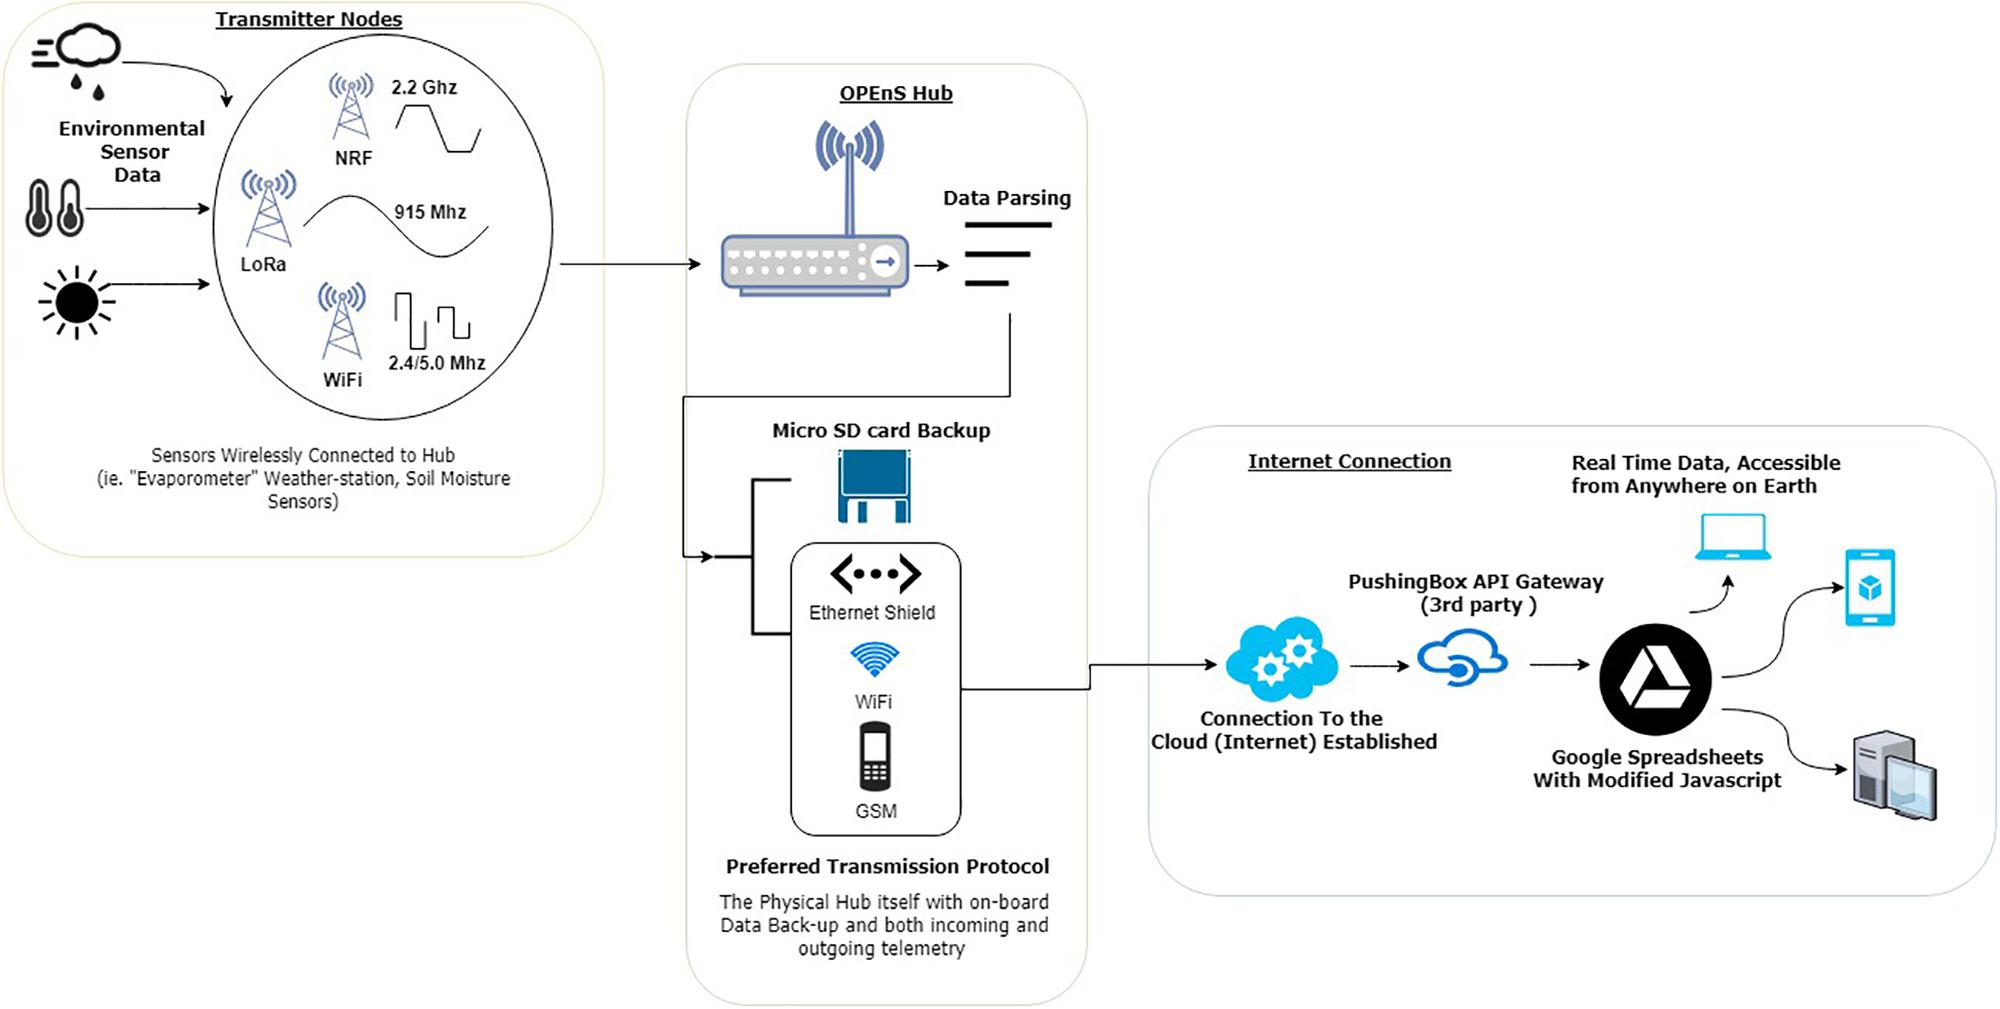
Figure 1. The depiction above represents the data pipeline from the point of acquisition in the field to observation on personal devices.
The next steps no longer involve the development board; the API can extract and forward data from the Hub to a Google Script. When the Google Script receives a GET argument, it creates a JavaScript dictionary, relating the keys to the values which will identify the correct spreadsheet and tab and finally write these data into the corresponding columns. Next, it accesses the specified spreadsheet and tab and checks the most recent column headers. The data is then sorted into the correct columns, or a new header is created if the data keys have changed since the last upload. A full visual representation of this process is in Figure 1.
Much of the complexity of this routine stems from the limited processing capacity of Arduino-like devices for supporting the Secure Sockets Layer (SSL) or Transport Layer Security (TLS) encryption protocol required for HTTPS (HTTP Secure). This barrier is nontrivial because Google Scripts/Apps can only be accessed via secure connections. As such, the device needs to offload the direct communication with the script to another platform such as the PushingBox API. While PushingBox can trigger a variety of services upon receiving a HTTP request, the OPEnS Hub sends data to the script URL which effectively converts the original HTTP request from the Hub to a HTTPS request to reach the Google script.
Since each sensor deployment configuration is unique, it was necessary to be able to test each device individually and in concert over the internet gateway to know that data was transcribed correctly to the spreadsheet. First, testing was done to confirm that the sensors were transmitting the correct data at specified intervals to the Hub. This also tested the system’s scalability by proving that multiple devices could transmit to the Hub simultaneously without losing or corrupting data. The use of a free API presented one of the significant constraints of the project because each account is limited to 1,000 HTTP requests per day. For initial testing, the sampling frequency was 5 min or 288 readings per day. The system was then scaled to support any number of devices as long as the sampling frequency did not exceed 1,000 requests per day. Prototype testing simulated field conditions by sending transmissions over a kilometer, subjecting the enclosure to precipitation, and exposing the system to high UV intensity. Although no field testing was done beyond 1 km in the field, Adafruit Industries states that the upper limit for their LoRa transmitter and receiver can be upward of 25 km line of sight (Adafruit Industries, 2019).
Although there are a variety of telemetry options supported by the OPEnS Hub, LoRa radio proved to be the most applicable for field testing at ranges exceeding half a kilometer. Field testing consisted of three deployments among two different sites. The first two field experiments were conducted at the H.J. Andrews Experimental Forest (Figure 2A) near Blue River, Oregon in July 2017 and July 2018, and the third was at Lewis Brown Farms (Figure 2B) near Corvallis, Oregon in April 2018 (DeBell, 2019).
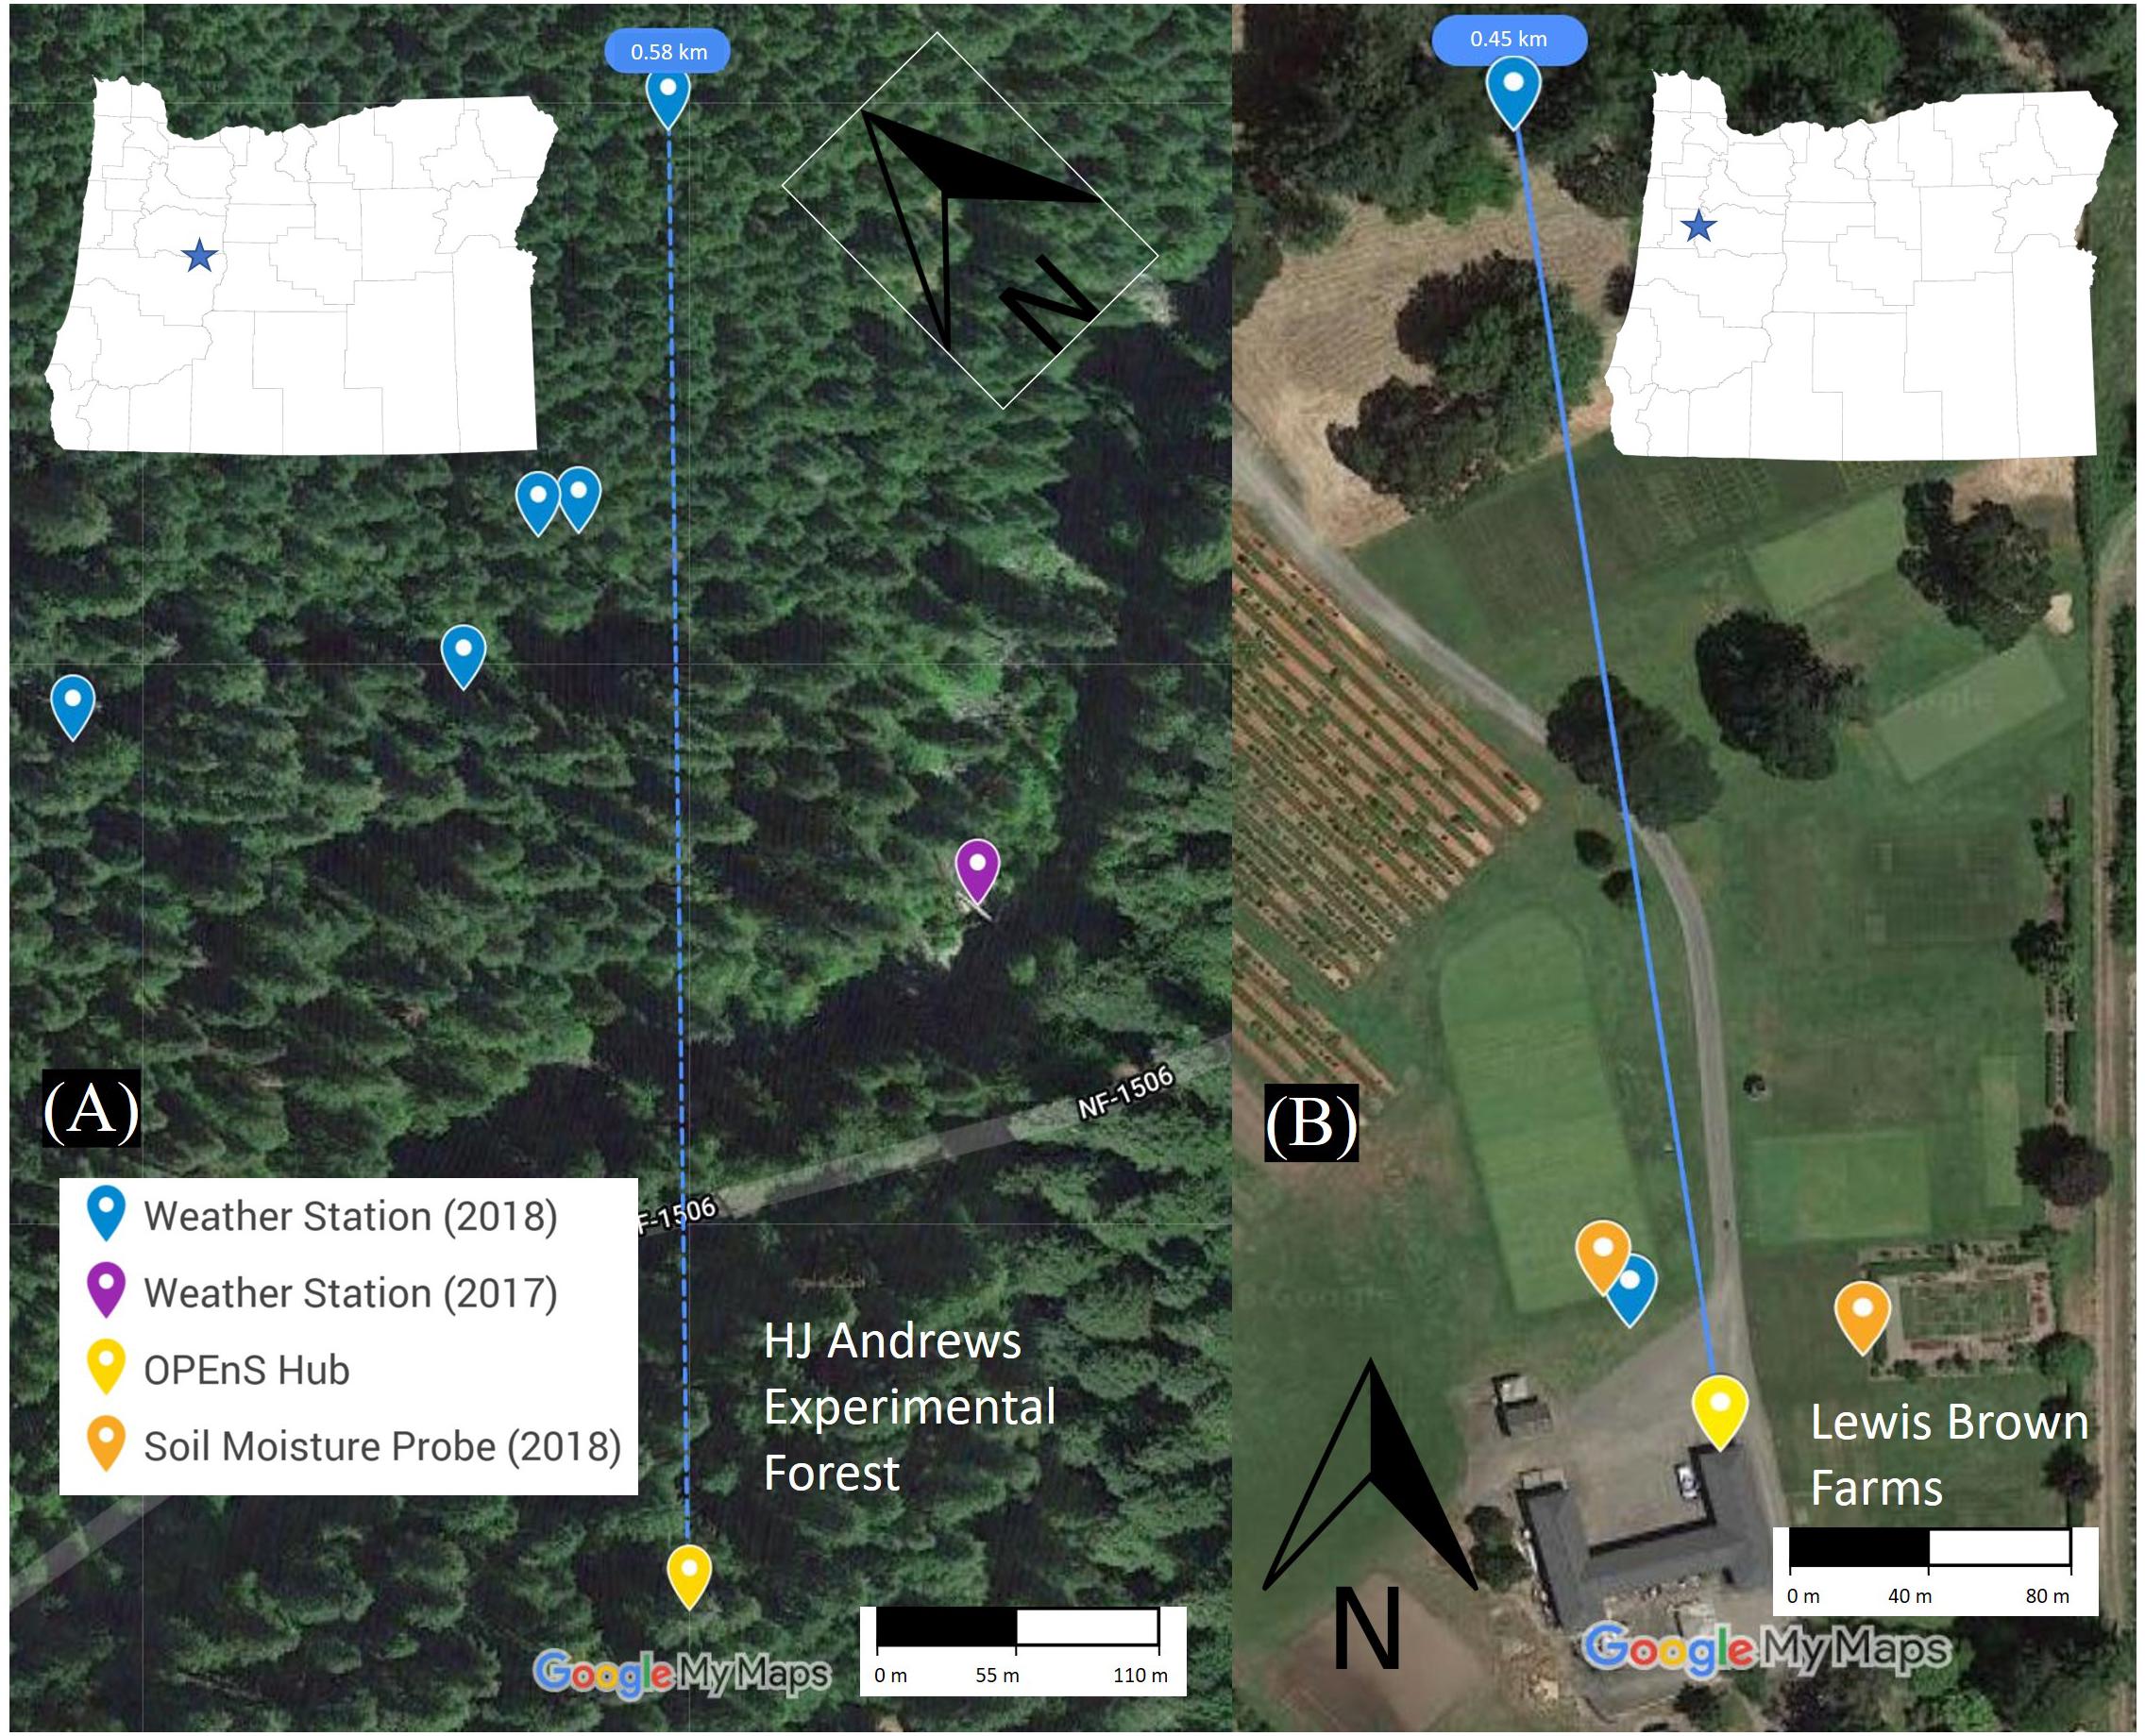
Figure 2. Map of field site at H.J. Andrews Experimental Forest (A) and Lewis Brown Farms (B), showing relative distances from nodes to Hub.
The first experiment consisted of a Hub equipped with LoRa radio and a wired Ethernet connection and one LoRa-enabled weather station located approximately half a kilometer away through the densely wooded forest. The following test at Lewis Brown Farms consisted of a variety of sensor types all equipped with LoRa radios transmitting at intervals of 10 min for two weather stations and 15 min for three soil moisture sensors. These data were broadcast at a maximum distance of 0.45 kilometers to the Hub which was connected via Ethernet. The final field deployment was conducted, again at the H.J. Andrews Experimental Forest, with five weather stations transmitting a variety of environmental conditions at varying distances from the Hub. The longest transmission reached 0.58 kilometers. The format and metadata of the generated Google spreadsheet are outlined in the GitHub repository under “field data,” and a map of the field sites showing the Hub in relation to the nodes can be found in Figure 2 (DeBell, 2019).
The system was validated in the field at two locations with a total hardware cost of $128 (DeBell, 2019). The first deployment (represented by the purple pin in Figure 2) yielded almost 2 months of consistent data transmissions approximately half a kilometer through dense forest. Weather data was reported at 5-min intervals to Google Sheets with less than 10 s of latency. The second deployment demonstrated the capability to receive sensor data from multiple nodes over a period of 4 months. The App Script proved sufficiently dynamic to generate separate tabs for each device and place their respective dataset into the correct columns, producing a spreadsheet populated with over 300,000 data points. The third and final deployment of this study resulted in weather station data received from 5 devices dispersed across the H.J. Andrews Experimental Forest with transmission distances up to half a kilometer. Cumulative data transmission from these three experiments exceeded 400,000 individual points. See the GitHub repository to access field data spreadsheets. The third experiment was cut short due to battery damage at the transmitter nodes caused by a preliminary enclosure design that was permeable to rainwater.
An initial challenge was that the data transmission and the spreadsheet were inherently coupled, which resulted in an end product that lacked flexibility. The spreadsheet assumed the incoming data’s order and placed it accordingly, which meant that if the nodes ever changed the data transmitted or the way the Hub started processing data, then the spreadsheet would organize it incorrectly. This problem was resolved by altering the functionality of the nodes to send KVP so that the data could be order-agnostic. This strategy resulted in a spreadsheet that accurately displays data in the correct columns, regardless of the order of data received, making the system truly dynamic in the event of dropped radio data packets. However, the transmissions were restricted to only 13 different sensor variables as a result.
Stackable telemetry modules are available for nRF, WiFi, and GSM which plug directly into the header pins of the Adafruit Feather. This requires only minor changes to the transmission code which is under further development on our associated GitHub repository, “Internet of Ag” (Goertzen et al., 2018). The Hub’s potential for interchangeable incoming (LoRa, nRF, and Wi-Fi) and outgoing (Ethernet and GSM) transmissions allows for future customization depending on the application of use. This modularity enables transmission over several kilometers at low bandwidths (LoRa and GSM) or shorter distance at much higher bandwidths (Wi-Fi, Ethernet). It is also notable that LoRa technology is still developing and has been expanded to transmit to an ever-growing constellation of satellites, making this technology truly global in its applicability (Telkamp, 2018; Semtech and Lacuna, 2019).
The scope of field research using distributed sensors is often restricted by the need to manually retrieve data from remote locations. Moreover, proprietary data logging systems can be prohibitively expensive when scaled to support multiple sensor nodes. To address this challenge, we developed a modular Hub with open-source software, open-hardware and a myriad of telemetry options to push data from the field to Google Sheets in real time, making use of a platform that over two billion people currently use. The OPEnS Hub costs $128, and current ongoing telemetry is free. The Hub has relayed over 400,000 data points through dense forest, proving robust operation under field conditions.
The OPEnS Hub leverages the IoT movement and applies its low-cost and flexible framework to environmental sensing networks. The comprehensive library of code, supporting files, and tutorials on our GitHub helps to break down technical barriers by allowing citizen scientists, farmers, and students to increase the extent and precision of their monitoring efforts without undergoing the complex development process. By expanding access to open-source environmental sensing, the OPEnS Hub broadens the potential for cost-effective precision agriculture, larger field experiments, and new applications for mass data analytics that are yet to be discovered.
TD designed the framework for the project, wrote the majority of the manuscript, and constructed the physical device. LG and WS contributed to the software library development, and acted as a reference for all software considerations. LL served as chief editor of the manuscript and provided imperative guidance in the construction of the article. CU was the primary mentor on the project. JS served as the head principal investigator on the project.
This work was supported in part by the USDA National Institute of Food and Agriculture, Hatch project NI18HFPXXXXXG055, the Agricultural Science Foundation at Oregon State University, and Oregon State University Scaled Learning Innovation Grant. All work was done using the resources of the Openly Published Environmental Sensing (OPEnS) Lab at Oregon State University. Student funding for the project was provided in part by the College of Agricultural Science through the beginning and continuing research support programs.
The authors declare that the research was conducted in the absence of any commercial or financial relationships that could be construed as a potential conflict of interest.
We are especially indebted to all those who have taken time to provide feedback on this project including Gordon Godshalk, Katherine Darr, and Carolyn Gombert. Additionally, we would like to thank the members of the OPEnS lab, especially Cara Walter, who has provided aid to this project since the very beginning. We also thank our thoughtful Frontiers reviewers and editor for their constructive comments and suggestions. The ability to approach technical writing critically and iteratively is largely a result of the mentorship provided by Dr. Chad Higgins. Lastly, we would like to thank all the faculty, staff and researchers of the Biological and Ecological Engineering department at Oregon State University, for creating a professional and delightful place to work.
The Supplementary Material for this article can be found online at: https://www.frontiersin.org/articles/10.3389/feart.2019.00137/full#supplementary-material
A360 (2019). Project Collaboration in the Cloud. Available at: https://a360.autodesk.com/ (accessed October 29, 2018).
Adafruit Industries (2018a). LoRa Radio FeatherWing - RFM95W 900 MHz. Available at: https://www.adafruit.com/product/3231 (accessed October 27, 2018).
Adafruit Industries (2018b). DS3231 Precision RTC FeatherWing - RTC Add-on For Feather Boards. Available at: https://www.adafruit.com/product/3028 (accessed October 27, 2018).
Adafruit Industries (2019). Ethernet FeatherWing ID: 3201 - $19.95: Adafruit Industries. Available at: https://www.adafruit.com/product/3201 (accessed October 27, 2018).
Arduino (2019). Software. Available at: https://www.arduino.cc/en/Main/Software (accessed October 29, 2018).
Aufdenkampe, A. K., Damiano, S. G., Hicks, S., and Horsburgh, J. S. (2017). “EnviroDIY Modular Sensors: A Library to give Environmental Sensors a Common Interface of Functions for use with Arduino-Compatible Dataloggers,” in American Geophysical Union, Fall Meeting, (New Orleans, LA: American Geophysical Union).
Communications (2018). Wireless, Remote, Hard-Wired, Direct, Or Two-Way Communication. Available at: http://www.campbellsci.com/communications (accessed October 27, 2018).
CR1000 (2018). Measurement and Control Datalogger. Available at: https://www.campbellsci.com/cr1000 (accessed October 27, 2018).
DeBell, T. (2019). Design and Deployment of a General Purpose, Open Source LoRa to Wi-Fi Hub and Data Logger. 2017 AGU Fall Meeting. Available at: https://agu.confex.com/agu/fm17/meetingapp.cgi/Paper/221030 (accessed October 29, 2018).
DeBell, T., Goertzen, L., Larson, L., Selbie, W., Selker, J., and Udell, C. (2019). OPEnSLab-OSU/OPEnS-Hub_Frontiers: The OPEnS Hub. San Francisco, CA: GitHub, Inc.
EnviroDIY (2018). GitHub. Available at: https://github.com/EnviroDIY (accessed February 17, 2019).
Feather (2018). A complete line of development boards from Adafruit that are both standalone and stackable. Available at: https://www.adafruit.com/feather?gclid=EAIaIQobChMI79-8uJCc4AIVyiCtBh21dwE5EAAYASAAEgLUa_D_BwE (accessed February 2, 2019).
Ferdoush, S., and Li, X. (2014). Wireless sensor network system design using raspberry Pi and arduino for environmental monitoring applications. Procedia Comput. Sci. 34, 103–110. doi: 10.1016/j.procs.2014.07.059
Goertzen, L., Selbie, W., Swopet, Noblek, Leedongj, Debellt, et al. (2018). OPEnSLab-OSU/InternetOfAg: Loom 1.1 Release for Zenodo. doi: 10.5281/zenodo.2483255
Hicks, S., Aufdenkampe, A., Damiano, S., and Arscott, D. (2019). EnviroDIY Mayfly Logger: v0.5b. doi: 10.5281/zenodo.2572006
International Organization for Standardization C++ (2013). Available at: https://isocpp.org/std/status (accessed October, 2018).
Popper, B. (2017). Google Announces over 2 Billion Monthly Active Devices On Android. The Verge. Available at: https://www.theverge.com/2017/5/17/15654454/android-reaches-2-billion-monthly-active-users (accessed April 1, 2019).
PushingBox (2018). Notifications for Your Internet Of Things Devices. Available at: https://www.pushingbox.com/ (accessed October 29, 2018).
Raspberry and Pi Foundation (2019). Teach, Learn, and Make with Raspberry Pi. Raspberry Pi. Available at: https://www.raspberrypi.org (accessed April 1, 2019).
Semtech and Lacuna (2019). Receiving Messages from Space. Available at: https://www.semtech.com/company/press/semtech-and-lacuna-receiving-messages-from-space (accessed February 10, 2019).
SparkFun, E. (2015). Reducing Arduino Power Consumption - learn.sparkfun.com. Available at: https://learn.sparkfun.com/tutorials/reducing-arduino-power-consumption/all (accessed February 10, 2019).
Telkamp, T. (2018). LoRa Transmission From Low Orbit Satellite. The Things Network. Available at: https://www.thethingsnetwork.org/article/lora-transmission-from-low-orbit-satellite (accessed October 27, 2018).
Keywords: open-source, in situ-sensing, arduino, lora, google-sheet, data-logging, IOT, low-cost
Citation: DeBell T, Goertzen L, Larson L, Selbie W, Selker J and Udell C (2019) OPEnS Hub: Real-Time Data Logging, Connecting Field Sensors to Google Sheets. Front. Earth Sci. 7:137. doi: 10.3389/feart.2019.00137
Received: 01 November 2018; Accepted: 15 May 2019;
Published: 31 May 2019.
Edited by:
Rolf Hut, Delft University of Technology, NetherlandsReviewed by:
Andrew Wickert, University of Minnesota Twin Cities, United StatesCopyright © 2019 DeBell, Goertzen, Larson, Selbie, Selker and Udell. This is an open-access article distributed under the terms of the Creative Commons Attribution License (CC BY). The use, distribution or reproduction in other forums is permitted, provided the original author(s) and the copyright owner(s) are credited and that the original publication in this journal is cited, in accordance with accepted academic practice. No use, distribution or reproduction is permitted which does not comply with these terms.
*Correspondence: Thomas DeBell, ZGViZWxsdEBvcmVnb25zdGF0ZS5lZHU=; dGNkZWJlbGxAbmNzdS5lZHU=
Disclaimer: All claims expressed in this article are solely those of the authors and do not necessarily represent those of their affiliated organizations, or those of the publisher, the editors and the reviewers. Any product that may be evaluated in this article or claim that may be made by its manufacturer is not guaranteed or endorsed by the publisher.
Research integrity at Frontiers
Learn more about the work of our research integrity team to safeguard the quality of each article we publish.