- 1Department of Earth Sciences, University at Buffalo, Buffalo, NY, United States
- 2Computational Data Science and Engineering, University at Buffalo, Buffalo, NY, United States
- 3Sezione di Pisa, Istituto Nazionale di Geofisica e Vulcanologia, Pisa, Italy
- 4Department of Materials Design and Innovation, University at Buffalo, Buffalo, NY, United States
- 5Department of Mechanical and Aerospace Engineering, University at Buffalo, Buffalo, NY, United States
- 6Department of Geosciences, Pennsylvania State University, University Park, PA, United States
We introduce a doubly stochastic method for performing material failure theory based forecasts of volcanic eruptions. The method enhances the well known Failure Forecast Method equation, introducing a new formulation similar to the Hull-White model in financial mathematics. In particular, we incorporate a stochastic noise term in the original equation, and systematically characterize the uncertainty. The model is a stochastic differential equation with mean reverting paths, where the traditional ordinary differential equation defines the mean solution. Our implementation allows the model to make excursions from the classical solutions, by including uncertainty in the estimation. The doubly stochastic formulation is particularly powerful, in that it provides a complete posterior probability distribution, allowing users to determine a worst case scenario with a specified level of confidence. We apply the new method on historical datasets of precursory signals, across a wide range of possible values of convexity in the solutions and amounts of scattering in the observations. The results show the increased forecasting skill of the doubly stochastic formulation of the equations if compared to statistical regression.
1. Introduction
The Failure Forecast Method (FFM) for volcanic eruptions is a classical tool applied in the interpretation of monitoring data as potential precursors, providing quantitative predictions of the eruption onset. The basis of FFM is a fundamental law for failing materials:
where, following traditional notation, is the rate of the precursor signal, and α, A are model parameters. The solution rate is a power law of exponent 1/(1 − α) diverging at time tf, called failure time. The model represents the potential cascading of precursory events, e.g., growth and coalescence of cracks and consequent precursory signals, leading to a large-scale rupture of materials, with tf a good approximation to the eruption onset time te.
The FFM equation was originally developed in landslide forecasting (Fukuzuno, 1985; Voight, 1987, 1988b; Voight et al., 1989), and later applied in eruption forecasting (Voight, 1988a, 1989; Cornelius and Voight, 1995). The method was retrospectively applied to several volcanic systems, including dome growth episodes and explosive volcanic eruptions (Voight and Cornelius, 1991; Cornelius and Voight, 1994, 1996; Voight et al., 2000).
Seismic data are the type of signals most extensively studied with the FFM method in volcanology. Volcanic tremor has been related to the multi-scale rock cracking (Kilburn and Voight, 1998; Kilburn, 2003; Ortiz et al., 2003; Smith et al., 2009) and volcano-tectonic earthquakes can be forecasted applying the FFM on their characteristics (Tárraga et al., 2006). Rheological experiments on lava domes revealed that also the magma seismicity associated with effusive eruptions is consistent with the FFM theory (Lavallée et al., 2008). In general, retrospective analysis of pre-eruptive seismic data has produced good results in several case studies (e.g., Smith and Kilburn, 2010; Budi-Santoso et al., 2013; Chardot et al., 2013). Finally, the FFM has been successfully tested on Synthetic Aperture Radar acquisitions, opening the path to new forecasting applications based on satellite data (Moretto et al., 2016).
The reliability of FFM forecasts is known to be affected by several factors. When applied to seismic data, the performance of the method is usually better for eruptions preceded by a single phase of seismic acceleration (Boué et al., 2015). The preliminary separation of signals originating from different sources can improve the results (Salvage and Neuberg, 2016; Salvage et al., 2017). Technically, nonlinear (power law) regression or non-Gaussian maximum likelihood methods can also enhance the accuracy of the forecasts, compared to linear models (Bell et al., 2011, 2013). In general, the forecasting accuracy of FFM has been related to the heterogeneity in the breaking material (Vasseur et al., 2015).
Sometimes the method fails to predict the time of material failure, and an improved probability assessment, including uncertainty quantification, is required. For example, unrest at large calderas is often characterized by variable rates and ambiguous signals (Woo and Kilburn, 2010; Chiodini et al., 2016). Accelerating trends can change shape during a sequence, and signals from one precursor can accelerate, while those from another remain constant, e.g., volcano-tectonic seismicity accelerating under constant rates of ground movement. Indeed, laboratory experiments and theoretical models have demonstrated the FFM under constant stress and temperature, and this is a hypothesis difficult to verify for realistic scenarios. Without this assumption, the FFM should be generalized to more fundamental relations between rock fracture and deformation, which imply time dependent changes in the power law expressing the precursor rate (Kilburn, 2012). This generalized approach has been applied to very long-term unrest at large calderas—including Rabaul, Papua New Guinea (Robertson and Kilburn, 2016), and Campi Flegrei, Italy (Kilburn et al., 2017). If the estimate of parameter α is assumed to evolve with time, its increase may be related to the change from quasi-elastic to inelastic rock behavior while approaching the eruption (Kilburn, 2018).
In this study, we enhance the classical FFM approach by incorporating a stochastic noise in the original ordinary differential equation (ODE), converting it into a stochastic differential equation (SDE), and systematically characterizing the uncertainty. Embedding noise in the model can enable the FFM equation to have greater forecasting skill by focusing on averages and moments. Sudden changes in the power law expression of are made possible. In our model, the prediction is thus perturbed inside a range that can be tuned, producing probabilistic forecasts. In the future our approach may lead to general formulations of FFM, and we remark that during the final approach to an eruption, the stochastic noise can already replicate local discrepancies from the assumption of both constant stress and temperature. We remark that our SDE-based approach is not equivalent to a Kalman Filter approach (Zhan et al., 2017). Stochastic noise is essential when coping with forecasting problems, because classical data assimilation methods naturally introduce a delay in the tracking of new unexpected dynamics, while the noise can anticipate nonlinear effects of perturbations. However, Ensemble Kalman Filters may efficiently mitigate these effects and produce good results as well (Houtekamer and Mitchell, 1998; Evensen, 2003).
In more detail, in the original equation the change of variables implies:
i.e., the solution η is a straight line which hits zero at tf. If α = 2 then , and the most commonly used graphical and computational methods rely on the regression analysis of inverse rate plots. We re-define η with:
also called Hull–White model in financial mathematics (Hull and White, 1990). The parameter σ defines the strength of the noise, and γ the rapidity of the mean-reversion property. We validate the new method on historical datasets of precursory signals already studied with the classical FFM in Voight (1988a), including line-length and fault movement at Mt. St. Helens, 1981–1982 (Chadwick et al., 1983; Swanson et al., 1983), seismic signals registered from Bezymyanny, 1960 (Tokarev, 1966, 1971, 1983), and surface movement of Mt. Toc, 1963 (Müller, 1964; Voight and Faust, 1982). We remark that the last dataset is not related to a volcanic eruption, but to the catastrophic slope failure above the Vajont Dam in NE Italy (Kilburn and Petley, 2003; Dykes and Bromhead, 2018).
A fundamental aspect of our formulation is the possibility of a doubly stochastic uncertainty quantification. Doubly stochastic models describe the effect of epistemic uncertainty in the formulation of aleatory processes, and have been successfully applied in volcanology (Sparks and Aspinall, 2004; Marzocchi and Bebbington, 2012; Bevilacqua, 2016). The division between aleatory uncertainty and epistemic uncertainty corresponds to the distinction between an intrinsic randomness of the system and the additional uncertainty that affects its representation, the latter originating from incomplete information. Thus, doubly stochastic probability density functions (pdf) and estimates are themselves affected by uncertainty. That is the reason for the name doubly stochastic (Cox and Isham, 1980; Bevilacqua, 2016). This approach has been applied in spatial problems concerning eruptive vent/fissure mapping (Selva et al., 2012; Bevilacqua et al., 2015, 2017a; Tadini et al., 2017a,b), long-term temporal problems based on past eruption record (Bebbington, 2013; Bevilacqua et al., 2016, 2018; Richardson et al., 2017), and hazard assessments (Neri et al., 2015; Bevilacqua et al., 2017b). In this study, we use a doubly stochastic model to develop a short-term eruption forecasting method based on precursory signals. We remark that these signals could be any time series related to material failure, e.g., seismic or deformational. However, robust forecasts are not guaranteed in every application, given the mechanical complexity of volcanoes and their magmatic systems.
The first part of this article defines the mathematical model adopted. In section 2 we present the equations in FFM method, in section 3 we define their enhancement with a mean-reverting SDE, and section 3 details the properties of the mean reversion. The second part of the article tests the model on historical datasets. In section 5 we define the fitting algorithm and compare retrospective analysis based on three different formulations of FFM. Section 6 tests the model on forecasting problems, and section 7 discusses the performance of the methods, showing the increased forecasting skill of the doubly stochastic formulation. Section 8 is a cautionary note on the limits of applicability of the FFM method.
2. The Failure Forecast Method ODE
The classical Failure Forecast Method (FFM) equation is:
where α ≥ 1, A > 0, and Ω:[0, T] → ℝ a precursor function, like ground or fault displacement, seismic strain release (Voight, 1988a). We remark that the equation cannot be applied to any precursory sequence, and assumes a constant rate of stress and temperature (Kilburn, 2018). For simplicity we call , and the Equation (1) reads:
If α = 1, the solution is the exponential X(t) = X(t0) exp [A(t − t0)]. However, most common observations in volcanology give α ∈ [1.7, 2.3]. We also note that if α < 1 a solution exists in [0, +∞] and does not diverge in finite time (Cornelius and Voight, 1995).
If α > 1, we see:
and the FFM equation becomes:
Simplifying again the notation, we can call η = X1−α, and the FFM reads:
We can solve this equation by immediate integration,
and equivalently:
The original method required fitting the two parameters α and A on the monitoring data, and then to estimate the time of failure tf, such that X(tf) = +∞, or equivalently η(tf) = 0. It follows:
and so:
We note that an estimate of η(t) is thus necessary to make forecasts, a non-trivial process if noise is assumed to be present. The effect of varying parameters α and A in the Equation (3) is displayed in Figures 1A,B. Our purpose is to forecast the failure time tf, and hence it is more practical to examine the plot of , shown in Figure 1B. The parameter α defines the convexity of that function - for α ≤ 2 it is convex, for α ≥ 2 it is concave. The value α = 2 produces a straight line. We call α the convexity parameter. In equation 2 the parameter A defines the constant slope of η, that is −A. Hence we call A the slope parameter.
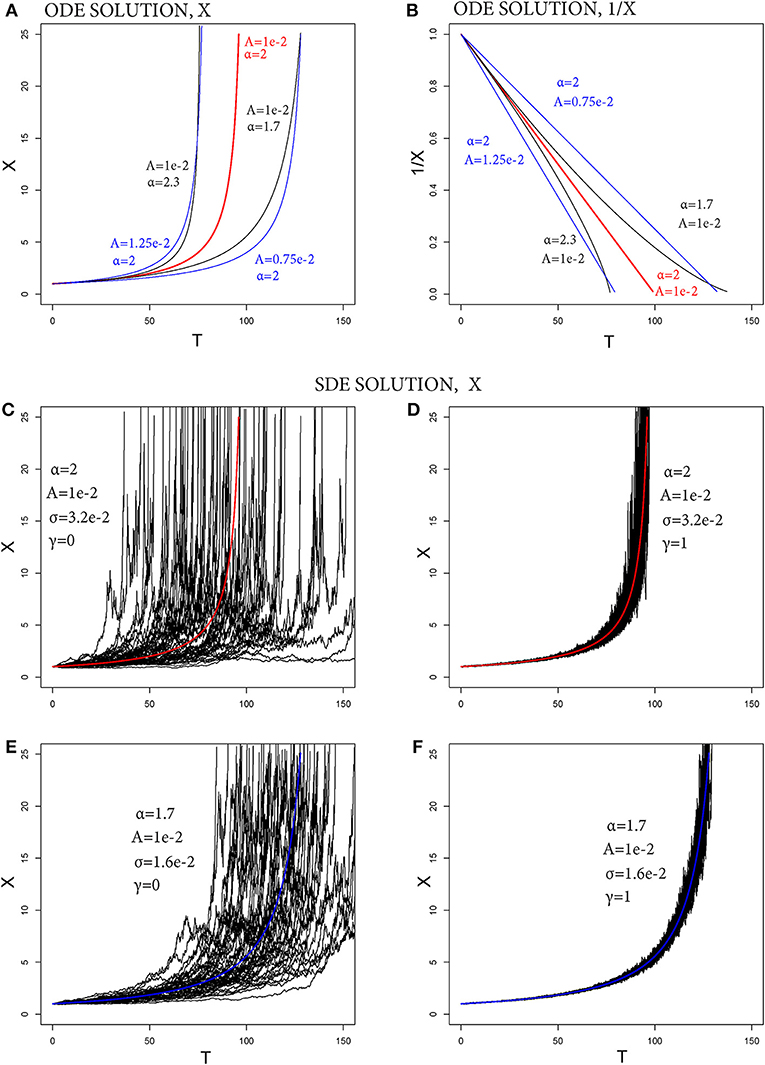
Figure 1. (A,B) Examples of ODE solution of FFM, (A) X, and (B) 1/X. (C–F) Examples of SDE solution of FFM, (C,E) with γ = 0, (D,F) with γ = 1. (C,D) with α = 2, (E,F) with α = 1.7. The colored lines are the ODE solutions, the black lines are 50 random paths of the SDE solutions.
3. The Failure Forecast Method SDE
We assume that the FFM equation is not exactly satisfied, but there is a transient difference, which however decreases exponentially through time. The equation becomes:
where β is the value at t = 0 and γ is the rate of decay of this error term.
This allows a reformulation as a differential equation. Given that:
then
We can take the derivative, and obtain:
and so
In addition, we want to allow for an additive noise affecting the new equation, and the final formulation is:
or equivalently (Gardiner, 2009):
for each t < tf. This is also called a Hull–White model in financial mathematics1 (Hull and White, 1990).
The effect of varying parameters σ and γ on the SDE solution X is displayed in Figures 1C–F. In Equation (5), σ defines the time scale of the additive noise, and so we call σ the noise parameter. We remark that X is nonlinearly affected by this random noise in Equation (6). The SDE defining η is elevated to the exponent , and even a relatively small amount of noise can significantly change the failure time (see Figures 1C,E). Parameter γ defines the time scale of the exponential decay of perturbations with respect to the mean solution. It controls the equation, reverting the paths of the solutions toward the mean curve (see Figures 1D,F). We call γ the mean-reversion parameter.
The new formulation allows the SDE solution to make random excursions from the classical ODE solution. Figure 2 displays three different solutions of X−1, assuming convexity parameter α = 1.7, 2, or 2.3. The slope parameter is fixed A = 0.1.
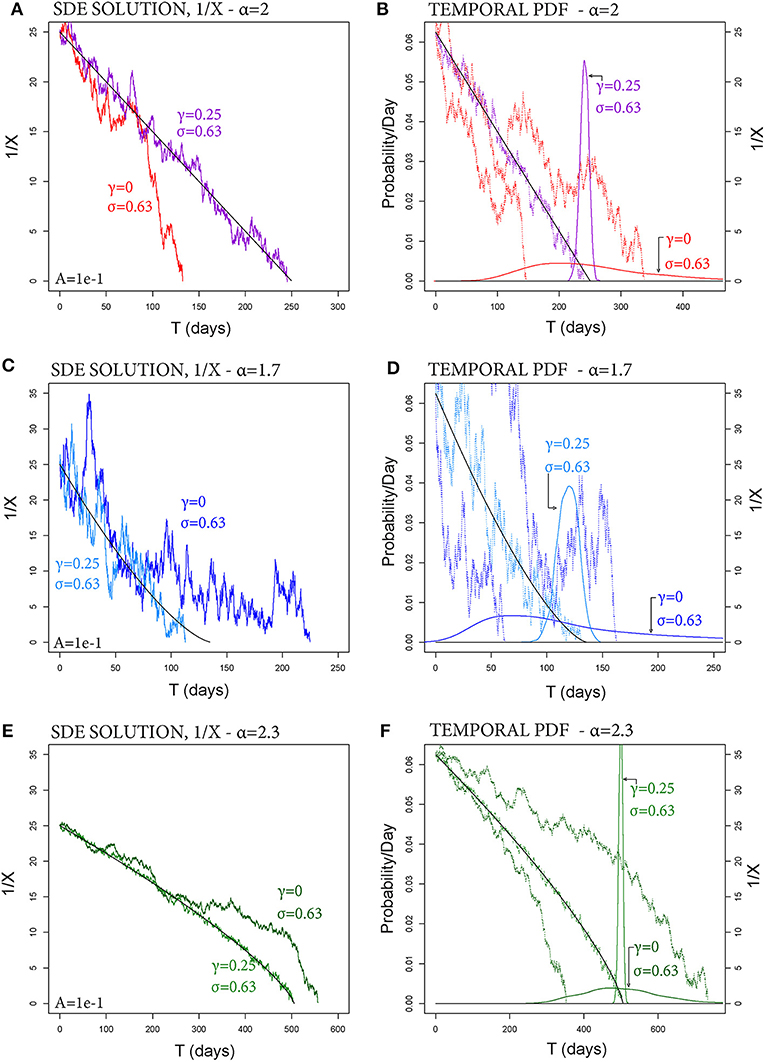
Figure 2. Examples of SDE solutions of FFM, 1/X, (A,B) with α = 2, (C,D) with α = 1.7, (E,F) with α = 2.3. A black line marks the mean solution. In (A,C,E) the colored lines are random paths, with γ = 0 or γ = 0.25. In (B,D,F) the colored continuous lines are the pdfs of tf, and random paths are dotted lines.
Figures 2A,C,E show an example of solutions assuming mean-reversion parameter γ = 0, or γ = 0.25. The noise is additive in Figure 2A, and weakly non-linear in Figures 2C,E. We note that although σ and γ define the noise affecting η, the same (α, γ) can produce significantly different noise effects on X−1 depending on the exponent .
A very important consequence of our stochastic formulation is that the time of failure becomes a random variable:
for almost every ω ∈ Ω, where is the filtration generated by the noise2, and P is a probability measure over it (Karatzas and Shreve, 1991). Figures 2B,D,F display the probability density functions3 of tf calculated by Monte Carlo simulation (2,000 samples). The pdf becomes more peaked and symmetric when γ > 0.
4. The Mean-Reversion Properties
Let be the ODE solution with data η(t0) at time t0. If σ > 0 and γ = 0, the law of Brownian Motion and the linearity of the ODE imply that:
If γ > 0 then is reduced to zero exponentially. If σ = 0 and the equation starts with we have:
Figure 3A shows this example, and 3γ−1 provides the time interval required to have δ(t) ≃ δ(t0)/20. If both σ > 0 and γ > 0, the combined effect of the noise and the mean-reversion defines the Ornstein-Uhlenbeck process4 (Gardiner, 2009), from Equation (5) with A = 0 and ηt0 = 0,
whose solution is:
when γ |tf − t0| ≫1. The constant
uniquely defines the probability distribution of the solution of this SDE. Different realizations of this process are displayed in Figure 3B.
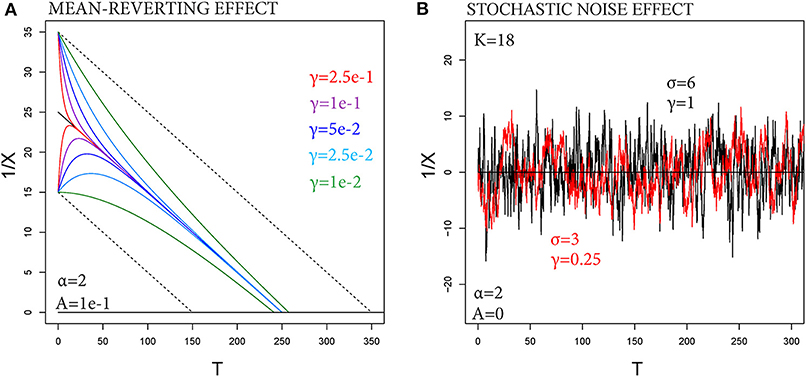
Figure 3. (A) SDE solutions with α = 2, 1/X, with σ = 0, but δ(t0) > 0. Different colors correspond to different values of γ. (B) Ornstein-Uhlenbeck processes with equal , but different (σ, γ).
If σ2 increases and γ decreases, then the perturbations are more frequent, but reverted faster. This may have some effect on the estimate of tf, but discrete data cannot provide any information on perturbations occurring at frequency higher than the measurements. In most of our examples we define γ−1 = 15 days. That is, any perturbation decays by 63% within 15 days, and by 95% within 45 days, which is close to the total length of the time interval considered. Sensitivity analysis on this parameter is performed in Appendix A, Supplementary Material.
5. Parameter Fitting and Uncertainty Quantification
The application of our method requires the estimation of five parameters5:
• curvature parameter α,
• slope parameter A,
• noise parameter σ,
• mean-reversion parameter γ,
• an unperturbed initial value .
We assume all these parameters to be positive, and α > 1. In particular, the case α = 1 is trivial, and the cases α < 1 or A ≤ 0 imply tf = +∞. We note that cannot be defined equal to the first observation, because of the perturbations. We remark that, for simplicity, we assume α to be constant.
Several techniques have been adopted in the determination of the parameters in the ODE problem (Cornelius and Voight, 1995). The Log-rate vs. Log-acceleration Technique (LLT), and the Hindsight Technique (HT) can both provide estimates of α. We take advantage of these classical analyses also in our examples6, and we rely on the calculations in Voight (1988a) reported in Appendix B, Supplementary Material. The LLT is generally less accurate because it needs an estimate of the time derivative of the observations, and the logarithm is not well defined on negative numbers. The HT requires that we know the eruption onset te, and hence can only be used in retrospective analysis. We remark that the time derivatives are always based on Voight (1988a), and not affected by the roughness of the paths of the new SDE formulation.
If α is given, then a linearized least square method can be used to fit parameter A and on the inverse plot 1/X. This is the main method classically adopted as a forecasting technique in the ODE problem. In particular, we apply a linear regressive model to Equation (2):
producing estimates of (1 − α)A and .
Finally, we fit the noise parameter σ on the residuals of this linearized problem, by imposing the constant to be equal to their variance and assuming γ−1 = 15 days, as explained in section 4. In summary, we plug-in α from classical LLT or HT, then we obtain , and thus σ once γ is given. The numerical solution of the SDE is performed by the Euler-Maruyama method, which is equivalent to the Milstein method in our case (Kloeden et al., 1994).
In the following we apply three different forecast methods on the datasets in Voight (1988a), and we test tf as an estimator of the eruption onset (or landslide initiation) te. Method 1 and Method 2 provide complementary assessments. The first models the uncertainty affecting the parameters in the classical ODE, the second provides SDE solutions based on the best-fit of those parameters. Method 3 combines the two approaches and represents one as epistemic uncertainty and the other as aleatoric uncertainty. We remark that, in general, aleatoric uncertainty describes the physical variability of a system under study, while epistemic uncertainty is due to our imperfect knowledge of the modeling of the system (Marzocchi and Bebbington, 2012; Bevilacqua, 2016).
In all our methods tf is assumed as a random variable, and its pdf
is estimated following a classical Gaussian kernel density estimator. Parameter fitting is based on Monte Carlo simulations of different number of samples depending on the method. This number has been tuned to obtain a robust estimate of gtf that is not sensitive to including additional samples. We remark that we are producing forecasts and not deterministic predictions, and hence the value of gtf(te) ≤ 1. This is not a flaw of our approach, but a crucial consequence of its probabilistic formulation.
• Method 1 solves the classical ODE, and the corresponding forecasts are displayed in Figure 4. In particular, gtf depends on the uncertainty affecting α and the pair in the regression method. We implement this model uncertainty as a bivariate Gaussian in a Monte Carlo simulation of 5,000 samples.
• Methods 2 and 3 are both based on the new SDE.
• In Method 2, the least-square curve is assumed to be the mean solution, and gtf is defined by the noise. The forecasts are displayed in Figure 5. We implement this aleatory uncertainty in a Monte Carlo simulation of 5,000 sample paths of the stochastic noise.
• Method 3 is doubly stochastic (e.g., Bevilacqua, 2016). The mean solution is affected first by the uncertainty in the regression method, and then perturbed by the stochastic noise defined above. The values of gtf are thus reported as 5th percentile, mean, and 95th percentile curves. We remark that the two uncertainties are not independent, because the properties of the noise are related to the residuals in the linearized problem. The forecasts are displayed in Figure 6. In this case, the mean pdf is based on a Monte Carlo simulation of 10,000 samples. However, the percentile values are based on a hierarchical Monte Carlo simulation of 60,000 samples, that is the product of 200 parameter samples and 300 paths of the SDE solution. The higher number of samples is made necessary by the higher complexity in the probability space, that models the uncertainty in two steps (Bevilacqua, 2016).
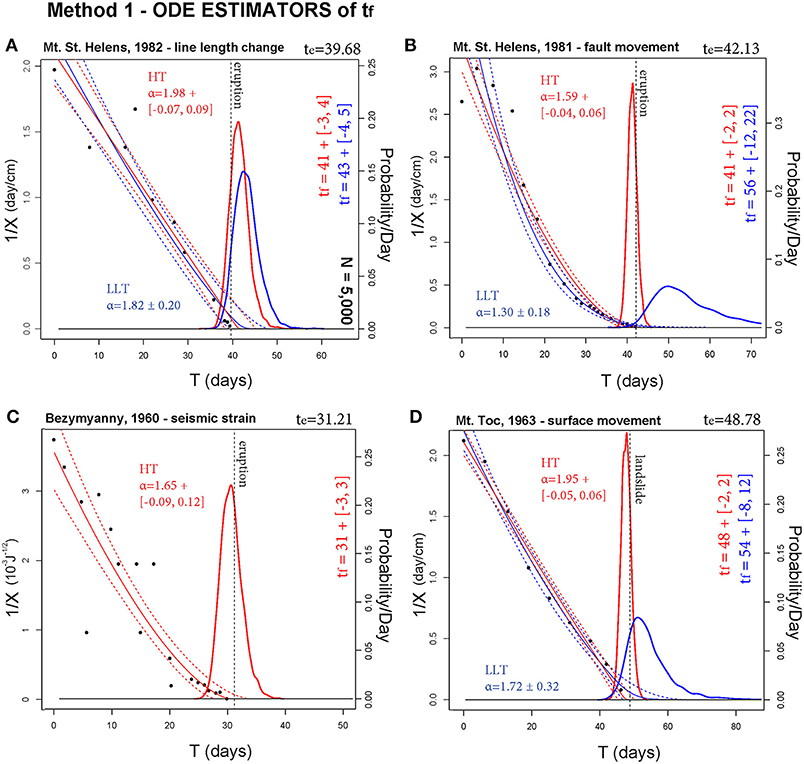
Figure 4. Estimators of tf based on Method 1. In (A–D) are reported four different case studies. Blue lines assume α as from LLT, red as from HT. The bold line is gtf. The probability/day scale bar is related to gtf. Thin dashed lines bound the 90% confidence interval of the ODE paths of 1/X, and a thin continuous line is the mean path. Black points are inverse rate data. A dashed black line marks te. Method 1 generally provides a good estimator of te, but often only the HT analysis allows these robust estimates because of the lower uncertainty affecting α.
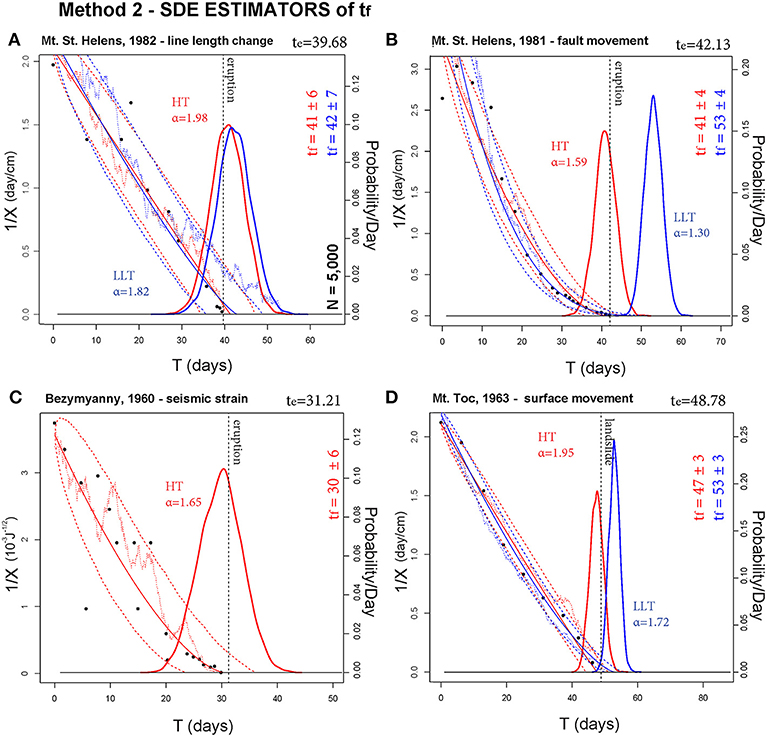
Figure 5. Estimators of tf based on Method 2. In (A–D) are reported four different case studies. Blue lines assume α as from LLT, red as from HT. A bold line is gtf. The probability/day scale bar is related to gtf. Thin dashed lines bound the 90% confidence interval of the SDE paths of 1/X, and a thin continuous line is the mean path. Black points are inverse rate data. Thin dotted lines show examples of random paths. A dashed black line marks te. Method 2 reduces the overestimation issues of LLT observed in Method 1 (see Figure 5), but model uncertainty is neglected.
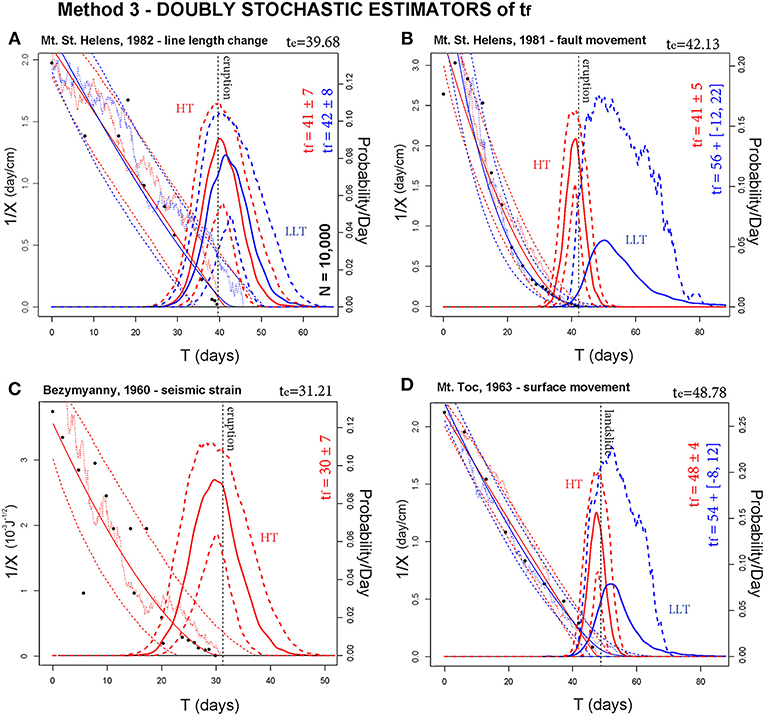
Figure 6. Estimators of tf based on Method 3. In (A–D) are reported four different case studies. Blue lines assume α as from LLT, red as from HT. A bold line is gtf, and bold dashed lines are its 5th and 95th percentile values. The probability/day scale bar is related to gtf and its percentile values. Thin dashed lines bound the 90% confidence interval of the SDE paths of 1/X, and a thin continuous line is the mean path. Thin dotted lines show examples of random paths. Black points are inverse rate data. A dashed black line marks te. Method 3 enhances Method 2 and performs significantly better.
Our four case studies refer to the volcanic eruptions of Mt. St. Helens (USA), 1982 (a) and 1981 (b), and of Bezymyanny (USSR), 1960 (c), and to the landslide of Mt. Toc (Italy), 1963 (d), which caused the Vajont Dam disaster. In more detail, dataset (a) is comprised of line-length measurements of the Mount St. Helens crater floor collected in February-March 1982. The floor was contracting as a consequence of endogenous inflation against the relatively rigid crater walls (Swanson et al., 1983). Dataset (b) contains the cumulative contraction measured across the toe of the Christina 2 thrust fault in July-September 1981, Mount St. Helens (Swanson et al., 1983). Dataset (c) is the cumulative strain release registered at Bezymyanny in March-April 1960. This quantity is the square root of seismic energy, and hence it depends on both the number of earthquakes and their magnitude (Tokarev, 1983). Dataset (d) is comprised of the ground displacement measures taken on the northern slope of Mt. Toc in August-October 1963, by means of daily topographical surveys (Müller, 1964). We remark that dataset (d) is not related to a volcanic eruption. These datasets are characterized by different values of α, and by different confidence intervals in the linear regression. Estimates of α are based on data reported in Appendix B, Supplementary Material.
In general, the mean path is consistent in the three methods, but uncertainty quantification is significantly different, as well as the values of gtf. In particular:
(a) Mt. St. Helens, 1982—line length change. Data values are initially scattered, until t = te−20, and then become more aligned. α ≈ 2, and E[tf] overestimates te of 1–3 days in all the methods. Uncertainty range is two-times larger in Method 2 and 3 compared to Method 1.
(b) Mt. St. Helens, 1981—fault movement. This example is characterized by α ≈ 1.6 in HT and α = 1.3 ± 0.2 in LLT. In the first case (red), in all methods E[tf] underestimates te by only 1 day, with uncertainty range ±2 days in Method 1, and two-times larger in Method 2 and 3. The second case (blue) is less accurate. In Method 1, 2, and 3 E[tf] overestimates te by 14, 11, and 14 days, respectively; always outside the uncertainty range. However, in Method 3 the 95th percentile plot is above 9% at time te.
(c) Bezymyanny, 1960—seismic strain. Data values are persistently scattered until t = te − 10, and α ≈ 1.6. In Method 1, E[tf] correctly estimates te, with uncertainty range of ±3 days. In Methods 2 and 3, E[tf] underestimates te by 1 day with an uncertainty range two-times larger.
(d) Mt. Toc, 1963—surface movement. According to HT, α≈2, while according to LLT, α = 1.7±0.3. In the first case (red), in Method 1 and 3 E[tf] correctly estimates te, and in Method 2 it underestimates it by 1 day. Uncertainty range is ±2 days in Method 1, ±3 days in Method 2, ±4 days in Method 3. In the second case (blue), in Method 1 E[tf] overestimates te by 5 days, but the uncertainty range is about ±10 days and captures it. In Method 2 E[tf] overestimates te by 4 days, but uncertainty is reduced to ±3 days. Method 3 gives very similar results to Method 1, and the 95th percentile plot is above 20% at time te.
In summary, when α ≈ 2 Method 1 generally provides a good estimator of te, as well as Methods 2 and 3. A good estimate of te when α = 2 is recognized by Voight (1988a), and this is studied further in Kilburn (2018). Methods 2 and 3 generally have larger uncertainty ranges. Sometimes, when α ≤ 1.6, Method 1 tends to overestimate te. Method 2 reduces this issue, but model uncertainty is neglected and the estimate still misses te. Method 3 enhances Method 2, and its doubly stochastic nature allows the production of either mean probability values or more conservative 95th percentile values, with significantly high probability of eruption at time te, even when the mean estimate fails the forecast.
6. Examples of Probability Forecasts
The estimators defined in the previous section are informed by the entire sequence of data, up to the eruption onset or landslide initiation te. This provides useful insight on the validity of the model, but it is not a forecast (Boué et al., 2015). Indeed in any forecasting problem the sequence of data is available up to a time t1 < te, that represents the current time of potential forecast. All the data collected after time t1 cannot be considered.
In the following figures we display forecasts of te based on the FFM method, and obtained from the data collected in a limited time window T = [t2, t1], except for the value of α. The noise, when modeled, starts at time t1, and the initial value x0: = X(t1) is estimated in absence of noise. We focus on the two examples of Mt. St. Helens, 1982—line length change (α = 1.98 ± 0.09), and Bezymyanny, 1960—seismic strain (α = 1.65 ± 0.12). We remark that, for the sake of simplicity, the value of α is still based on the entire sequence of data (see Appendix B, Supplementary Material). Further studies on the evolution of parameter α would require less sparse data than those available in our examples. The modeling of time-dependent α, or the implementation of nonlinear regression techniques, is an open area of research (Bell et al., 2011; Kilburn, 2018).
Figure 7 adopts Method 1, Figure 8 Method 2, and Figure 9 Method 3. Method 1 and mean pdf in Method 3 both implement a Monte Carlo simulation of 20,000 samples, Method 2 a Monte Carlo simulation of 5,000 samples. The percentile values in Method 3 are based on a hierarchical Monte Carlo simulation of 150,000 samples, that is the product of 300 parameter samples and 500 paths of the SDE solution.
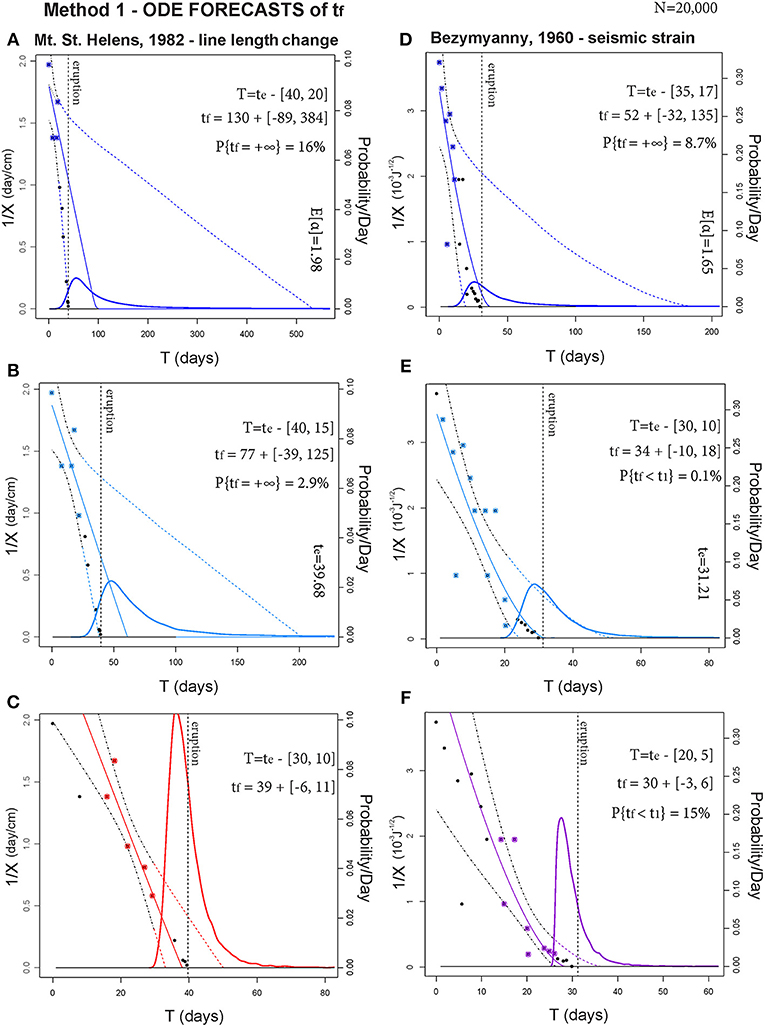
Figure 7. Forecasts of tf based on Method 1. In (A–C) and (D–F) respectively, two examples are tested on three different time windows T. The bold line is gtf. Thin dashed lines bound the 90% confidence interval of the ODE paths, and a thin continuous line is the mean path. The points are inverse rate data, those in T are colored. A dashed black line marks te. The probability/day scale bar is related to gtf.
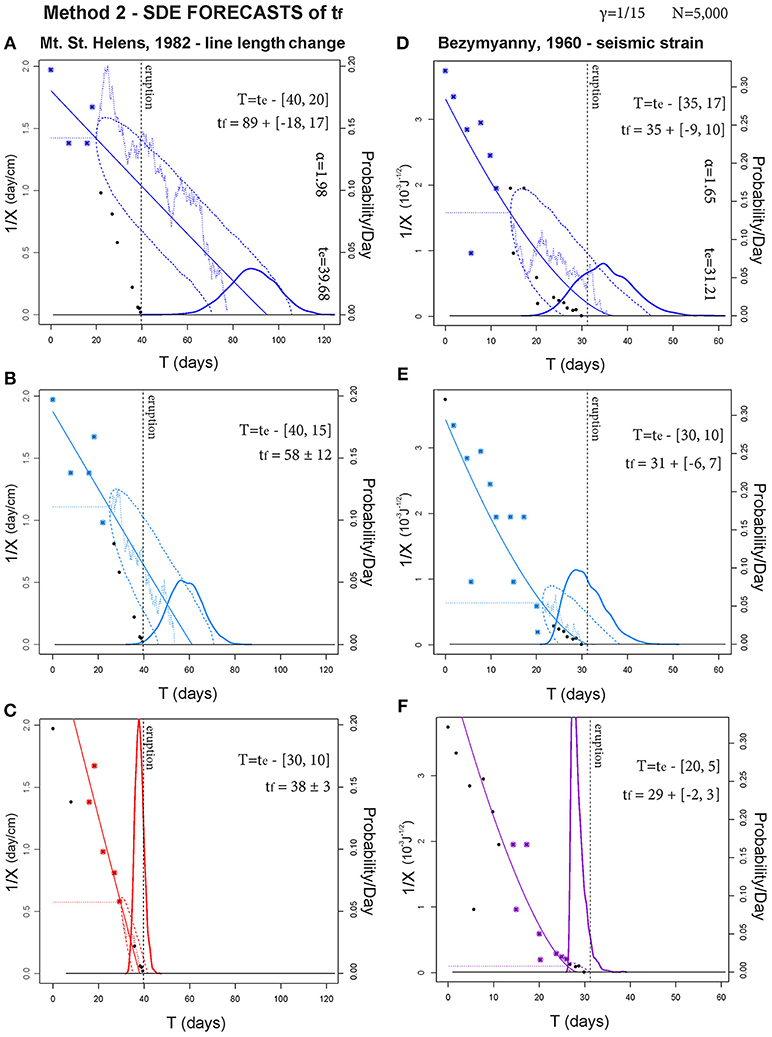
Figure 8. Forecasts of tf based on Method 2. In (A–C) and (D–F) respectively, two examples are tested on three different time windows T. The bold line is gtf. Thin dashed lines bound the 90% confidence interval of the SDE paths, and a thin continuous line is the mean path. Thin dotted lines show examples of random paths. The points are inverse rate data, those in T are colored. A thin dashed line marks 1/x0, and a dashed black line marks te. The probability/day scale bar is related to gtf.
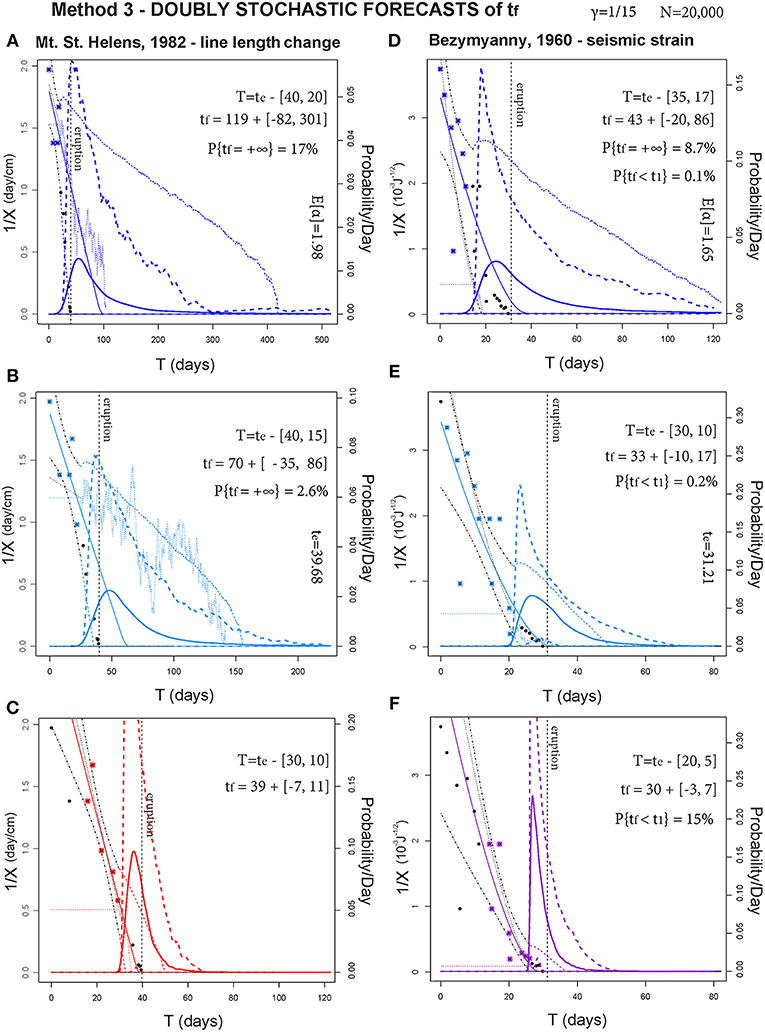
Figure 9. Forecasts of tf based on Method 3. In (A–C) and (D–F) respectively, two examples are tested on three different time windows T. The bold line is gtf, and bold dashed lines are its 5th and 95th percentile values. Thin dashed lines bound the 90% confidence interval of the SDE paths, and a thin continuous line is the mean path. Thin dotted lines show examples of random paths. The points are inverse rate data, those in T are colored. A thin dashed line marks 1/x0, and a dashed black line marks te. The probability/day scale bar is related to gtf and its percentile values.
If we compare these results with the estimators in section 5, forecast results can be significantly more uncertain, because they are inherently extrapolations based on fewer data. In Methods 1 and 3, sometimes P{tf = ∞} > 0 and there is a non-negligible chance that the solution path never hits the real axis. In contrast, if P{tf < t1} > 0 there is a chance that and the equation is not well defined. The probability of both these events is quantified.
In our examples we consider three time windows T progressively moving toward te. In general, uncertainty is always reduced while T gets closer to te. In particular:
(a) Mt. St. Helens, 1982—line length change. If t1 = te−20, in Method 1 E[tf] overestimates te by 90 days, in Method 2 by 40 days, in Method 3 by 80 days. Uncertainty is [−89, +384] days in Method 1, [−18, +17] days in Method 2, and [−82, +301] days in Method 3. Only in Method 2 does E[tf] fall outside the uncertainty range, and the 95th percentile plot in Method 3 is about 6% at time te. In Methods 1 and 3, P{tf = ∞} > 15%.
(b) If t1 = te − 15, in Method 1 E[tf] overestimates te by 37 days, in Method 2 by 18 days, in Method 3 by 30 days. Uncertainty is [−39, +125] days in Method 1, ±12 days in Method 2, and [−35, +86] days in Method 3. Again only in Method 2 does E[tf] fall outside the uncertainty range, and 95th percentile plot in Method 3 is about 8% at time te. In Methods 1 and 3, P{tf = ∞}≈2%.
(c) If t1 = te − 10, in Method 1 E[tf] correctly estimates te, with an uncertainty range of [−6, +11] days. In Method 2 E[tf] underestimates te by 1 day, with an uncertainty range of ±3 days. Method 3 performs similarly to Method 1, and its 95th percentile plot is about 16% at time te.
(d) Bezymyanny, 1960—seismic strain. If t1 = te − 17, in Method 1 E[tf] overestimates te by 21 days, in Method 2 by 4 days, in Method 3 by 12 days. Uncertainty is [−32, +135] days in Method 1, [−9, +10] days in Method 2, and [−20, +86] days in Method 3. In all methods E[tf] falls inside the uncertainty range, and 95th percentile plot in Method 3 is about 7.5% at time te. In Methods 1 and 3, P{tf = ∞} ≈ 9%.
(e) If t1 = te − 10, in Method 1 E[tf] overestimates te by 3 days, in Method 2 it estimates te correctly, in Method 3 it overestimates te by 2 days. Uncertainty is [−10, +18] days in Method 1, [−6, +7] days in Method 2, and [−10, +17] days in Method 3. The 95th percentile plot in Method 3 is about 10% at time te.
(f) If t1 = te − 5, in Method 1 E[tf] underestimates te by 1 day, in Method 2 by 2 days. Method 3 performs similarly to Method 1. Uncertainty is [−3, +6] days in Method 1, [−2, +3] days in Method 2, and [−3, +7] days in Method 3. The 95th percentile plot in Method 3 is about 16% at time te. We remark that in Methods 1 and 3, P{tf < t1} ≈ 15%.
In summary, for these cases the forecasting results of Method 1 and Method 3 are similar, but the more complex uncertainty quantification related to Method 3 improves its performance. In particular, when the forecast is not well constrained, Method 3 generally reduces the uncertainty range of the estimates if compared to Method 1. Indeed the noise can push 1/X to zero in advance, when it is decreasing asymptotically. Method 2 tends to give a correct forecast only when the eruption is close. The doubly stochastic formulation of Method 3 appears to have an impact, and the 95th percentile of the eruption probability is significantly high at time te.
7. Discussion
We described three different methods for estimating tf, the ODE-based Method 1, the new SDE-based Method 2, and their combined doubly stochastic formulation Method 3. We tested the methods in four case studies, and in two of them we also performed forecasts on moving time windows.
Figure 10 summarizes the likelihood gtf(te), reported as a probability percentage. Figure 10A compares Method 1 (black bars) and Method 2 (colored bars). Method 1 always outperforms Method 2 when α is based on the more accurate Hindsight Technique (red bars), and provides likelihoods above 15%. In contrast, when α is based on Log-rate vs. log-acceleration technique (LLT) (blue bars) the two methods provide lower likelihoods, below 1% in some case. Figure 10B displays the likelihood provided by the doubly stochastic Method 3. Full colored bars report the mean likelihood, shaded bars the 95th percentiles of the likelihood. Mean likelihoods are very similar or above those provided by Method 2. The 95th percentile values are significantly higher. In particular, when α is based on LLT (blue bars), Method 3 percentiles are all higher than in Method 1.
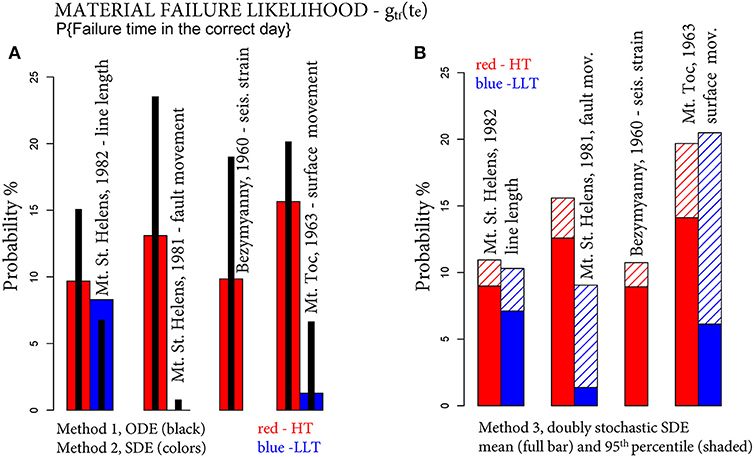
Figure 10. Column plots of the likelihood gtf(te), i.e., the probability of failure time tf in the correct day te. In (A) the black bars assume Method 1, the colored bars Method 2. (B) Assumes Method 3, and the full bars are the mean values, and the shaded bars are the 95th percentile values of the likelihood.
These features are confirmed and strengthened in the forecasting examples based on the moving windows. Figure 11 summarizes the corresponding gtf(te). Figure 11A compares Method 1 (black bars) and Method 2 (colored bars). In Mt. St. Helens, 1982—line length change (blue), Method 2 outperforms Method 1 only in the third time window, with the only likelihood above 10%. In Bezymyanny, 1960—seismic strain (red), Method 2 outperforms Method 1 in the first two time windows, with likelihoods above 5%. Figure 11B concerns the doubly stochastic Method 3. Full colored bars report the mean likelihood, shaded bars its 95th percentile values. In this case, mean likelihoods are very similar to those provided by Method 1. The 95th percentile values are again significantly higher, from 5 to 10% in the first and second time windows, and above 15% in the third.
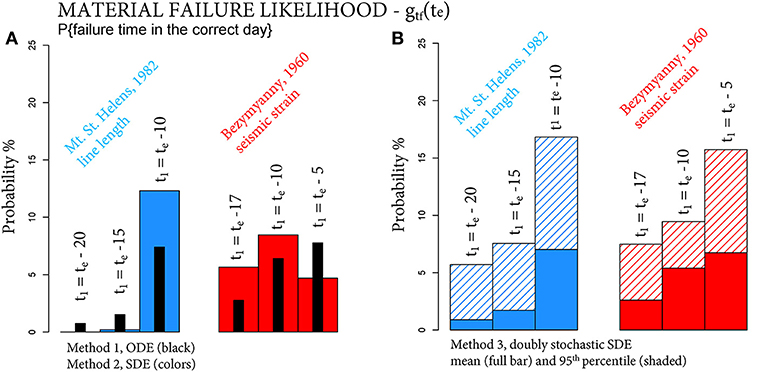
Figure 11. Column plots of the likelihood gtf(te) in two forecasting examples, on three different time windows. In (A) the black bars assume Method 1, the colored bars Method 2. (B) Assumes Method 3, and the full bars are the mean values, and the shaded bars are the 95th percentile values of the likelihood.
We note that the higher number of parameters involved in Model 2 and 3 compared to Model 1 is not implying over-fitting of the results, because of the epistemic uncertainty affecting them. We also remark that the new methods are not requiring more data or more difficult data processing than the classical formulation. In a real crisis, they could enhance the possible interpretations of collected signals, without a significant increase in computational effort.
8. A Cautionary Note for Practical Applications
Despite our enhancement of the FFM method, we add this word of caution to its practical application in hazards evaluation. The examples used in our paper involved relatively well-conditioned data. Data encountered at other volcanoes may be less regular. The FFM method may provide valuable parameters for decision making, but it is one which obviously cannot guarantee success in every application, given the mechanical complexity of volcanoes and their magmatic systems, and the variety volcanoes display in their behavior. For instance, the possibility for false alarms is not eliminated by this method, and included in this category is the “arrested” (or failed) eruption, in which the volcano displays the precursory symptoms typical of an eruption, but does not culminate with magma reaching the surface (Cornelius and Voight, 1995). The 1983–1985 crisis at Rabaul caldera, Papua New Guinea, provides one such example (McKee et al., 1984; Tilling, 1988; Robertson and Kilburn, 2016). This phenomenon is typical of calderas (Acocella et al., 2015), and other examples include Campi Flegrei, Italy, bradiseismic crises of 1968–1970 and 1982–1985 (Bianchi et al., 1987; Gaudio et al., 2010; Giudicepietro et al., 2017; Troise et al., 2019), Long Valley volcanic region, California (USA), in 1978–2000 (Hill, 2006; Montgomery-Brown et al., 2015; Hildreth, 2017; Hill et al., 2017), Santorini, Greece, in 2011–2012 (Newman et al., 2012), and Yellowstone, Wyoming (USA), in 2004–2010 (Chang et al., 2010).
At Redoubt volcano, Alaska (USA), analyses in hindsight revealed precursory Real-time Seismic-Amplitude Measurement (RSAM) rate changes prior to the dome-destroying eruption of January 2, 1990, of sufficient consistency, duration and intensity to enable quantitative evaluation by classical FFM (Voight and Cornelius, 1990, 1991). However, the frequent dome collapse events between February and April, 1990 (about 15 events in 112 days) during nearly continuous exogenous dome building at low extrusion rate were associated with erratic and short-lived seismic trends (Cornelius and Voight, 1994), and forecasting exclusively based on RSAM would have been misleading. Instead, inverse Real-time Seismic Spectral Amplitude Measurement (SSAM) plots would have been informative for early detection of long-period seismicity of low energy content, typical for this type of eruption (Hyman et al., 2018).
Although we know that the failure time does not always mean eruption time, it could be argued, if the geophysical signal looks different after the failure time, that the failure time is likely a time of state transition. For example, if the background seismicity rate in many cases drops dramatically after the failure time, then we could say that the failure time was a time of transition between a time of stress release by microseismicity, and a time of relatively quiescent stress build up. Further research could focus on the meaning of the probabilistic estimates of failure time in case of arrested eruptions.
In summary, a remaining goal is whether precursory signals can distinguish between pre-eruptive and non-eruptive outcomes, and whether seismic rates will accelerate to bulk failure without an interval of steady behavior (Kilburn, 2018). Thus, the limitations of FFM should be appreciated by the user. However, under appropriate circumstances and with mature judgment, the tool might serve an important role for those responsible for evaluating and managing volcanic crises.
9. Conclusions
In this study, we have introduced a new doubly stochastic method for performing material failure forecasts. The method enhances the well known FFM equation, introducing a new formulation similar to the Hull-White model. The model is a mean-reverting SDE, which assumes the traditional ODE as the mean solution. New parameters include the noise standard deviation σ and the mean-reversion rapidity γ. They are estimated based on the properties of the residuals in the original linearized problem. The implementation allows the model to make excursions from the classical solutions, including the possibility of some degree of aleatory uncertainty in the estimation. This may replicate the effect of local discrepancies from a state of constant stress and temperature. Thus, we provided probability forecasts instead of deterministic predictions.
We compared the new method and the forecasting method based on the classical formulation. We also compared an Hull-White model without considering the model uncertainty, and its doubly stochastic formulation. A comparison is performed on four historical datasets of precursory signals already studied with the classical FFM, including line-length and fault movement at Mount St. Helens, 1981–82, seismic signals registered from Bezymyanny, 1960, and surface movement of Mt. Toc, 1963. We also considered forecasting problems over moving time windows, based on data in the case studies of Mount St. Helens, 1982 and Bezymyanny, 1960. The data shows the performance of the methods across a range of possible values of convexity α and amounts of scattering in the observations, and the increased forecasting skill of the doubly stochastic formulation in Method 3.
The doubly stochastic formulation is particularly important to forecasting because it enables the calculation of the 95th percentiles of the probability of failure. These values are generally higher than the mean estimates, and could be interpreted as the worst case scenario with a probability of occurrence above 5%. This was not possible in the classical formulation. This approach is the subject of ongoing and future work, with the purpose to further enhance short-term eruption forecasting robustness, for example exploring the sensitivity on a linear or polynomial evolution of the parameter α with time, or a more general structure of the noise. Further examination of arrested eruptions also represents a very important field of research.
10. List of Parameters and Symbols
For the sake of clarity, we include a list of all parameters and symbols used in the study:
Precursors Functions Ω is a time dependent precursor signal, is its rate, is the linearized expression of X.
Model Parameters α defines the convexity of X−1, A is the slope of η, σ is the strength of the noise, γ is the speed of mean-reversion, scales the variance of the perturbations in a stationary limit.
Time Values t0 is the initial time of observation, T = [t1, t2] is the time window in forecasting examples, and x0 = X(t1). tf = inf{t : η(t) = 0} is the failure time, gtf its pdf, and te the occurred eruption onset or landslide initiation
Error Terms is the ODE solution when compared to the SDE solution, is the time dependent difference between them.
Author Contributions
AB, EP, and AP conceived the main conceptual ideas. AB developed the theoretical formalism, implemented and performed the simulations and optimization calculations, interpreted the computational results, and wrote the paper. All authors discussed the results, commented on the manuscript, provided critical feedback, and gave final approval for publication.
Funding
This work was supported by National Science Foundation awards 1339765, 1521855, 1621853, and 1821311, and by Italian Ministry of Education, University, and Research, project FISR2017—SOIR. This work does not include any unpublished experimental data.
Conflict of Interest Statement
The authors declare that the research was conducted in the absence of any commercial or financial relationships that could be construed as a potential conflict of interest.
Supplementary Material
The Supplementary Material for this article can be found online at: https://www.frontiersin.org/articles/10.3389/feart.2019.00135/full#supplementary-material
Footnotes
1. ^The Hull–White model is utilized to describe the evolution of interest rates. The instantaneous interest rate is randomly perturbed by market noise, but it stabilizes statistically inside a corridor of variance defined around a deterministic function, i.e., the long term rate.
2. ^For each t > t0, is the set of all the events that are defined by the random realizations of the noise Wt up to time t. models the amount of information that is available at time t. It plays an important role in the formalization of X.
3. ^In probability theory, a pdf, or density, of a real continuous random variable η, is a function such that for any given measurable set H ⊆ ℝ, .
4. ^The Ornstein-Uhlenbeck process is a Gaussian process with bounded variance and a stationary probability distribution. The mean value of the distribution acts as an equilibrium level for the process, which is thus called mean-reverting.
5. ^A list of all parameters and symbols is included in section 10 of this article.
6. ^The LLT estimate of α is not well constrained on the ymyanny dataset. We did not apply our analysis to that case.
References
Acocella, V., Di Lorenzo, R., Newhall, C., and Scandone, R. (2015). An overview of recent (1988 to 2014) caldera unrest: knowledge and perspectives. Rev. Geophys. 53, 896–955. doi: 10.1002/2015RG000492
Bebbington, M. S. (2013). Assessing spatio-temporal eruption forecasts in a monogenetic volcanic field. J. Volcanol. Geotherm. Res. 252(Suppl. C), 14–28. doi: 10.1016/j.jvolgeores.2012.11.010
Bell, A. F., Naylor, M., Heap, M. J., and Main, I. G. (2011). Forecasting volcanic eruptions and other material failure phenomena: an evaluation of the failure forecast method. Geophys. Res. Lett. 38:5. doi: 10.1029/2011GL048155
Bell, A. F., Naylor, M., and Main, I. G. (2013). The limits of predictability of volcanic eruptions from accelerating rates of earthquakes. Geophys. J. Int. 194, 1541–1553. doi: 10.1093/gji/ggt191
Bevilacqua, A. (2016). Doubly stochastic models for volcanic hazard assessment at campi flegrei caldera, Vol. 21. Theses, Edizioni della Normale, Pisa: Birkhäuser; Springer.
Bevilacqua, A., Bursik, M., Patra, A., Pitman, E., Qingyuan, Y., Sangani, R., et al. (2018). Late Quaternary eruption record and probability of future volcanic eruptions in the Long Valley volcanic region (CA, USA). J. Geophys. Res. 123, 5466–5494. doi: 10.1029/2018JB015644
Bevilacqua, A., Bursik, M., Patra, A., Pitman, E., and Till, R. (2017a). Bayesian construction of a long-term vent opening map in the Long Valley volcanic region, (CA, USA). Stat. Volcanol. 3, 1–36. doi: 10.5038/2163-338X.3.1
Bevilacqua, A., Flandoli, F., Neri, A., Isaia, R., and Vitale, S. (2016). Temporal models for the episodic volcanism of Campi Flegrei caldera (Italy) with uncertainty quantification. J. Geophys. Res. 121, 7821–7845. doi: 10.1002/2016JB013171
Bevilacqua, A., Isaia, R., Neri, A., Vitale, S., Aspinall, W. P., Bisson, M., et al. (2015). Quantifying volcanic hazard at Campi Flegrei caldera (Italy) with uncertainty assessment: 1. Vent opening maps. J. Geophys. Res. 120, 2309–2329. doi: 10.1002/2014JB011775
Bevilacqua, A., Neri, A., Bisson, M., Esposti Ongaro, T., Flandoli, F., Isaia, R., et al. (2017b). The effects of vent location, event scale, and time forecasts on pyroclastic density current hazard maps at Campi Flegrei caldera (Italy). Front. Earth Sci. 5:72. doi: 10.3389/feart.2017.00072
Bianchi, R., Coradini, A., Federico, C., Giberti, G., Lanciano, P., Pozzi, J. P., et al. (1987). Modeling of surface deformation in volcanic areas: the 1970–1972 and 1982–1984 crises of campi flegrei, Italy. J. Geophys. Res. 92, 14139–14150. doi: 10.1029/JB092iB13p14139
Boué, A., Lesage, P., Cortés, G., Valette, B., and Reyes Dávila, G. (2015). Real-time eruption forecasting using the material Failure Forecast Method with a Bayesian approach. J. Geophys. Res. 120, 2143–2161. doi: 10.1002/2014JB011637
Budi-Santoso, A., Lesage, P., Dwiyono, S., Sumarti, S., Subandriyo, Surono, et al. (2013). Analysis of the seismic activity associated with the 2010 eruption of Merapi Volcano, Java. J. Volcanol. Geotherm. Res. 261, 153–170. doi: 10.1016/j.jvolgeores.2013.03.024
Chadwick, W. W., Swanson, D. A., Iwatsubo, E. Y., Heliker, C. C., and Leighley, T. A. (1983). Deformation monitoring at Mount St. Helens in 1981 and 1982. Science 221, 1378–1380. doi: 10.1126/science.221.4618.1378
Chang, W.-L., Smith, R. B., Farrell, J., and Puskas, C. M. (2010). An extraordinary episode of Yellowstone caldera uplift, 2004–2010, from GPS and InSAR observations. Geophys. Res. Lett. 37:L23302. doi: 10.1029/2010GL045451
Chardot, L., Jolly, A. D., Sherburn, S., Fournier, N., and Kennedy, B. (2013). “The material failure forecast method as a potential eruption forecasting tool: application to the 2012 unrest episode at White Island volcano, New Zealand,” in IAVCEI 2013 Scientific Assembly (Kagoshima).
Chiodini, G., Paonita, A., Aiuppa, A., Costa, A., Caliro, S., De Martino, P., et al. (2016). Magmas near the critical degassing pressure drive volcanic unrest towards a critical state. Nat. Commun. 7, 1–9. doi: 10.1038/ncomms13712
Cornelius, R., and Voight, B. (1994). Seismological aspects of the 1989-1990 eruption at Redoubt Volcano, Alaska: the Materials Failure Forecast Method (FFM) with RSAM and SSAM seismic data. J. Volcanol. Geotherm. Res. 62, 469–498. doi: 10.1016/0377-0273(94)90048-5
Cornelius, R., and Voight, B. (1995). Graphical and PC-software analysis of volcano eruption precursors according to the Material Failure Forecast Method (FFM). J. Volcanol. Geotherm. Res. 64, 295–320. doi: 10.1016/0377-0273(94)00078-U
Cornelius, R., and Voight, B. (1996). “Real time seismic amplitude measurement (RSAM) and seismic spectral amplitude measurement (SSAM) analyses with the material failure forecast method (FFM), June 1991 explosive eruption at Mount Pinatubo,” in Fire and Mud: Eruptions and Lahars of Mount Pinatubo, eds C. G. Newhall and R. S. Punongbayan (Philippines, PA: Phivolcs), 249–268.
Cox, D. R., and Isham, V. (1980). Point Processes. Monographs on Statistics and Applied Probability. London; New York, NY: Chapman and Hall; CRC Press.
Dykes, A. P., and Bromhead, E. N. (2018). The Vaiont landslide: re-assessment of the evidence leads to rejection of the consensus. Landslides 15, 1815–1832. doi: 10.1007/s10346-018-0996-y
Evensen, G. (2003). The ensemble Kalman filter: theoretical formulation and practical implementation. Ocean Dyn. 53, 343–367. doi: 10.1007/s10236-003-0036-9
Fukuzuno, T. (1985). A method to predict the time of slope failure caused by rainfall using the inverse number of velocity of surface displacement. J. Jpn. Landslide Soc. 22, 8–14. doi: 10.3313/jls1964.22.2_8
Gardiner, C. (2009). Stochastic Methods: A Handbook for the Natural and Social Sciences. Springer Series in Synergetics. Berlin; Heidelberg: Springer.
Gaudio, C. D., Aquino, I., Ricciardi, G., Ricco, C., and Scandone, R. (2010). Unrest episodes at Campi Flegrei: a reconstruction of vertical ground movements during 1905-2009. J. Volcanol. Geotherm. Res. 195, 48–56. doi: 10.1016/j.jvolgeores.2010.05.014
Giudicepietro, F., Macedonio, G., and Martini, M. (2017). A physical model of sill expansion to explain the dynamics of unrest at calderas with application to campi flegrei. Front. Earth Sci. 5:54. doi: 10.3389/feart.2017.00054
Hildreth, W. (2017). Fluid-driven uplift at Long Valley Caldera, California: geologic perspectives. J. Volcanol. Geotherm. Res. 341, 269–286. doi: 10.1016/j.jvolgeores.2017.06.010
Hill, D., Mangan, M., and McNutt, S. (2017). Chapter 32: Volcanic unrest and hazard communication in long valley volcanic region, California,” in Advances in Volcanology, eds C. J. Fearnley, D. K. Bird, K. Haynes, W. J. McGuire, and G. Jolly (Cham: Springer), 171–187.
Hill, D. P. (2006). Unrest in long valley caldera, california, 1978–2004. Geol. Soc. Lond. Spec. Publ. 269, 1–24. doi: 10.1144/GSL.SP.2006.269.01.02
Houtekamer, P. L., and Mitchell, H. L. (1998). Data assimilation using an ensemble Kalman Filter technique. Month. Weath. Rev. 126, 796–811.
Hull, J., and White, A. (1990). Pricing interest rate derivatives securities. Rev. Financ. Stud. 3, 573–592. doi: 10.1093/rfs/3.4.573
Hyman, D. M., Bursik, M. I., and Legorreta Paulín, G. (2018). Time dependence of passive degassing at volcán popocatépetl, mexico, from infrared measurements: implications for gas pressure distribution and lava dome stability. J. Geophys. Res. 123, 8527–8547. doi: 10.1029/2018JB015674
Karatzas, I., and Shreve, S. E. (1991). Brownian Motion and Stochastic Calculus. Berlin; Heidelberg; New York, NY: Springer.
Kilburn, C. (2012). Precursory deformation and fracture before brittle rock failure and potential application to volcanic unrest. J. Geophys. Res. 117:B02211. doi: 10.1029/2011JB008703
Kilburn, C., De Natale, G., and Carlino, S. (2017). Progressive approach to eruption at campi flegrei caldera in Southern Italy. Nat. Commun. 8, 15312–15319. doi: 10.1038/ncomms15312
Kilburn, C. R. (2003). Multiscale fracturing as a key to forecasting volcanic eruptions. J. Volcanol. Geotherm. Res. 125, 271–289. doi: 10.1016/S0377-0273(03)00117-3
Kilburn, C. R., and Petley, D. N. (2003). Forecasting giant, catastrophic slope collapse: lessons from Vajont, Northern Italy. Geomorphology 54, 21–32. doi: 10.1016/S0169-555X(03)00052-7
Kilburn, C. R. J. (2018). Forecasting volcanic eruptions: beyond the failure forecast method. Front. Earth Sci. 6:133. doi: 10.3389/feart.2018.00133
Kilburn, C. R. J., and Voight, B. (1998). Slow rock fracture as eruption precursor at Soufriere Hills Volcano, Montserrat. Geophys. Res. Lett. 25, 3665–3668. doi: 10.1029/98GL01609
Kloeden, P. E., Platen, E., and Schurz, H. (1994). Numerical Solution of SDE Through Computer Experiments. Berlin; Heidelberg: Springer-Verlag; Universitext.
Lavallée, Y., Meredith, P. G., Dingwell, D., Hess, K., Wassermann, J., Cordonnier, B., et al. (2008). Seismogenic lavas and explosive eruption forecasting. Nature 453, 507–510. doi: 10.1038/nature06980
Marzocchi, W., and Bebbington, M. S. (2012). Probabilistic eruption forecasting at short and long time scales. Bull. Volcanol. 74, 1777–1805. doi: 10.1007/s00445-012-0633-x
McKee, C. O., Lowenstein, P. L., De Saint Ours, P., Talai, B., Itikarai, I., and Mori, J. J. (1984). Seismic and ground deformation crises at Rabaul Caldera: prelude to an eruption? Bull. Volcanol. 47, 397–411. doi: 10.1007/BF01961569
Montgomery-Brown, E. K., Wicks, C. W., Cervelli, P. F., Langbein, J. O., Svarc, J. L., Shelly, D. R., et al. (2015). Renewed inflation of long valley caldera, california (2011 to 2014). Geophys. Res. Lett. 42, 5250–5257. doi: 10.1002/2015GL064338
Moretto, S., Bozzano, F., Esposito, C., and Mazzanti, P. (2016). Lesson learned from the pre-collapse time series of displacement of the Preonzo landslide (Switzerland). Rendiconti Online della Soc. Geol. Ital. 41, 247–250. doi: 10.3301/ROL.2016.140
Neri, A., Bevilacqua, A., Esposti Ongaro, T., Isaia, R., Aspinall, W. P., Bisson, M., et al. (2015). Quantifying volcanic hazard at Campi Flegrei caldera (Italy) with uncertainty assessment: 2. Pyroclastic density current invasion maps. J. Geophys. Res. 120, 2330–2349. doi: 10.1002/2014JB011776
Newman, A. V., Stiros, S., Feng, L., Psimoulis, P., Moschas, F., Saltogianni, V., et al. (2012). Recent geodetic unrest at santorini caldera, greece. Geophys. Res. Lett. 39:L06309. doi: 10.1029/2012GL051286
Ortiz, R., Moreno, H., García, A., Fuentealba, G., Astiz, M., Pena, P., et al. (2003). Villarrica volcano (Chile): characteristics of the volcanic tremor and forecasting of small explosions by means of a material failure method. J. Volcanol. Geotherm. Res. 128, 247–259. doi: 10.1016/S0377-0273(03)00258-0
Richardson, J., Wilson, J., Connor, C., Bleacher, J., and Kiyosugi, K. (2017). Recurrence rate and magma effusion rate for the latest volcanism on Arsia Mons, Mars. Earth Planet. Sci. Lett. 458, 170–178. doi: 10.1016/j.epsl.2016.10.040
Robertson, R. M., and Kilburn, C. R. (2016). Deformation regime and long-term precursors to eruption at large calderas: Rabaul, Papua New Guinea. Earth Planet. Sci. Lett. 438, 86–94. doi: 10.1016/j.epsl.2016.01.003
Salvage, R., and Neuberg, J. (2016). Using a cross correlation technique to refine the accuracy of the Failure Forecast Method: application to Soufriére Hills volcano, Montserrat. J. Volcanol. Geotherm. Res. 324, 118–133. doi: 10.1016/j.jvolgeores.2016.05.011
Salvage, R. O., Karl, S., and Neuberg, J. W. (2017). Volcano Seismology: Detecting Unrest in Wiggly Lines. Berlin; Heidelberg: Springer.
Selva, J., Orsi, G., Di Vito, M. A., Marzocchi, W., and Sandri, L. (2012). Probability hazard map for future vent opening at the Campi Flegrei caldera, Italy. Bull. Volcanol. 74, 497–510. doi: 10.1007/s00445-011-0528-2
Smith, R., and Kilburn, C. (2010). Forecasting eruptions after long repose intervals from accelerating rates of rock fracture: the June 1991 eruption of Mount Pinatubo, Philippines. J. Volcanol. Geotherm. Res. 191, 129–136. doi: 10.1016/j.jvolgeores.2010.01.006
Smith, R., Sammonds, P. R., and Kilburn, C. R. (2009). Fracturing of volcanic systems: experimental insights into pre-eruptive conditions. Earth Planet. Sci. Lett. 280, 211–219. doi: 10.1016/j.epsl.2009.01.032
Sparks, R., and Aspinall, W. (2004). Volcanic Activity: Frontiers and Challenges in Forecasting, Prediction and Risk Assessment, Volume 19 of Geophysical Monograph 150. Washington, DC: IUGG, 359–373.
Swanson, D. A., Casadevall, T. J., Dzurisin, D., Malone, S. D., Newhall, C. G., and Weaver, C. S. (1983). Predicting eruptions at Mount St. Helens, June 1980 through December 1982. Science 221, 1369–1376. doi: 10.1126/science.221.4618.1369
Tadini, A., Bevilacqua, A., Neri, A., Cioni, R., Aspinall, W. P., Bisson, M., et al. (2017a). Assessing future vent opening locations at the Somma-Vesuvio volcanic complex: 2. Probability maps of the caldera for a future Plinian/sub-Plinian event with uncertainty quantification. J. Geophys. Res. 122, 4357–4376. doi: 10.1002/2016JB013858
Tadini, A., Bisson, M., Neri, A., Cioni, R., Bevilacqua, A., and Aspinall, W. P. (2017b). Assessing future vent opening locations at the Somma-Vesuvio volcanic complex: 1. A new information geodatabase with uncertainty characterizations. J. Geophys. Res. 122, 4336–4356. doi: 10.1002/2016JB013860
Tárraga, M., Carniel, R., Ortiz, R., Marrero, J. M., and García, A. (2006). On the predictability of volcano-tectonic events by low frequency seismic noise analysis at Teide-Pico Viejo volcanic complex, Canary Islands. Nat. Hazards Earth Syst. Sci. 6, 365–376. doi: 10.5194/nhess-6-365-2006
Tokarev, P. (1966). Izverzheniya i Seysmicheskiy Rezhim Vulkanov Klyuchevskoy Gruppy. Nauka: USSR Academy of Sciences.
Tokarev, P. I. (1971). Forecasting volcanic eruptions from seismic data. Bull. Volcanol. 35, 243–250. doi: 10.1007/BF02596821
Troise, C., Natale, G. D., Schiavone, R., Somma, R., and Moretti, R. (2019). The Campi Flegrei caldera unrest: discriminating magma intrusions from hydrothermal effects and implications for possible evolution. Earth Sci. Rev. 188, 108–122. doi: 10.1016/j.earscirev.2018.11.007
Vasseur, J., Wadsworth, F. B., Lavallée, Y., Bell, A. F., and Main, I. G. (2015). Heterogeneity: the key to failure forecasting. Sci. Rep. 453, 13259–13265. doi: 10.1038/srep13259
Voight, B. (1987). “Phenomenological law enables accurate time forecasts of slope failure,” in Int. Soc. Rock Mechanics, 7th International Congress of Rock Mechanics (Montreal, QC).
Voight, B. (1988a). A method for prediction of volcanic eruptions. Nature 332, 125–130. doi: 10.1038/332125a0
Voight, B. (1988b). “Material science law applies to time forecasts of slope failure,” in 5th International Symposium on Landslides (Lausanne).
Voight, B. (1989). A relation to describe rate-dependent material failure. Science 243, 200–203. doi: 10.1126/science.243.4888.200
Voight, B., and Cornelius, R. (1990). Application of material failure approach to eruption prediction with RSAM at Redoubt, 1989-90. EOS Trans. Am. Geophys. Union 71:1701.
Voight, B., and Cornelius, R. R. (1991). Prospects for eruption prediction in near real-time. Nature 350, 695–698. doi: 10.1038/350695a0
Voight, B., and Faust, C. (1982). Frictional heat and strength loss in some rapid landslides. Géotechnique 32, 43–54. doi: 10.1680/geot.1982.32.1.43
Voight, B., Orkan, N., and Young, K. (1989). “Deformation and failure-time prediction in rock mechanics,” in Rock Mechanics as a Guide for Efficient Utilization of Natural Resources, ed A. W. Khair (Rotterdam: A.A.Balkema), 919–929.
Voight, B., Young, K., Hidayat, D., Subandrio, Purbawinata, M., Ratdomopurbo, A., et al. (2000). Deformation and seismic precursors to dome-collapse and fountain-collapse nuées ardentes at Merapi Volcano, Java, Indonesia, 1994-1998. J. Volcanol. Geotherm. Res. 100, 261–287. doi: 10.1016/S0377-0273(00)00140-2
Woo, J. Y. L., and Kilburn, C. R. J. (2010). Intrusion and deformation at Campi Flegrei, southern Italy: sills, dikes, and regional extension. J. Geophys. Res. 115, 1–21. doi: 10.1029/2009JB006913
Keywords: Failure Forecast Method - FFM, volcanic eruption forecasting, doubly stochastic models, stochastic (functional) differential equation, volcanic hazard assessment
Citation: Bevilacqua A, Pitman EB, Patra A, Neri A, Bursik M and Voight B (2019) Probabilistic Enhancement of the Failure Forecast Method Using a Stochastic Differential Equation and Application to Volcanic Eruption Forecasts. Front. Earth Sci. 7:135. doi: 10.3389/feart.2019.00135
Received: 21 November 2018; Accepted: 15 May 2019;
Published: 03 July 2019.
Edited by:
Christina Robyn Magill, Macquarie University, AustraliaCopyright © 2019 Bevilacqua, Pitman, Patra, Neri, Bursik and Voight. This is an open-access article distributed under the terms of the Creative Commons Attribution License (CC BY). The use, distribution or reproduction in other forums is permitted, provided the original author(s) and the copyright owner(s) are credited and that the original publication in this journal is cited, in accordance with accepted academic practice. No use, distribution or reproduction is permitted which does not comply with these terms.
*Correspondence: Andrea Bevilacqua, YW5kcmVhLmJldmlsYWNxdWFAaW5ndi5pdA==
 Andrea Bevilacqua
 Eric Bruce Pitman4
 Augusto Neri
 Marcus Bursik