 Robert Witkop
 Austin Becker
 Peter Stempel
 Isaac Ginis2
- 1Department of Marine Affairs, University of Rhode Island, South Kingstown, RI, United States
- 2Graduate School of Oceanography, University of Rhode Island, Narragansett, RI, United States
Emergency managers face challenges in understanding and communicating potential hurricane hazards. Preparedness typically emphasizes the last event encountered, the potential implications of future hazards may thus be underestimated. Risk assessment models (e.g., basic HAZUS) that emphasize accumulated damages in economic terms do not provide actionable data regarding specific local concerns, such as access by emergency vehicles and potential communications disruptions. Qualitative methods conventionally used to identify these concerns, however, lack the specificity necessary to incorporate the managers’ knowledge into hazard models (e.g., highly exact geographic location of the vulnerability or cascading consequences). This research develops a method to collect rich, actionable, qualitative data from critical facility managers that can be utilized in combination with hydrodynamic, wind, and precipitation models to assess potential hazard consequences. A pilot study was conducted with critical facility managers in Westerly, RI, United States, using semi-structured interviews and participatory mapping. Interview methods were based on existing practices for vulnerability assessments, and further augmented to obtain data based on hurricane modeling requirements. This research identifies challenges and recommendations when collecting critical facility manager’s knowledge for incorporation into storm simulations. The method described enables local experts to contribute actionable knowledge to natural hazard models and augment more traditional engineering-based approaches to risk assessment.
Introduction
Emergency and infrastructure facility managers face challenges in understanding and communicating hurricane hazards (Morrow et al., 2015). Robust emergency management and resiliency planning starts with identifying the problem, which includes understanding impacts, risks, opportunities, and associated vulnerabilities (Moser and Ekstrom, 2010; Preston et al., 2010; Bierbaum et al., 2013). However, preparedness typically emphasizes the last event encountered, which often leads to the underestimation of the risks of future hazards (Adger et al., 2013; Kellens et al., 2013). Traditional risk assessment models (e.g., basic HAZUS) that emphasize accumulated damages in economic terms or use generic damage functions do not provide actionable data regarding specific local concerns, such as potential damage to a given facility’s emergency generator (Paul et al., 2018). Qualitative methods typically used to identify managers local concerns, however, lack the specificity necessary to incorporate such local concerns into hazard models (e.g., exact geographic coordinates of the vulnerability or cascading consequences), resulting in concerns that can be described, but not modeled. The modeling of hazard impacts for individual pieces of infrastructure and facilities requires data at a resolution that is both specific to the facility and provides specific actionable outputs that are relevant to emergency and facility managers.
Existing data points and damage curves that may be sufficient for generalized or aggregate analysis (e.g., “basic” loss estimation with HAZUS) are often not applicable at granular scales to serve the needs of facility and emergency response managers. While “direct damages” are relatively easy to quantify and “indirect impacts” can be quantified through a variety of economic modeling techniques, the “intangible consequences” that decision makers and society face after a storm are best suited to qualitative data-collection approaches (Becker et al., 2015). This project developed a method to gather rich, actionable, qualitative data from critical facility managers that can be utilized for risk assessment and emergency response. These data provide additional granular detail regarding impacts to enhance Disaster Risk Reduction (DRR) and other participatory risk assessment processes.
Disaster Risk Reduction is the systematic practice of evaluating and reducing risks posed by natural hazards such as storm surge associated with hurricanes (Thomalla et al., 2006). A “context first” DRR approach encourages decision makers to start with the adaptation problem itself (e.g., the need to maintain communications) and then appraises adaptation strategies through hazard impact models (Reeder and Ranger, 2011). DRR assessments also employ risk-based approaches, which take the climate hazard as the starting point of analysis and introduce impact models to an assessment through experts that provide the likelihood and consequence of a particular climate-related event [see for example (Holper et al., 2007; Port of Dover, 2015; Port of Felixstowe, 2015)]. These kinds of DRR assessments most commonly rely on models that predict the impacts of a simulated climate event through engineering approaches based on characteristics of exposed assets (e.g., elevations of coastal homes) and storm hazards (e.g., wave height). Some DRR assessments use vulnerability curves to evaluate physical damage and degree of loss estimations based on flood depth or wind speed at a structure’s location (Aerts et al., 2018) while others use fragility curves to predict the probability of similar storm forces causing a specific damage level on an asset (Porter, 2015).
Fragility and vulnerability curves are based on expert opinions, empirical methods, analytical methods or a hybrid of these approaches (Schultz et al., 2010). They may be developed for a particular structure or used to make generalized predictions. Empirical curves use observational data from natural or scientific experiments to predict impacts of hazards while analytical curves use engineering principals of assets and hazards to predict impacts. Methods chosen to build a vulnerability curve depends on the information available and the requirement for a precise output (Schultz et al., 2010). Hybrid curves combine multiple data types to compensate for shortcomings of individual approaches (Porter, 2015). However, in many cases, fragility and vulnerability curves do not account for more detailed qualitative or quantitative storm concerns that may be raised by stakeholders of interconnected systems, such as facility managers in a particular region (Schneider and Schauer, 2006).
Further, many human responses to disasters cannot be reliably output by fragility and vulnerability curves due to the unpredictability of human behavior even though these responses significantly impact damage to and recovery of a system (Aerts et al., 2018). Thus, decision makers are calling for the development of new methods to understand how their concerns may be triggered by storms so that they may find ways to reduce vulnerability and increase resilience (United States Environmental Protection Agency [USEPA], 2008; Becker et al., 2013).
Emergency and facility managers face unique challenges in this regard, as the infrastructure that is relied on to recover from major storm events may itself be vulnerable to storms. Incorporating their concerns (e.g., the short-circuiting of a hospital’s generator) into scenario plans through participatory processes such as workshops can improve the accuracy (White et al., 2010) and usefulness of storm models (Messner and Meyer, 2006), and is an essential component of hazard management (Eakin and Luers, 2006). Many DRR methods, including HAZUS, specifically recommend accounting for expert’s local concerns when developing detailed storm impact models (Vickery et al., 2006). However, most flood risk assessments use single average fragility and vulnerability curves, ignoring the qualitative concerns of many decision makers. Incorporating these concerns into quantitative DRR assessments can increase their relevance at a finer geographic scale (Brecht, 2007).
Using critical facility managers (FMs) in Westerly Rhode Island in a case study approach, this research addresses the following questions:
RQ1. How can existing methods for eliciting vulnerability data be adapted to collect FMs’ intra-facility level storm concerns for inclusion in storm impact models?
RQ2. What challenges exist as researchers collect FM’s concerns for incorporation into storm impact models?
RQ3. How can storm impact models be improved by collecting stakeholders’ concerns for inclusion in the model?
After establishing the basis for this study’s approach through a review of existing assessment methodologies, this methodology is subsequently evaluated based on interviews with 13 FMs in Westerly Rhode Island. The manuscript identifies challenges that exist when collecting interviewee’s concerns for incorporation into storm impact models and how storm impact models can be improved by including stakeholders in storm impact modeling through participatory assessments.
Methods for collecting qualitative concerns for incorporation into storm impact models at the intra-facility scale have not been elaborated (Palmer and Smith, 2014; Hendricks et al., 2018). There is a framework to incorporate citizen scientists into hydrological models, including for flood risk management (Buytaert et al., 2014), these methods, however, do not specify how to collect stakeholders concerns for incorporation into storm impact models such as HAZUS. This study reviewed 16 vulnerability assessments to establish a basis for collecting stakeholders concerns for incorporation into hazard models. The 16 assessments were chosen because each identified components required for incorporating stakeholder concerns into hazard impact models (Table 1). 15 of the 16 assessments are meant to identify a community’s or facility’s vulnerabilities by working with local stakeholders.
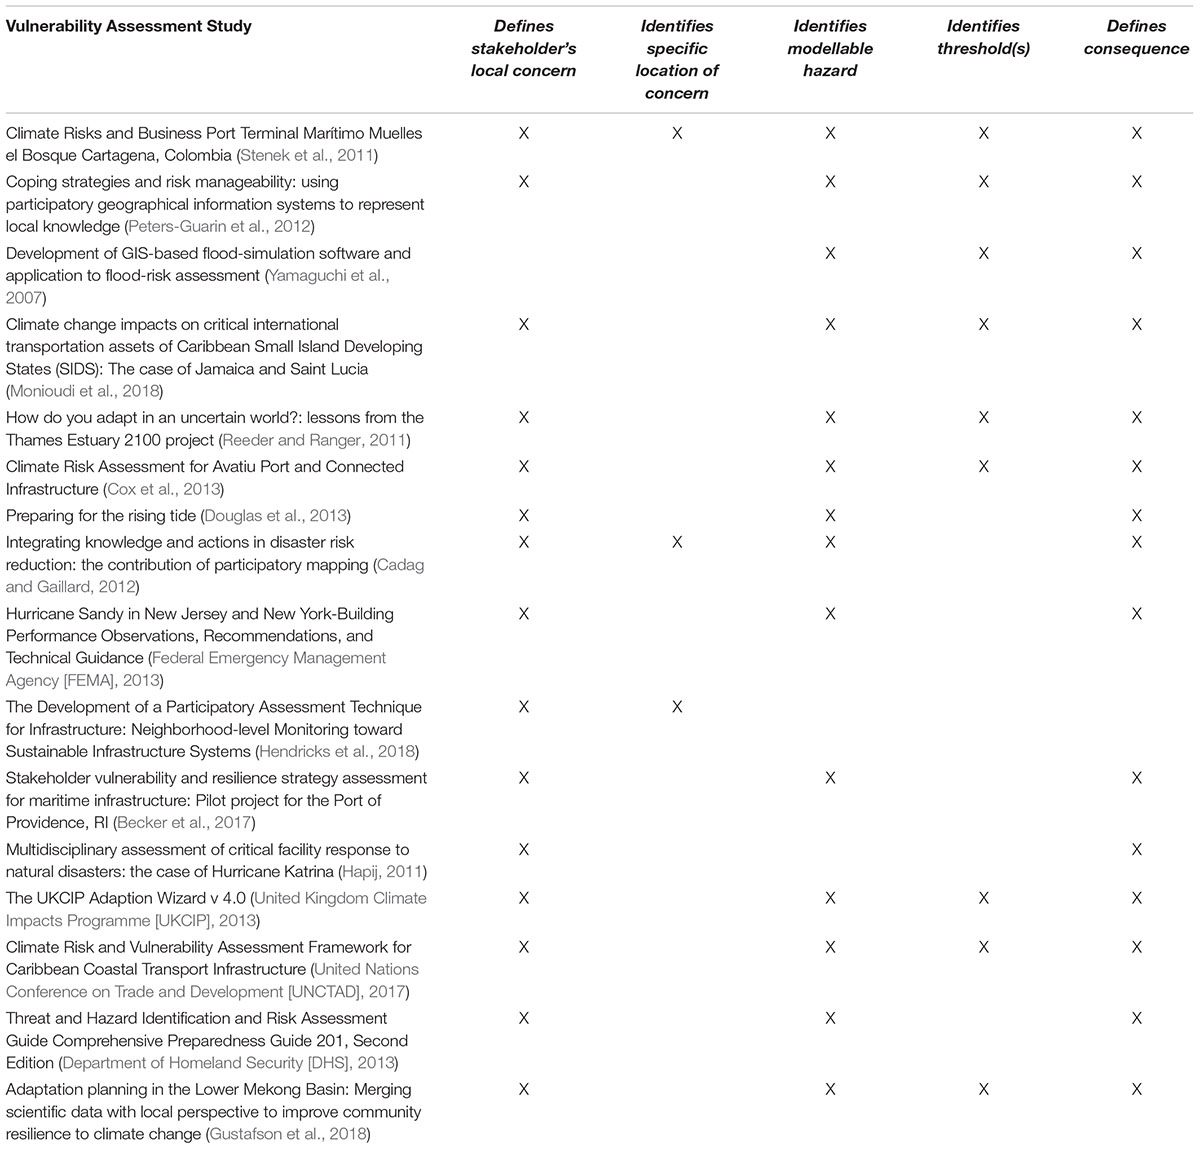
Table 1. Methodologies reviewed for “consequence thresholds” approach.
Preliminary storm impact models created by the authors, and review of literature that will be subsequently described, demonstrated that integrating qualitative concerns into storm impact models requires five components, as follows:
(1) The concern - An asset the stakeholder perceives can be directly impacted by a storm force. For example, a generator that can be short circuited by flooding.
(2) The specific location of concern - The latitude and longitude of the asset the stakeholder believes can be directly impacted by a storm force. For example, a generator’s location at 41.12345 N and -71.12345 W.
(3) A modellable hazard - A storm force (or range of forces) that the stakeholder perceives as a risk to the asset, can be quantified such as inundation depth or wind velocity, and is modeled by the underlying storm simulation.
(4) The threshold(s) - The storm force threshold that when exceeded at the location of concern triggers a consequence according to the stakeholder. For example, winds above 100 mph or flooding above one foot.
(5) The consequence - The outcome if the storm force exceeds the threshold at the location of concern according to the stakeholder. For example, the generator would short-circuit.
We define these combined five components as a “Consequence Threshold” (CT), to distinguish this method from other methods of calculating damage and loss (e.g., damage curves).
Some vulnerability assessments have identified all the above CT components and incorporated them into intra-facility level hydrodynamic simulations (Stenek et al., 2011), but none have detailed the nuanced challenges of gathering this information (Table 1). To address this, this research adopts principals from the vulnerability assessment (United Kingdom Climate Impacts Programme [UKCIP], 2013) and participatory mapping methodologies (Cadag and Gaillard, 2012) represented in Table 1 to gather the five CT components since the UKCIP method has been used to explore stakeholder storm concerns and thresholds (Port of Felixstowe, 2015) and Cadag and Gaillard have used participatory mapping techniques to identify locations of stakeholders concerns.
Materials and Methods
Sampling Approach
Developing meaningful qualitative data regarding critical facilities presents several challenges, such as the sensitivity and security of the information, and the parameters of its use (Rinaldi, 2004). This work was thus conceived in collaboration with the Rhode Island Emergency Management Agency (RIEMA) as part of a larger effort to evaluate and improve preparedness in Rhode Island. Clarity regarding the purposes, scope, and auspices of the work was essential to the perceived legitimacy of the inquiry. This allowed investigators to gain access to FMs within the case study that might otherwise be hesitant to participate because of security threat concerns (Rinaldi, 2004).
Westerly Rhode Island was chosen as the pilot community because of its relatively small number of critical facilities and high level of hazard exposure. Westerly is a coastal community on Rhode Island’s southern coast with a population of about 18,000 as of 2010 (United States Census Bureau, 2018). The Hurricane of 1938, 1954, and the “Floods of 2010” (a series of rain events that impacted Westerly during March of 2010) all impacted the town and it lost many buildings during Hurricane Sandy due to storm surge and winds that reached 86 mph (sustained at 64.4 mph) in Westerly (Manning et al., 2014). The combination of hazard exposure and limited number of facilities allowed for investigation of interdependencies and cascading consequences which are of particular concern to RIEMA.
Gaining access to infrastructure vulnerability information is challenging because it is normally proprietary in nature (Rinaldi, 2004). Partnership with RIEMA and clarity regarding the use of outputs facilitated introductions to local emergency managers (EMs). By the nature of their work, local EMs are highly informed about how a storm affects their community (Newkirk, 2001) and are well connected to the FMs in their community. EMs played an essential role in selecting FMs to interview since FMs are highly informed about their facility (Mendonça and Wallace, 2006) and external resources their facilities rely on (Rinaldi, 2004). Critical facilities were defined in collaboration with EMs based on FEMA’s definition as facilities that, “if severely damaged, would reduce the availability of essential community services necessary to cope with an emergency” and facilities “associated with utilities that are required to protect the health and safety of a community” according to the local EM (Federal Emergency Management Agency [FEMA], 2012). These critical facilities include fire departments, police stations, hospitals, and waste water treatment plants among others.
Selected FMs were invited to participate via email and telephone. Investigators explained the overall goal of the research while scheduling interviews (Paul et al., 2018). Additional FMs were interviewed as opportunities presented themselves (Patton and Appelbaum, 2003). In total, 13 FMs from 11 of 30 critical facilities in Westerly were interviewed. This included four fire departments, the police station, the dispatch center, the ambulance corps, the waste water treatment plant, the water department, the largest electrical distribution substation and the department of public works (Figure 1). FMs from Westerly’s hospital, school system, telephone networks, and natural gas facilities declined to participate, in most cases due the perceived security threat posed by sharing sensitive information. As this method has been developed, tested and demonstrated in Westerly, interest in participation in subsequent processes across the state has increased. Demonstrating the utility of outputs and trust-building through iterative processes is thus essential to building effective databases.
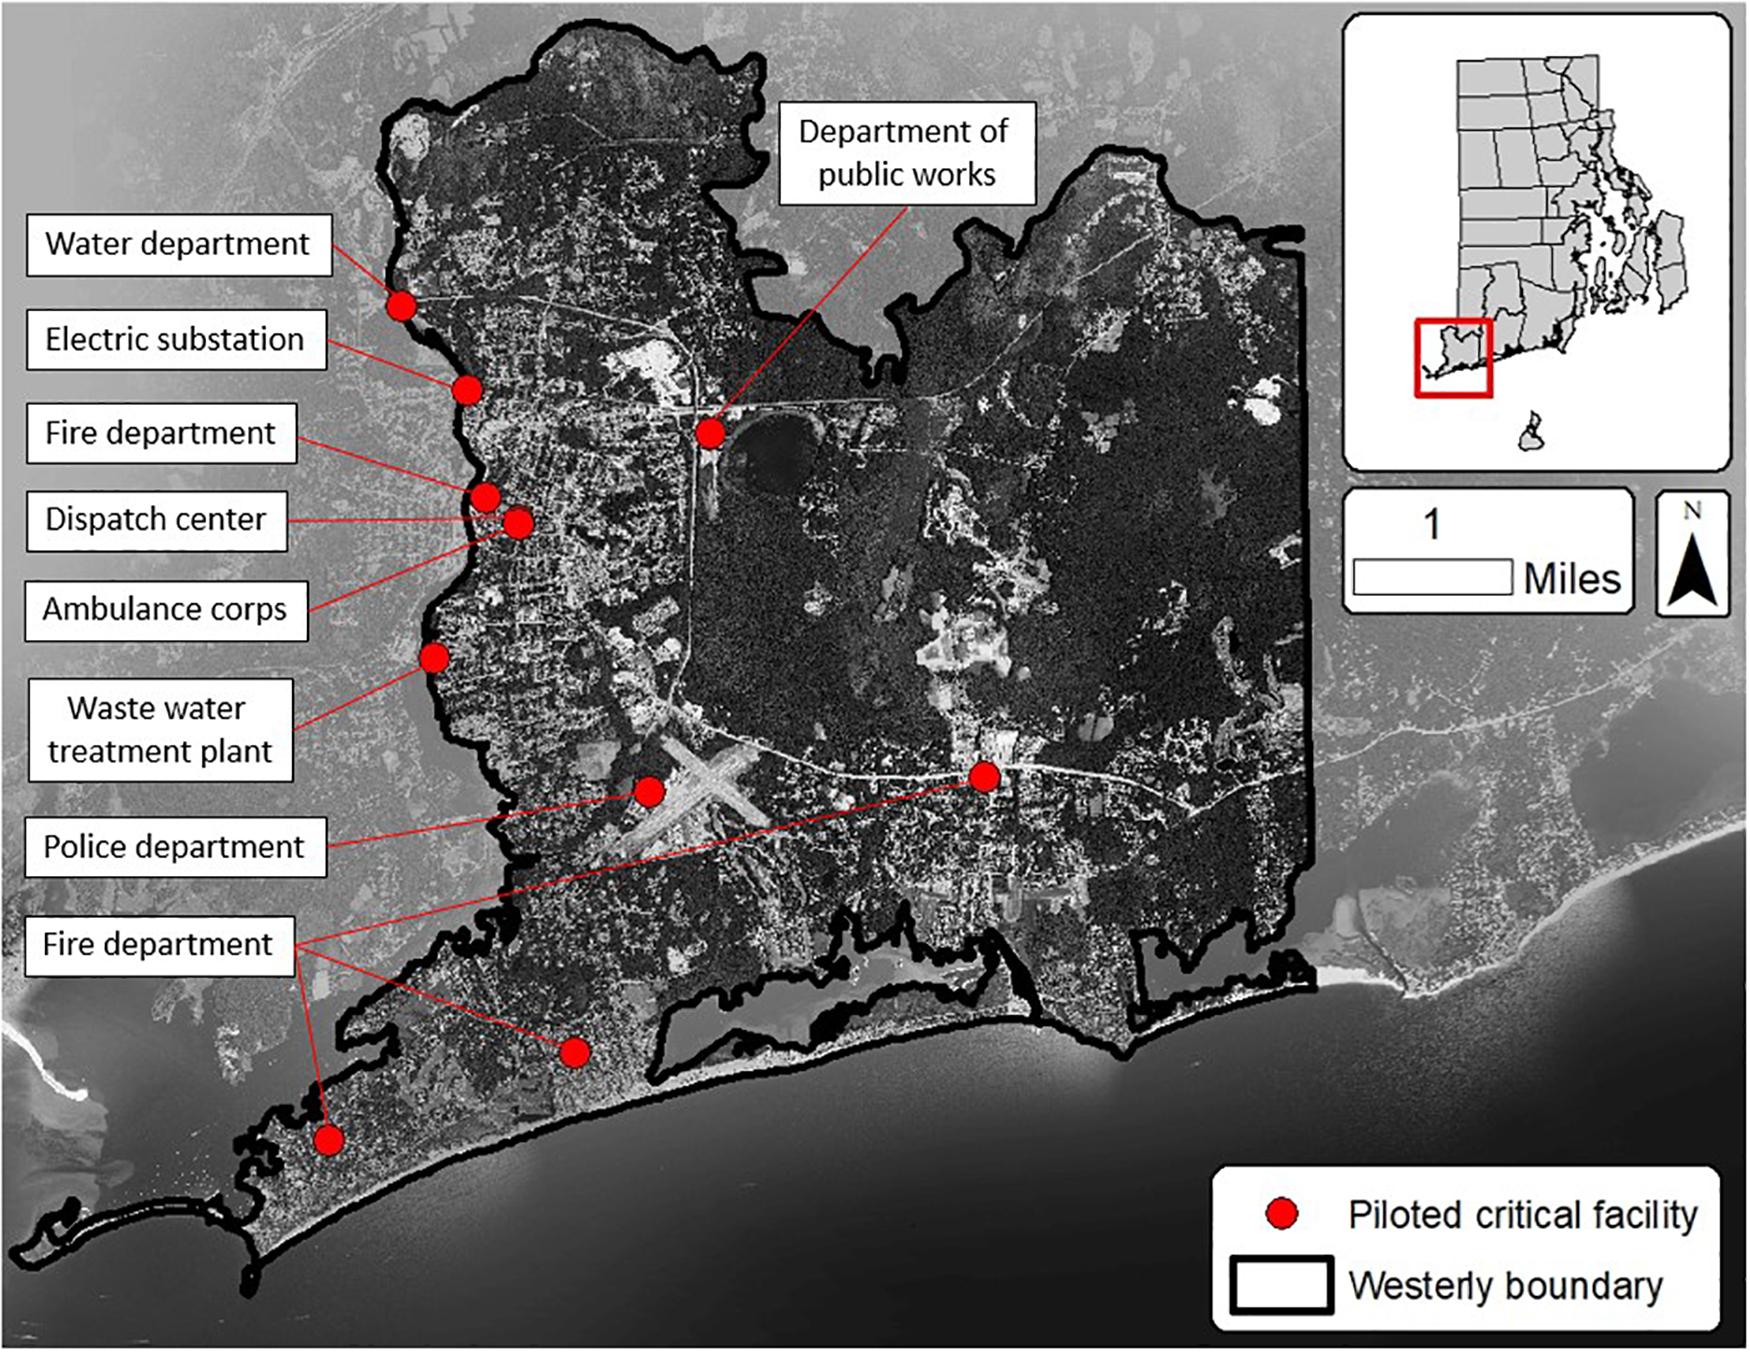
Figure 1. Westerly, RI critical facilities included in pilot study (Image: authors, data from RIGIS).
Interview Instrument Design
An open-ended interview instrument was designed to collect a wide range of FM’s storm concerns. Questions were adapted from the Department of Homeland Security’s Critical Infrastructure vulnerability assessment (Department of Homeland Security [DHS], 2013), the UKCIP’s threshold identification methods (United Kingdom Climate Impacts Programme [UKCIP], 2013), the global consulting firm ICF’s climate vulnerability assessment (ICF International, 2017), and results from the Sandy Mitigation Assessment Team for critical facilities (Federal Emergency Management Agency [FEMA], 2013) (see Appendix I). Three members of RIEMA’s Critical Infrastructure Program reviewed the survey instrument along with two members of URI Marine Affairs Department, and one ex-FM from Rhode Island.
Interview Process
In three cases, an interviewee’s colleagues joined the interviews, which helped interviewees feel more comfortable and is a recommended practice for risk communication meetings (Chess et al., 1988). To begin, we explained that the purpose of the interview was to collect interviewee’s storm concerns for incorporation into storm impact models (Chess et al., 1988). We used an illustration of a fictional CT for a petroleum facility triggered by storm surge from Hurricane Carol at 4:30 pm on August 5th, 1954 overlaid on a modern day map at the Port of Providence as a thought prompt to show the interviewee how the information could ultimately be used (Figure 2; White et al., 2010). We explained to interviewees that their names would be kept confidential and quotes from their responses would not be identified or attributed to them individually but might be discovered due to the limited number of critical facilities in Westerly.
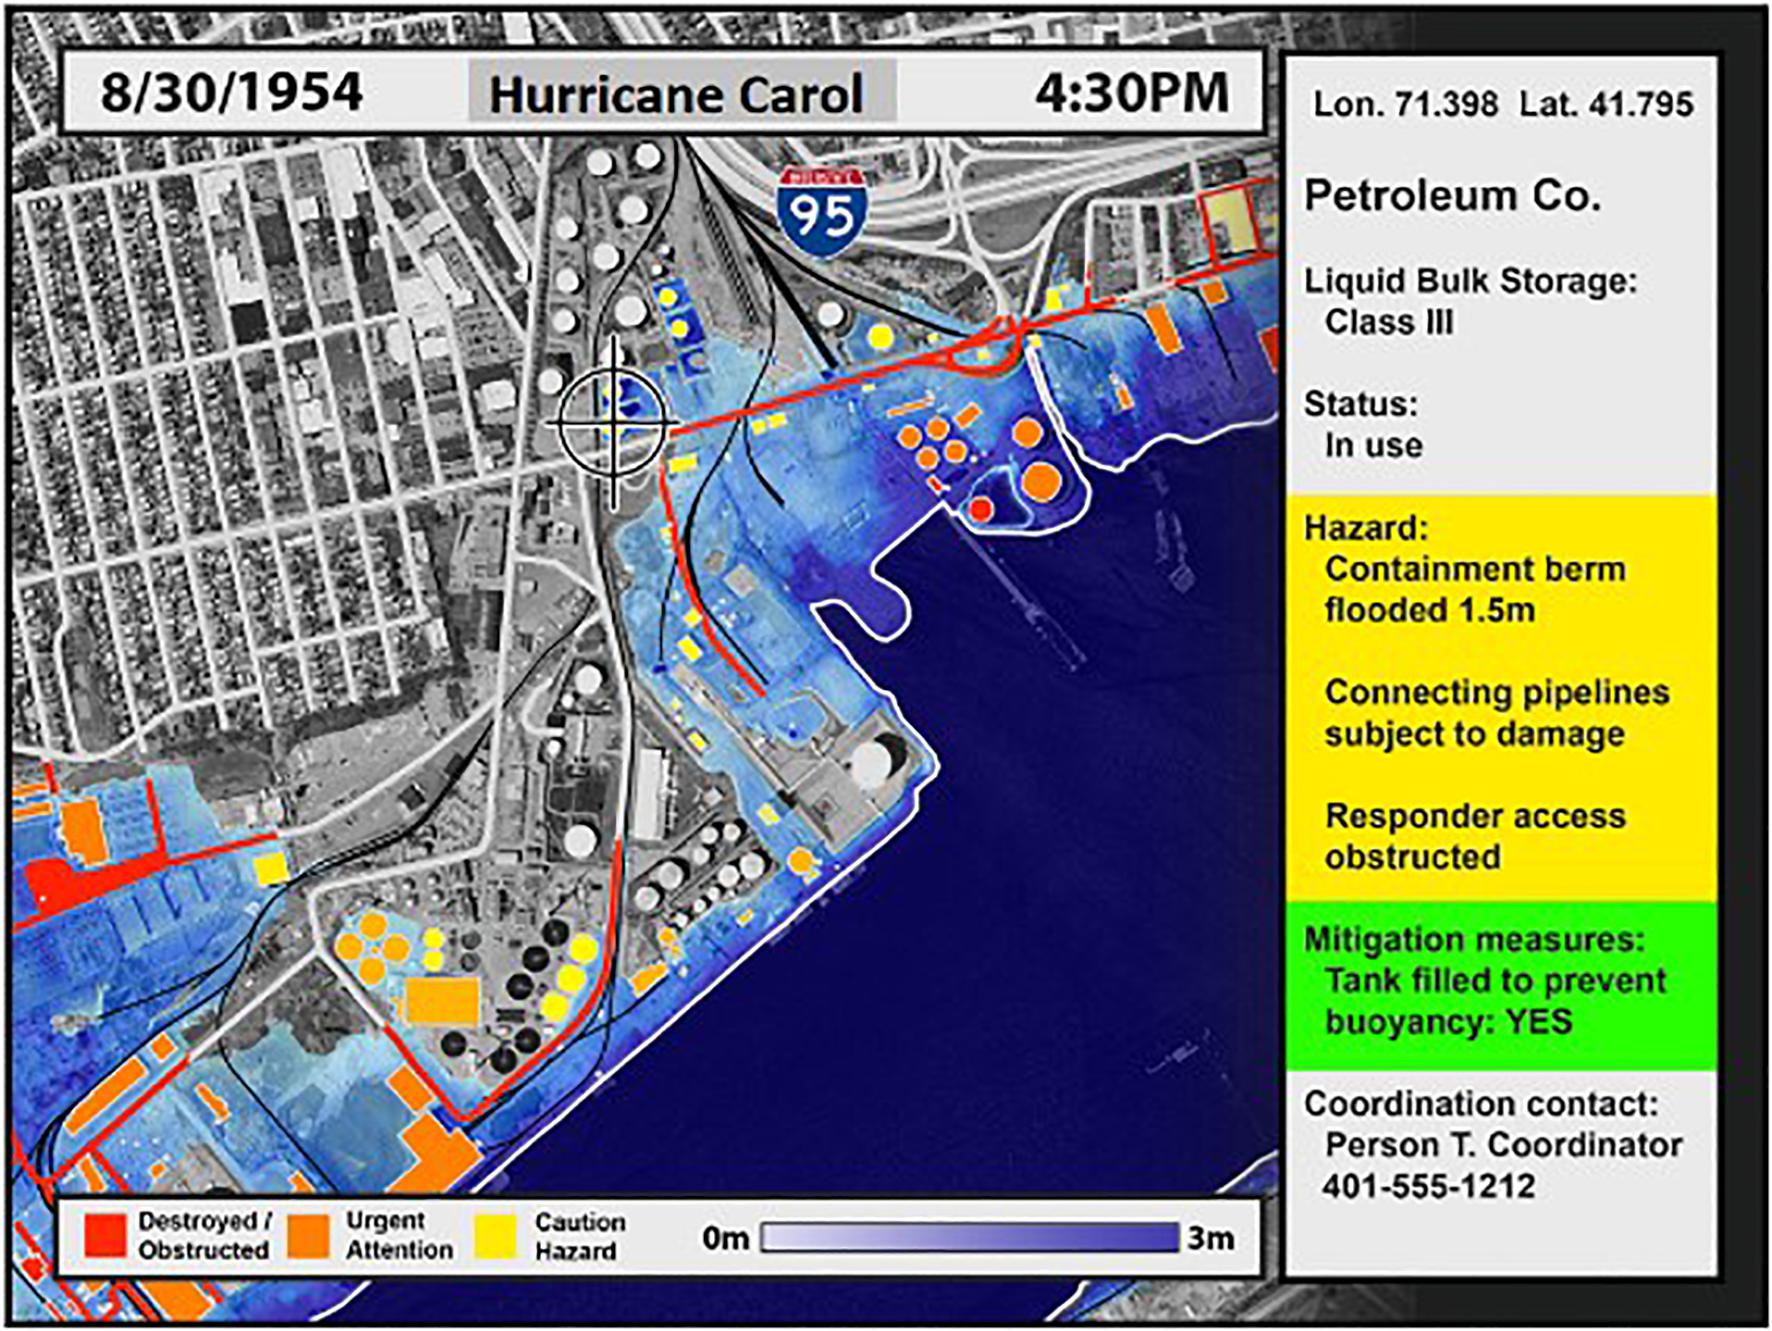
Figure 2. Image used to explain potential of storm models during interviews (Image: authors, data from RIGIS).
We then asked for the interviewee’s immediate concerns to a storm and encouraged them to consider storm consequences on other parts of the community (e.g., roads) that could affect their facility. We listened to interviewee’s concerns (Chess et al., 1988), and then worked to identify remaining CT components for each concern interviewees identified (Figure 3).
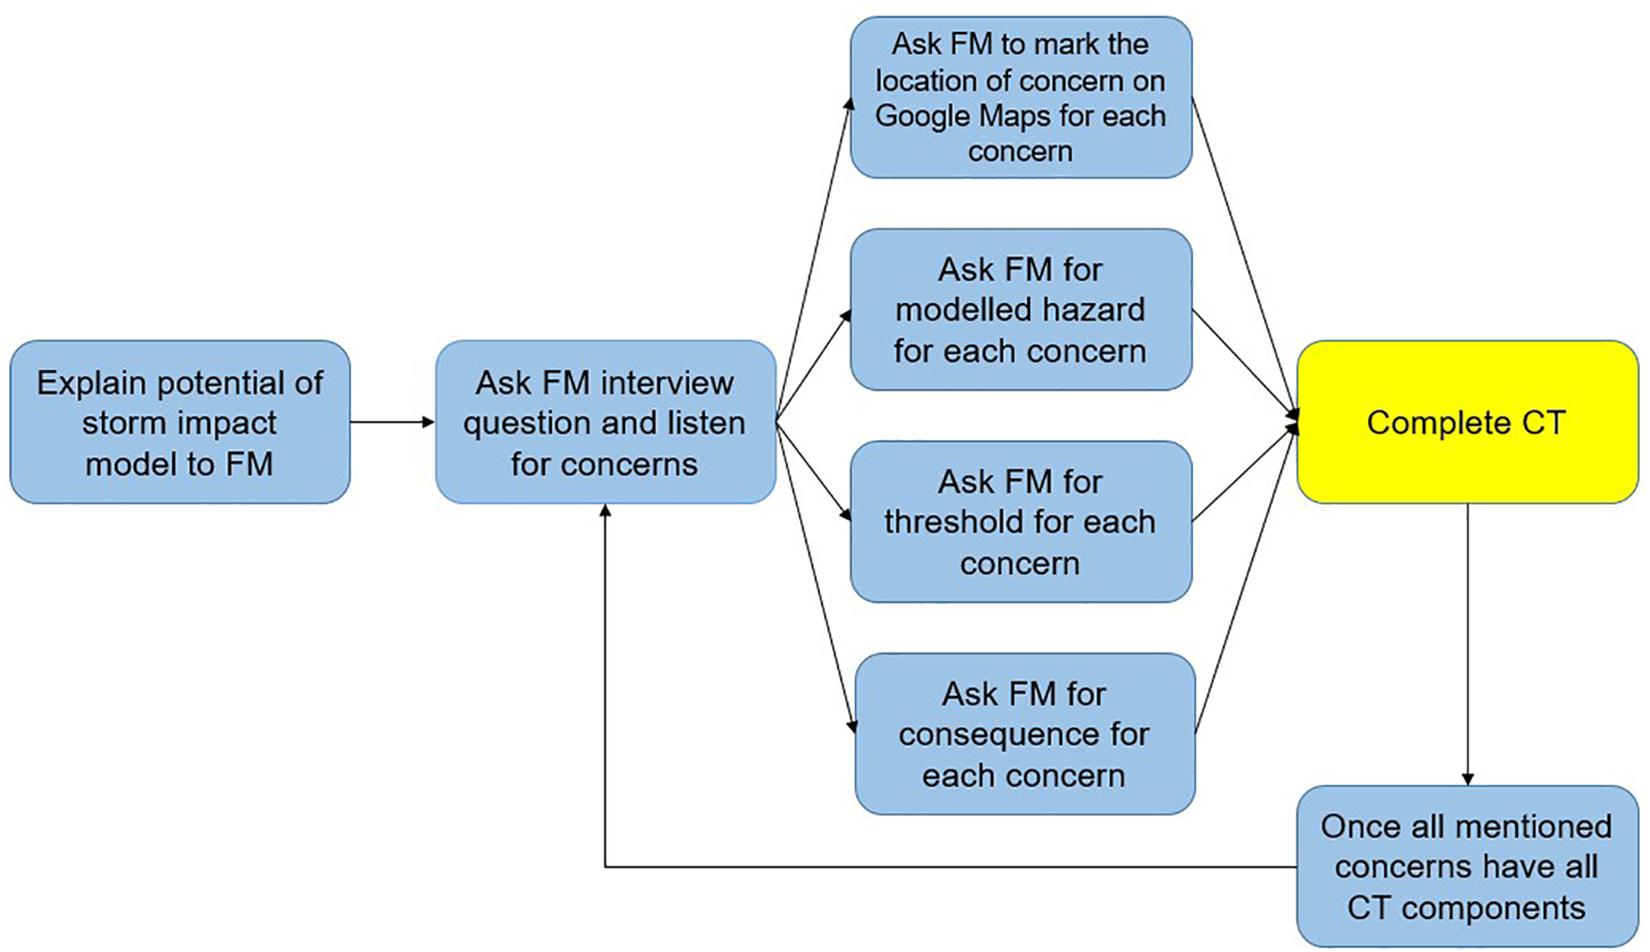
Figure 3. Consequence Threshold (CT) data collection process with facility manager (FM) interviewees (Image: authors).
We asked the interviewee to identify the location of his/her concern on a navigable Google Map satellite (15 m to 15 cm resolution) and/or street view using a laptop computer (Figure 4). We also asked the interviewee to identify the concern threshold using an open response threshold-identification method similar to the ICF and United Kingdom Climate Impacts Programme (UKCIP) methods (United Kingdom Climate Impacts Programme [UKCIP], 2013; Monioudi et al., 2018). For example, we asked, “What inundation level would cause the consequence you mentioned?” Although interviewees were encouraged to identify the storm forces that the underlying storm models used (rain, wind, storm surge, standing inundation, and wave height), interviewees also identified other weather and geological concerns, for example lightning strikes, soil moisture content, and microbursts.
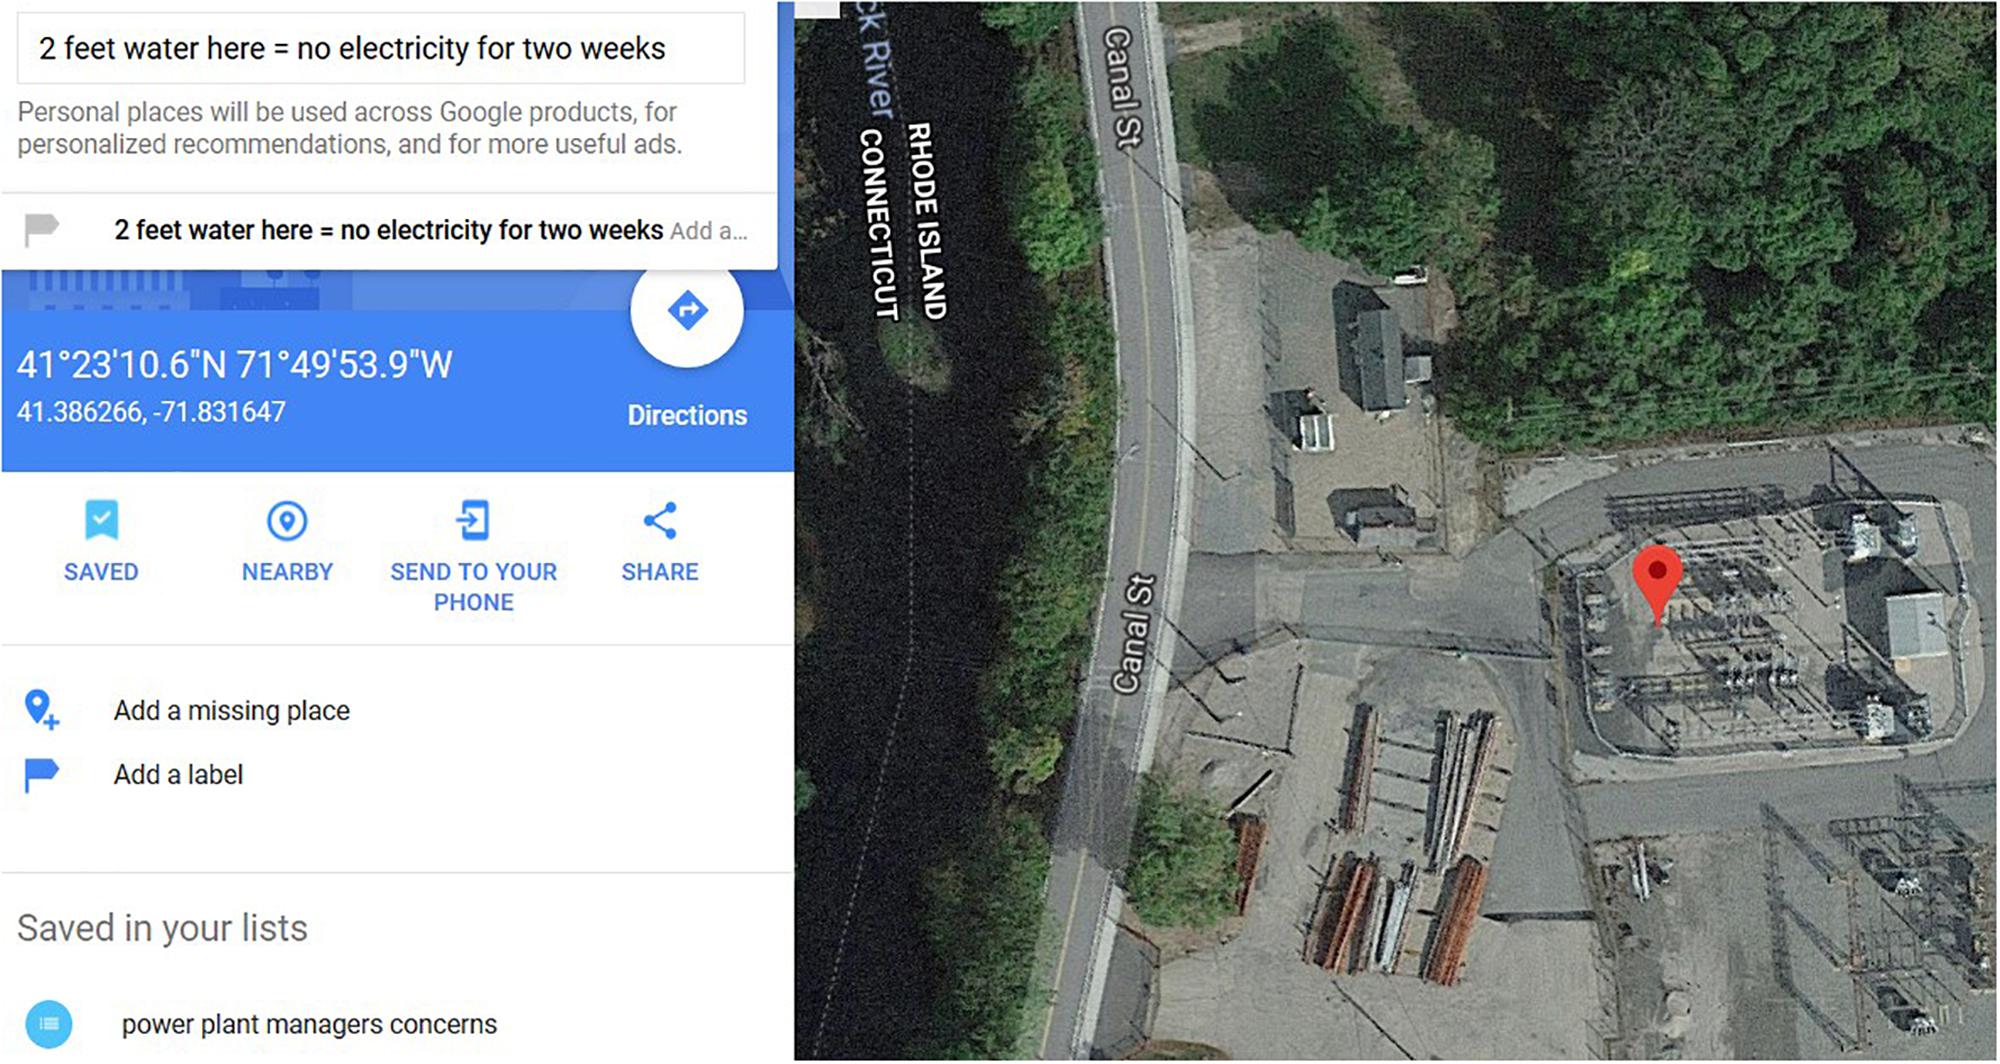
Figure 4. Interviewee’s used Google maps satellite views to identify and label locations of concern (Image: authors, data Google Maps).
Interviewee’s usually began by identifying storm consequences they had previously experienced. Once the interviewee exhausted these historical reference, asking the interviewee about unprecedented storms enabled the collection of more consequences. If interviewees had trouble identifying concerns, follow-up prompts were used to stimulate the conversation (see Appendix I). For example, questions like, “What are the consequences of one foot of flooding where we are standing now?” or “What concerns do you have if a storm with 150 mph winds passed over this facility?” both prompted additional consequences. The precise wording and order in which the questions came up were not constrained (Merriam, 1988), since interviews were focused on subjects that matched the interviewee’s knowledge and points that the interviewee brought up (Lewis and Sheppard, 2006). Interviewees identified the location of the concern using the navigable Google Maps satellite or street view during the interview.
Respondents also described their career experience and responsibilities at the facility. Interviews lasted between 1 and 2 h each.
Coding for Incorporation Into Storm Impact Model
We digitally recorded and transcribed the interviews in full with the help of a hired transcription service (200 pages). In order to answer our three research questions, we identified and analyzed all CT components mentioned by interviewees using Microsoft Excel. We also coded interviews line by line and identified themes in the data through an analytic induction method using NVivo, a form of grounded theory described by Ratcliff (1994) as an iterative process. We standardized CT components before incorporating them into a storm impact model (Table 2).
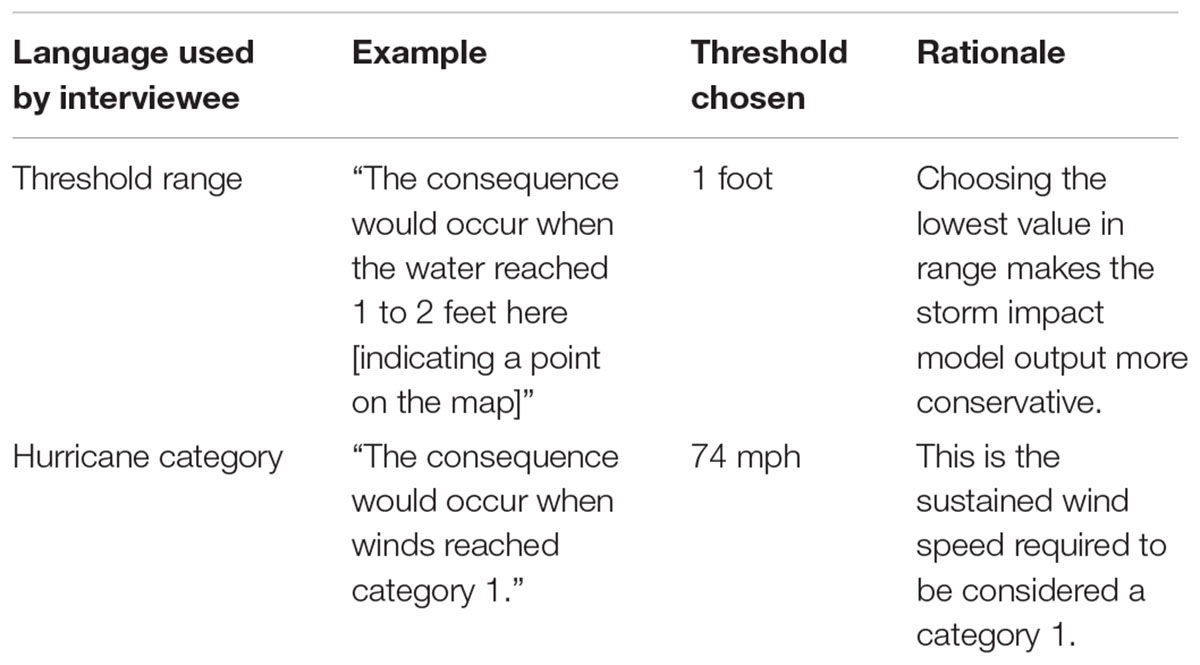
Table 2. Standardization of interviewee’s threshold component responses.
The storm impact model employed high-resolution physics-based simulations of surface winds during hurricane landfall using the track, intensity and size parameters of historic or hypothetical storm events. This model adapts Gao and Ginis (2016) model for open ocean hurricanes to account for changes in surface roughness at landfall in order to better simulate landfalling storms (Gao and Ginis, 2016). This model was developed as part of a larger project for the Department of Homeland Security Coastal Resilience Center. Storm surge response to the wind model was computed using the ADvanced CIRCulation (ADCIRC) model (Luettich et al., 1992), coupled with the Simulating Waves Nearshore (SWAN) model (Booij et al., 1999). An all numerical storm impact model combining outputs from the wind and hydrodynamic models was programmed to test the collected CTs.
The hazards available for testing CTs included:
• Wind velocity and direction at 15 min increments
• Water velocity and direction at 15 min increments
• Inundation depth based on sea surface elevation (maximum envelope of water) at 15 min increments.
• Significant wave height at 15 min increments.
• Total rainfall and hourly rate.
The use of the storm impact models allowed investigators to test the effectiveness of the whole process, and to verify whether the five components identified (the concern, the location, the modeled hazard, the threshold, and the consequence) were sufficient for modeling. Testing the gathered CTs also allowed investigators to provide feedback regarding specific CTs to participating FMs and RIEMA. The use of the full range of available time increments allowed for the order of events to be investigated (e.g., when radio communications would be likely to fail or when a particular road would be blocked).
Results
The results section is ordered according to the five CT components. We discuss themes for each component that emerged from analysis of interview transcripts.
Concerns
The CT collection method resulted in identification of 201 concerns from 13 interviewees representing 11 critical facilities (see Supplementary Table 1). Many concerns and associated consequences were based on the interviewee’s experiences with the Floods of 2010 and Hurricane Sandy.
The Accurate Location of Concerns
Since geographical coordinates are necessary to integrate CTs into storm models, the accurate location of each concern was noted by the respondent. Most concerns could be tied to one location, but the interviewees explained that 40 of the 201 concerns had multiple locations in Westerly that were difficult to geospatially locate. For example, one interviewee was concerned that a storm would flood fire hydrants and prevent his firemen from reaching them. However, the interviewee did not know the locations of the fire hydrants that were at risk to flooding and therefore the concern was not incorporated into the storm impact model. Though a GIS database of fire hydrants for Westerly probably exists, bringing those additional datasets in was beyond the scope of this project. In other examples, the interviewee could identify several locations, but was not aware of which in particular would be vulnerable to a storm impact. Other concerns interviewees were not able to immediately geospatially identify included:
(1) Roads
(2) Telephone lines
(3) Power lines
(4) Sewage/rain man hole covers
(5) Residential oil tanks
(6) Residential propane tanks
(7) Residential basements
(8) Fire hydrants
(9) Personnel
(10) Vehicles
Modeled Hazards
One Hundred-Ninety three FM consequences could be triggered by either a hydrodynamic, wind, or precipitation model. FMs explained that 90 CTs were at risk to standing inundation, 74 to wind, 13 to rain, seven to storm surge, and five to wave height (Table 3). However, the clearest challenge in gathering modelable CTs from FMs was the incompatibility of terms from the wind and ocean models which are based on physical simulations and the observations of FMs. Whereas water velocity and direction can be modeled in meters per second, these forces are seldom measured or discussed in those terms. For example, one fire chief was concerned that storm surge could cause a bridge his crew relied on to collapse, but could only estimate that a “Category 5 hurricane” would cause this to happen. Without a quantifiable water velocity or direction that would cause the collapse, we could not include this consequence into the models. Validation of modeled surge velocities often relies upon forensic studies of damage (Pistrika and Jonkman, 2010). As will be subsequently discussed, the incompatibility of terms makes it difficult for FMs to identify thresholds. Even those who have witnessed events have no practical way to estimate forces.
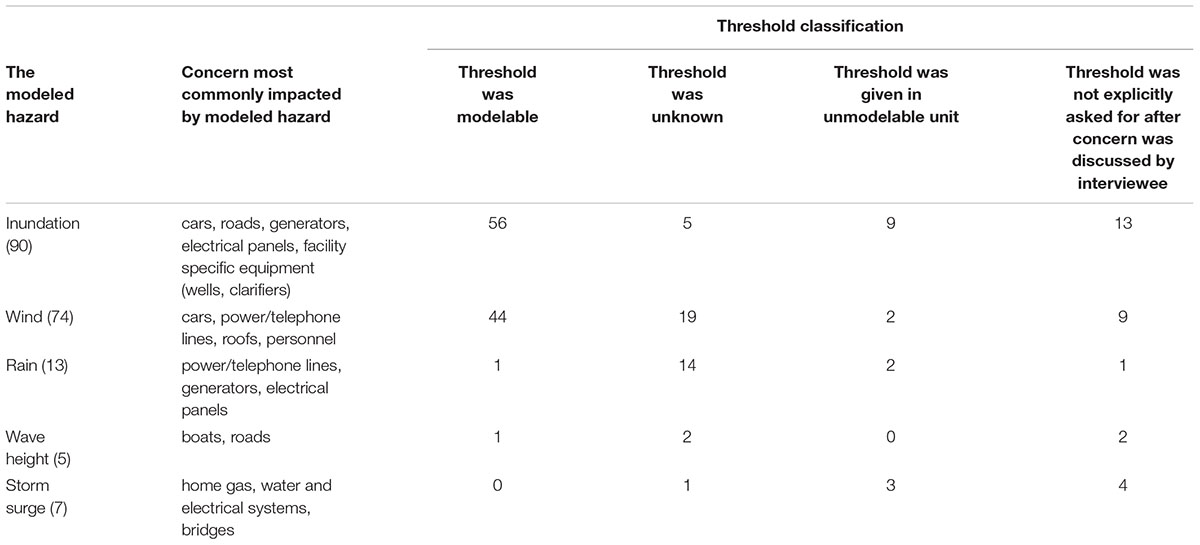
Table 3. Total number of concerns, description of concern for each modeled hazard and coding classification of corresponding threshold component for 13 Westerly FMs of 11 critical facilities.
Several consequences could be triggered by “hazards” that were not part of the underlying storm simulation. For example, ten consequences could be triggered by hurricane forecasts. If the National Weather Service (NWS) warned that a category 2 hurricane was going to hit Rhode Island, an ambulance corpsman would station an ambulance on the other side of the Pawcatuck River to maintain access to certain neighborhoods. Also, when combined with other storm forces, time was mentioned as a hazard for a few CTs. For example, an ambulance corpsman explained that if roads were blocked by fallen trees for 9 days, his facility would run out of fuel because fuel deliveries could not arrive. Both of these hazards would be challenging to model because they rely on the behaviors of individuals (Aerts et al., 2018).
Highly specific thresholds combined with time incremented events provided valuable feedback to EMs and made it possible to discuss the order consequences from the modeled storm would occur (the unfolding of these events can be seen in Figure 5).
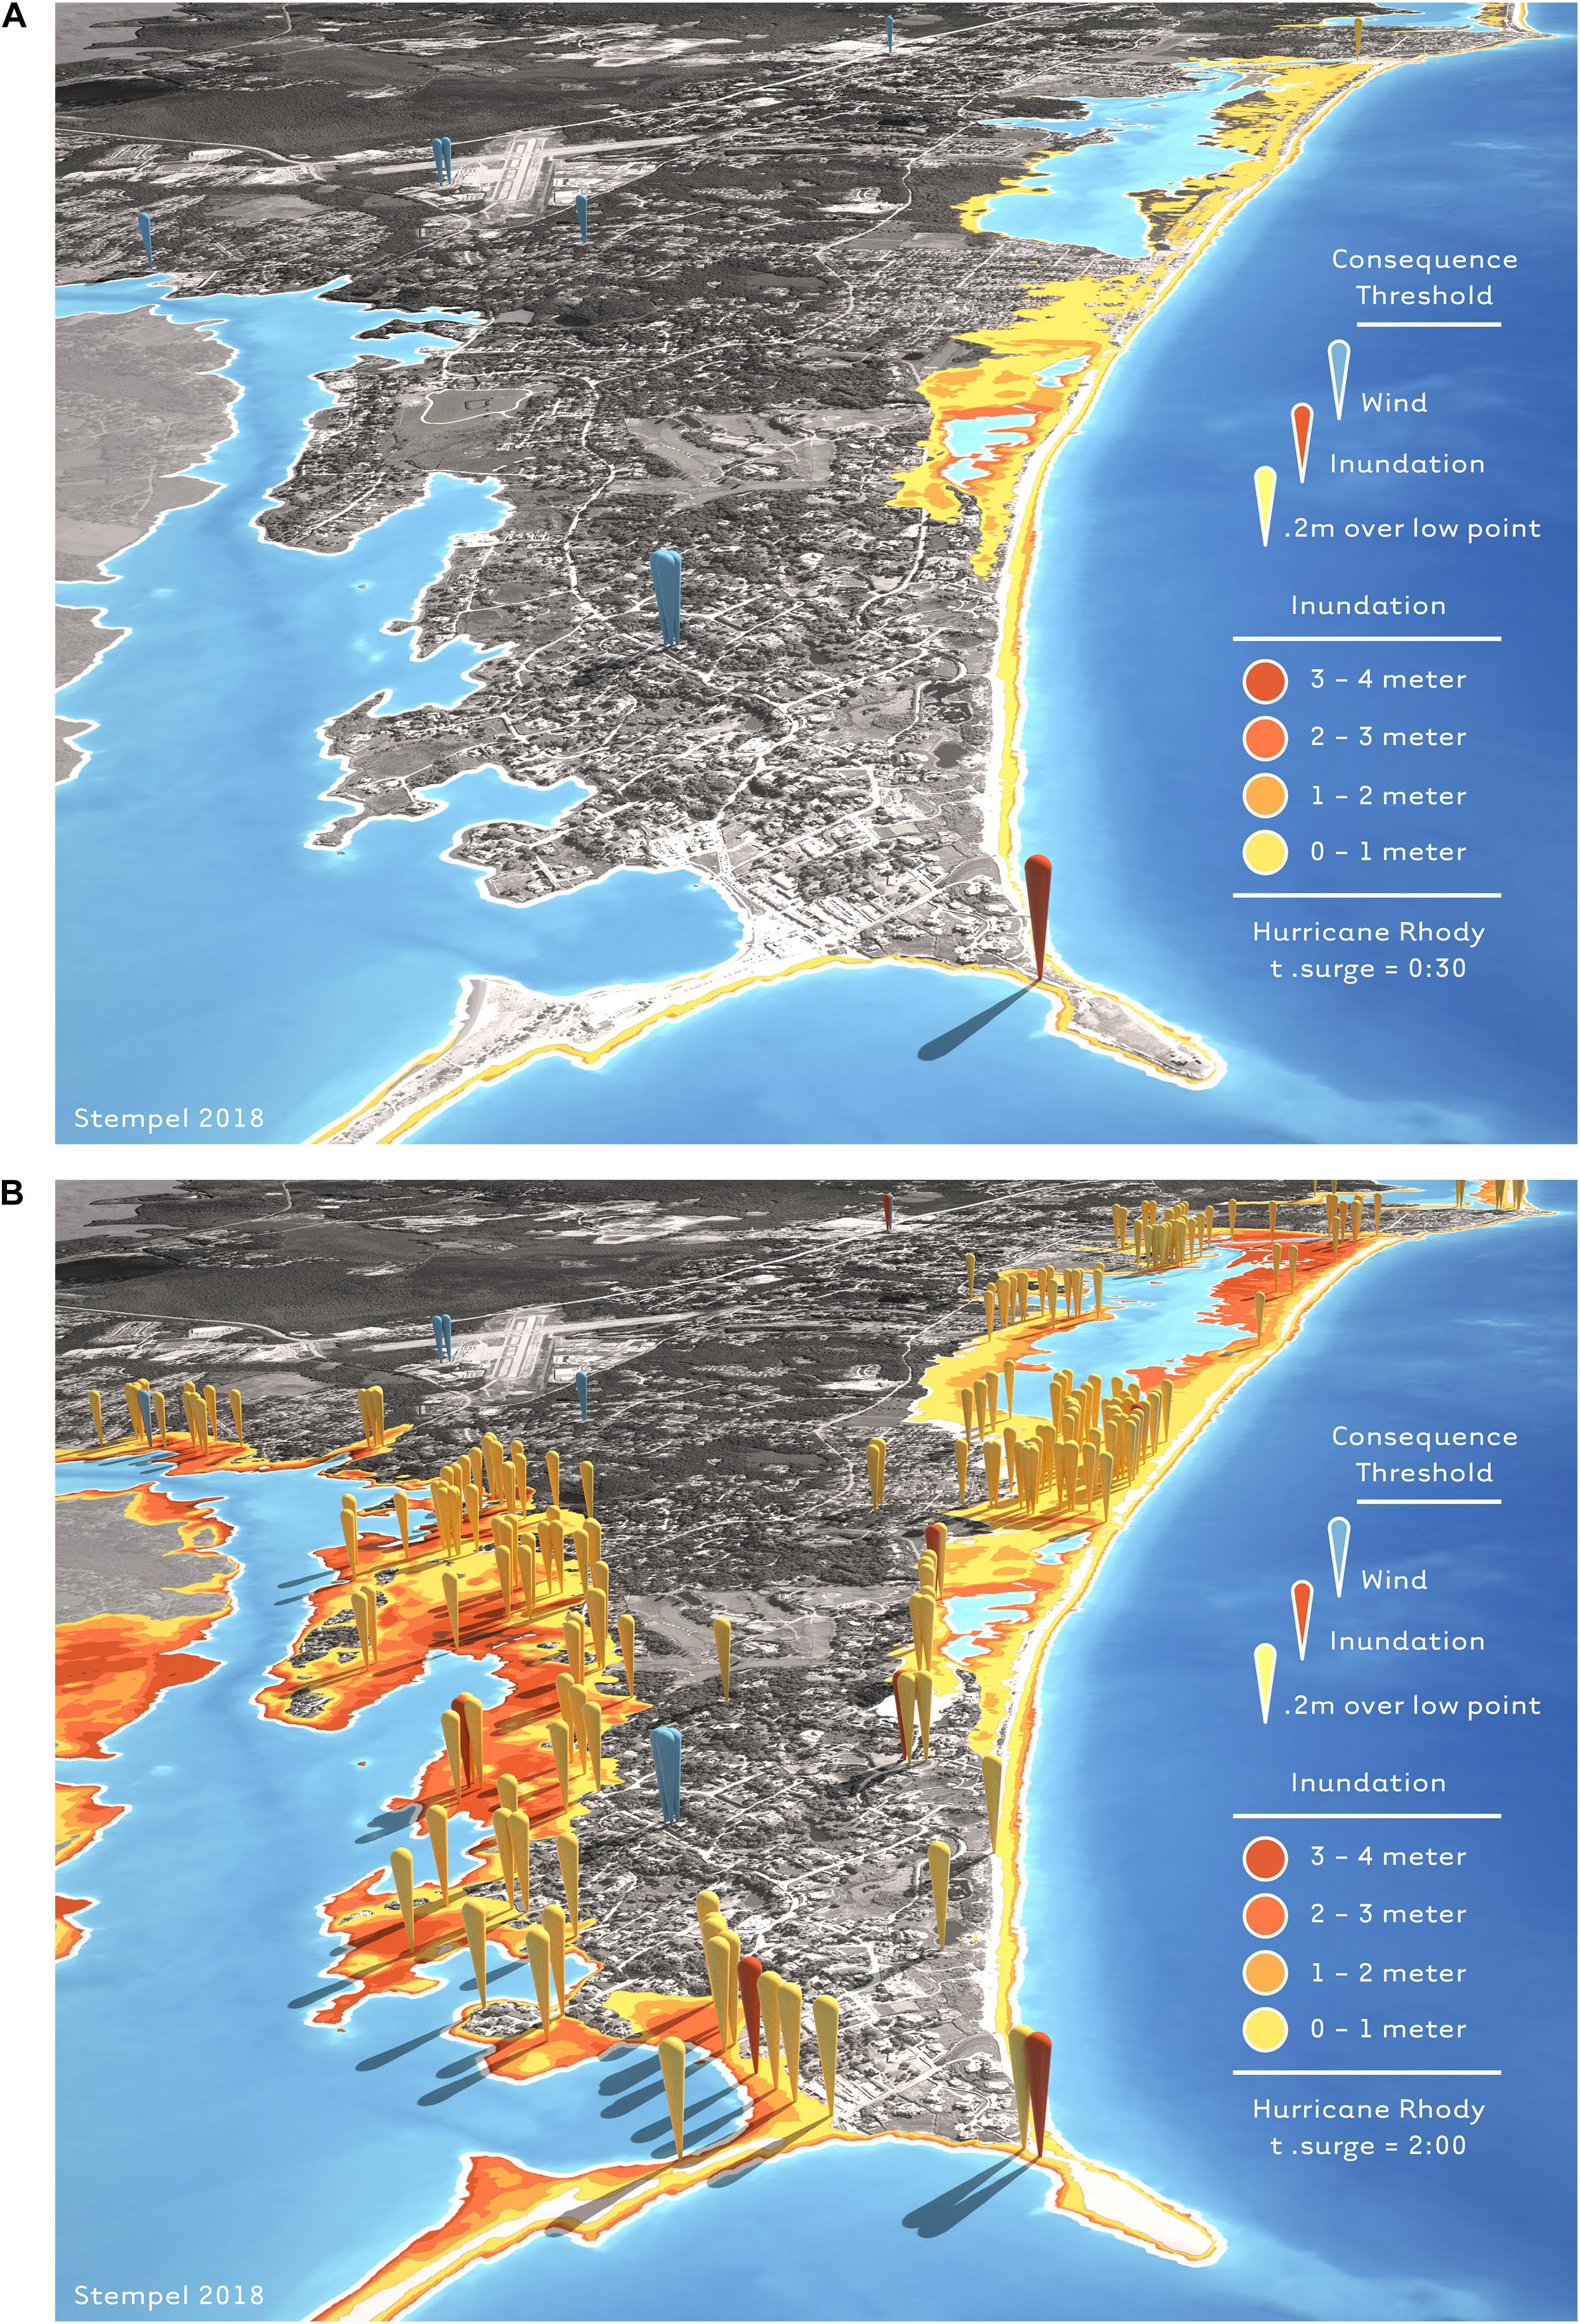
Figure 5. Storm impact model for Westerly’s critical facilities showing wind and inundation CTs triggered by hypothetical Hurricane Rhody 30 min (A) and 2 h (B) after Rhody’s landfall. The red pin in front is a CT triggered by one foot of flooding and represents a fire chief’s concern that, “When it floods above a foot here, we can’t reach the homes around the lighthouse.” Yellow pins show where inundation blocks roads (Image: authors).
Thresholds at Which a Consequence Is Triggered
Interviewees most commonly gave thresholds for flooding in feet and wind speed in miles per hour. 86 of the 201 CTs could not be incorporated into storm impact models because the interviewee did not know the threshold, it was not explicitly asked for, or the interviewee gave the threshold in unmodelable units (Table 3). Almost every threshold given by interviewees was coded as uncertain, which means the interviewee was willing estimate the threshold, but was unsure of its accuracy. 41 of the thresholds were coded as “unknown,” which means the interviewee was not willing to estimate the threshold. One interviewee illustrated this dilemma when he said, “for an antenna to break, each one has a rated wind speed velocity– and you have to look up each and every antenna because there’s multiple types of antennas, different manufacturers.” Only one threshold was modelable for rainfall and no threshold was modelable for storm surge because interviewee’s do not know numerical values of rainfall rates or storm surge velocities (Table 3). One interviewee illustrated this when he said, “When it rains, it rains hard! That’s all I know.” Similarly, for storm surge, another interviewee explained that he would not drive his fire truck through water, “If you could see a decent current with any type of like a ripple to it.”
When asked for the threshold that would cause the impact, interviewees asked the researcher for wind speed/storm surge levels of Hurricane Sandy and the rainfall amounts of the Floods of 2010. Interviewees also tried to look up these thresholds online during the interview. One interviewee illustrated a commonly given un-modelable threshold with the quote, “Whatever the 2010 floods were, how much rain we got.”
Consequences
This method collected a range of FM’s storm concerns. 195 consequences were immediate, e.g., when water reaches one foot at a generator, the generator short-circuits. Eight consequences were long term, e.g., sand deposits prevent fire trucks from accessing certain areas after a storm. 50 of the consequences were related to mobility (roads/vehicles), 41 of the consequences were related to power (power lines/electrical panels/generators), 40 were related to communications (telephone lines/antennas), 34 were related to specific equipment operated by waste water and water purification plants (pump stations/wells), 22 were structural (windows/roofs) and five were related to personnel. 26 of the consequence components included an interviewee‘s immediate response to the consequence and 34 included an interviewee’s long-term response to the consequence. For example, the water department’s wells need to be shut down immediately if water reaches them and then they require a long-term chemical treatment process once the floods recede. Most consequences mentioned by emergency response FMs (firemen, policemen, and ambulance corpsmen) were related to mobility and communications.
Discussion
This research collected interviewee’s intra-facility level storm consequences for incorporation into storm impact models and identifies challenges and opportunities posed by the process. This work contributes to answering the call for applied research that links geographic information to practitioners concerns (Moser, 2010) and for the development of multi-criteria tools in order to include non-monetary intangible damage into the assessment framework of flood damage analysis (Messner et al., 2013). The following section discusses findings based on the three guiding research questions.
RQ1 - How Can Existing Methods for Eliciting Vulnerability Data Be Adapted to Collect FM’s Intra-Facility Level Storm Concerns for Inclusion in Storm Impact Models?
Participatory mapping using Google Maps and a set of exploratory open-ended questions was an effective way to collect interviewee’s storm concerns. Many of the concerns mentioned at the beginning of interviews had been impacted during Rhode Island’s Floods of 2010 and Hurricane Sandy. Also, beginning interviews with storm consequences that have already occurred may have made the research more relevant and realistic to FMs, which likely made it easier for interviewees to identify CT components. Interviewees readily identified location of concerns on the navigable Google Map satellite view during the interview. When the satellite view was limited, Google Map’s Street View, which includes a 3D visualization, helped identify location of concerns. Identifying the location of concern on a Google map made it easier to record interviewee’s concerns and identify remaining CT components. For example, identifying locations of concern helped identify thresholds because we could explain to the interviewee that thresholds should be for the location the interviewee identified on the map. This was useful because interviewees tended to identify inundation thresholds in feet above sea level instead of feet above ground level at the location of the concern.
Consequence Thresholds can be integrated with static and dynamic models. This is a key feature of the CT approach, as it allows the audience to understand how consequences of storms unfold over time. Once the CTs are integrated with a storm model, the parameters of the model (e.g., surge, wind speed, and flooding) trigger concern thresholds upon running the model. To illustrate, we incorporated the CTs from this project into a storm impact model for a hypothetical storm, called Hurricane Rhody (Ginis et al., 2017). Hurricane Rhody is a plausible hurricane scenario created to simulate the effects of a high-impact storm on the Rhode Island coast in order to provide state and local agencies with better understanding of the hazards associated with extreme hurricanes. The characteristics of the hurricane are not arbitrarily chosen, but are based on those of several historical storms that have impacted the region. In this example, 23 of the CTs identified in interviews were triggered by wind and 21 CTs were triggered by storm inundation. Text Box 1 describes some of the 44 CTs triggered by Rhody in chronological order.
RQ2 - What Challenges Exist When Collecting FM’s Concerns for Incorporation Into Storm Impact Models?
The most common challenges when collecting interviewee’s concerns for incorporation into storm impact models are identifying modelable thresholds and identifying accurate locations of concern.
Challenge 1 - The Modelable Threshold Identification
Researchers conducting climate change vulnerability assessments have found that determining the quantified weather force that would cause a particular consequence on a community was, “considerably more challenging than [determining] qualitative descriptors like hotter, drier and rainier” (Gustafson et al., 2018, p. 155). Shackley and Deanwood (2003) found stakeholders were reluctant to quantify climate forces and associated consequences because quantification precisely defines the model scenario and is less likely to be correct than less accurate qualitative statements. This research found that stakeholder’s uncertainty extends to storm force thresholds.
To help future researchers collect FM’s concerns for incorporation into storm impact models we recommend researchers ask a set of standardized questions with consistent anchors after an interviewee mentions a concern. For example, the researcher should ask, “Would the concern be impacted when water reached between 0 and 1 foot (anchor 1), 1 to 2 feet (anchor 2), or above 2 feet (anchor 3) at the location of concern?” Since many interviewees referenced previous storms that impacted their facility to identify the threshold, we recommend researchers use the thresholds of the biggest and most recent storms to affect the interviewee’s area as the anchors. Another way to standardize the threshold identification process could be by showing a set of photographs, videos or realistic visualizations of the storm forces. For example, a researcher could show photographs or videos of 60, 100, and 140 mph winds in another area or realistic visualizations for the interviewee’s facility under various inundation levels. Finally, if interviewees are not comfortable giving a threshold, or even a threshold range, researchers should ask for the concern’s make and model so the researcher can look up the threshold after the interview. To promote effective policy through model building, iterative processes like this are key (White et al., 2010).
Challenge 2 - Unknown Locations of Concerns
Twenty percentage of interviewee’s concerns could be impacted at many locations. For example, interviewees were concerned about power lines, roads and fire hydrants. Without identifying the exact latitude and longitudes of these concerns, it is not possible to incorporate them into storm impact models. To incorporate CTs with multiple, currently unknown locations into storm impact models we recommend the creation of datasets of these locations. Determining the locations of concern for sewage manhole covers, fire hydrants, telephone/power lines and the remaining concerns with multiple unknown locations was outside of the scope of this work. However, we were able to use existing e911 road data to conduct a roadway low point analysis for Westerly to account for interviewee’s road inundation concerns. When water reached above 8″ at the low point on the road, the road was flagged as impassable since that is the depth some Westerly FMs are blocked (Box 1). Similar analyses can be done for remaining CTs that have vague locations of concern once locations of concerns are collected for those CTs.
Box 1. CTs triggered by hypothetical “Hurricane Rhody” storm simulation.
Day 1
0000h - Hurricane Rhody’s winds knock out Westerly’s power and no emergency responder has communications, aside from cell phones and hand-held radios (CT 10061).
Day 2
0000h - Hurricane Rhody makes landfall.
0030h Storm surge blocks a fire department from reaching sections of homes (CT 10203).
0100h Westerly’s water distribution pipes may be broken and the water supply of the town may be contaminated (CT 10022).
0200h - the storm pushes water further inland and floods the WWTP, which requires the plant to operate as a primary facility for 10 to 21 days (CT 10192) and receive essential materials from another WWTP (CT 10193).
0230h Westerly’s main power station is flooded and requires a mobile substation (CT 10072). The water department requires two wells to shut down and be chemically treated for 72 hours (CTs 10175-10176).
RQ3 - How Are Storm Impact Models Improved by Collecting FM’s Concerns Through a Participatory Process?
Incorporating qualitative consequences of storms can improve storm impact models by increasing their accuracy and relevance to participants. Traditional DRR assessment outputs struggle to provide actionable data regarding relevant, specific local concerns for communities to use to prepare for disasters (Paul et al., 2018). For example, caution needs to be used when analyzing HAZUS hurricane damage outputs for a community’s facilities because results are based on average damages to similar facilities under similar circumstances (Vickery et al., 2006). Traditional DRR outputs like HAZUS also do not take into account intangible consequences of storms like losses of cultural assets (Messner and Meyer, 2006) even though these types of losses are what people normally mourn the most after a flood (Becker et al., 2015). Therefore, including FMs concerns using a participatory process allows storm impact models to output more specific local concerns than relying on generalized damage curves and may make the models more credible, actionable and relevant to participating FMs. However, additional research is needed to quantify how developing CTs through participatory processes influences a storm impact model’s credibility, actionability and relevance for participating FMs.
As storm simulations increase in accuracy (Aerts et al., 2018), on-the-ground vulnerability information will need to be collected with increasing precision using a participatory method to use these models most effectively. Incorporating CTs into many storm impact models through a Montecarlo analysis may help decision makers more objectively prioritize storm adaptations (see for example (Bosma et al., 2015). The use of these methods goes some distance to addressing concerns about uncertainty. Storm impact models may also assist FMs prepare for real storms in the days and hours leading up to landfall (Stempel et al., 2018).
Broader Implications
That investigators had to make consequential decisions in implementing the data that was collected (e.g., choosing the most conservative estimate) points to the need for consistency and standardization in processes. Anchoring and other methods previously elaborated will help that process. There is a larger question regarding the utility and perceived legitimacy of CTs if they are utilized outside of local processes in which thresholds are gathered, tested, and reflected to participants. Participation not only enhances the perceived legitimacy of the outputs (White et al., 2010), there are real questions as to the validity of the gathered thresholds where individual judgments on the part of FMs are applied outside of the particular facilities and situations with which they are familiar. If CTs are to function as more than boundary objects—points of common communication between FMs, EMs, and scientists—attention must be paid to standardizing procedures for gathering data. This may include, for instance, standardizing anchor points and prompts among different researchers and agreeing that the conservative estimate will be utilized. If sufficient data can be gathered for common types of facilities using consistent methods, it may be possible to aggregate and generalize CTs once enough have been collected to situations for which no new data is gathered.
Limitations of This Approach
This methodology was piloted with some of the FMs of one community and should be repeated with other FMs in other regions in order to both validate the utility of the approach and refine it based on the findings described in this paper. Modeling storm surge impacts involves compounding uncertainties. In addition to, the uncertainty of the scenario itself (probability of occurrence), there are uncertainties regarding the interaction between the landfalling hurricane, landform, and physical infrastructure that are not accounted for in numerical simulations (Kostelnick et al., 2013). Uncertainty on the part of interviewees regarding the thresholds are compounded on top of those existing uncertainties, and thus not accounted for.
Precisely quantifying the storm force at which a consequence occurs makes the output appear more certain than it is (Shackley and Deanwood, 2003). When experts identify a point at which a certain piece of infrastructure will fail, it is likely that the point has a good deal of uncertainty, which is not easily shown by the point (Cooke and Goossens, 2004). Adding an additional query regarding uncertainty may address some of these concerns, however, many of these interactions are fundamentally unknowable (Couclelis, 2003). Until sufficient external validation takes place, in part through engineering based structural analyses that address newly identified concerns, the utility of CTs is thus best understood as a tool for DRR used with participating EMs and FMs (Schroth et al., 2011). Also, selecting appropriate FMs is an important additional step if the method presented here is to be used to prepare communities for storms.
An essential next step in developing and assessing the utility of CTs is a comparison between CTs and fragility curves for impacts that are conducive to such an analysis. This comparison can underscore the complimentary nature of the approaches.
Conclusion
As storm impact models and the underlying storm simulations increase in accuracy and applicability, researchers will need to develop standardized methods to collect on-the-ground vulnerability information in a participatory manner to increase the relevance and credibility of storm impact models. This paper presents an exploration of a methodology that collects FM’s rich concerns at the intra-facility level for incorporation into storm impact models. Using semi-structured interviews and participatory mapping, results show CTs triggered by a hydrodynamic model (Stempel et al., 2018; Witkop et al., 2019). 96 CTs were collected and incorporated into storm impact models using principals from participatory mapping and vulnerability assessment literature. Interview methods were based on existing practices for vulnerability assessments (e.g., Stenek et al., 2011; Peters-Guarin et al., 2012; Cox et al., 2013), and further augmented to obtain data based on impact modeling methods (Stempel et al., 2018). After incorporating these concerns into storm impact models, we found the chronological order a hypothetical storm would impact those concerns. The basis for the method tested is drawn from and expands current approaches to vulnerability assessment that address aspects of disaster risk and citizen science related to DRR.
This work reveals distinct challenges, specifically in the mismatch between the nomenclature of model simulations (e.g., velocity measured in meters per second) and the observed experiences of FMs. Given the possible identified role of anchor points, and the importance of decisions made by researchers such as using the most conservative estimate of a threshold, standardization becomes more than a matter of best practices. Standardization of interview and data handling procedures becomes an essential part of ensuring the validity of collected data in a local process. It further supports the possibility that CTs could be used more broadly, especially where common infrastructure types, vehicle types, or insurance standards are utilized. If the qualitative data held by FMs can be leveraged to create qualitative thresholds that can be more broadly applied, EMs, FMs, and scientists may gain an important new tool to aid in planning disaster response and DRR more broadly.
Ethics Statement
University of Rhode Island’s Internal Review Board was the ethics committee that approved this study. Researchers obtained written consent from interviewees for the interview and recording prior to the start of interviews.
Author Contributions
PS, AB, and RW conceptualized the research questions. RW conducted interviews and interpreted the data. IG provided the underlying storm models. All authors drafted the manuscript, read and approved the final version of the manuscript.
Funding
This material is based upon work supported by the United States. Department of Homeland Security under Grant Award Number 2015-ST-061-ND0001-01 and by the USDA National Institute of Food and Agriculture, Hatch project 1014166.
Conflict of Interest Statement
The authors declare that the research was conducted in the absence of any commercial or financial relationships that could be construed as a potential conflict of interest.
Acknowledgments
We thank Mark Bennett from the Rhode Island Emergency Management Agency for connecting us to the local emergency and facility managers of Westerly. Pam Rubinoff and the Coastal Resources Center and RI Sea Grant also assisted by providing contacts and input to the project.
Supplementary Material
The Supplementary Material for this article can be found online at: https://www.frontiersin.org/articles/10.3389/feart.2019.00133/full#supplementary-material
References
Adger, W. N., Quinn, T., Lorenzoni, I., Murphy, C., and Sweeney, J. (2013). Changing social contracts in climate-change adaptation. Nat. Clim. Change 3:330. doi: 10.1038/nclimate1751
Aerts, J. C. J. H., Botzen, W. J., Clarke, K. C., Cutter, S. L., Hall, J. W., Merz, B., et al. (2018). Integrating human behaviour dynamics into flood disaster risk assessment. Nat. Clim. Change 8, 193–199. doi: 10.1038/s41558-018-0085-1
Becker, A., Burroughs, R., Kretsch, E., Mcintosh, R., and Haymaker, J. (2017). Stakeholder Vulnerability And Resilience Strategy Assessment for Maritme Infrastructure: Pilot Project for the Port of Providence. Rhode Island RI: Rhode Island Dept. of Transportation.
Becker, A. H., Acciaro, M., Asariotis, R., Cabrera, E., Cretegny, L., Crist, P., et al. (2013). A note on climate change adaptation for seaports: a challenge for global ports, a challenge for global society. Clim. Change 120, 683–695. doi: 10.1007/s10584-013-0843-z
Becker, A. H., Matson, P., Fischer, M., and Mastrandrea, M. D. (2015). Towards seaport resilience for climate change adaptation: stakeholder perceptions of hurricane impacts in gulfport (MS) and providence (RI). Progr. Plann. 99, 1–49. doi: 10.1016/j.progress.2013.11.002
Bierbaum, R., Smith, J. B., Lee, A., Blair, M., Carter, L., Chapin Iii, F. S., et al. (2013). A comprehensive review of climate adaptation in the United States: more than before, but less than needed. Mitigat. Adap. Strategies Global Change 18, 361–406. doi: 10.1007/s11027-012-9423-1
Booij, N., Ris, R. C., and Holthuijsen, L. H. (1999). A third-generation wave model for coastal regions: 1. Model description and validation. J. Geophys. Res. Oceans 104, 7649–7666. doi: 10.1029/98jc02622
Bosma, K., Douglas, E., Kirshen, P., Mcarthur, K., Miller, S., and Watson, C. (2015). MassDOT-FHWA Pilot Project Report: Climate Change and Extreme Weather Vulnerability Assessments and Adaptation Options for the Central Artery. Boston: Massachusetts Department of Transportation.
Brecht, H. (2007). Geo-technologies in hurricane research. Cartogr. Geogr. Information Science 34, 153–154. doi: 10.1559/152304007781002181
Buytaert, W., Zulkafli, Z., Grainger, S., Acosta, L., Alemie, T. C., Bastiaensen, J., et al. (2014). Citizen science in hydrology and water resources: opportunities for knowledge generation, ecosystem service management, and sustainable development. Front. Earth Sci. 2:26.
Cadag, J. R. D., and Gaillard, J. (2012). Integrating knowledge and actions in disaster risk reduction: the contribution of participatory mapping. Area 44, 100–109. doi: 10.1111/j.1475-4762.2011.01065.x
Chess, C., Hance, B. J., and Sandman, P. M. (1988). Improving Dialogue With Communities: A Short Guide For Government Risk Communication Division of Science and Research. New Jersey, NJ: Department of Environmental Protection.
Cooke, R. M., and Goossens, L. H. J. (2004). Expert judgement elicitation for risk assessments of critical infrastructures. J. Risk Res. 7, 643–656. doi: 10.1080/1366987042000192237
Couclelis, H. (2003). The Certainty of uncertainty: GIS and the limits of geographic knowledge. Trans. GIS 7, 165–175. doi: 10.1111/1467-9671.00138
Cox, R. J., Panayotou, K., and Cornwell, R. M. (2013). Climate Risk Assessment for Avatiu Port and Connected Infrastructure. Water Research Lab. Australia: University of New South Wales.
Department of Homeland Security [DHS]. (2013). Threat and Hazard Identification and Risk Assessment Guide Comprehensive Preparedness Guide 201, 2nd Edn. Washington, D.C: Department of Homeland Security.
Douglas, E., Kirshen, P., Li, V., Watson, C., and Wormser, J. (2013). Preparing for the Rising Tide. Boston, MA: The Boston Harbor Association.
Eakin, H., and Luers, A. L. (2006). Assessing the vulnerability of social-environmental systems. Ann. Rev. Environ. Res. 31, 365–394. doi: 10.1146/annurev.energy.30.050504.144352
United States Environmental Protection Agency [USEPA]. (2008). Planning for Climate Change Impacts at U.S. Ports White Paper Prepared by ICF International for the USEPA. Washington, DC: USEPA.
Federal Emergency Management Agency [FEMA]. (2012). Definitions of Critical Facilities and Risk Categories”, in: Mitigation Assessment Team Report Hurricane Sandy in New Jersey and New York. Washington, DC: Federal Emergency Management Agency.
Federal Emergency Management Agency [FEMA]. (2013). Hurricane Sandy in New Jersey and New York-Building Performance Observations, Recommendations, and Technical Guidance. Washington, DC: Federal Emergency Management Agency.
Gao, K., and Ginis, I. (2016). On the equilibrium-state roll vortices and their effects in the hurricane boundary layer. J. Atmos. Sci. 73, 1205–1222. doi: 10.1175/jas-d-15-0089.1
Ginis, I., Kincaid, C., Hara, T., Rothstein, L., Ullman, D. S., Chawla, H. A., et al. (2017). Modeling the combined coastal and inland hazards from high-impact hypothetical hurricanes. Annual project performance report prepared for the DHS Coastal Resilience Center. Chapel Hill: The University of North Carolina at Chapel Hill.
Gustafson, S., Cadena, A. J., and Hartman, P. (2018). Adaptation planning in the lower mekong basin: merging scientific data with local perspective to improve community resilience to climate change. Clim. Dev. 10, 152–166. doi: 10.1080/17565529.2016.1223593
Hapij, A. W. (2011). Multidisciplinary Assessment of Critical Facility Response to Natural Disasters: The Case of Hurricane Katrina. Reston: American Society of Civil Engineers.
Hendricks, M. D., Meyer, M. A., Gharaibeh, N. G., Van Zandt, S., Masterson, J., Cooper, J. T., et al. (2018). The development of a participatory assessment technique for infrastructure: Neighborhood-level monitoring towards sustainable infrastructure systems. Sustain Cities Soc. 38, 265–274. doi: 10.1016/j.scs.2017.12.039
Holper, P., Lucy, S., Nolan, M., Senese, C., and Hennessy, K. (2007). ). Infrastructure and Climate Change Risk Assessment for Victoria. Consultancy Report to the Victorian Government prepared by CSIRO, Maunsell Australia, and Phillips Fox. Aspendale, VIC: CSIRO.
ICF International (2017). Climate Risk and Vulnerability Assessment Framework for Caribbean Coastal Transport Infrastructure. Geneva: ICF.
Kellens, W., Terpstra, T., and De Maeyer, P. (2013). Perception and communication of flood risks: a systematic review of empirical research. Risk Anal. 33, 24–49. doi: 10.1111/j.1539-6924.2012.01844.x
Kostelnick, J. C., Mcdermott, D., Rowley, R. J., and Bunnyfield, N. (2013). A Cartographic Framework for Visualizing Risk. Cartographica. Int. J. Geogr. Inform. Geovisual. 48, 200–224. doi: 10.3138/carto.48.3.1531
Lewis, J. L., and Sheppard, S. R. J. (2006). Culture and communication: Can landscape visualization improve forest management consultation with indigenous communities? Lands. Urban Plann. 77, 291–313. doi: 10.1016/j.landurbplan.2005.04.004
Luettich, R. A. Jr., Westerink, J. J., and Scheffner, N. W. (1992). ADCIRC: an advanced three-dimensional circulation model for shelves, coasts, and estuaries”. in Theory and Methodology of ADCIRC-2DDI and ADCIRC-3DL. eds A. L.Richard, J. W.Joannes, W. S.Norman (Springfield: National Technical Information Service).
Manning, H., Carnevale, M., and Rubinoff, P. (2014). ”Rhode Island Coastal Property Guide. Rhode Island RI: University of Rhode Island’s Coastal Resources Center.
Mendonça, D., and Wallace, W. A. (2006). Impacts of the 2001 world trade center attack on New York city critical infrastructures. J. Infra. Systems 12, 260–270. doi: 10.1061/(asce)1076-0342 (2006)12
Merriam, S. B. (1988). Case Study Research in Education: A Qualitative Approach. San Francisco. CA: Jossey-Bass.
Messner, F., and Meyer, V. (2006). “Flood damage, vulnerability and risk perception–challenges for flood damage research,” in Flood risk management: hazards, vulnerability and mitigation measures, eds J. Schanze, E. Zeman, and J. Marsalek (Berlin: Springer), 149–167. doi: 10.1007/978-1-4020-4598-1_13
Messner, S., Moran, L., Reub, G., and Campbell, J. (2013). Climate change and sea level rise impacts at ports and a consistent methodology to evaluate vulnerability and risk. WIT Trans. Ecol. Environ. 169, 13.
Monioudi, I.N, Asariotis, R., Becker, A., Bhat, C., Gooden, D. D., Esteban, M., et al. (2018). Climate change impacts on critical international transportation assets of Caribbean Small Island developing states (SIDS): the case of Jamaica and Saint Lucia. Reg. Environ. Change 18, 2211. doi: 10.1007/s10113-018-1360-4
Morrow, B. H., Lazo, J. K., Rhome, J., and Feyen, J. (2015). Improving storm surge risk communication: stakeholder perspectives. Bull. Am. Meteorol. Soc. 96, 35–48. doi: 10.1175/bams-d-13-00197.1
Moser, S. C. (2010). Now more than ever: The need for more societally relevant research on vulnerability and adaptation to climate change. Appl. Geogr. 30, 464–474. doi: 10.1016/j.apgeog.2009.09.003
Moser, S. C., and Ekstrom, J. A. (2010). A framework to diagnose barriers to climate change adaptation. Proc. Natl. Acad. Sci. U.S.A 107, 22026–22031. doi: 10.1073/pnas.1007887107
Newkirk, R. T. (2001). The increasing cost of disasters in developed countries: a challenge to local planning and government. J. Contingen. Crisis Manag. 9, 159–170. doi: 10.1111/1468-5973.00165
Patton, E., and Appelbaum, S. H. (2003). The case for case studies in management research. Manag. Res. News 26, 60–71. doi: 10.1108/01409170310783484
Paul, J. D., Buytaert, W., Allen, S., Ballesteros-Cánovas, J. A., Bhusal, J., Cieslik, K., et al. (2018). Citizen science for hydrological risk reduction and resilience building. Wiley Interdis. Rev. Water. 5,1–15.
Peters-Guarin, G., Mccall, M. K., and Van Westen, C. (2012). Coping strategies and risk manageability: using participatory geographical information systems to represent local knowledge. Disasters 36, 1–27. doi: 10.1111/j.1467-7717.2011.01247.x
Pistrika, A. K., and Jonkman, S. N. (2010). Damage to residential buildings due to flooding of New Orleans after hurricane Katrina. Nat. Hazards 54, 413–434. doi: 10.1007/s11069-009-9476-y
Port of Dover (2015). Port of Dover Climate Adaptation Report. Available at: https://assets.publishing.service.gov.uk/government/uploads/system/uploads/attachment_data/file/488087/climate-adrep-dover-port.pdf
Port of Felixstowe (2015). Climate Change Adaption Report for the Felixstowe Dock and Railway Company. Available at: https://www.gov.uk/government/uploads/system/uploads/attachment_data/file/530910/climate-adrep-port-felixstowe.pdf
Porter, K. (2015). Beginner’s guide to fragility, vulnerability, and risk. Encyclopedia Earthquake Eng. 235–260. doi: 10.1007/978-3-642-35344-4_256
Preston, B. L., Westaway, R. M., and Yuen, E. J. (2010). Climate adaptation planning in practice: an evaluation of adaptation plans from three developed nations. Mitig. Adapt. Strat. Global Change 16, 407–438. doi: 10.1007/s11027-010-9270-x
Ratcliff, D. E. (1994). Analytic induction as a qualitative research method of analysis. Univ. Georgia. 1:2010.
Rinaldi, S. M. (2004). “Modeling and simulating critical infrastructures and their interdependencies”, in: System sciences, 2004,” in Proceedings of the 37th annual Hawaii international conference on: IEEE, (Big Island: IEEE), 8.
Schneider, P. J., and Schauer, B. A. (2006). HAZUS—its development and its future. Nat. Hazards Rev. 7, 40–44. doi: 10.1061/(asce)1527-6988 (2006)7
Schroth, O., Pond, E., and Sheppard, S. R. (2011). “Integration of Spatial Outputs from Mathematical Models in Climate Change Visioning Tools for Community-Decision Making on the Landscape Scale,” in Teaching Landscape Architecture, eds E. Buhmann, S. Ervin, D. Tomlin, and M. Pietsch (Bernburg: Anhalt University of Applied Sciences), 246–255.
Schultz, M. T., Gouldby, B. P., Simm, J. D., and Wibowo, J. L. (2010). Beyond the Factor of Safety: Developing Fragility Curves to Characterize System Reliability. Vicksburg: Engineer research and development Center.
Shackley, S., and Deanwood, R. (2003). Constructing social futures for climate-change impacts and response studies: building qualitative and quantitative scenarios with the participation of stakeholders. Clim. Res. 24, 71–90. doi: 10.3354/cr024071
Stempel, P., and Becker, A. (2016). “Data driven visualization”. in Proceedings of the Estuarine and Coastal Modeling Conference, South Kingstown, RI.
Stempel, P., Ginis, I., Ullman, D., Becker, A., and Witkop, R. (2018). Real-Time Chronological Hazard Impact Modeling. J. Mar. Sci. Eng. 6:134. doi: 10.3390/jmse6040134
Stenek, V., Amado, J.-C., Connell, R., Palin, O., Wright, S., Pope, B., et al. (2011). Climate Risk and Business: Ports: Terminal Marítimo Muelles el Bosque Cartagena, Colombia. Climate Risk Case Study. Washington, D.C: World Bank Group.
Reeder, T., and Ranger, N. (2011). How do you Adapt in an Uncertain World? Lessons from the Thames Estuary 2100 project. Washington, DC: World Resources Report.
Thomalla, F., Downing, T., Spanger-Siegfried, E., Han, G., and Rockström, J. (2006). Reducing hazard vulnerability: towards a common approach between disaster risk reduction and climate adaptation. Disasters 30, 39–48. doi: 10.1111/j.1467-9523.2006.00305.x
United Kingdom Climate Impacts Programme [UKCIP] (2013). The UKCIP Adaption Wizard v 4.0 [Online]. Oxford: United Kingdom Climate Impacts Programme. Available at: http://www.ukcip.org.uk/wizard/ (accesed May 26, 2017).
United Nations Conference on Trade and Development [UNCTAD] (2017). Climate Risk and Vulnerability Assessment Framework for Caribbean Coastal Transport Infrastructure: Final Report Climate Change Impacts on Coastal Transport Infrastructure in the Caribbean: Enhancing the Adaptive Capacity of Small Island Developing States (SIDS) UNDA Project 14150. Geneva: UNCTAD
United States Census Bureau (2018). QuickFacts Westerly CDP, Rhode Island. Available at: https://www.census.gov/quickfacts/fact/table/westerlycdprhodeisland/POP010210#viewtop
Vickery, P. J., Skerlj, P. F., Lin, J., Twisdale, L. A. Jr., Young, M. A., and Lavelle, F. M. (2006). HAZUS-MH hurricane model methodology. II: Damage and loss estimation. Nat. Hazards Rev. 7, 94–103. doi: 10.1061/(asce)1527-6988 (2006)7
White, D. D., Wutich, A., Larson, K. L., Gober, P., Lant, T., and Senneville, C. (2010). Credibility, salience, and legitimacy of boundary objects: water managers’ assessment of a simulation model in an immersive decision theater. Sci. Public Policy 37, 219–232. doi: 10.3152/030234210x497726
Witkop, R., Stempel, P., and Becker, A. (2019). Developing Consequence Thresholds for Storm Models through Participatory Processes: Case Study of Westerly Rhode Island. Open Access Master’s Theses. Rhode Island, RI: University of Rhode Island.
Keywords: consequence, threshold, hazard, hurricane, facility, interview, manager
Citation: Witkop R, Becker A, Stempel P and Ginis I (2019) Developing Consequence Thresholds for Storm Models Through Participatory Processes: Case Study of Westerly Rhode Island. Front. Earth Sci. 7:133. doi: 10.3389/feart.2019.00133
Received: 10 September 2018; Accepted: 14 May 2019;
Published: 12 June 2019.
Edited by:
Jonathan D. Paul, Imperial College London, United KingdomReviewed by:
José Pedro Matos, Independent Researcher, SwitzerlandHyoungsu Park, Oregon State University, United States
Copyright © 2019 Witkop, Becker, Stempel and Ginis. This is an open-access article distributed under the terms of the Creative Commons Attribution License (CC BY). The use, distribution or reproduction in other forums is permitted, provided the original author(s) and the copyright owner(s) are credited and that the original publication in this journal is cited, in accordance with accepted academic practice. No use, distribution or reproduction is permitted which does not comply with these terms.
*Correspondence: Robert Witkop, cm9iZXJ0X3dpdGtvcEBteS51cmkuZWR1