
95% of researchers rate our articles as excellent or good
Learn more about the work of our research integrity team to safeguard the quality of each article we publish.
Find out more
ORIGINAL RESEARCH article
Front. Earth Sci. , 15 May 2019
Sec. Quaternary Science, Geomorphology and Paleoenvironment
Volume 7 - 2019 | https://doi.org/10.3389/feart.2019.00106
This article is part of the Research Topic North Pacific Environment and Paleoclimate from the Late Pleistocene to Present View all 13 articles
The Late Glacial and Holocene climate of the western North Pacific is less studied than that of the eastern North Pacific. While it is well known that strong east-west gradients in the tropical Pacific Ocean influence terrestrial climate, we seek to better understand how these gradients are expressed in the northern extratropics. Toward this aim, we present an organic and stable isotope geochemical and macrofossil record from a peatland on the east coast of the Kamchatka peninsula. We find that both the early and late Holocene were wetter, with a different assemblage of plants from the middle Holocene, which was drier, with more episodic precipitation. The large ecohydrological changes at several points during the Holocene are contemporaneous with and of the same sense as those we find at places to the east, such as south-central Alaska and to the south, in northern Japan. We also find that the middle Holocene period of warmth, dryness and low carbon accumulation occur contemporaneously with an enhanced east-west gradient in tropical Pacific sea surface temperature. This suggests that that hydroclimatic conditions in the subarctic can be influenced by tropical dynamics.
Peatlands are an important part of the global carbon cycle, storing, at a minimum, 550 Gt of carbon in the form of partially decayed organic matter (Turetsky et al., 2015). Study of northern peatlands has focused mainly on sphagnum-dominated, ombrotrophic bogs. However, sedge-dominated fens are also important carbon-storing environments (Jones et al., 2009; Loisel et al., 2017). Climate and vegetation type are well-known influences on the rate of carbon accumulation in ombrotrophic peatlands, but less is known about the role of nutrient cycling. Here we investigate influence of climate on vegetation, carbon accumulation, and nutrient cycling in a typical fen environment.
The general trends of Holocene climate on Kamchatka have been established by fossil pollen, lacustrine diatoms, chironomids, and other paleoecological indicators. In brief, the early Holocene, from about 10 ka to 7 ka, was moist and cool, transitioning to a warm, dry, and windy climate during the middle Holocene from about 6.5 to at least 5 ka (Andrén et al., 2015; Solovieva et al., 2015). After about 4.5 ka, commonly termed the Neoglacial, conditions return to a cool moist climate (Hammarlund et al., 2015; Meyer et al., 2015). Carbon accumulation rates, too have been measured in various locations throughout the peninsula, and during periods of cool and/or moist climate, as in both the early Holocene and the Neoglacial, peat carbon accumulation is higher than during the dry and/or warm period of the middle Holocene (Zakharikhina, 2014; Turetsky et al., 2015).
While the general association between changes in climate and changes in carbon accumulation in peatlands have been established for Kamchatka, what is less clear in this region, and indeed, globally, are the specific mechanisms by which climate influences carbon accumulation in sedge dominated fens, as opposed to Sphagnum-dominated bogs (Jones et al., 2009; Treat et al., 2016; Loisel et al., 2017). In this study we endeavor to link changes in climate with specific changes in plant communities, hydrology, and nutrient cycling in the fen itself in order to establish causal relationships.
Newmarket Fen, a sedge-dominated peatland (Figure 1), is located on the eastern coast of Kamchatka, far east Russia, at 53.0°N, 158.5°E, 150 m elevation, which is within the city limits of Petropavlovsk-Kamchatsky. The site has subsequently been covered over by urban development. At least 30 active volcanoes and 300 extinct volcanoes and several mountain ranges add to the complexity of the vegetation history. A wet, windy climate is characteristic of the Pacific coast, with Betula ermanii (stone birch) occurring up to 500 m elevation, and Alnus fruticosa (shrub alder) above on seaward slopes and snowfields, and alpine tundra at highest elevations (Hultén, 1971).
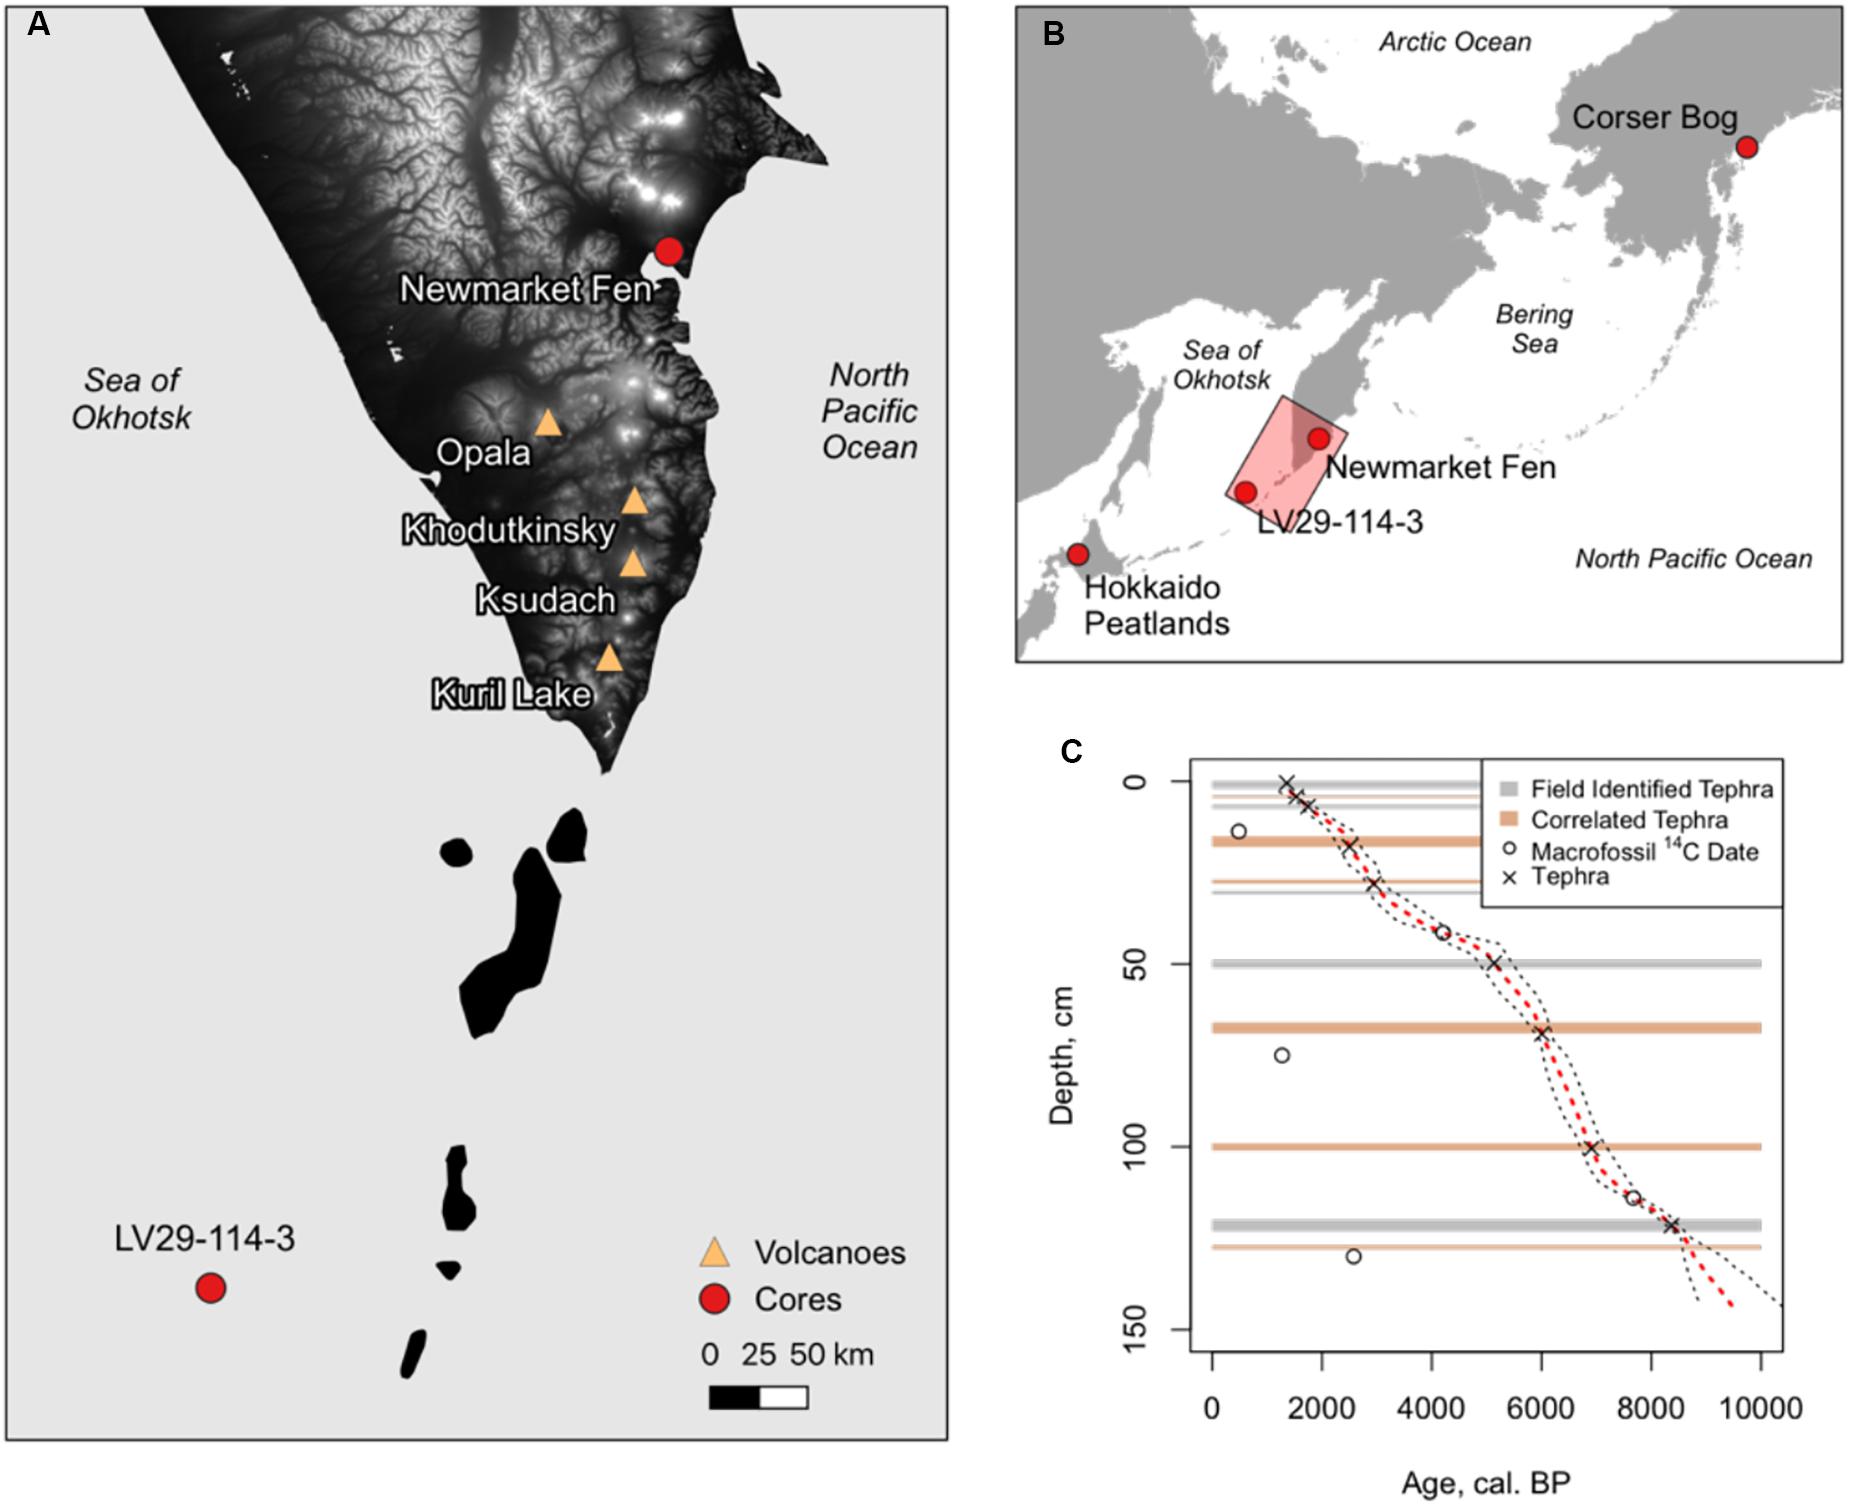
Figure 1. (A) Map of southern Kamchatka Peninsula indicating the locations of Newmarket Fen, marine sediment core LV29-114-3, and volcanoes that are the source of tephras found in Newmarket Fen sediments. (B) Overview map showing the locations of other sites mentioned in the text. The inset (A) is indicated by the pink rectangle. (C) Age-depth model constructed using Bacon (Blaauw, 2011). Locations of age control points, median modeled age, and 95% confidence intervals are shown.
In the summer of 1990, a 145 cm core was recovered from the Newmarket Fen and subsampled and described in the field at approximately 5 cm intervals. Subsequently, samples were stored in polyethylene bags with coated metal tie-tops at 4°C in the Lamont-Doherty Earth Observatory (LDEO) Core Repository until analysis. Organic matter content was measured by loss-on-ignition (LOI). Volumetric samples were oven dried to measure dry bulk density, and were then heated in a muffle furnace at 550°C for 3 h. The mass lost divided by dry weight is equal to the fraction organic matter. The weight percent and stable isotope ratios of carbon (expressed as δ13C, per mille vs. VPDB) and nitrogen (expressed as δ15N per mille vs. air) were measured by elemental analysis/isotope ratio mass spectrometry (EA-IRMS) in the LDEO Stable Isotope Laboratory. CO2 and N2 generated from whole, dried sediment samples in a Costech Elemental Analyzer are routed to a Thermo Delta V IRMS through a Thermo ConFlow IV continuous flow device.
Soluble lipids were extracted from 5 cubic centimeter subsamples of peat by ultrasonic agitation in hexane. The total lipid extract (TLE) was decanted and reserved. The solvent-insoluble portion was used for macrofossil analysis. Macrofossil samples were sieved in water at 150 μm and plant parts were identified under low-power microscopy. Plant macrofossil identifications were confirmed by comparison with the LDEO Macrofossil Reference Collection. The TLE was separated by polarity on a silica gel flash column into four fractions. Hydrocarbons are eluted with hexane; ketones, esters, and compounds with aromatic rings elute with dichloromethane; alcohols elute with a 3:1 mixture of hexane and ethyl acetate, and all remaining polar compounds, including fatty acids, elute with methanol. The hydrogen isotope ratios of n-alkanes are measured by continuous flow gas chromatography isotope ratio mass spectrometry at the LDEO Stable Isotope Laboratory. Eluent from a Thermo Trace GC is routed through a pyrolysis reactor in a Thermo GC-IsoLink device and then to a ConFlow IV continuous flow device and then to a Thermo Delta V isotope ratio mass spectrometer. Typical precision for these measurements is ±2%.
Selected stratigraphic levels were subsampled a second time to collect macrofossils for AMS radiocarbon dating. Macrofossils used for paleovegetational analysis were exposed to organic solvents derived from petroleum products and were therefore unsuitable for radiocarbon measurements. As above, subsamples were sieved at 150 μm and macrofossils were identified under low-power microscopy and confirmed against the LDEO reference collection. Macrofossils from these subsamples were analyzed in the AMS radiocarbon lab at the University of California, Irvine (UCIAMS).
Macrofossil analysis and visual inspection reveal that the sediments at Newmarket Fen are dominated by sedge peat from the top of the core all the way down to 132 cm core depth (Figure 2). Below the sedge peat are 2 cm of lacustrine sediment underlain by an additional 3 cm of sedge peat, 2 cm of sapropel, and finally, at the basis of the core, sandy clay. The 132 cm of sedge peat are occasionally interrupted by thin layers of tephra.
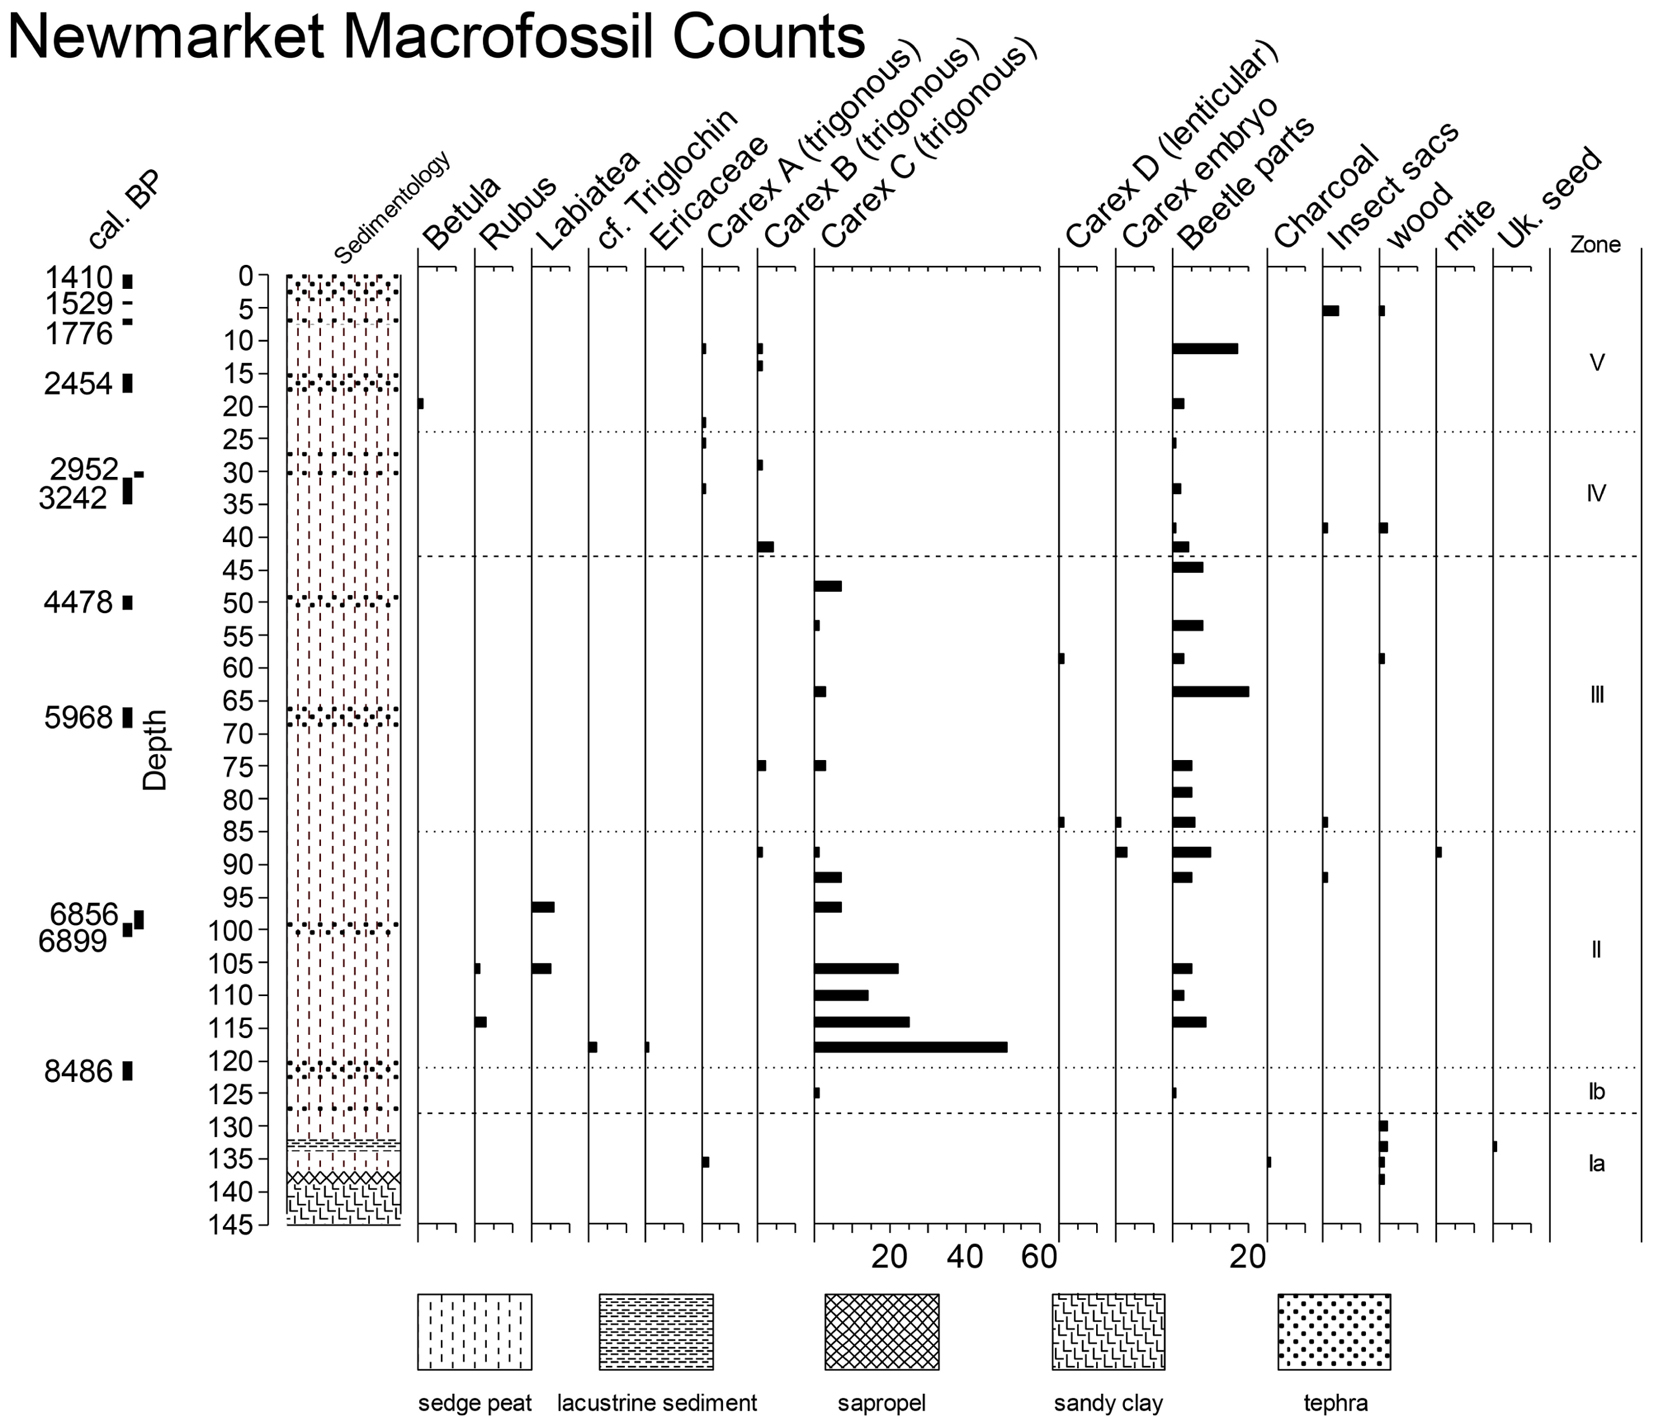
Figure 2. Macrofossil counts at Newmarket Fen along with core stratigraphy. Zonation based on macrofossil analysis is indicated with heavy dashed lines and zonation based on n-alkane abundances is indicated with light dotted lines.
Five tephra layers with published ages (Bazanova et al., 2005; Zakharikhina, 2014; Andrén et al., 2015; Solovieva et al., 2015) were identified in the field (Table 1 and Figure 2). Samples of individual macrofossils from five additional levels were dated by AMS radiocarbon analysis. Three of the five radiocarbon dates were rejected as too young. It is likely that these were root material that had infiltrated stratigraphically lower levels than contemporaneous material. Four additional tephra layers were identified by correlation with similar nearby sections using the field-identified tephra and radiocarbon ages as a guide (Supplementary Figure S1). An age-depth model was constructed using the “Bacon” Bayesian age modeling algorithm with the five field-identified tephra, two acceptable radiocarbon measurements, and four correlated tephra as input (Figure 1C).
Macrofossil counts at Newmarket Fen are dominated by sedges (Cyperaceae) at nearly all horizons above the basal mineral sediments. Four different achene morphotypes belonging to genus Carex are identified, three with trigonous morphology (arbitrarily termed Carices A, B, and C) and one lenticular (Carex D). Achenes could not be identified to species as they lacked perigynia. Seeds of various dicotyledonous taxa were also identified. These taxa include Betula, Rubus, Labiatae, Triglochin, and Ericaceae. Also abundant throughout the core are insect remains, likely Coleoptera (Figure 2).
Concentration of n-alkanes were measured for each of the 38 samples. Statistical analyses were performed on the fractional abundance of each n-alkane relative to total n-alkanes. Principal component analysis (Figure 3) revealed that the primary mode of variability in the dataset is chain length of odd-carbon-numbered alkanes.
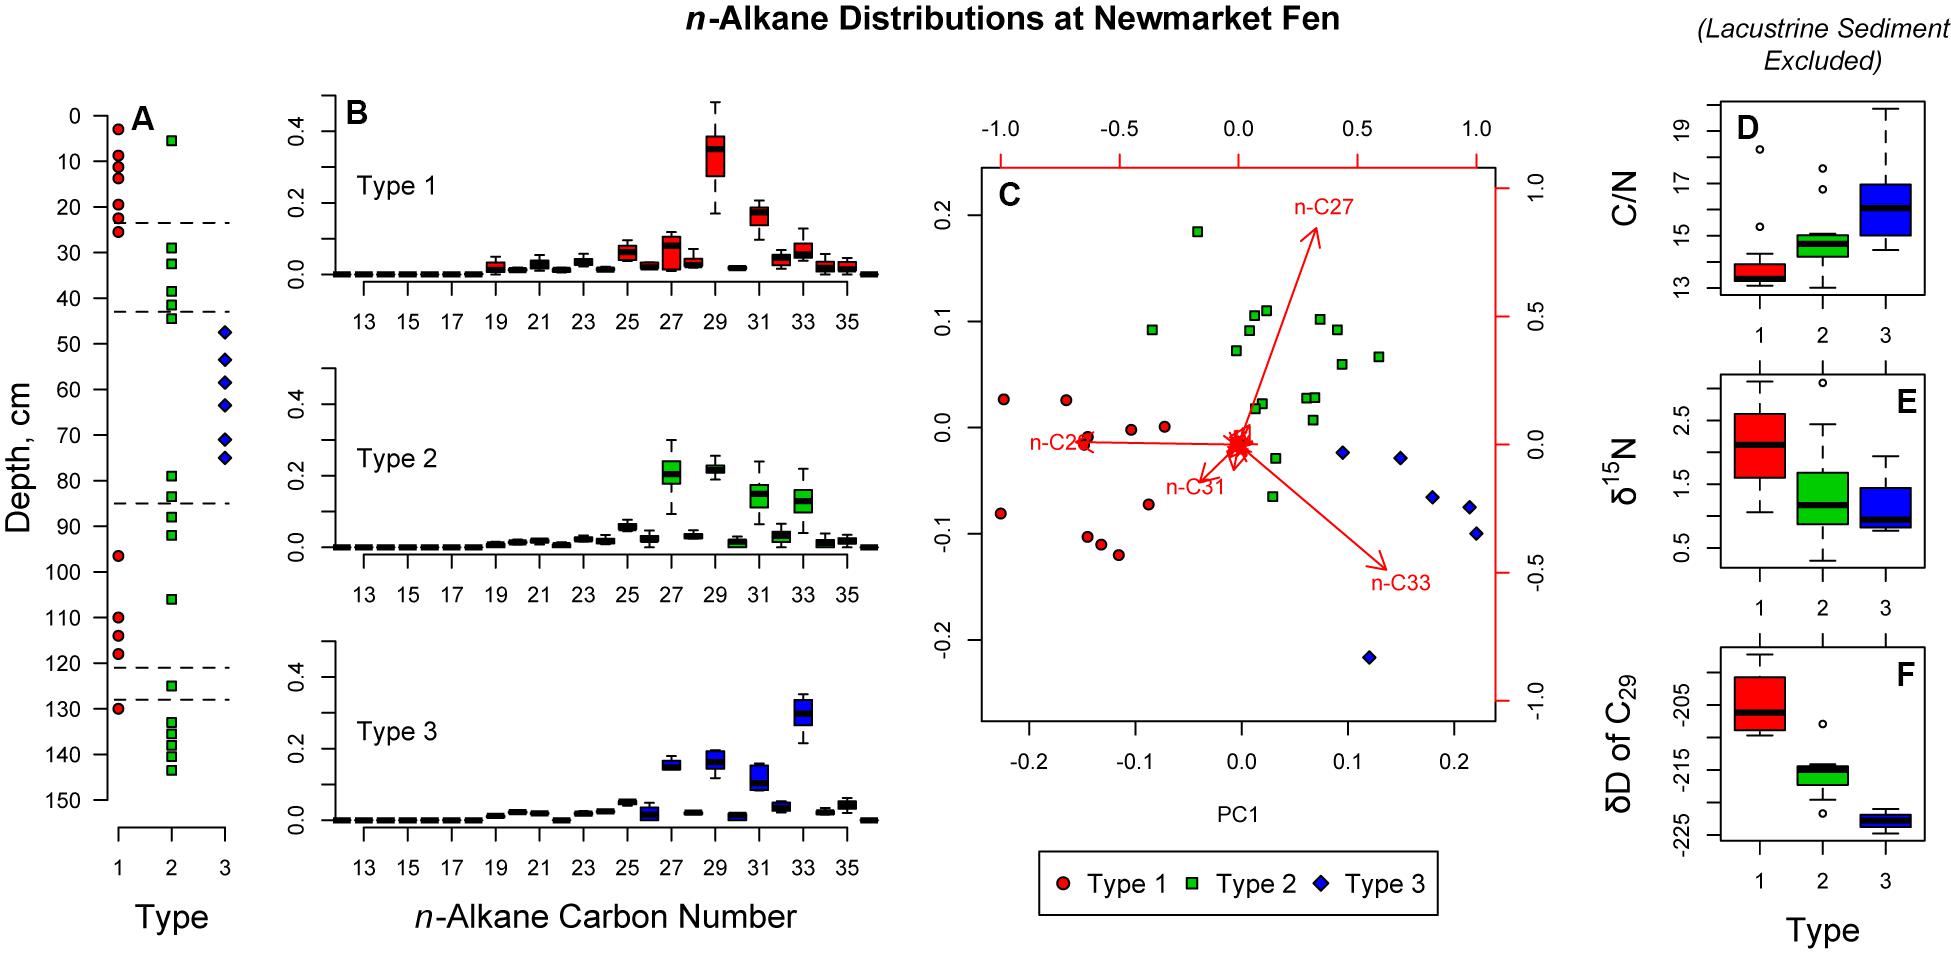
Figure 3. Results of hierarchical cluster analysis and principal components analysis on the relative abundances of leaf wax n-alkanes. (A) Type assignments by core depth; (B) Box-and-whisker plots of n-alkane relative abundance for each type; (C) Principal components analysis biplot. Point color and shape are determined by hierarchical cluster analysis; (D–F) Box-and-whisker plots of C/N ratio, δ15N, and hydrogen isotope ratios of C29 n-alkane. For all box-and-whisker plots, the heavy line in the center is at the median, the shoulders of the box indicate the interquartile range, the whiskers extend to the most extreme data not more than 1.5 times the interquartile range, and the points beyond 1.5 times the interquartile range from the box are indicated with points.
Both macrofossil counts and n-alkane concentrations were used to divide the stratigraphy into 5 zones (Figures 2–4). Depth-constrained sum-of-squares cluster analysis [CONISS, (Grimm, 1987)] of a Euclidean distance matrix of macrofossil counts revealed three zones, while the same analysis of n-alkane relative abundance further divided two of the macrofossil zones, resulting in five total vegetational zones, hereafter labeled with Roman numerals increasing from oldest to youngest (Table 2).
In addition to constrained cluster analysis, we also performed an unconstrained hierarchical cluster analysis of the Euclidean distance matrix of n-alkane relative abundance. This analysis resulted in three distinct n-alkane distribution types, each with different alkane of maximum abundance (Figure 3). Zones II and V are dominated by Type 1, for which C29 is the most abundant n-alkane. Zone III is dominated by Type 3, for which C33 is most abundant. Type 2 is a wider distribution with a less distinct mode. This type dominates Zone I and IV along with the transition between II and III. Because individual plants are more likely to have a single alkane as a mode of its distribution (Bush and McInerney, 2013), we interpret Types 1 and 3 to represent more monospecific environments, while Type 2 represents a more diverse assemblage of plants. This interpretation is somewhat supported by the macrofossil data, however, Type 2 could also represent a transitional environment that is a mixture of plants occurring in both Types 1 and 3.
The concentration and isotope ratios of carbon did not change significantly throughout the sedge-dominated portion of the stratigraphy. Unsurprisingly, the concentration of carbon is low in the basal lacustrine sediments as compared with the peat above. Carbon isotope ratios had a median value of −27.6% and ranged from −28.9 to −26.7% with no discernible downcore trend—typical of organic matter originating from plants using the C3 photosynthetic pathway (Meyers, 1994).
The rate of carbon accumulation was calculated by multiplying the dry bulk density (as measured during LOI analysis) by the percent carbon (as determined by EA-IRMS and LOI) and by the sedimentation rate (as determined by the age model). We find that throughout the stratigraphy at Newmarket Fen (Figure 4), carbon accumulation rates are, in general, low, with a median at 13 g m–2yr–1, compared with that of Sphagnum bogs, with a median near 23 g m–2yr–1 (Loisel et al., 2014). Carbon accumulation is lowest during the lacustrine phase of the stratigraphy, but during the peat phase, the minimum carbon accumulation rate is about 11 g m–2 yr–1 and occurs at the top Zone III. Two local maxima occur near the top of Zones II and IV, at about 35 and 25 g m–2 yr–1, respectively. Carbon accumulation decreases during phases of the stratigraphy dominated by Type 3 n-alkane distributions. Type 2 is also associated with low carbon accumulation, while Type 1 n-alkane distributions are associated with increasing carbon accumulation rate.
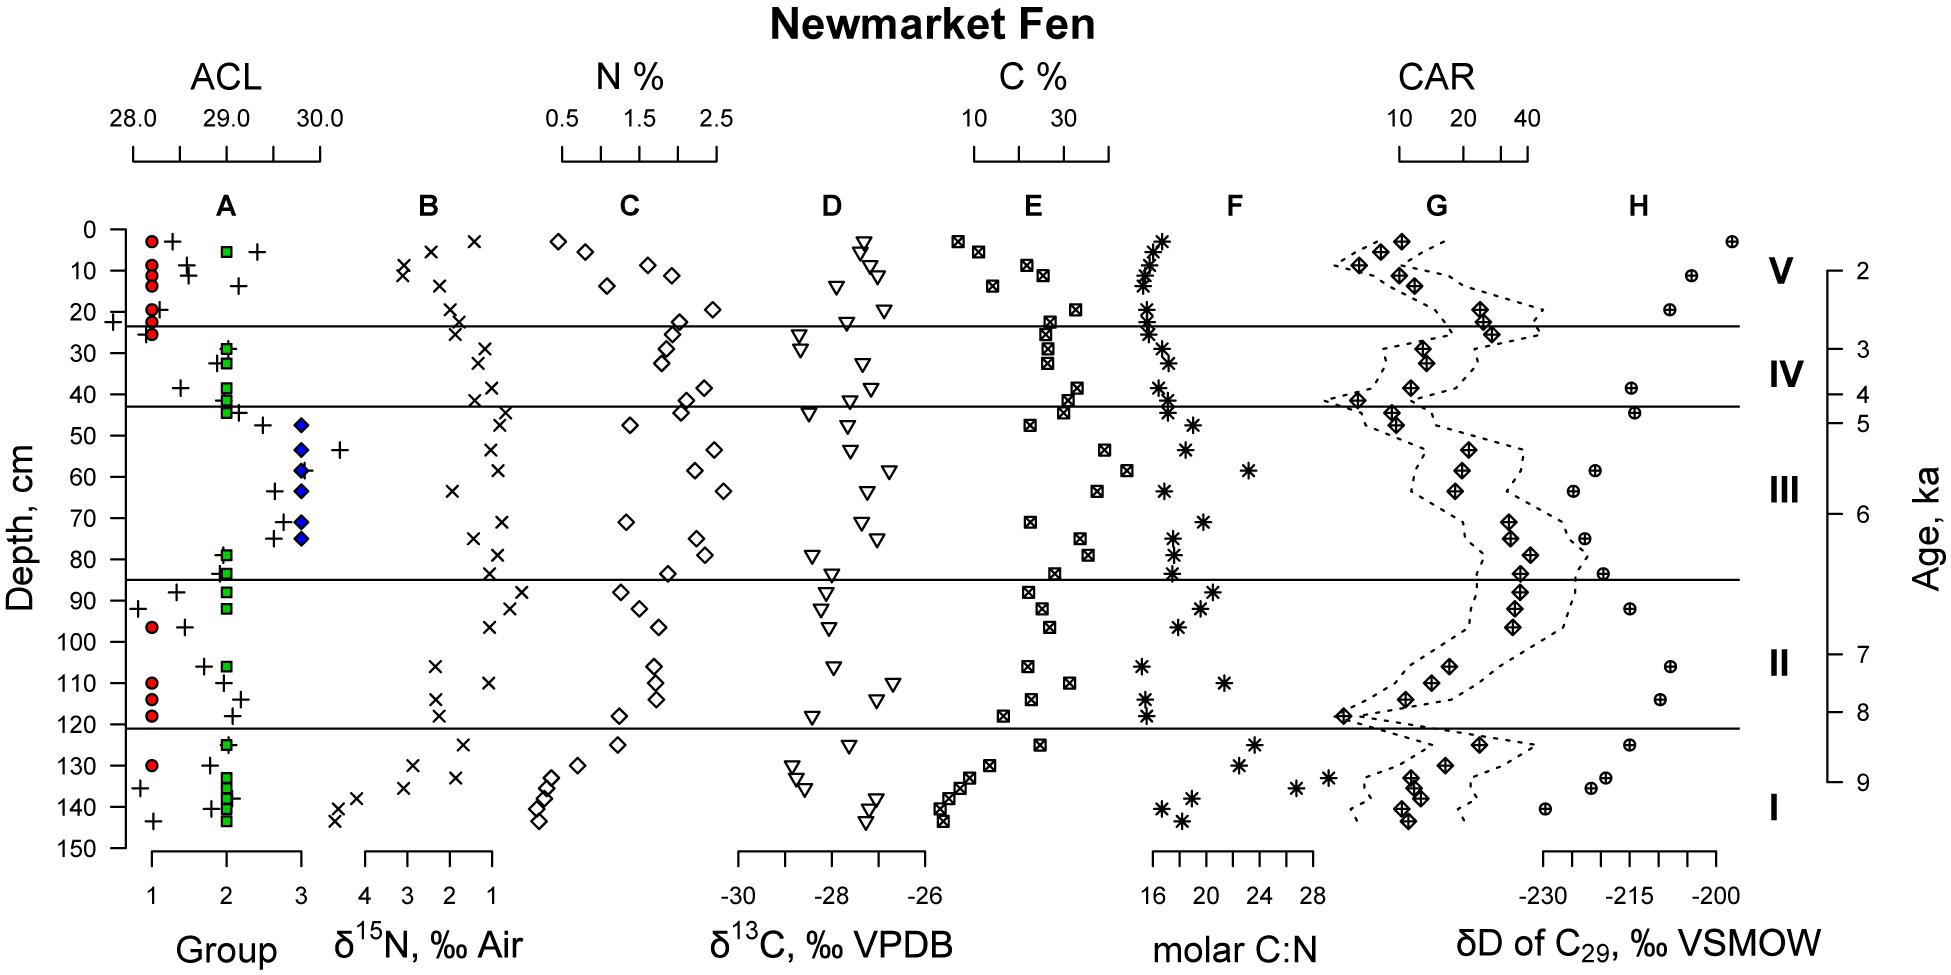
Figure 4. Geochemical data from Newmarket Fen sediments: (A) n-Alkane distributions displayed by Type (as in Figure 3) and Average Chain Length (plus sign symbols); (B) Nitrogen Isotope ratios in per mille vs. air; (C) Percent nitrogen by weight; (D) Carbon isotope ratios in per mille vs. VPDB; (E) Percent carbon by weight; (F) Molar carbon to nitrogen ratio; (G) Carbon accumulation rate in grams carbon per meter squared per year, with 75% confidence intervals propagated from the Bacon age-depth model; (H) Hydrogen isotope ratios of C29 n-alkane in per mille VSMOW. Horizontal lines indicate macrofossil zones (as in Figure 2).
The concentration and stable isotope ratios of nitrogen changed systematically throughout the stratigraphy. We found that the concentration of nitrogen [N] was anticorrelated to its isotope ratio (δ15N) (Supplementary Figure S2), which indicates that denitrification is a control on [N]. We interpret this variability in [N] and δ15N to be related to peatland hydrology. Under saturated conditions, oxygen is quickly consumed by heterotrophic microorganisms, and nitrate becomes the favored terminal electron acceptor. As denitrifiers remove N from the peat by converting it to N2 gas, the concentration of nitrogen decreases, and the remaining pool of nitrogen becomes isotopically enriched, as the lighter isotope is more energetically favorable. Under dry conditions, however, the water table in the peatland drops, and is oxygenated. Nitrogen is no longer lost to denitrification as oxygen is favored as a terminal electron acceptor, therefore the concentration of nitrogen is allowed to rebound, and the δ15N returns to values near that of atmospheric N2. Such conditions are also associated with low carbon accumulation, suggesting that reduced accumulation could be due to high carbon loss, rather than low primary productivity. By this interpretation, Newmarket Fen experienced wettest conditions during Zone I, relatively wet conditions during Zones II and V, and driest conditions during Zones III and IV.
Each of the three types of n-alkane abundance distributions are associated with distinct carbon to nitrogen (C/N) ratios, stable nitrogen isotope ratios and carbon accumulation rates. Types 1 and 3 represent the extrema of these values while Type 2 is intermediate. We find that periods dominated by Type 1 vegetation are characterized by low C/N, high δ15N and high carbon accumulation. Lower C/N ratios can indicate more herbaceous material and less woody or structural plant material. Higher δ15N indicates lower oxygen and increased denitrification. When vegetation Type 1 dominates, low oxygen and less woody material results in more carbon stored. Samples dominated by vegetation Type 3 have the highest C/N ratios. Because high C/N is typically associated with woody vegetation, but macrofossil analysis indicates dominance of sedges, our interpretation is that Type 3 vegetation is most likely sedges that are more cespitose—producing dense tussocks—while Type 1 vegetation is more likely to be sedges which produce shoots that are more spread apart with longer rhizomes and fewer dense tussocks. Denser tussocks with more frequent shoots may have a higher transpiration demand on the peatland, drawing down the water table, oxygenating the peat below. This is supported by the low δ15N in Type 3 samples—low δ15N indicates little denitrification and dominance of oxic conditions. These oxic conditions likely result in the lower carbon accumulation rates for Type 3 vegetation.
We used the hydrogen isotope ratios of C29 n-alkane to estimate the hydrogen isotope ratios of peatland water. Because the vegetation of Newmarket Fen is dominated by sedges (monocotyledons) throughout the stratigraphy, we use a constant lipid-water enrichment factor of 189‰ (Sachse et al., 2012) to estimate peatland water from C29 n-alkane, which we interpret to be dominated by local precipitation (Sachse et al., 2006; Hou et al., 2008; Nichols et al., 2009, 2014), particularly that which falls during the growing season. Values of precipitation hydrogen isotopes (δDprc) vary between −84.0 and −45.5‰ (Figure 5). We find depleted values of δDprc within stratigraphic zones associated with dry, low carbon accumulation conditions in the middle Holocene and vice versa (Figure 4). We also find that δDprc corresponds closely with sea surface temperature (SST) in the southeastern Sea of Okhotsk (Max et al., 2012; Figure 5).
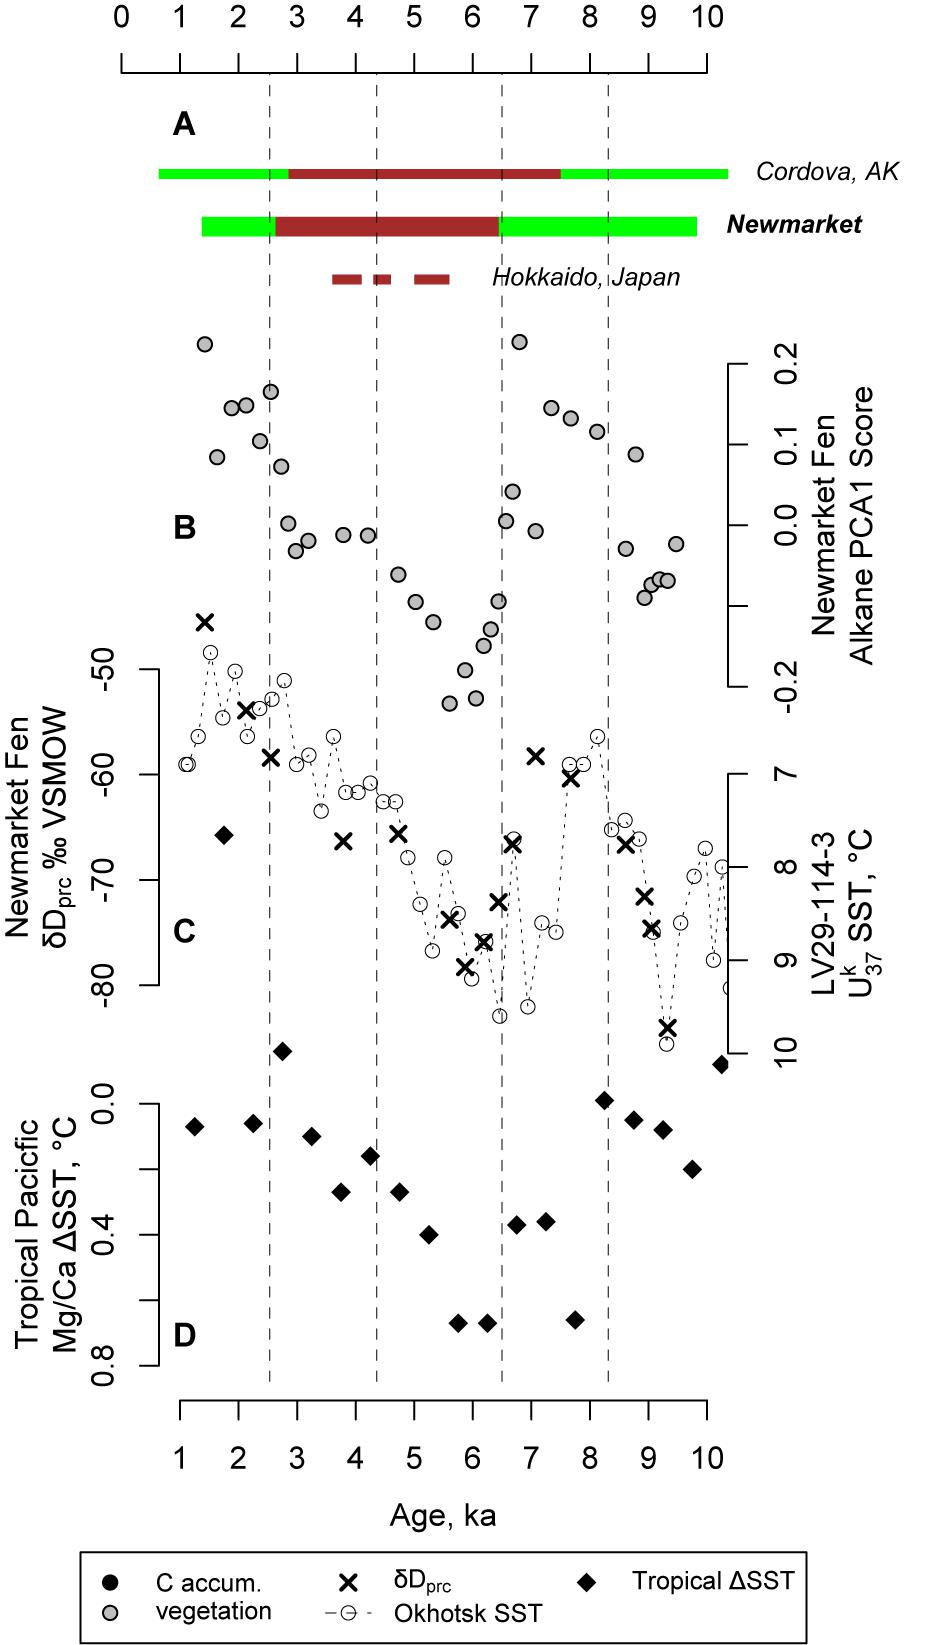
Figure 5. (A): Summary of wet (green) and dry (brown) periods at Newmarket Fen, Alaska (Jones et al., 2009; Nichols et al., 2014; Peteet et al., 2016) and Hokkaido (Ishii et al., 2016, 2017); (B) Vegetation change as indicated by the first principal component of leaf wax n-alkane abundances; (C) δD of peatland water at Newmarket and alkenone-based SST in the sea of Okhotsk (Max et al., 2012); and (D) the tropical SST gradient across the tropical Pacific Ocean based on Mg/Ca SST estimates in the west and east (Koutavas and Joanides, 2012).
It is counterintuitive for depleted values of δDprc to correspond with warmer conditions. However, higher SST and overall warmer conditions in the region can increase the length of the growing season, which can allow plants at Newmarket Fen to record δD of peatland water over more of the spring and fall, resulting in a more depleted growing season average δDprc (Nichols et al., 2009). Alternatively, or perhaps in addition, higher SST can also mean reduced sea ice extent in the Sea of Okhotsk. In this case, more Okhotsk moisture could be transported to Newmarket Fen. As this moisture must travel over the central mountain range which runs along the Kamchatka peninsula, Okhotsk-sourced moisture would be more depleted by rainout distillation. There is evidence for reduced sea ice in the Okhotsk during the period of depleted δDprc at Newmarket Fen (Max et al., 2012; Harada et al., 2014).
After about 5 ka, δDprc becomes continuously more enriched, indicating, by our previous interpretation, that climate cooled from 5 to 1.5 ka along with an increase in moisture. Records from elsewhere in Kamchatka support this trend. For example, in central Kamchatka, lake water δ18O reconstructed from diatom silica was found to decrease from 5 ka to the present along with a decrease in chironomid-inferred temperatures (Meyer et al., 2015). Oxygen isotopes of cellulose in a lake in northern Kamchatka are also depleted beginning at about 5 ka, along with vegetational indicators of cooler climate (Hammarlund et al., 2015).
Variability in sea ice cover in the Okhotsk is also associated with semi-permanent atmospheric pressure systems over the North Pacific. Cooler conditions with increased sea ice cover in the sea of Okhotsk is associated with a weakened or split Aleutian Low (in winter) and strong North Pacific High (in summer) (Rodionov et al., 2007). This weak Aleutian Low can result in reduced storm tracks over the Sea of Okhotsk (Mesquita et al., 2016) and increased southerly flow over eastern Kamchatka (Honda et al., 1999; Rodionov et al., 2007). These atmospheric anomalies would bring more local moisture from Avacha Bay, directly to the south, and the North Pacific in general, resulting in the enriched δDprc we observe in the later Holocene (Figure 5).
We also find that the current precipitation δD at the Petropavlovsk-Kamchatsky Global Network for Isotopes in Precipitation (GNIP) monitoring station is depleted relative to the Holocene values that we reconstruct (Figure 6) and modeled values (Risi et al., 2012). This can indicate that peatlands in this region are experiencing similar warm, dry conditions today as were associated with carbon loss by increased oxidation in the past.
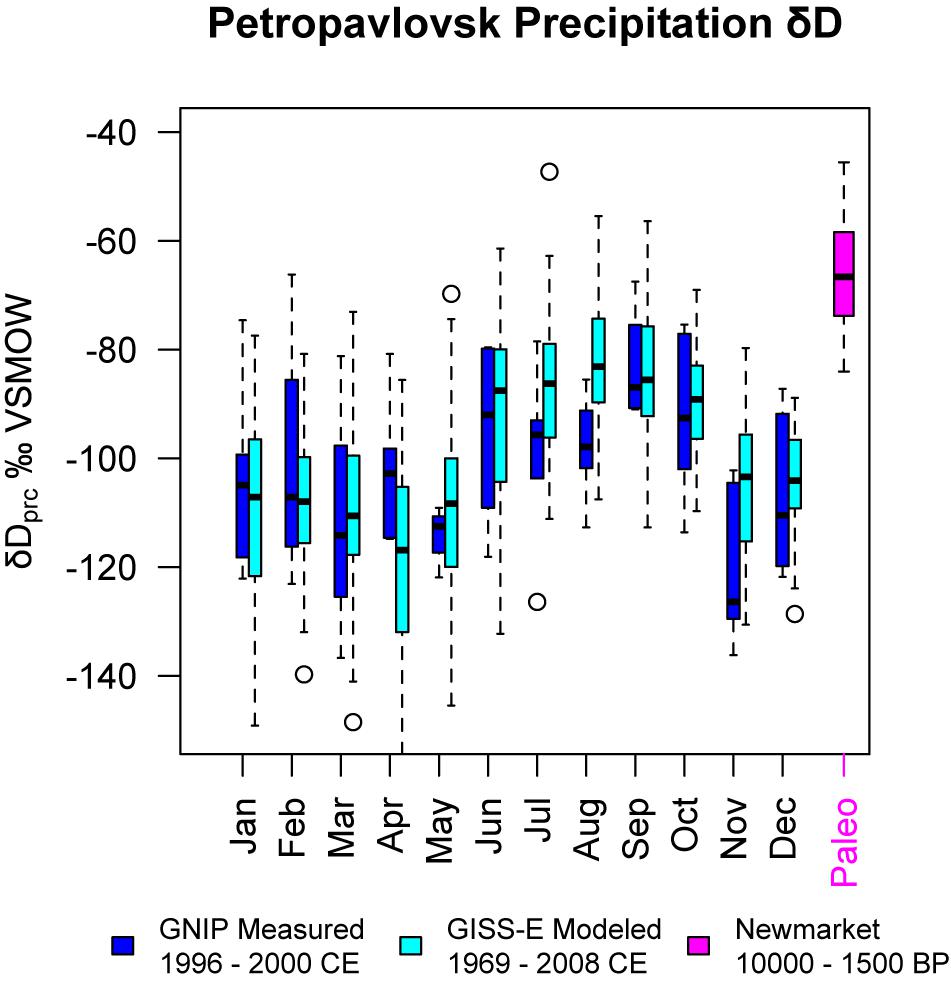
Figure 6. Monthly hydrogen isotopes of precipitation measured at Petropavlovsk-Kamchatsky, modeled by GISS-E and compared with observations (Risi et al., 2012). All reconstructed hydrogen isotope values from Newmarket Fen are shown for comparison.
In addition to the Aleutian Low and North Pacific High, the major control on modern climate in the Pacific is the El Niño-Southern Oscillation (ENSO). The conditions in the tropical Pacific can influence storm tracks and other climatological parameters at higher latitudes (Park et al., 2018). To understand this connection, we compare our records of climate, vegetation and carbon accumulation from Newmarket Fen with the Holocene record of the SST gradient across the tropical Pacific (Figure 5). During the middle Holocene, centering on about 6 ka, when conditions at Newmarket are driest and δDprc is most depleted, the SST gradient across the tropical Pacific is steepest, with the warmest west Pacific and coolest eastern Pacific (Koutavas and Joanides, 2012). Such conditions today are associated with an expanded tropical wind belt and contracted northern hemisphere jets (Park et al., 2018). Shifted storm tracks can reduce the amount of moisture received at Newmarket Fen, as flow can become more zonal (Honda et al., 1999; Rodionov et al., 2007; Mesquita et al., 2016). Similar millennial-scale patterns of changing moisture are commonly found in peatlands throughout southern Alaska (Figure 5; Jones et al., 2009; Nichols et al., 2014; Peteet et al., 2016), as well as northern Japan (Ishii et al., 2016, 2017), suggesting that a North-Pacific-basin-wide mechanism of hydrological change is plausible. The relationship between precipitation isotopes and tropical SSTs support this hypothesis.
Vegetation, hydrology, climate, and carbon accumulation rate are closely linked at Newmarket Fen. We find that under drier, more oxic conditions, the assemblage of sedges growing in the fen favor those more likely to produce C33 n-alkane and carbon accumulation is reduced, while wetter, less oxic conditions favor a different assemblage of sedges—those more likely to produce C29 n-alkane—and carbon accumulation is increased. Drier conditions at the site are accompanied by relatively depleted δD of precipitation and warmer SSTs in the Sea of Okhotsk, which we interpret as an increase in moisture originating from the Okhotsk, a more distal air mass, and/or reduced precipitation in the height of the growing season in favor of early and/or late season precipitation. Further, we find that when hydrological conditions are drier and carbon accumulation rate is reduced, the peat becomes more oxygenated, evidenced by a reduction in denitrification. Therefore, we conclude that the low carbon accumulation during the drier interval is primarily due to increased oxidation of organic matter rather than slowed primary production. Several dry millennia within a relatively wet Holocene is similar not only to other sites throughout the Kamchatka peninsula, but also to that found in Alaska and Japan, suggesting that the climate and carbon accumulation around the rim of the North Pacific is linked by a common ocean-atmosphere mechanism, such as the movement of large-scale zonal wind belts.
AA collected and described the sediment core and performed chronostratigraphic analysis. JN, FS, and TO performed the geochemical analyses. DP performed the paleobotanical analyses. JN and DP prepared the manuscript.
The authors would like to acknowledge funding from the United States National Science Foundation (DEB-1557078) in support of JN, the Vetleson Foundation, the Columbia University Center for Climate and Life High School Internship Program which supported JN, and the Lamont-Doherty Earth Observatory Internship Program, which supported FS and TO. The work of AA was partly sponsored by the Russian Government Program of Competitive Growth of Kazan Federal University.
The authors declare that the research was conducted in the absence of any commercial or financial relationships that could be construed as a potential conflict of interest.
The Supplementary Material for this article can be found online at: https://www.frontiersin.org/articles/10.3389/feart.2019.00106/full#supplementary-material
Andrén, E., Klimaschewski, A., Self, A. E., Amour, N. S., Andreev, A. A., Bennett, K. D., et al. (2015). Holocene climate and environmental change in north-eastern Kamchatka (Russian Far East), inferred from a multi-proxy study of lake sediments. Global Planet. Change 134, 41–54. doi: 10.1016/j.gloplacha.2015.02.013
Bazanova, L. I., Braitseva, O. A., Dirksen, O., Sulerzhitsky, L. D., and Danhara, T. (2005). Ashfalls of the largest holocene eruptions on the Ust Bol’sheretsk–Petropavlovsk Kamchatskii traverse: sources, chronology, and frequency. Volcanol. Seismol. 6, 30–46.
Blaauw, M. (2011). Flexible paleoclimate age-depth models using an autoregressive gamma process. Bayesian Anal. 6, 457–474. doi: 10.1214/ba/1339616472
Bush, R. T., and McInerney, F. A. (2013). Leaf wax n-alkane distributions in and across modern plants: implications for paleoecology and chemotaxonomy. Geochim. Cosmochim. Acta 117, 161–179. doi: 10.1016/j.gca.2013.04.016
Grimm, E. C. (1987). Coniss - a fortran-77 program for stratigraphically constrained cluster-analysis by the method of incremental sum of squares. Comput. Geosci. 13, 13–35. doi: 10.1016/0098-3004(87)90022-7
Hammarlund, D., Klimaschewski, A., Amour, N. A. S., Andrén, E., Self, A. E., Solovieva, N., et al. (2015). Global and planetary change. Global Planet. Change 134, 91–100. doi: 10.1016/j.gloplacha.2015.04.004
Harada, N., Katsuki, K., Nakagawa, M., Matsumoto, A., Seki, O., Addison, J. A., et al. (2014). Progress in oceanography. Prog. Oceanogr. 126, 242–253. doi: 10.1016/j.pocean.2014.04.017
Honda, M., Yamazaki, K., Nakamura, H., and Takeuchi, K. (1999). Dynamic and thermodynamic characteristics of atmospheric response to anomalous sea-ice extent in the sea of Okhotsk. J. Clim. 12, 3347–3358. doi: 10.1175/1520-0442(1999)012<3347:datcoa>2.0.co;2
Hou, J., D’Andrea, W., and Huang, Y. (2008). Can sedimentary leaf waxes record D/H ratios of continental precipitation? Field, model, and experimental assessments. Geochim. Cosmochim. Acta 72, 3503–3517. doi: 10.1016/j.gca.2008.04.030
Ishii, Y., Hori, K., and Momohara, A. (2017). Global and planetary change. Global Planet. Change 153, 1–15. doi: 10.1016/j.gloplacha.2017.04.004
Ishii, Y., Hori, K., Momohara, A., Nakanishi, T., and Hong, W. (2016). Middle to late-Holocene decreased fluvial aggradation and widespread peat initiation in the Ishikari lowland (northern Japan). Holocene 26, 1924–1938. doi: 10.1029/2012GL051983
Jones, M. C., Peteet, D. M., Kurdyla, D., and Guilderson, T. (2009). Climate and vegetation history from a 14,000-year peatland record, Kenai Peninsula, Alaska. Quat. Res. 72, 207–217. doi: 10.1016/j.yqres.2009.04.002
Koutavas, A., and Joanides, S. (2012). El Niño-southern oscillation extrema in the holocene and last glacial maximum. Paleoceanography 27, 1–15. doi: 10.1029/2012PA002378
Loisel, J., van Bellen, S., Pelletier, L., Talbot, J., Hugelius, G., Karran, D., et al. (2017). Earth-science reviews. Earth Sci. Rev. 165, 59–80. doi: 10.1016/j.earscirev.2016.12.001
Loisel, J., Yu, Z., Beilman, D. W., Camill, P., Alm, J., Amesbury, M. J., et al. (2014). A database and synthesis of northern peatland soil properties and holocene carbon and nitrogen accumulation. Holocene 9, 1028–1042. doi: 10.1177/0959683614538073
Max, L., Riethdorf, J.-R., Tiedemann, R., Smirnova, M., Lembke-Jene, L., Fahl, K., et al. (2012). Sea surface temperature variability and sea-ice extent in the subarctic northwest Pacific during the past 15,000 years. Paleoceanography 27:A3213. doi: 10.1029/2012PA002292
Mesquita, M. D. S., Hodges, K. I., Atkinson, D. E., and Bader, J. R. (2016). Sea-ice anomalies in the Sea of Okhotsk and the relationship with storm tracks in the Northern hemisphere during winter. Tellus A: Dyn. Meteorol. Oceanogr. 63, 312–323. doi: 10.1029/2006GL026286
Meyer, H., Chapligin, B., Hoff, U., Nazarova, L., and Diekmann, B. (2015). Oxygen isotope composition of diatoms as late holocene climate proxy at two-yurts lake, Central Kamchatka, Russia. Global Planet. Change 134, 118–128. doi: 10.1016/j.gloplacha.2014.04.008
Meyers, P. (1994). Preservation of elemental and isotopic source identification of sedimentary organic-matter. Chem. Geol. 114, 289–302. doi: 10.1016/0009-2541(94)90059-0
Nichols, J., Peteet, D. M., Moy, C. M., Castaneda, I. S., McGeachy, A., and Perez, M. (2014). Impacts of climate and vegetation change on carbon accumulation in a south-central Alaskan peatland assessed with novel organic geochemical techniques. Holocene 24, 1146–1155. doi: 10.1177/0959683614540729
Nichols, J., Walcott, M., Bradley, R., Pilcher, J., and Huang, Y. (2009). Quantitative assessment of precipitation seasonality and summer surface wetness using ombrotrophic sediments from an Arctic Norwegian peatland. Quat. Res. 72, 443–451. doi: 10.1016/j.yqres.2009.07.007
Park, Y.-H., Kim, B.-M., Pak, G., Yamamoto, M., Vivier, F., and Durand, I. (2018). A key process of the nonstationary relationship between ENSO and the Western Pacific teleconnection pattern. Sci. Rep. 8, 1–13. doi: 10.1038/s41598-018-27906-z
Peteet, D. M., Nichols, J., Moy, C. M., McGeachy, A., and Perez, M. (2016). Recent and holocene climate change controls on vegetation and carbon accumulation in Alaskan coastal muskegs. Quat. Sci. Rev. 131, 168–178. doi: 10.1016/j.quascirev.2015.10.032
Risi, C., Noone, D., Worden, J., Frankenberg, C., Stiller, G., Kiefer, M., et al. (2012). Process-evaluation of tropospheric humidity simulated by general circulation models using water vapor isotopologues: 1. Comparison between models and observations. J. Geophys. Res. 117:D05303. doi: 10.1029/2011JD016621
Rodionov, S. N., Bond, N. A., and Overland, J. E. (2007). The Aleutian Low, storm tracks, and winter climate variability in the Bering Sea. Deep Sea Res. Part II Top. Stud. Oceanogr. 54, 2560–2577. doi: 10.1016/j.dsr2.2007.08.002
Sachse, D., Billault, I., Bowen, G. J., Chikaraishi, Y., Dawson, T. E., Feakins, S. J., et al. (2012). Molecular paleohydrology: interpreting the hydrogen-isotopic composition of lipid biomarkers from photosynthesizing organisms. Annu. Rev. Earth Planet. Sci. 40, 221–249. doi: 10.1146/annurev-earth-042711-105535
Sachse, D., Radke, J., and Gleixner, G. (2006). δD values of individual n-alkanes from terrestrial plants along a climatic gradient – Implications for the sedimentary biomarker record. Org. Geochem. 37, 469–483. doi: 10.1016/j.orggeochem.2005.12.003
Solovieva, N., Klimaschewski, A., Self, A. E., Jones, V. J., Andrén, E., Andreev, A. A., et al. (2015). The Holocene environmental history of a small coastal lake on the north-eastern Kamchatka Peninsula. Global Planet. Change 134, 55–66. doi: 10.1016/j.gloplacha.2015.06.010
Treat, C. C., Jones, M. C., Camill, P., Gallego-Sala, A., Garneau, M., Harden, J. W., et al. (2016). Effects of permafrost aggradation on peat properties as determined from a pan-Arctic synthesis of plant macrofossils. J. Geophys. Res. Biogeosci. 121, 78–94. doi: 10.1002/2015JG003061
Turetsky, M. R., Benscoter, B., Page, S., Rein, G., van der Werf, G. R., and Watts, A. (2015). Global vulnerability of peatlands to fire andcarbon loss. Nat. Geosci. 8, 11–14. doi: 10.1038/ngeo2325
Keywords: ecohydorology, carbon cycle, peatlands, holocene, Kamchatka
Citation: Nichols J, Peteet D, Andreev A, Stute F and Ogus T (2019) Holocene Ecohydrological Variability on the East Coast of Kamchatka. Front. Earth Sci. 7:106. doi: 10.3389/feart.2019.00106
Received: 22 December 2018; Accepted: 25 April 2019;
Published: 15 May 2019.
Edited by:
Randel Tom Cox, The University of Memphis, United StatesReviewed by:
Li Wu, Anhui Normal University, ChinaCopyright © 2019 Nichols, Peteet, Andreev, Stute and Ogus. This is an open-access article distributed under the terms of the Creative Commons Attribution License (CC BY). The use, distribution or reproduction in other forums is permitted, provided the original author(s) and the copyright owner(s) are credited and that the original publication in this journal is cited, in accordance with accepted academic practice. No use, distribution or reproduction is permitted which does not comply with these terms.
*Correspondence: Jonathan Nichols, am5pY2hvbHNAbGRlby5jb2x1bWJpYS5lZHU=
Disclaimer: All claims expressed in this article are solely those of the authors and do not necessarily represent those of their affiliated organizations, or those of the publisher, the editors and the reviewers. Any product that may be evaluated in this article or claim that may be made by its manufacturer is not guaranteed or endorsed by the publisher.
Research integrity at Frontiers

Learn more about the work of our research integrity team to safeguard the quality of each article we publish.