 Jeffery S. Horsburgh1*
 Juan Caraballo2
 Maurier Ramírez2
 Anthony K. Aufdenkampe3David B. Arscott4Sara Geleskie Damiano4
- 1Department of Civil and Environmental Engineering and Utah Water Research Laboratory, Utah State University, Logan, UT, United States
- 2Utah Water Research Laboratory, Utah State University, Logan, UT, United States
- 3LimnoTech, Oakdale, MN, United States
- 4Stroud Water Research Center, Avondale, PA, United States
There are now many ongoing efforts to develop low-cost, open-source, low-power sensors and datalogging solutions for environmental monitoring applications. Many of these have advanced to the point that high quality scientific measurements can be made using relatively inexpensive and increasingly off-the-shelf components. With the development of these innovative systems, however, comes the ability to generate large volumes of high-frequency monitoring data and the challenge of how to log, transmit, store, and share the resulting data. This paper describes a new web application that was designed to enable citizen scientists to stream sensor data from a network of Arduino-based dataloggers to a web-based Data Sharing Portal. This system enables registration of new sensor nodes through a Data Sharing Portal website. Once registered, any Internet connected data-logging device (e.g., connected via cellular or Wi-Fi) can then post data to the portal through a web service application programming interface (API). Data are stored in a back-end data store that implements Version 2 of the Observations Data Model (ODM2). Live data can then be viewed using multiple visualization tools, downloaded from the Data Sharing Portal in a simple text format, or accessed via WaterOneFlow web services for machine-to-machine data exchange. This system was built to support an emerging network of open-source, wireless water quality monitoring stations developed and deployed by the EnviroDIY community for do-it-yourself environmental science and monitoring, initially within the Delaware River Watershed. However, the architecture and components of the ODM2 Data Sharing Portal are generic, open-source, and could be deployed for use with any Internet connected device capable of making measurements and formulating an HTTP POST request.
Introduction
Although it is increasingly common for research groups, organizations, and agencies to collect time series data using in situ environmental sensors (Hart and Martinez, 2006; Rundel et al., 2009; Muste et al., 2013), the cost of environmental sensors and sensing systems is still a major limitation to their more widespread and long-term use. The base cost for the data logging components of a scientific-grade, in situ environmental monitoring station can be upward of $5000 USD, excluding the cost of the sensors for collecting the data, which may cost many thousands more. Additionally, while commercially available data logging and telemetry systems generally have robust and proven capabilities, they also tend to be proprietary, manufacturer specific, and closed, making it difficult in some cases to integrate dataloggers, communication peripherals, and sensors across manufacturers. These challenges associated with using existing commercial environmental sensing equipment, along with the now ubiquitous and inexpensive availability of easy to use microcontroller units such as the Arduino suite of products1, single-board computers like the Raspberry Pi2, and the diverse array of Internet of Things (IoT) devices have driven new innovations in low-cost, low-power, and do-it-yourself (DIY) environmental sensing and data logging (hereafter referred to as “low-cost sensing”) (Baker, 2014; Ferdoush and Li, 2014; Wickert, 2014; Sadler et al., 2016; Beddows and Mallon, 2018).
Using increasingly off-the-shelf components, scientists of varying skill levels can now develop functional dataloggers for tens or hundreds of dollars rather than thousands, with capabilities for integrating high quality environmental sensors, or less expensive sensors that are now also increasingly available (Ensign et al., 2019). A variety of communication options are available for telemetering data, including cellular, spread spectrum radio, and Wi-Fi, and applications include continuous monitoring of indoor and outdoor air quality (Gualtieri et al., 2017; Karami et al., 2018), monitoring of ambient environmental conditions (Faustine et al., 2014; Adu-Manu et al., 2017), adaptive workflows and decision support using real-time data (e.g., Wong and Kerkez, 2016), among others. This ability to assemble fully functional environmental sensor stations for much lower cost is attractive to scientists, who, in many cases, wish to increase the spatial and temporal coverage of their data collection activities. Lower cost can potentially mean more stations, more sensors, and more information. Lower cost has also made these types of devices attractive to many citizen science data collection efforts.
With the development of these innovative low-cost sensing systems, however, comes the ability to generate large volumes of high-frequency data and the challenges of how to log, transmit, store, manage, and share the resulting data (Abu-Elkheir et al., 2013). Sensor data can be difficult to manage, especially as the number of sites, variables, and the time period over which observations are collected increases (Jones et al., 2015). Because Arduino microcontrollers, Raspberry Pi computers, and other systems like them are not purpose built as environmental dataloggers, one major challenge for using them in low-cost sensing applications lies in programming them to function as dataloggers (Jiang et al., 2016; Mazumdar et al., 2017). While this is becoming easier as the number of examples shared on the Internet increases, this is still left to the user. In contrast, many commercially available, purpose-built dataloggers make much of this type of programming transparent to the user through the use of datalogger program development software provided by the manufacturer.
Another major challenge that many projects and data managers face is how to consolidate data from a network of monitoring sites to a centralized location where they can be stored, archived, checked for quality, and then used for scientific analyses or shared with potential users (Rundel et al., 2009; Jones et al., 2017). Potential heterogeneity in the syntax and semantics of the data can complicate this step (Samourkasidis et al., 2018). Commercial sensing systems usually come with a proprietary software product that provides this functionality, whereas low-cost sensing systems are usually custom built and lack robust software that provides these capabilities. Finally, providing convenient methods for web-based access to visualize and download observational data for a variety of users whose technical skills may vary can also be challenging (Horsburgh et al., 2011; Demir and Krajewski, 2013; Muste et al., 2013; Mason et al., 2014) – yet these are basic capabilities needed for managing and sharing environmental sensor data, regardless of how they are collected.
In this paper we describe a web-based software application called the ODM2 Data Sharing Portal that was designed and developed to enable streaming of data from low-cost sensing systems deployed in the field to a centralized, web-based data repository. The specific driver for creating this software was to support data collection and management for a group of conservation organizations and citizen scientists in the Delaware River Watershed in the eastern United States who are deploying water quality monitoring sites using an Arduino-based, EnviroDIY Mayfly Data Logger BoardTM3 paired with low-cost hydrologic and water quality sensors (see Monitor My Watershed Data Sharing Portal Case Study). While the ODM2 Data Sharing Portal was built to support the emerging network of Arduino-based sensor nodes in the Delaware River Watershed, the architecture and components are generic, open-source, and could be deployed by other initiatives and groups needing a centralized data repository for environmental sensor data. Specific contributions of this work include an innovative, push-based architecture and simple messaging protocol that enables communications between a network of remote monitoring sites and a centralized data portal server. We describe our approach for storing and managing the sensor data and associated metadata, as well as techniques for producing high-performance, web-based visualization and access to the data. Finally, we provide an open-source implementation of the web portal and data management functionality we found necessary to support a community of citizen scientists in developing a network of low-cost environmental sensing stations.
Materials and Methods
Design and Overall Software Architecture
Our goal in developing the ODM2 Data Sharing Portal was to provide a system that could be used by citizen scientists to stream data from a variety of low-cost water quality sensing stations, such as those powered by Arduino-based EnviroDIY Mayfly dataloggers, to a centralized data repository where they could be stored, managed, and accessed by other members of the citizen science and water resources community. The following requirements motivated our implementation:
(1) Open-source software development to facilitate free deployment and software reuse;
(2) A graphical user interface (GUI) that supports users with varying levels of technical capabilities, including citizen scientists, and functions on a variety of computing platforms;
(3) Ability to register monitoring sites and configure the list of observed variables at each site;
(4) Support for a standard data/messaging protocol that enables pushing data from monitoring sites in the field using a variety of low-cost dataloggers to the centralized server;
(5) Persistent storage of the data pushed to the centralized server from monitoring sites;
(6) Ability to discover and access data from other monitoring sites within the network;
(7) Basic security to support ownership of registered sites and data and to avoid unwanted spam;
(8) Screening-level visualizations of data for monitoring the status of data collection sites;
(9) Access to download monitoring data in a comma-separated text format;
(10) Machine-to-machine data discoverability and access via web services; and
(11) Administrative functions for managing metadata for sensors, variables, and units.
The ODM2 Data Sharing Portal was designed as a web application with a web browser-based GUI. The overall Architecture of the software consists of a user interface layer, a web framework layer, a web service layer, and a data storage layer (Figure 1). In the following sections, we describe the high-level design of each of the architectural layers, their key components, and their basic functionality. In Section “Results” we describe a specific implementation of the ODM2 Data Sharing Portal for the Monitor My Watershed network of water quality monitoring sites, each of which uses an Arduino-based EnviroDIY Mayfly datalogger. Finally, in the “Discussion and Conclusions” section we discuss the capabilities of the system, some of the challenges we faced in our implementation, and how they were overcome.
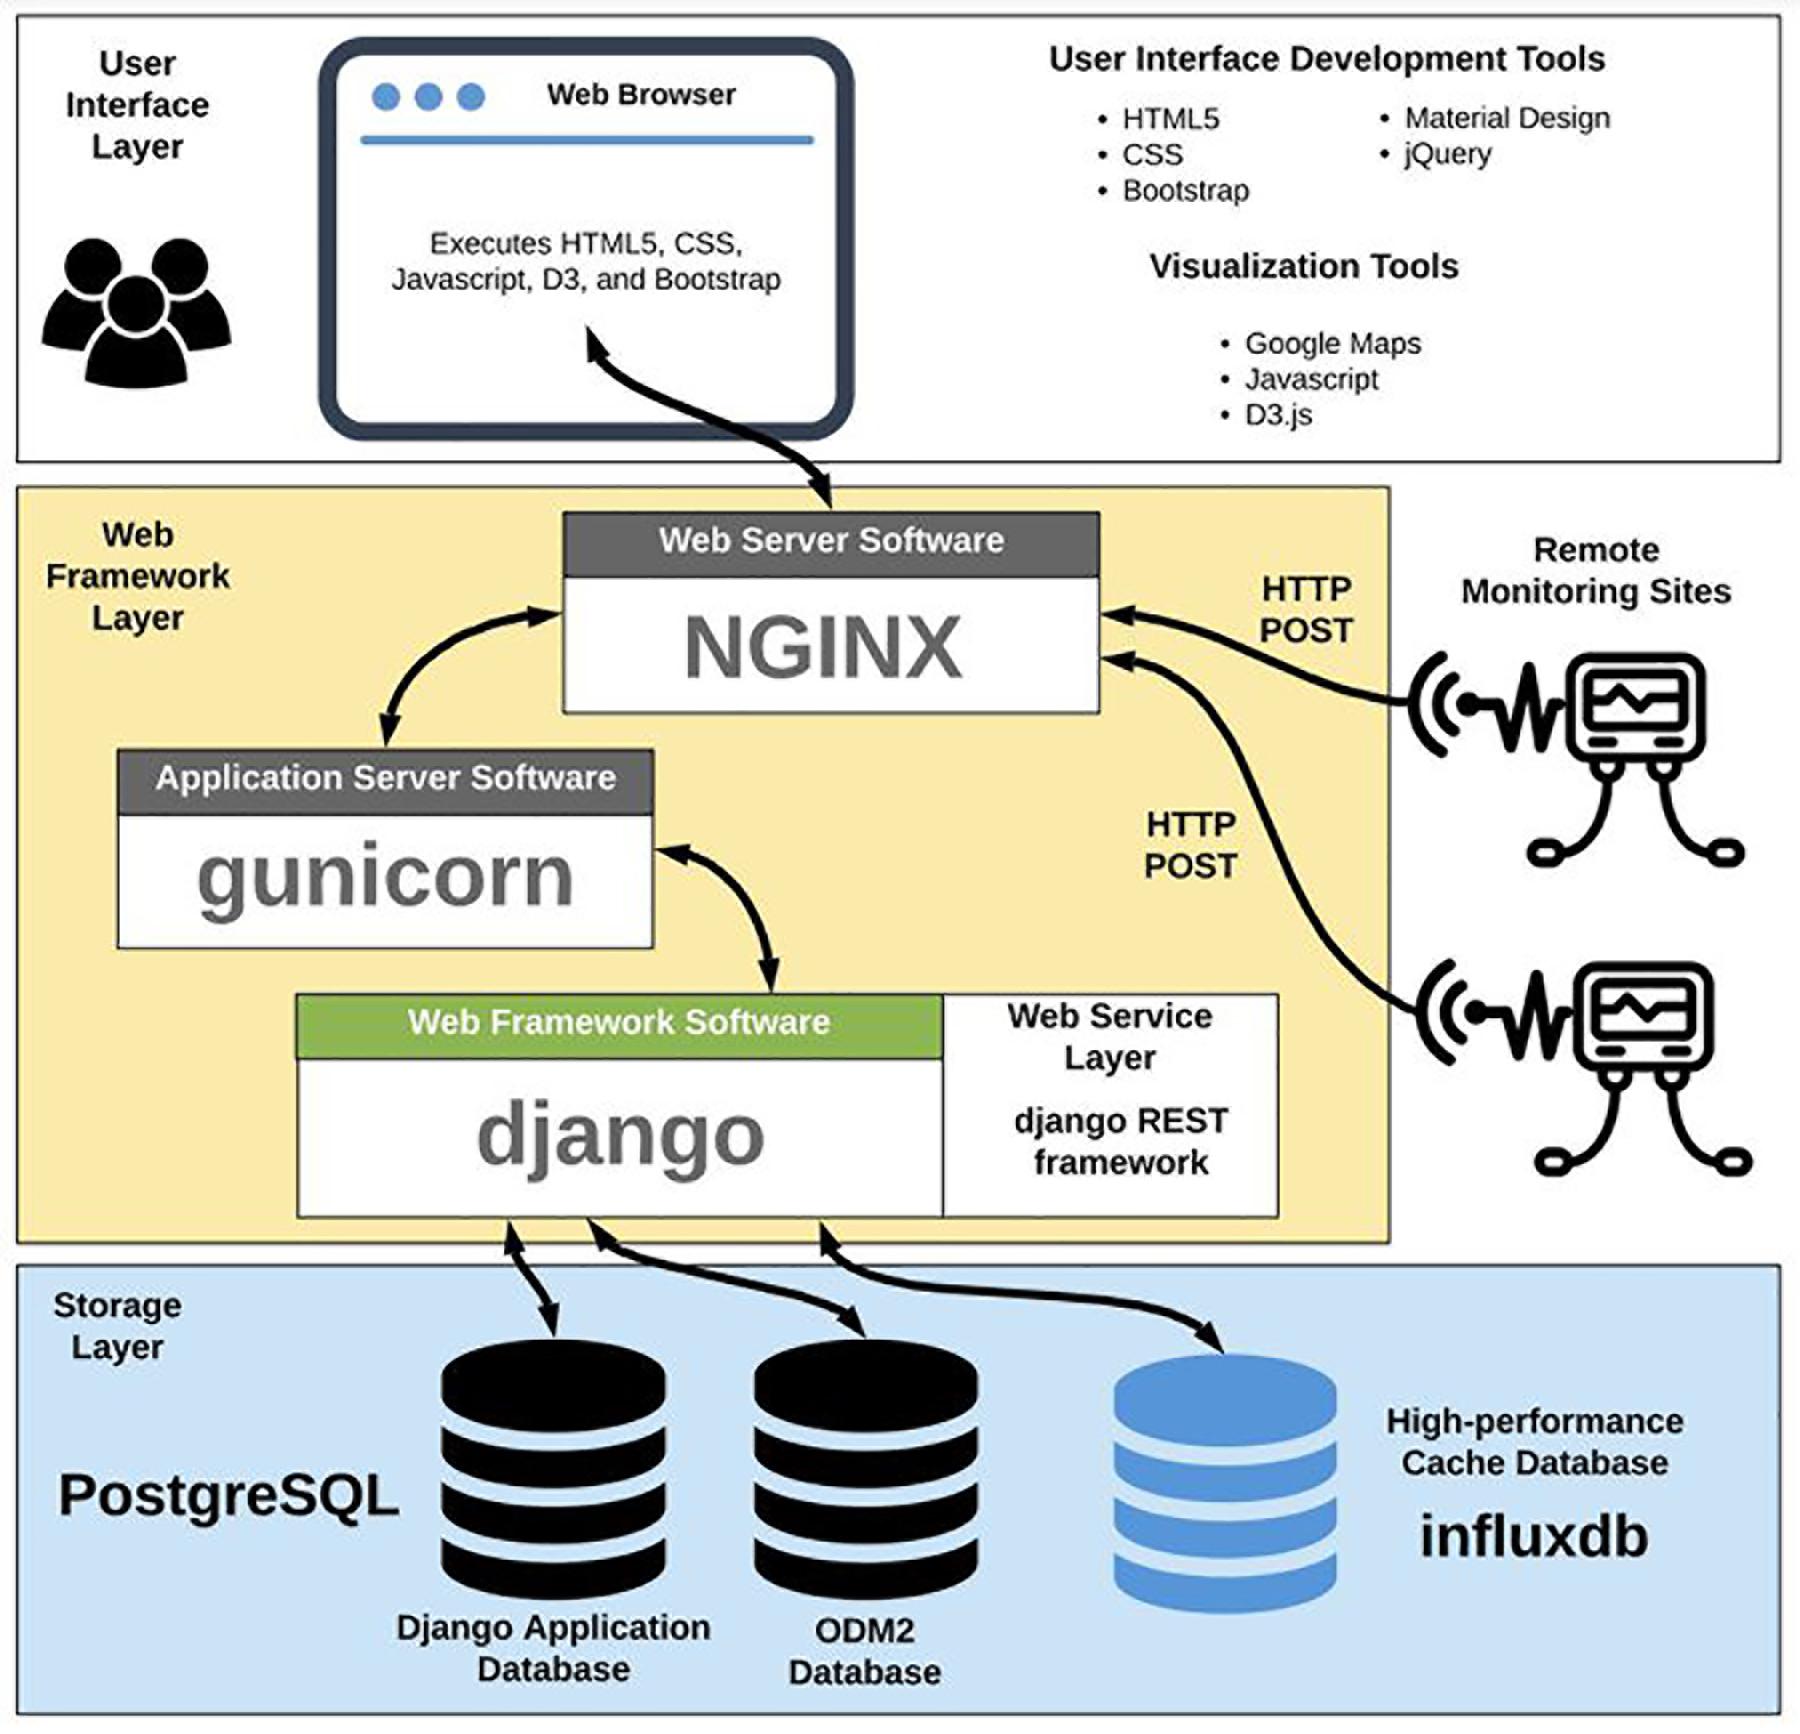
Figure 1. Architecture of the Data Sharing Portal.
User Interface Layer
The user interface layer was implemented primarily using HTML5, cascading style sheets (CSS), and JavaScript, which function in all modern web browsers. This meets the requirements for operation across multiple computer operating systems as well as ensuring that functionality of the Data Sharing Portal is presented to users in a way that does not require specialized software installation. It also ensures that the functionality of the data sharing portal is available to users of varying technical capabilities. We assumed that most, if not all, potential users are familiar with using a web browser. A number of common and openly available front-end development tools were used to facilitate development of the web user interface (Table 1). We provide these here for completeness and to document the dependencies of the ODM2 Data Sharing Portal code.
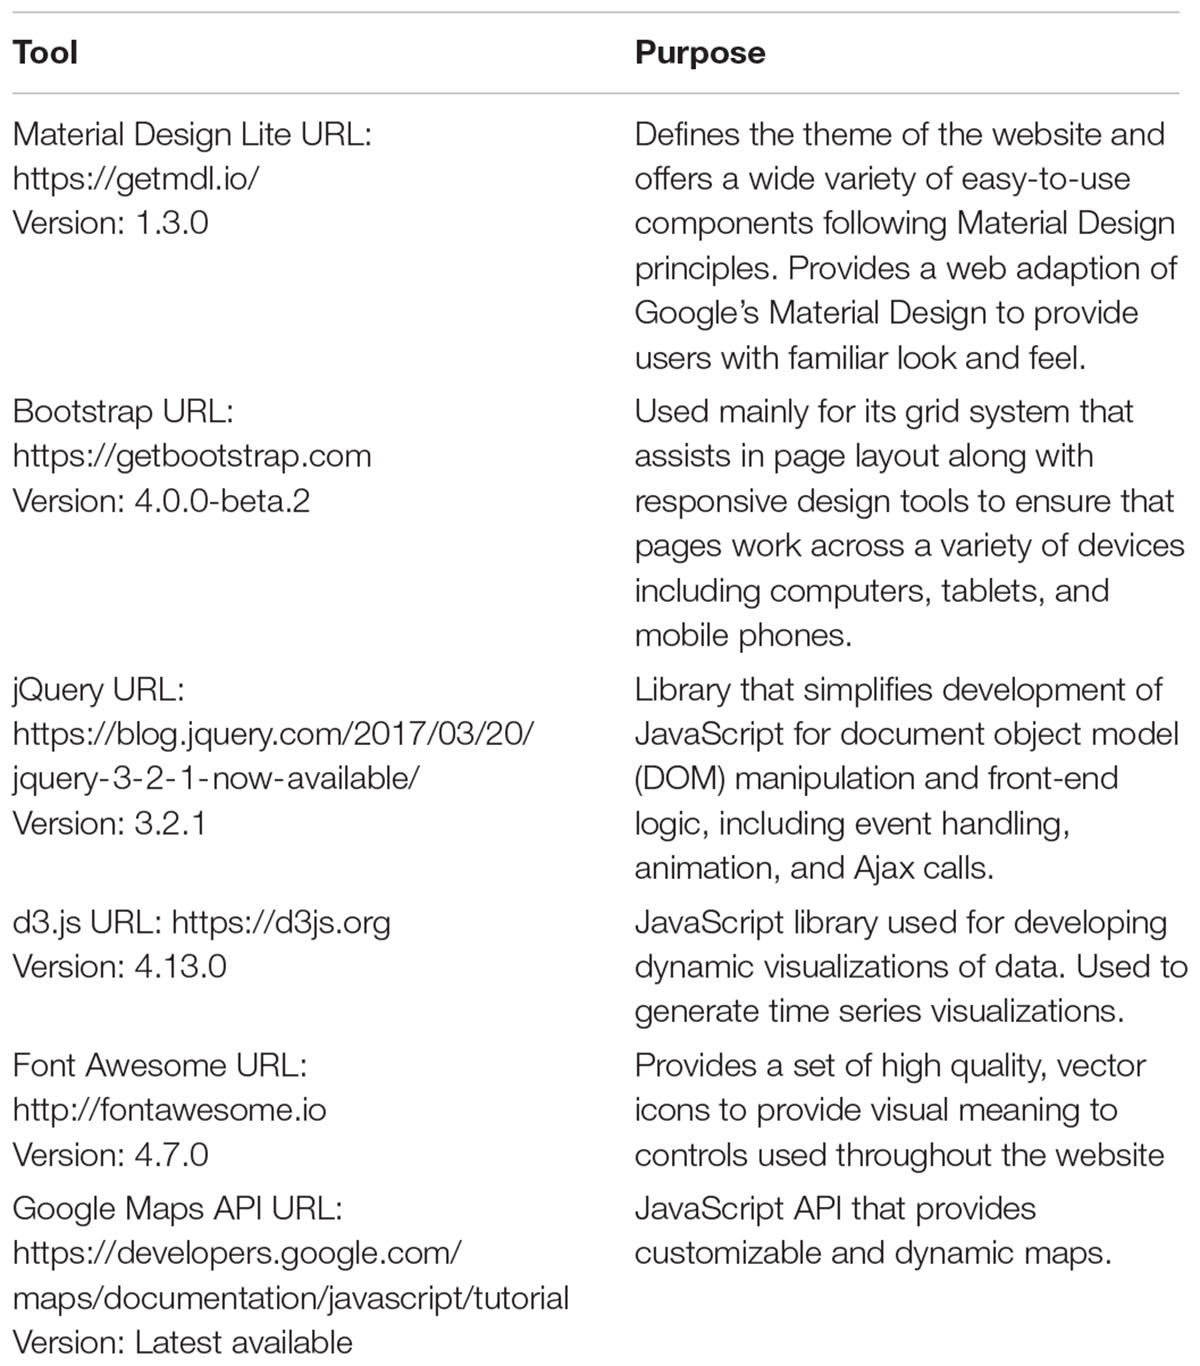
Table 1. Tools used for developing the web user interface of the Data Sharing Portal.
The user interface of the ODM2 Data Sharing Portal consists of three main pages that are focused on meeting the functional requirements listed above. The “My Sites” page enables users to register new monitoring sites and manage their list of registered sites and followed sites. The “Site Details” page enables users to edit the metadata for a monitoring site and manage the list of variables measured at a site. The “Browse Sites” page is provided for discovering and accessing sites registered by other users. Additionally, pages are provided for creating a new user account, logging into the portal, and editing a user’s profile. Finally, for administrative users of the system, an “Admin” page is provided for modifying lists of sensors, variables, and units presented to users when they are registering sites. Specific functionality of each of these pages is presented in the context of the Monitor My Watershed instance of the ODM2 Data Sharing Portal (see Results).
Web Framework Layer
The ODM2 Data Sharing Portal was developed using the Python Django web framework4. We chose it over other frameworks because it is freely available, open-source, and supports rapid and straightforward development of common website functionality (e.g., user and account management, authentication, content management, etc.) using existing web components that are reliable, interchangeable, and scalable. Because it is Python based, it can be deployed on multiple server platforms (e.g., Linux or Windows) and can be used with a variety of web server software applications [e.g., Apache, NGINX, and Microsoft’s Internet Information Services (IIS)]. These capabilities enable multiple options for deployment; however, for the ODM2 Data Sharing Portal, we targeted deployment of the Django Web Framework on an Ubuntu Linux server using a combination of the NGINX web server along with the Gunicorn app server. NGINX generally handles serving the static content of the ODM2 Data Sharing Portal website, whereas Gunicorn handles any web requests that must be dynamically generated. The combination of Django, NGINX, and Gunicorn is a common deployment environment for open-source web applications targeted for deployment on a Linux server.
Data Storage Layer
The ODM2 Data Sharing Portal uses a combination of technologies in its storage layer. First, Django’s Object-Relational Mapping (ORM) functionality is used along with an instance of PostgreSQL5 to store Django’s native database. Django uses its native database to store dynamic configuration data (e.g., users, sessions, permissions), along with other cached application data for faster access. In addition to Django’s database, we also implemented an instance of ODM2 (Horsburgh et al., 2016) in PostgreSQL. ODM2 provides an extensive information model for storing observational data along with metadata describing monitoring sites, deployed sensors, observed variables and units, sensor depth/height, and individuals and organizations responsible for data collection, making it an obvious choice to serve as the back-end data store and archive for the Data Sharing Portal. We chose PostgreSQL for implementing the relational database components of the storage layer because it integrates well with Django’s ORM functionality, provides robust and advanced relational database functionality, is Structured Query Language (SQL) compliant, and is freely available and open-source.
The final component of the data storage layer is a cache database that we implemented for providing high-performance data queries and time series data access. It is used in generating visualizations of the time series data for display on the website and for providing high-performance data download. The cache database was created in the InfluxDB time series database system6, which is a high-performance data store written specifically for storing, managing, and real-time querying of timestamped data like those produced by environmental monitoring sites. Time series databases like InfluxDB have been used extensively with financial data, but have more recently been adapted for use in a variety of newer applications, including storing and managing high-resolution data resulting from monitoring of computational server systems and infrastructure (e.g., development operations or “DevOps”) and storing and managing timestamped data from IoT applications. Time series databases are optimized for storage, summarization, and aggregation of timestamped data, along with handling time-dependent queries over large numbers of data values, making a time series database ideal for the data caching needs of the portal. InfluxDB is freely available and part of a set of open-source core components that also have commercial offerings.
Web Service Layer
The primary function of the web service layer is to enable Internet-connected dataloggers to submit data to an instance of the Data Sharing Portal. We chose a push-based communication model where individual dataloggers push their data to the central repository for three main reasons. First, this negates the need for each individual datalogger to have a static and unique network or Internet Protocol (IP) address that can be consistently accessed by a centralized server. This is an important consideration because low-cost dataloggers may use a variety of hardware (e.g., Arduino versus Raspberry Pi) and a variety of means and service providers for connecting to the Internet (e.g., cellular, Wi-Fi, spread-spectrum radio, or a combination of these). Thus, they may not always have static IP addresses. We anticipated that it would likely be impossible for a centralized server to consistently connect to and pull data from all of the registered monitoring sites.
Second, the push model relies on the portal exposing a standard data submission interface to which remote dataloggers can push their data. With a standardized data submission interface, the portal needs only focus on receiving and acting upon requests from remote dataloggers and does not have to concern itself with making low-level device connections and mediating across communication protocols that may be inconsistent across different types of dataloggers. Indeed, reliance on a push model and a standardized data submission interface means that any Internet connected device or datalogger can push data to an instance of the Data Sharing Portal.
Last, the push model can result in significant power economy for low-power dataloggers deployed in the field because they do not have to stay awake to listen for pull requests from a centralized server. Each data collection device has full autonomy to send data to the server as often as it needs to and only when it needs to, which provides the owner of the datalogger with considerable flexibility in choosing data collection, recording, and transmission schedules that meet data collection needs while balancing power requirements.
Using the Django REST Framework7, which is an extension of Django for building representational state transfer (REST) web services, we built a REST web service that enables any Internet-connected device to send data to an instance of the ODM2 Data Sharing Portal using standard HTTP POST requests. POST requests sent to the server are encoded using JavaScript Object Notation (JSON), and the portal returns standard HTTP responses (e.g., CREATED 201 when a POST request successfully creates new data in the portal’s database) that can be interpreted by the datalogger to determine whether a request was successfully received and processed. As a simple security measure aimed at preventing unauthorized spam requests to the web service, we implemented a token-based authorization system for web service requests. Each registered data collection site is assigned a unique identifier and an authorization token visible only to the site owner. Each web service request received by the portal is first checked to make sure that a valid authorization token is provided and that it matches the identifier of the site in the request. Any requests with invalid tokens or mismatched tokens and site identifiers are automatically ignored. The JSON format for POST requests and the syntax of tokens and identifiers used in the messages are described in more detail in Section “Results.”
Results
Monitor My Watershed Data Sharing Portal Case Study
In this section, we describe a production instance of the ODM2 Data Sharing Portal software for the Monitor My Watershed®network8. Monitor My Watershed is an evolving program for conservation organizations, citizen scientists, and students that bridges science, technology, engineering, and mathematics (STEM) by incorporating open-source hardware and software, environmental monitoring, ecosystem science, and data analysis and interpretation (Bressler et al., 2018; Ensign et al., 2019). The program is multi-faceted, with goals to (a) enhance knowledge and stewardship of fresh water and other natural resources, (b) increase citizen access, use, collection, and sharing of environmental data, (c) increase STEM literacy, and (d) develop methods, protocols, curricula, and workshop materials to support STEM educators and programs.
A core component of Monitor My Watershed is a network of monitoring sites deployed by participants using EnviroDIY Mayfly dataloggers (see Mayfly Loggers and the EnviroDIY Modular Sensors Library). The ODM2 Data Sharing Portal described in this paper was developed to capture, manage, and provide access to environmental monitoring data from these DIY devices and for aquatic macroinvertebrate data that are part of the Leaf Pack Network® stream ecology program. These online tools are part of a broader set of digital tools available at https://WikiWatershed.org, that are designed to support researchers, conservation practitioners, municipal decision-makers, educators, and students that are interested in water resources and environmental stewardship.
In 2010, a research team at the Stroud Water Research Center started developing and deploying open-source hardware and software devices to build autonomous water quality monitoring stations with real-time data telemetry. The primary motivation was to reduce costs in order to increase the spatial resolution of data for various research studies by deploying more measurement sites in streams and rivers in the Delaware River Watershed (and elsewhere). The team realized the potential for these devices to be useful for both the greater research community and also the watershed conservation community, launching the EnviroDIY website9 in 2013 to share their approaches and encourage a community of contributors to share their DIY technology for environmental monitoring, find resources, or pose questions to other users. In 2014, the William Penn Foundation funded a training and support program as an expansion of EnviroDIY under the umbrella of the Delaware River Watershed Initiative (DRWI). The DRWI is a multi-year effort supporting conservation organizations working to protect and restore stream health in the Delaware River Watershed (Freedman et al., 2018; Johnson et al., 2018).
The DRWI effort, among others, has led to the development of the tools described herein that support the use of low-cost, open-source, and low-power devices for monitoring environmental conditions, in particular sensors collecting data on water level, water temperature, specific conductivity, turbidity, dissolved oxygen, and other water quality and meteorological sensor arrays. Most of the sensors in use are commercially available, bare-wire devices that can be programmed to communicate with Arduino compatible devices like the EnviroDIY Mayfly Data Logger Board. Today, there are hundreds of devices deployed throughout the Delaware River Watershed with the help of more than 50 non-profit organizations, and hundreds of registered members using https://EnviroDIY.org as a social networking website to share their DIY technology.
Mayfly Loggers and the EnviroDIY Modular Sensors Library
Participants in the Monitor My Watershed network are using Arduino-based EnviroDIY Mayfly dataloggers10 to deploy their water quality monitoring sites. The EnviroDIY Mayfly is a user-programmable microcontroller board specifically designed to meet the needs of solar-powered, wireless environmental data logging. It uses an ATmega 1284p processor and is fully compatible with the Arduino interactive development environment (IDE) software. In addition to a more powerful processor, it has enhanced flash memory for storing larger datalogging programs, or sketches, along with additional RAM, additional input pins for sensors, a real time clock, an onboard MicroSD memory card socket, an XBee module socket for integration of communication peripherals, and a solar charge regulator. These hardware enhancements, which grew from the need for options to better enable low-cost and low-power environmental monitoring, make the EnviroDIY Mayfly a more capable datalogger when compared to many other Arduino boards. The EnviroDIY Mayfly is commercially available for purchase at a cost of $60 USD via Amazon, and hardware designs, code examples, and documentation are openly available in the Mayfly GitHub repository11. The relatively low cost and open nature of the EnviroDIY Mayfly design made it an ideal platform on which to build the citizen science monitoring efforts of the Monitor My Watershed network.
Do-it-yourself practitioners generally find rapid success at reading data from simple sensors to an EnviroDIY Mayfly or other Arduino board. However, it is much more challenging to program an Arduino to perform all of the required functions of a solar-powered monitoring station that collects data from several environmental sensors, saves observations to a MicroSD card, transmits data to a public server like the ODM2 Data Sharing Portal, and puts the sensors to sleep to conserve power between logging intervals. To make this easier for citizen scientists and other potential users, we developed the EnviroDIY Modular Sensors Arduino code library12 to support wireless, solar-powered environmental data logging applications. The Modular Sensors library coordinates these tasks by “wrapping” native sensor code libraries and other well-developed IoT code libraries into simplified, high level functions with unified conventions for arguments and returns. These wrapper functions also serve to harmonize the process of iterating through the powering up and logging of data from a diverse set of sensors and variables, avoiding code conflicts and minimizing power consumption. In addition, the library supports saving data to a MicroSD memory card, transmitting data wirelessly to an instance of the ODM2 Data Sharing Portal, and putting the processor, sensors, and peripherals to sleep to conserve power. Example code sketches included in the library were designed to serve as a sort of menu of options, where users select the options they need for their specific monitoring site along with specifying their site-specific configuration (i.e., unique registration token, site identifier, and variable identifiers) after registering their site with the portal. Last, a Wiki provides extensive documentation13 and a tutorial guide for first-time users14.
It is beyond the scope of this paper to describe all of the functionality of the Modular Sensors Library. However, the following high-level functions, which are called within an Arduino datalogging sketch, are the basis for enabling the communication between an Internet connected EnviroDIY Mayfly and an instance of the ODM2 Data Sharing Portal:
• setToken( ): Sets the unique registration token for the monitoring site to the value assigned by the ODM2 Data Sharing Portal when the site was registered in the portal.
• setSamplingFeatureUUID( ): Sets the universally unique identifier for the monitoring site assigned by the ODM2 Data Sharing Portal when the site was registered.
• completeUpdate( ): Powers all sensors and iterates through them requesting values as soon as they become available from the sensor. After all values from an individual sensor are received, that sensor is put to sleep and powered down. The iteration attempts to minimize the amount of time all sensors are active in order to conserve battery life.
• printSensorDataJSON( ): Prints a properly formatted JSON string containing the site’s registration token, sampling feature identifier, variable identifiers, observation time stamp, and numeric values of the observed variables.
• postDataEnviroDIY( ): Creates the proper HTTP headers and sends a JSON string to an instance of the ODM2 Data Sharing Portal as an HTTP POST request. Returns an HTTP response code from the ODM2 Data Sharing Portal indicating whether the POST request was successful.
POSTing Data to the Portal
HTTP POST requests containing observation data values can be sent to an instance of the ODM2 Data Sharing Portal with any desired temporal frequency. Requests include HTTP headers and a JSON-encoded body (Figure 2). The registration token in the header serves as the authentication for the ODM2 Data Sharing Portal to ensure that the POST request is from a valid, registered site. Within the body, the sampling feature and variable identifiers are used by the ODM2 Data Sharing Portal to match the data values in the POST request with the correct monitoring site and variable in the database. Any data values within a POST request that have a valid registration token and sampling feature identifier but invalid variable identifiers are ignored. Any number of observed variables can be sent with an individual POST request, but each is associated with a single sampling feature and single timestamp that identifies the data and time at which the values were recorded by the datalogger. Timestamps are encoded using the International Standards Organization (ISO) 8601 standard for encoding date and time strings (International Standards Organization [ISO], 2004).
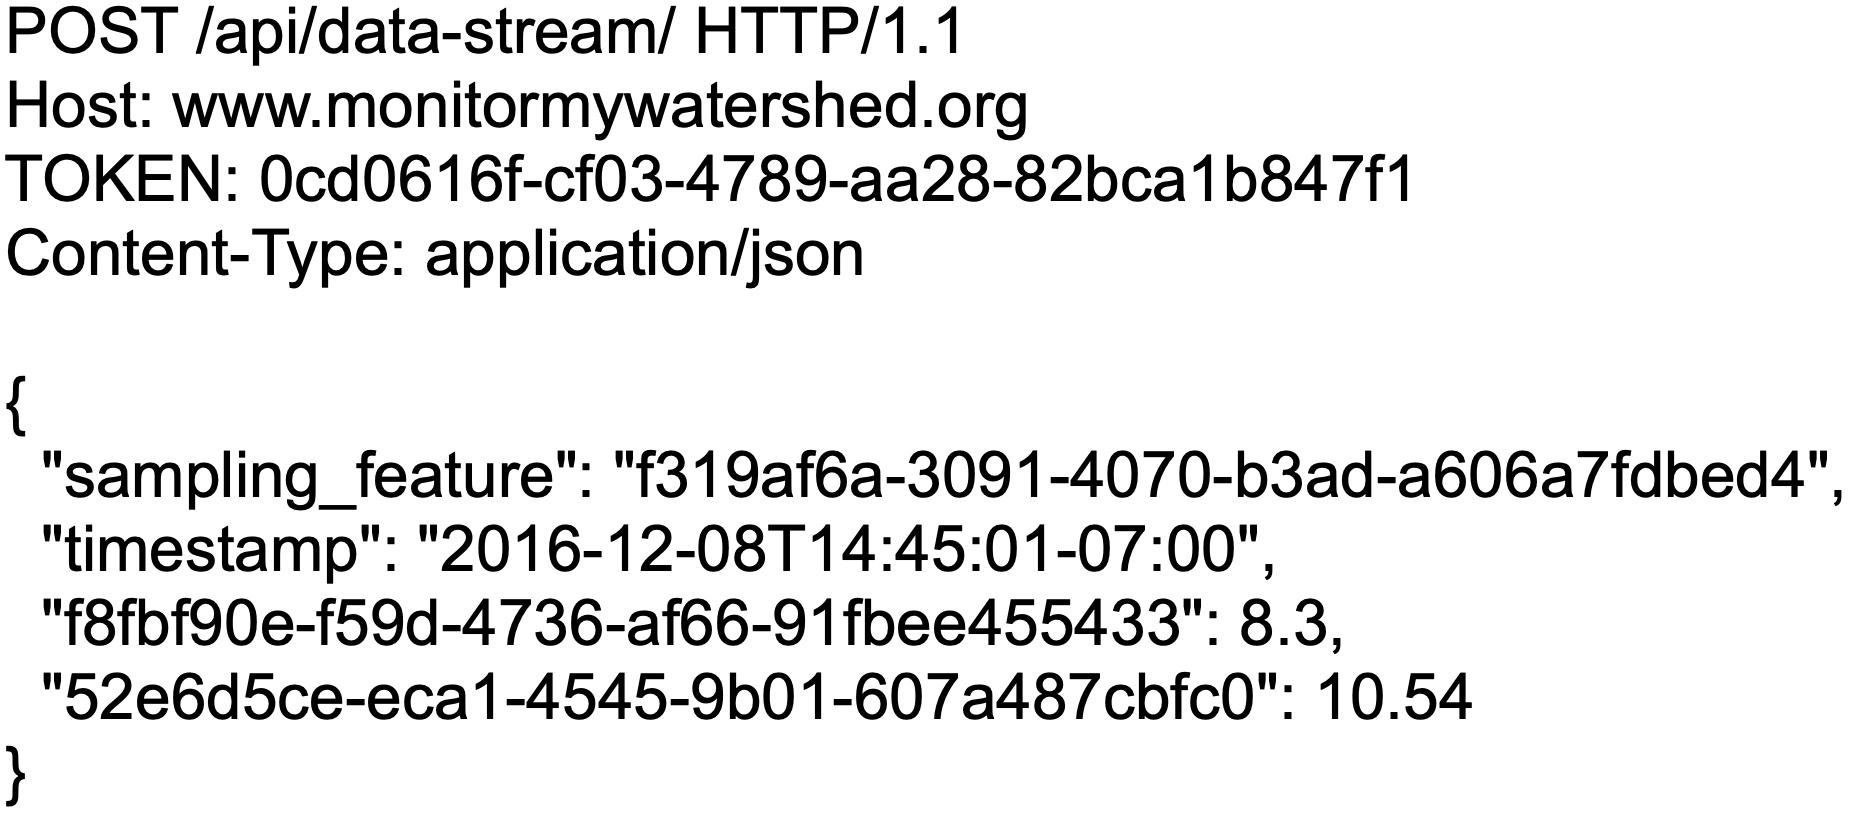
Figure 2. Format of the HTTP POST requests sent to an instance of the Data Sharing Portal to post data. In this example, numeric values are specified for two measured variables.
Portal Deployment on Server Hardware
Although all of the ODM2 Data Sharing Portal components could be installed on the same Linux server, for performance and security reasons, the Monitor My Watershed instance of the ODM2 Data Sharing Portal was deployed on two separate virtual machines running within a VMWare ESXi virtualization environment. The first machine serves as the web server for the portal website and web services. The second machine is a dedicated database server. This separation of concerns ensures that processor intensive tasks on the database server do not slow the web server down and affect the user experience. It also allowed us to keep the database server behind institutional firewalls to limit the surface area for potential security issues.
Both machines were created using Ubuntu Linux Version 16.0415, which was the latest version available at the time the machines were built and is freely available for download (the latest version available for download is 18.04). The web server was allocated four processor cores and eight GB of RAM, while the database server was allocated six cores and 16 GB of RAM. In monitoring these machines, the allocated resources have been more than adequate to serve the needs of the Monitor My Watershed network, with processor and memory usage of each machine generally being well below 25%.
Graphical User Interface
My sites: registering and managing monitoring sites
The My Sites page (Figure 3) consists of a map-based display of all of the monitoring sites that a user has registered within the portal along with access to view the details of each individual registered site via the Site Details page (described below). Users can register new sites on this page by filling in a form with the new site’s descriptive metadata, including the site’s geographic location. The descriptions of existing sites can be edited using this same form. To enhance the sharing aspects of the portal, we also added to the My Sites page a list of sites that the user is following. Followed sites are those registered by other users of the portal that the current user finds interesting or useful. Following a monitoring site is initiated by clicking on a check box on the Site Details page for any site registered within the system.
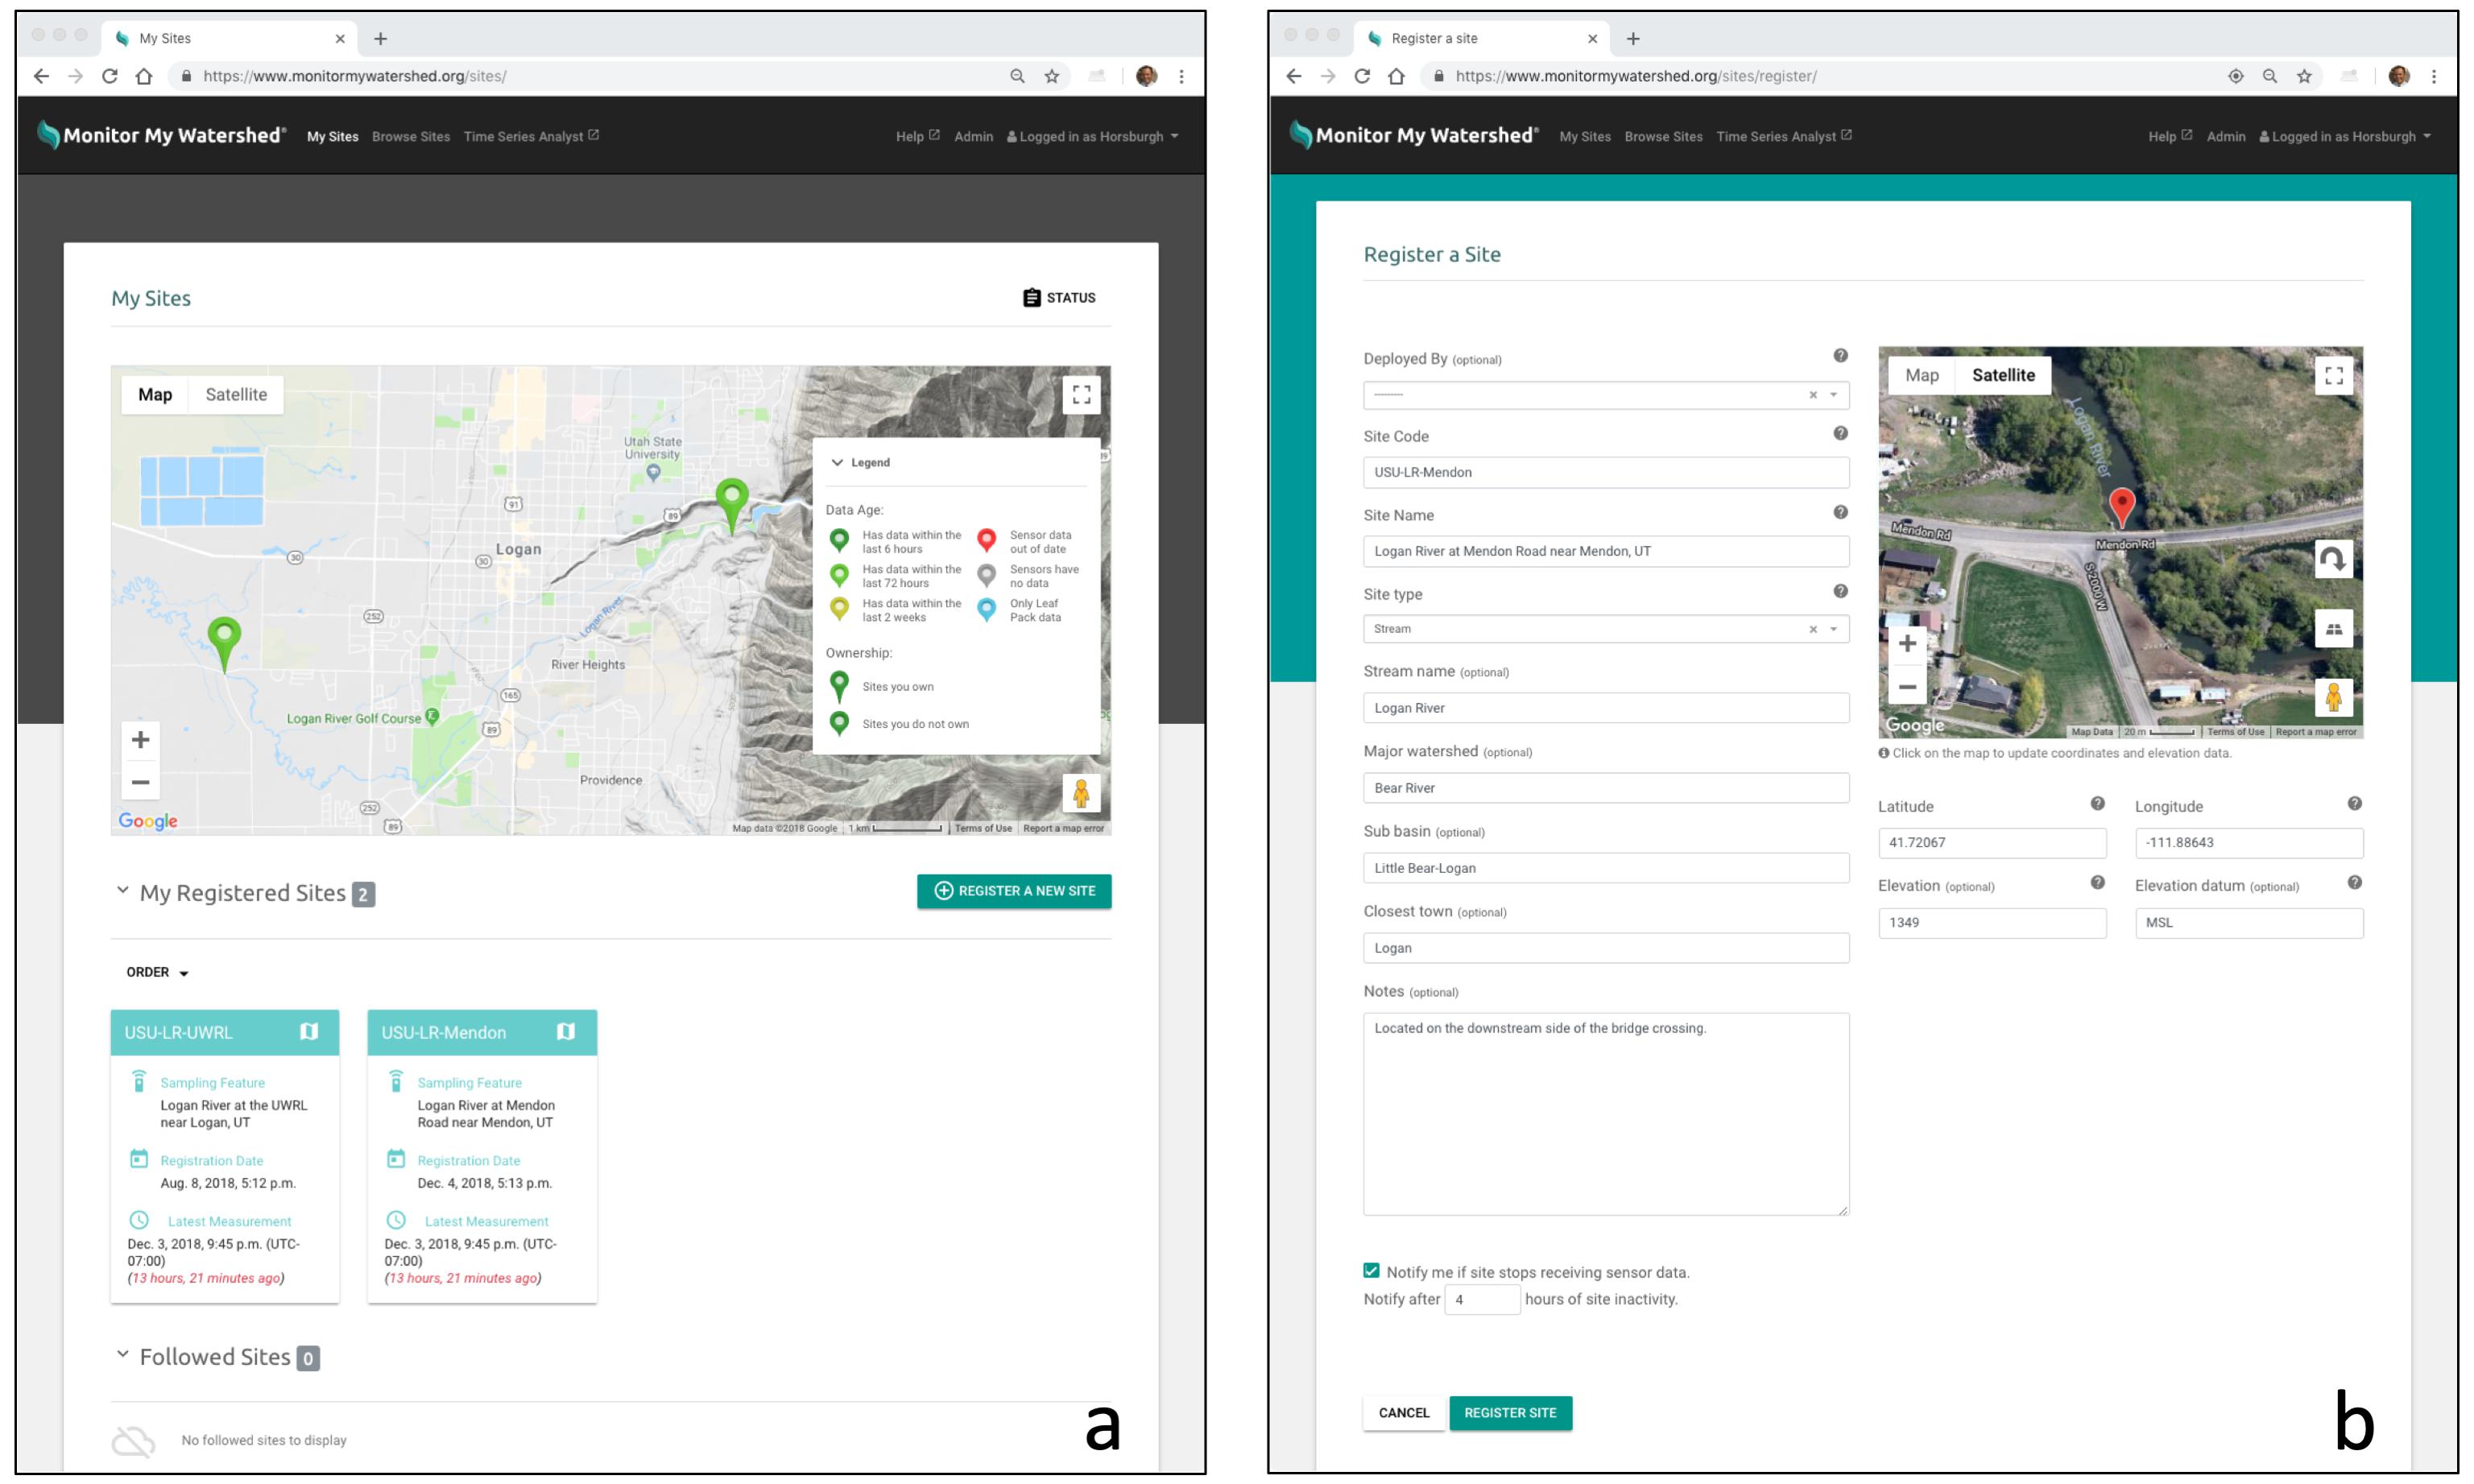
Figure 3. Detailed views of the My Sites page of the Data Sharing Portal. (a) Map view of sites the user has registered and the cards for registered sites. (b) Form for creating a new site or editing an existing site.
Once a user has created a new site, the list of sensors deployed at that site and the list of measured variables and their units can be configured on the Site Details page. Users can also opt to be notified by the portal if it stops receiving sensor data for that site. When this option is selected, the user will be alerted via email when the portal does not receive any new data for the site for more than a configurable number of hours. The data alerts were implemented as a Django script that runs on the web server and is scheduled as a cron job to run every 15 min.
Site details: adding and managing sensors and observed variables
The Site Details page (Figure 4) provides a public view of the descriptive metadata for a monitoring site. For the owner of the site, it provides options for editing the site description, managing sensors and observed variables for the site, viewing and downloading data for the site, configuring the site to share its data to HydroShare (see Integration With the CUAHSI HIS and HydroShare), and deleting the site. Editing the site’s description and deleting the site can be done by the site’s owner by clicking buttons at the top of the page. When a user chooses to delete a site from the portal, that site and all of its associated sensor data are removed from the portal and its databases. Given that users create the data uploaded to the portal, we opted to enable them to delete the data. However, we also provided users with a mechanism for permanently preserving their data in an open data repository (see Integration With the CUAHSI HIS and HydroShare).
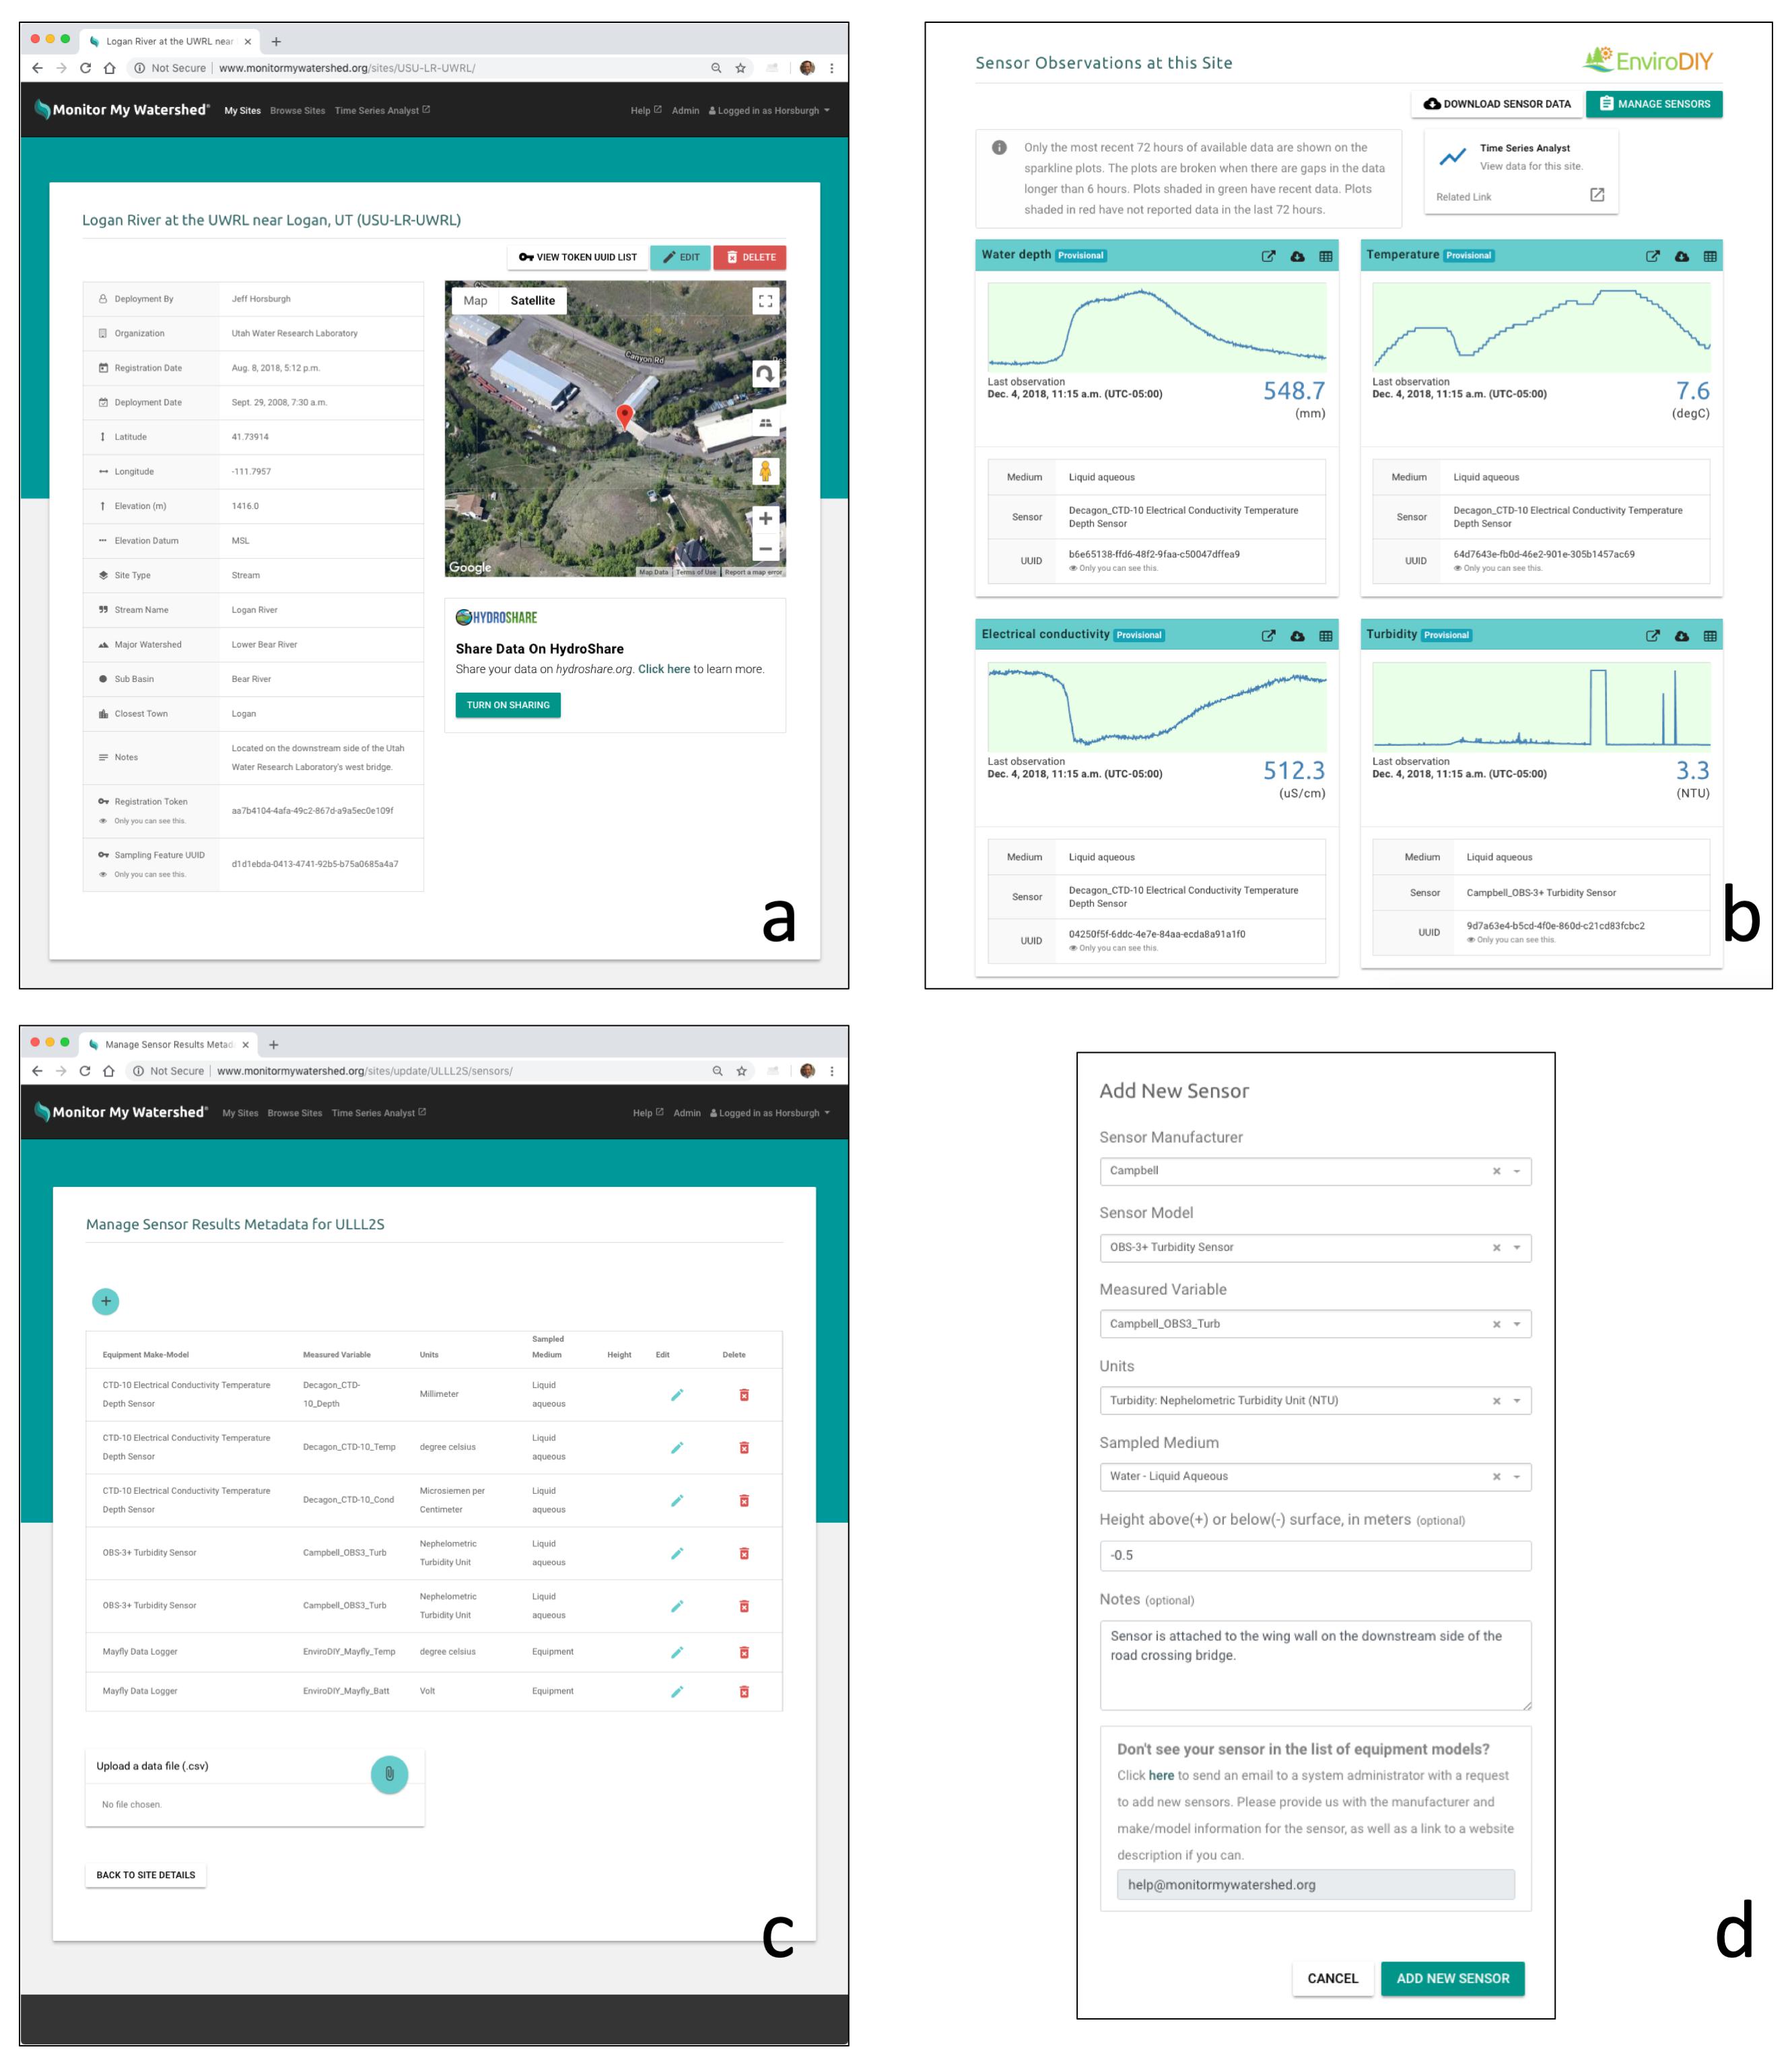
Figure 4. Detailed views of the Site Details page of the Data Sharing Portal. (a) Detailed metadata for a registered site. (b) Sparkline visualizations of data for each of the variables measured at a site. (c) Interface for managing sensors and measured variables at a site. (d) Window for adding or editing a sensor for a site.
The unique identifiers associated with a site, including its registration token and its sampling feature ID, along with the unique identifiers for each of the measured variables are displayed on the page as well as via a pop-up window that makes it convenient for the user to copy the identifiers and paste them into their Arduino (or other) datalogger program for that site. To protect the security of a registered site, these codes are only displayed to the site’s owner. Users that do not own the site can view the site’s metadata, access and download the data, and choose an option to follow the site, which adds that site to a section in their My Sites page.
Toward the bottom of the Site Details page, users are presented with metadata about each variable measured at that site and screening-level visualizations of the data. Each measured variable is displayed on a card with the most recent data value shown and a sparkline plot showing the latest 72 h of data. The background of the sparkline plot is colored to indicate the age of the most recently received data value. Plots shaded green have reported data within the last 72 h and plots shaded red have not. This is a simple and quick indication of both data quality and age for users that can give at-a-glance information about whether a site is reporting data (based on the shading of the sparkline plot) and whether a sensor may be malfunctioning (based on the last reported value and the values shown in the sparkling plot). Each of the variable cards also includes a link to display the last 72 h of data in a tabular view so individual values can be inspected as well as a link to download a comma-separated text file for all of the recorded data for that variable. An additional link is provided to download a single comma-separated values text file containing the data for all measured variables at that site.
Users can manage the list of measured variables at a site by clicking the Manage Sensors button. A new measured variable can be added by selecting options from pre-populated lists of sensor manufacturers, sensor models, measured variables, and units. Additionally, the user can select the environmental medium in which the sensor is installed (e.g., air, water, sediment) and can optionally specify a height above or below the surface to enable installation of multiple sensors making simultaneous measurements at a single site, but at different heights or depths (e.g., multiple temperature sensors installed at different depths in a water column). We chose to have citizen scientists choose from pre-populated lists of sensors, variables, and units because our experience has shown that this significantly simplifies the entry of metadata describing the observed variable and ensures that metadata for all sensors and measured variables are complete and consistent. The tradeoff is that administrators of the portal must add the lists of sensor manufacturers, sensors, measured variables, and units to their instance of the ODM2 Data Sharing Portal before they can be used (see Administrative Functions). Where users wish to add a sensor, measured variable, or use units that do not already exist in the drop-down lists, the “Add New Sensor” form provides an email address for contacting an administrator of the system to get them added. Users can edit existing measured variables at a site and delete them, which removes that measured variable and any associated data from the portal’s underlying databases.
As a final option under managing sensors and measured variables, users can upload a comma separated values text file containing sensor data to be parsed into the portal’s databases. This option is important because it enables users to upload data to the portal under circumstances where communications are lost at a monitoring site making it impossible to send data via HTTP POST requests, or where sites are simply operated without a telemetry connection but with periodic data downloads (e.g., for remote sites with no nearby cellular data network). A Django script parses uploaded data files, compares the data from the file to data within the portal’s database, and adds any new data from the file to the portal. Any data in the file that already exists in the portal’s database is ignored. We modeled the format of the upload data file (Figure 5) after the file format captured on the MicroSD card by datalogger programs built using the Modular Sensors Library to ensure that users could easily download data files from their datalogger’s MicroSD card and then upload them directly to the portal. However, these files can also be constructed using code, in a text editor, or via Microsoft Excel (e.g., in the case a user wants to upload historical data for a site).
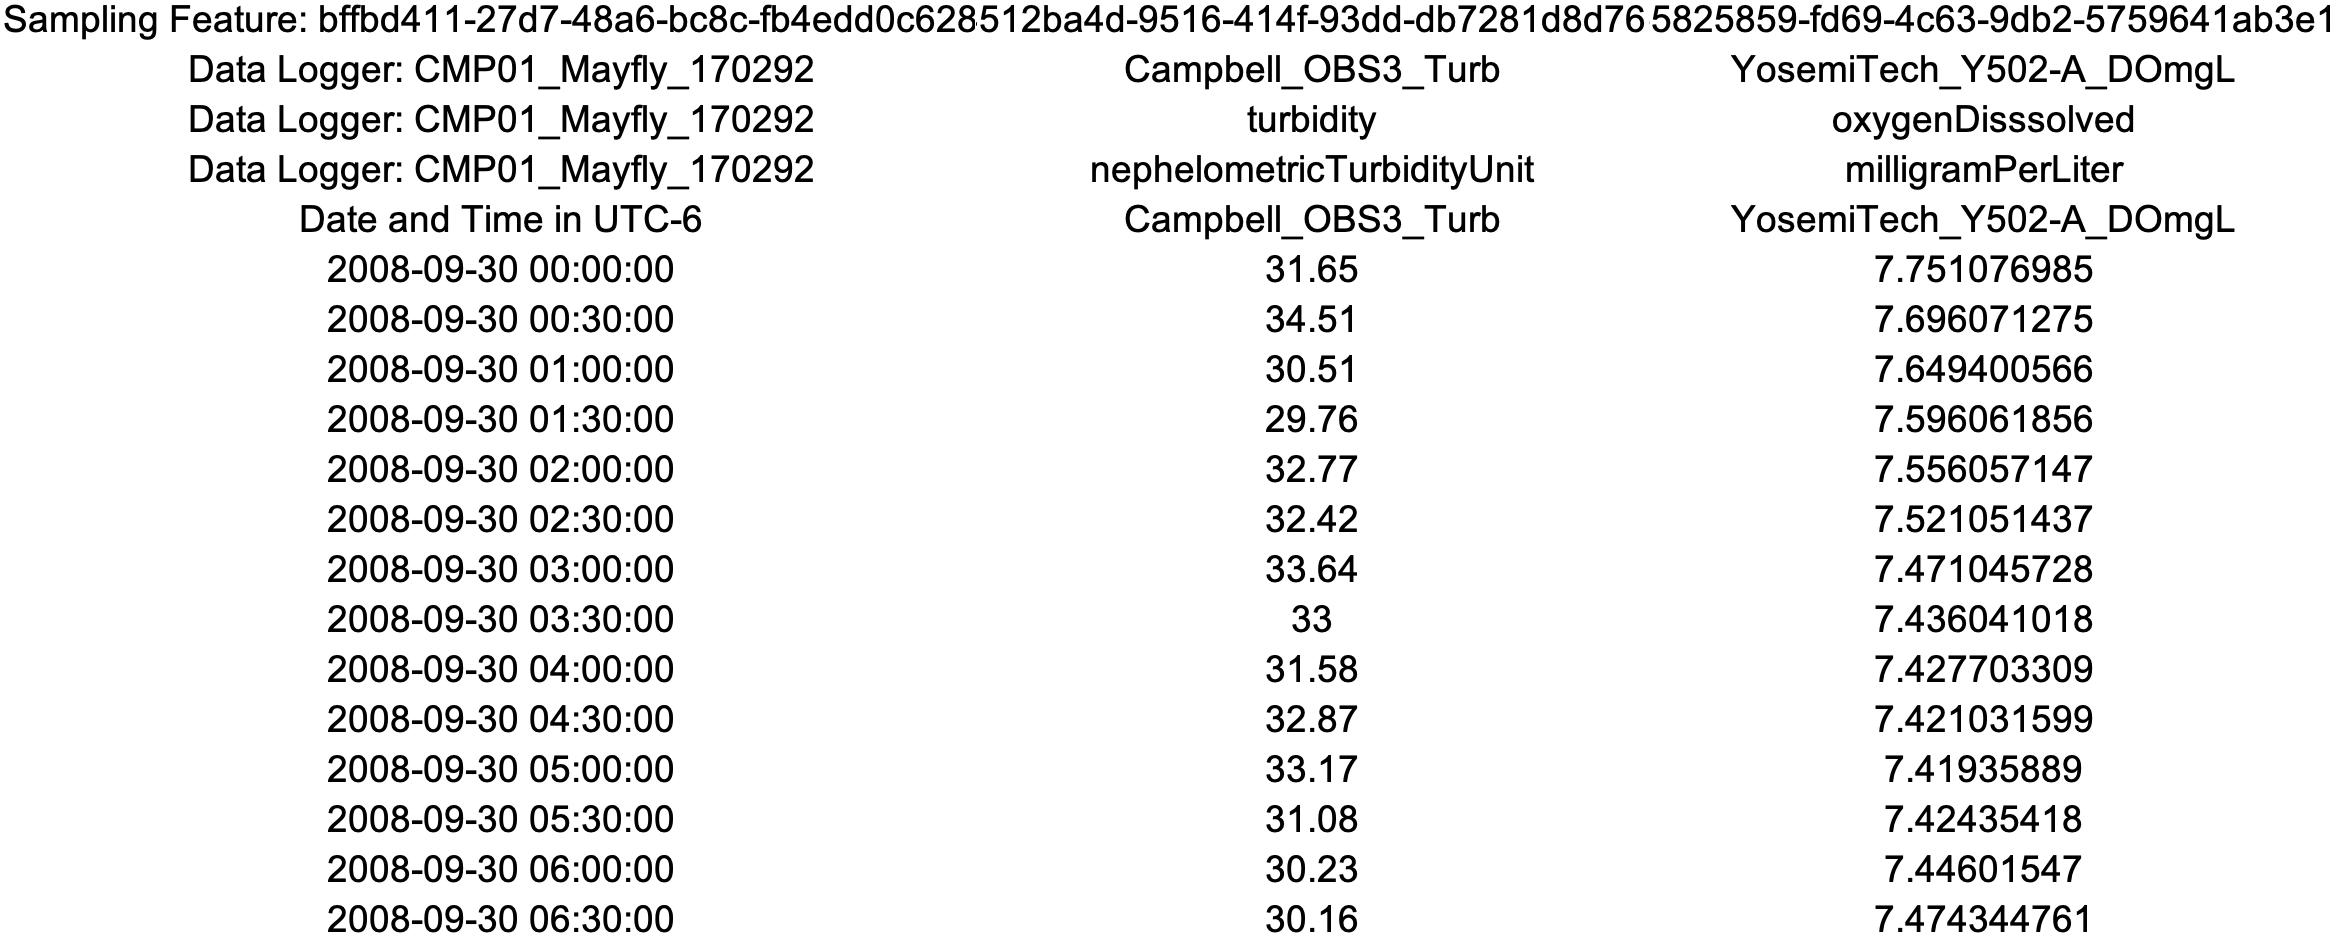
Figure 5. Format of the data upload file showing a brief snippet of data for a site measuring two variables. Files are stored in comma separated value (CSV) format. Comma separators have been omitted from this view of the file for clarity.
The first column of the data file contains the timestamp in ISO 8601 format. Each subsequent column in the file contains the numeric data values for one measured variable at the site. The first line of the file contains the universally unique sampling feature identifier in the first column, and then each subsequent column contains the unique identifier for the measured variable whose numeric values appear in that column. Files can contain any number of measured variable columns and any number of rows of data. Additional header rows are allowed at the top of the file, but are ignored by the data loading script.
Browse sites: discovering and accessing data
To enhance the sharing aspect of the portal, public access to the Site Details page for each site registered within the portal is provided via the Browse Sites page (Figure 6). A Google Maps-based interface is provided that shows the location of all monitoring sites registered with the portal. Sites are indicated on the map with markers that display site ownership (i.e., sites the user owns are shown with a different symbol than sites owned by other users) and the age of the data available at the site (i.e., sites having data within the past 6 h are colored green, whereas sites with data older than 2 weeks are colored red). Users can search sites using the search box at the top of the map, which performs a keyword search on the Site Code and Site Name metadata fields across all sites. Users can also browse sites by entering filter criteria in the faceted browsing panel on the left of the window to search sites by data type, organization, and site type. When search criteria are entered, the map view is automatically zoomed to the extent of sites that meet the specified criteria. Clicking on a site marker on the map shows a pop-up window with basic metadata about that site. Included is a link to “View data for this site,” which opens the public view of the Site Details page for the selected site.
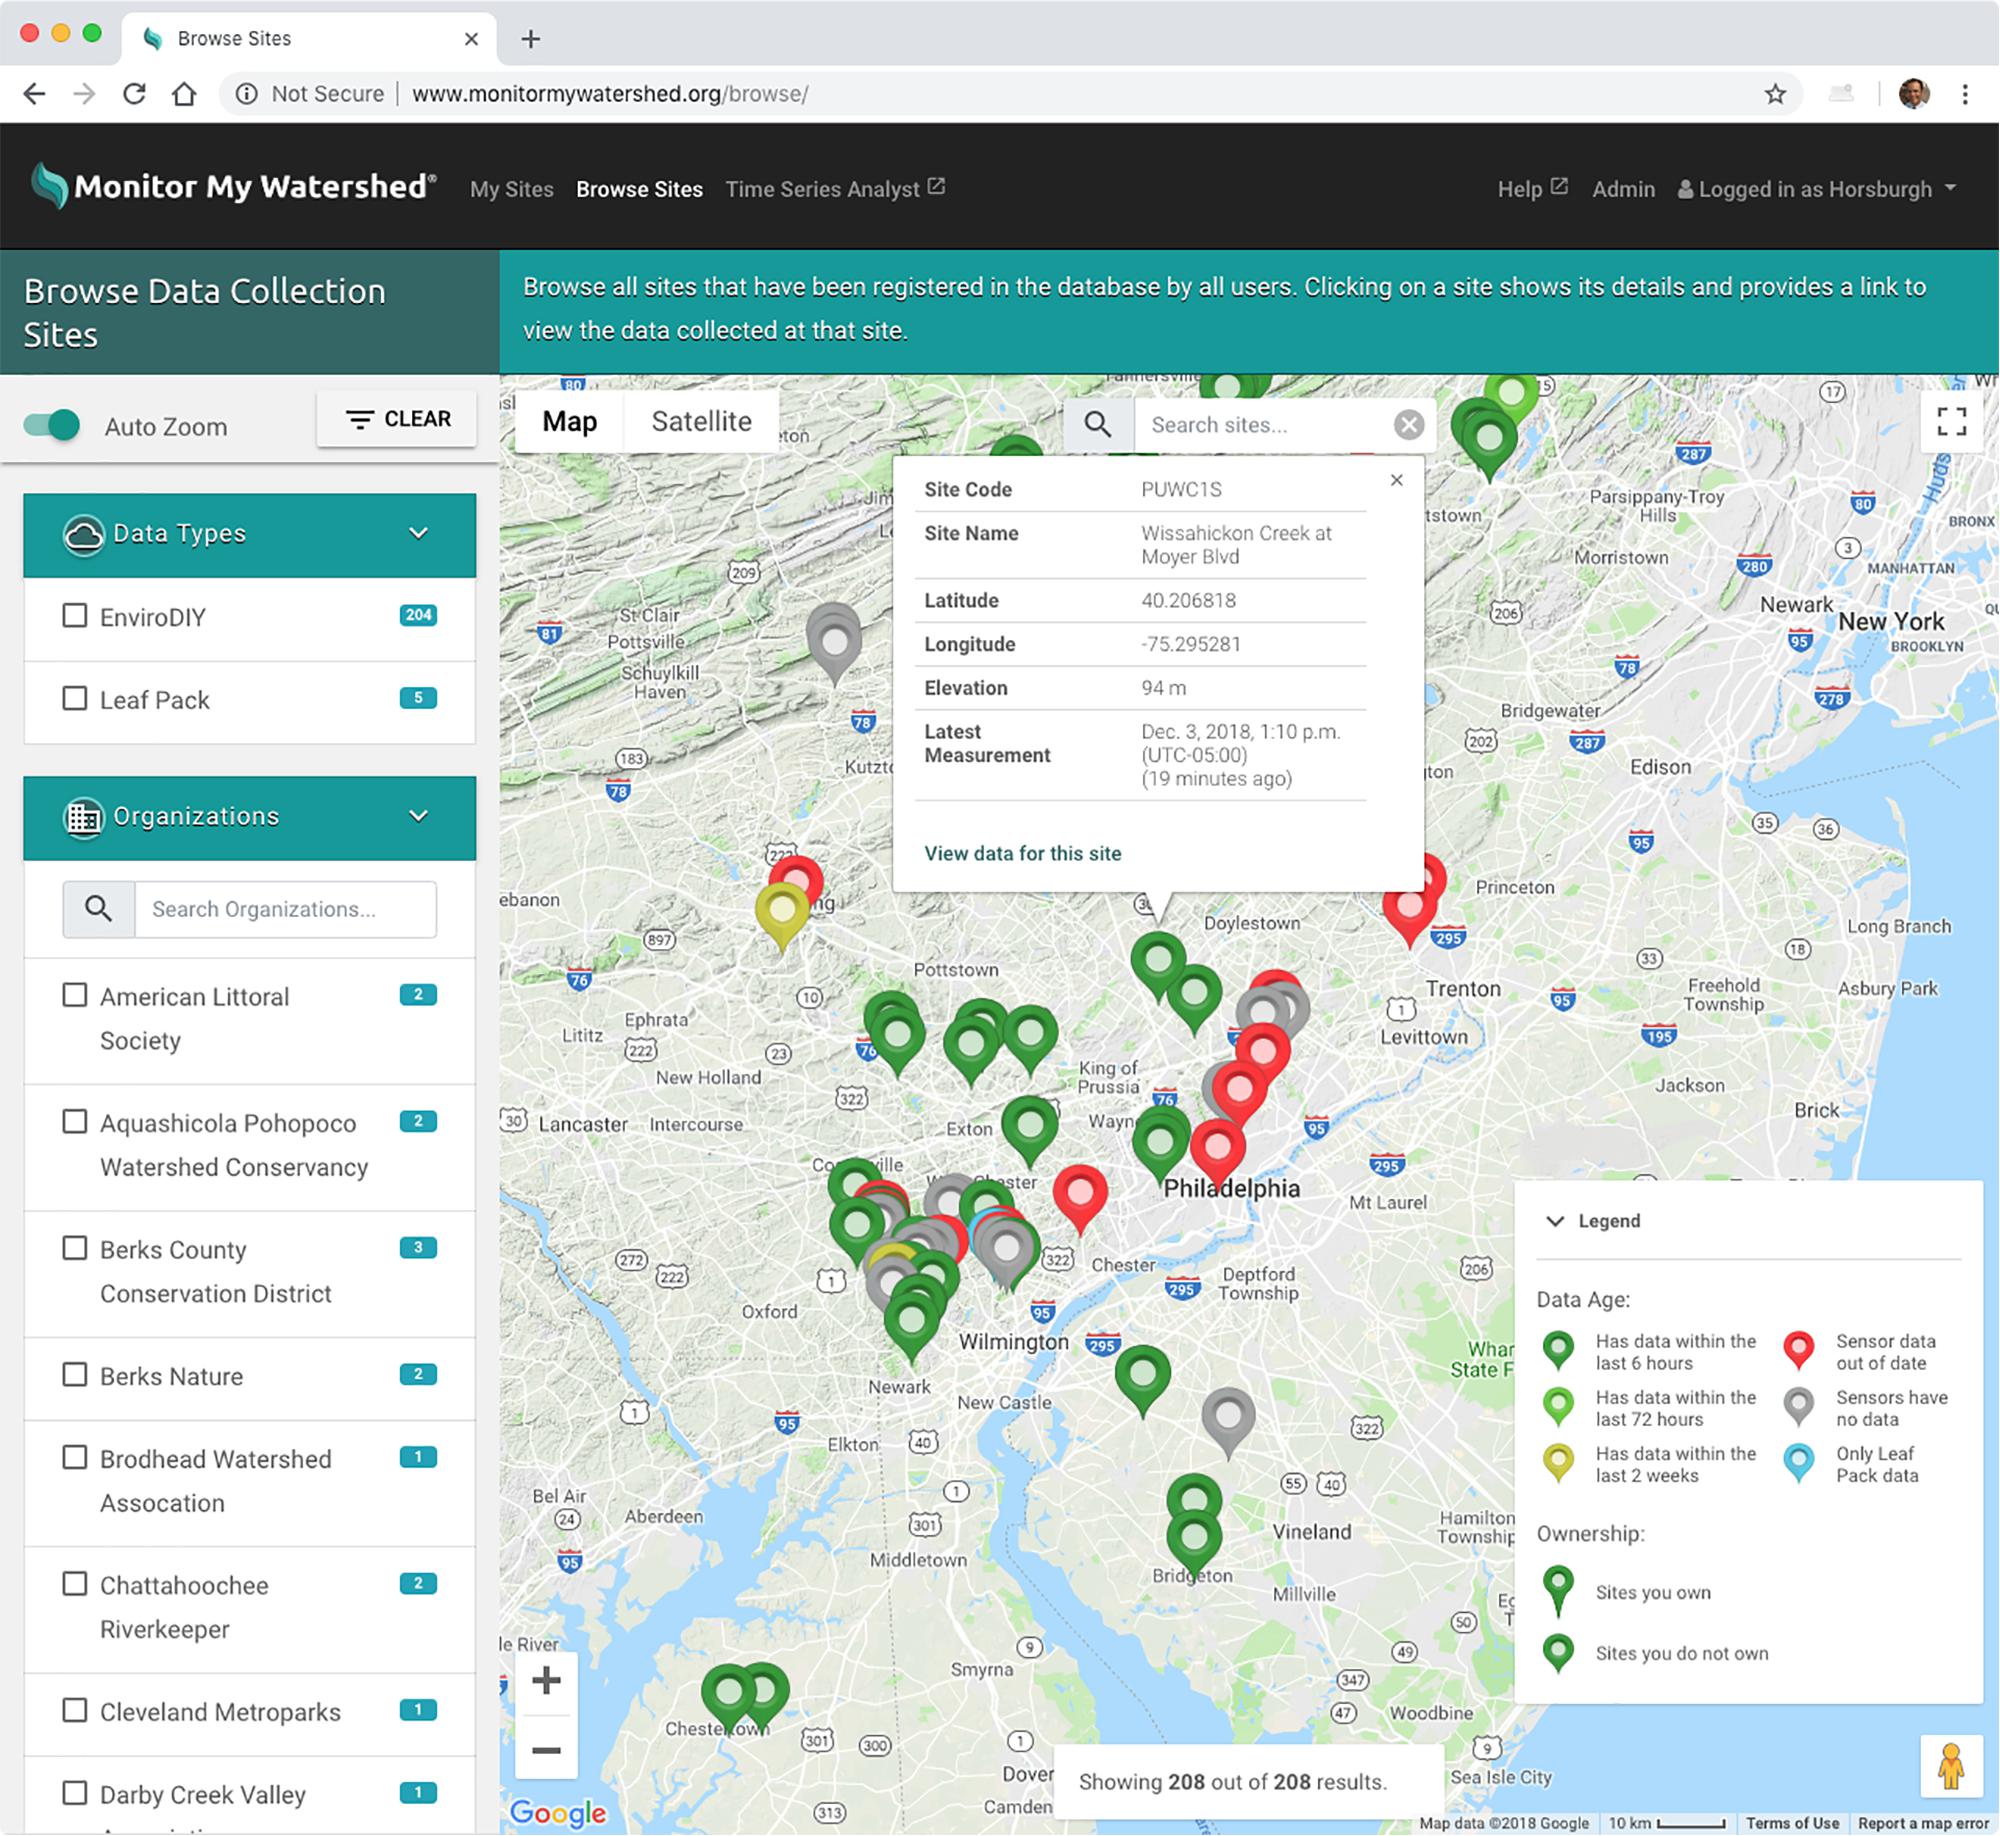
Figure 6. Detailed view of the Browse Sites page of the Data Sharing Portal.
Administrative Functions
Because the primary focus of the ODM2 Data Sharing Portal was citizen science and DIY users, we chose to simplify the input of metadata about sensors, measured variables, and units so that users could select from predefined lists that were already populated within the system. This proved effective at ensuring that the metadata descriptions created by users were complete. However, doing so required that we keep the list of sensors, measured variables, and units up to date. To avoid modifying the code of the portal or requiring low-level database edits every time a new sensor or variable needed to be added, we used Django’s automatic admin interface to create this functionality for a small number of system administrator users. When users with admin rights log into the portal, they can access the admin functionality using a link in the main title bar. This exposes a simple set of Django admin pages for creating new sensors, measured variables, and units. These pages add newly created items to Django’s native ORM database, which means that once they are created by an administrator, they are automatically available for use within the portal.
Integration With the CUAHSI HIS and HydroShare
To best serve the needs of the conservation and environmental science communities for data discoverability, accessibility, and archiving, we enabled automated data exchange with the Water Data Services managed by the Consortium of Universities for the Advancement of Hydrologic Science, Inc. (CUAHSI). This ensures that the portal is not a stove pipe for contributed data (i.e., we wanted users to be able to get their data into and out of the portal). To enable machine-to-machine communication of data, we deployed the WaterOneFlow for Python (WOFPy)16 web services on the portal’s web server and registered them with the CUAHSI Hydrologic Information System (HIS) (Horsburgh et al., 2009, 2010). The WOFPy services connect directly to the portal’s ODM2 PostgreSQL database, serve site and time series level metadata to the central HIS metadata catalog, and serve time series of data values using the WaterOneFlow web service methods standardized by the CUAHSI HIS. Data values are delivered over the web in a standardized extensible markup language (XML) encoding called Water Markup Language (WaterML) (Zaslavsky et al., 2007). By doing so, we made all Monitor My Watershed data searchable and accessible via CUAHSI’s data client application17 and all other WaterOneFlow/WaterML client applications.
We also connected the Monitor My Watershed Data Sharing Portal to HydroShare18, which is a file-based data sharing and publication system operated by CUAHSI (Horsburgh et al., 2015). This allows users to connect their Data Sharing Portal account profile to their HydroShare account and then sync their data from the portal to HydroShare either on demand or on a scheduled basis with a user-configurable frequency. When a user chooses to connect a monitoring site in the portal with HydroShare by turning on sharing via the Site Details page, all of the time series measured at that site are converted to a comma-separated text file (one per variable) with a detailed metadata header and uploaded to a HydroShare resource using HydroShare’s web service application programming interface (API). This enables users to easily move all of their sensor data to an open data repository that offers broader data sharing and formal data publication [i.e., HydroShare issues a citable digital object identifier (DOI) for published datasets and makes them immutable]. These automated data exchanges, with federally supported data cyberinfrastructure and using established environmental data standards for interoperability, distinguish the ODM2 Data Sharing Portal over other IoT data systems.
Discussion and Conclusion
The combination of functionality provided by the ODM2 Data Sharing Portal meets many of the most common needs for streaming environmental sensor data to the web and all of the requirements we identified for a citizen science and DIY environmental data portal aimed at low-cost sensing. Users’ ability to register new data collection sites, describe which data are being collected using the robust metadata model provided by ODM2, and manage their list of registered sites using a web-based GUI enables them to begin logging data from a monitoring site after some basic training. Map-based browsing and display of registered monitoring locations, the faceted browsing interface, and visualization of sites on a map by the age of collected data provide a dashboard for users to monitor the health of their sites and to discover sites and data collected by others. No specialized software or expertise are required to use these tools, which was important for our use case and significantly lowers the bar for getting started with data collection and for accessing the resulting data. More technical users can export selected datasets in a CSV text file format for more sophisticated analyses or visualization in separate data analysis software.
Because the ODM2 Data Sharing Portal uses standard HTTP POST requests for streaming data from the field to the web, any Internet connected device capable of making measurements and formulating an HTTP POST request can send those observations to an instance of the ODM2 Data Sharing Portal. This met our needs in supporting the network of Arduino-based dataloggers in the Delaware River Watershed, each of which sends an HTTP POST request to insert its data into the portal as new data are collected. It also enabled us to insert data from data collection sites that existed before the ODM2 Data Sharing Portal came online via Python scripting to ensure that historical data for existing sites were not lost. Additionally, since the capabilities of the Monitor My Watershed instance of the ODM2 Data Sharing Portal are not specific to the network of sites within the Delaware River Watershed, the network of monitoring sites registered with the Monitor My Watershed website has now grown well beyond the boundaries of the Delaware River Watershed, with more than 190 registered monitoring sites from nearly 70 contributors affiliated with more than 50 organizations, totaling more than 78 million data values at the time of this writing.
While the ODM2 data model proved to be capable of storing the needed metadata for describing monitoring sites, sensors, measured variables, etc., we were unable to obtain acceptable performance for all of the data management, visualization, and download capabilities of the portal website using only an ODM2 database implemented in PostgreSQL. Performance of functionality for generating the screening-level sparkline visualizations and CSV download files on demand for users proved to be unacceptably slow when the number of measured variables at a site grew beyond three to four and when the number of observations for each variable grew beyond a few thousand records. These performance limitations drove our implementation of the high-performance data cache using InfluxDB. When data POST requests are received by an instance of the ODM2 Data Sharing Portal, the new data values are written to both the ODM2 database in PostgreSQL and to the data cache in InfluxDB. Any functionality that needs high-performance access to data values gets them from InfluxDB. Any functionality that requires access to detailed metadata about a site, observed variables, sensors, etc. queries that information from the ODM2 PostgreSQL database. The ODM2 PostgreSQL database also serves as the definitive, archival version of the data from which the InfluxDB cache can be reconstructed at any time if needed. By keeping the PostgreSQL database, we preserved the ability to perform expressive queries using the full syntax of SQL (as opposed to the “SQL-like” query language provided by InfluxDB) on the metadata stored in the ODM2 database. We also maintained much simpler support for enforcing metadata constraints and business rules (e.g., enforcing required versus optional metadata elements) that would have been harder to implement using the unstructured metadata approach of InfluxDB. Other approaches for high performance access to data values could have been investigated, including using materialized views in PostgreSQL or the TimescaleDB extension for PostgreSQL. However, our use of InfluxDB provided the performance and scalability that we needed.
HTTP and REST web services are ubiquitous on the web, integrated well with our chosen development architecture (Python, Django, and the Django REST Framework), and met our communication needs for the first releases of the ODM2 Data Sharing Portal. However, there are disadvantages to this approach – mainly the “overhead” size of HTTP POST requests relative to the volume of data contained within them. This overhead increases the volume of cellular data consumed by a datalogger, which can increase operating costs for monitoring sites using cellular modems. It can also increase the daily electrical power requirements for the monitoring site devices (i.e., a shorter radio pulse requires less power to transmit). We are now investigating potential enhancements to the ODM2 Data Sharing Portal, including enabling the use of Message Queue Telemetry Transport (MQTT) as a communication protocol. MQTT is increasingly used by IoT applications due to its smaller footprint and lower bandwidth consumption. Other potential enhancements under consideration for the Data Sharing Portal include automating and streamlining the entry of site and sensor metadata to avoid redundancy and streamline the process, more advanced tools to support quality assurance for submitted data (e.g., automated value range checks), additional tools for data visualization, and the addition of capabilities for post processing and quality control of submitted data.
The ODM2 Data Sharing Portal was developed over a period of multiple years and has had eight major releases to date. We have received input and feedback about functionality from researchers working on the project and participating DIY users and citizen scientists that we have used to refine the design and functionality of the site. Although the ODM2 Data Sharing Portal was conceptualized and initially implemented for the Monitor My Watershed network of monitoring sites, it was designed for and can be adapted for potential reuse. The components we used in developing the portal are all freely available, and the source code for the portal is shared on GitHub19 under the liberal BSD-3 open source license. To deploy a new instance of the portal to support a different project or data collection network, users would need to procure the necessary server infrastructure (either physical or virtual), modify the styling of the site to suit their needs by replacing logos and modifying the CSS, and then deploy the software. Directions for deploying the data sharing portal software are provided in the GitHub repository. We anticipate that the ODM2 Data Sharing Portal software and/or the methods we used in its design and development may be useful for other organizations that need to provide capabilities for streaming environmental sensor data along with public visualization and data access capabilities for conservation, citizen science, or research efforts.
Software Availability
The software described in this paper includes the ODM2 Data Sharing Portal and associated web services for enabling upload of sensor data from Internet connected devices and the Modular Sensors Arduino library. All of the source code for the ODM2 Data Sharing Portal and related web services is available for download via the GitHub repository at https://github.com/ODM2/ODM2DataSharingPortal. The most recent release for the portal software at the time of this writing was Version 0.9.5 and is available via Zenodo (Caraballo et al., 2019). The production instance of the Monitor My Watershed Data Sharing Portal is available at http://MonitorMyWatershed.org. Code for the Modular Sensors Arduino library is available at https://github.com/EnviroDIY/ModularSensors, with the latest release for the library at the time of this writing being Version 0.17.2.
Author Contributions
JH was the main author of the manuscript. JH and AA co-architected the ODM2 Data Sharing Portal software, including design and specifications, with assistance from DA. JC developed the back-end code, databases, and server infrastructure for the ODM2 Data Sharing Portal software and the Monitor My Watershed implementation. MR developed the front-end code and graphical user interface for the Data Sharing Portal software and Monitor My Watershed implementation. SD is the primary author of the Modular Sensors Arduino library. AA, SD, and DA performed extensive testing of the portal. All authors contributed to writing text and editing the manuscript.
Funding
Funding for this work was provided by the William Penn Foundation under grant 158-15. The opinions expressed herein are those of the authors and do not necessarily reflect the views of the William Penn Foundation.
Conflict of Interest Statement
The authors declare that the research was conducted in the absence of any commercial or financial relationships that could be construed as a potential conflict of interest.
Acknowledgments
We are gratefully acknowledged the work and contributions of the EnviroDIY community and those who participated in testing and advancing the Monitor My Watershed Data Sharing Portal software.
Footnotes
- ^https://www.arduino.cc/
- ^https://www.raspberrypi.org/
- ^http://www.EnviroDIY.org
- ^https://www.djangoproject.com
- ^https://www.postgresql.org/
- ^https://www.influxdata.com/time-series-platform/influxdb/
- ^https://www.django-rest-framework.org/
- ^http://MonitorMyWatershed.org
- ^https://EnviroDIY.org
- ^https://www.EnviroDIY.org/mayfly/
- ^https://github.com/EnviroDIY/EnviroDIY_Mayfly_Logger
- ^https://github.com/EnviroDIY/ModularSensors
- ^https://github.com/EnviroDIY/ModularSensors/wiki
- ^https://envirodiy.github.io/LearnEnviroDIY/
- ^https://www.ubuntu.com/
- ^https://github.com/ODM2/WOFpy
- ^http://data.cuahsi.org
- ^http://www.hydroshare.org
- ^https://github.com/ODM2/ODM2DataSharingPortal
References
Abu-Elkheir, M., Hayajneh, M., and Abu Ali, N. (2013). Data management for the internet of things: design primitives and solution. Sensors 13, 15582–15612. doi: 10.3390/s131115582
Adu-Manu, K. S., Tapparello, C., Heinzelman, W., Apietu Katsriku, F., and Abdulai, J. (2017). Water quality monitoring using wireless sensor networks: current trends and future research directions. ACM Trans. Sens. Netw. 13, 1–41. doi: 10.1145/3005719
Baker, E. (2014). Open source data logger for low-cost environmental monitoring. Biodivers. Data J. 2:e1059. doi: 10.3897/BDJ.2.e1059
Beddows, P. A., and Mallon, E. K. (2018). Cave Pearl data logger: a flexible Arduino-based logging platform for long-term monitoring in harsh environments. Sensors 18:530. doi: 10.3390/s18020530
Bressler, D., Jackson, J. K., Ehrhart, M., and Arscott, D. B. (2018). Building a more scientifically informed community in the Delaware River Basin. Narrat. Inq. Bioeth. (in press).
Caraballo, J., Ramirez, M., Horsburgh, J. S., Blackburn, C., Fryar-Ludwig, K., Aufdenkampe, A. K., et al. (2019). ODM2 Data Sharing Portal: Release 0.9.6 (Version v0.9.6), Zenodo. Available at: http://doi.org/10.5281/zenodo.2563182 (accessed February 12, 2019).
Demir, I., and Krajewski, W. F. (2013). Towards an integrated flood information system: centralized data access, analysis, and visualization. Environ. Model. Softw. 50, 77–84. doi: 10.1016/j.envsoft.2013.08.009
Ensign, S., Arscott, D., Hicks, S., Aufdenkampe, A., Muenz, T., Jackson, J., et al. (2019). A digital mayfly swarm is emerging. EOS 100. doi: 10.1029/2019EO116611
Faustine, A., Mvuma, A. N., Mongi, H. J., Gabriel, M. C., Tenge, A. J., and Kucel, S. B. (2014). Wireless sensor networks for water quality monitoring and control within lake victoria basin: prototype development. Wireless Sens. Netw. 6, 281–290. doi: 10.4236/wsn.2014.612027
Ferdoush, S., and Li, X. (2014). Wireless sensor network system design using Raspberry Pi and Arduino for environmental monitoring applications. Procedia Comput. Sci. 34, 103–110. doi: 10.1016/j.procs.2014.07.059
Freedman, P., Arscott, D. B., Haag, S., and Hall, K. (2018). Data and models help define effective strategies in the Delaware River Watershed Initiative. Water Resour. Impact 20, 19–21.
Gualtieri, G., Camilli, F., Cavaliere, A., De Filippis, T., Di Gennaro, F., Di Lonardo, S., et al. (2017). An integrated low-cost road traffic and air pollution monitoring platform to assess vehicles’ air quality impact in urban areas. Trans. Res. Procedia 27, 609–616. doi: 10.1016/j.trpro.2017.12.043
Hart, J. K., and Martinez, K. (2006). Environmental sensor networks: a revolution in the earth system science? Earth Sci. Rev. 78, 177–191. doi: 10.3390/s18072248
Horsburgh, J. S., Aufdenkampe, A. K., Mayorga, E., Lehnert, K. A., Hsu, L., Song, L., et al. (2016). Observations data model 2: a community information model for spatially discrete Earth observations. Environ. Model. Softw. 79, 55–74. doi: 10.1016/j.envsoft.2016.01.010
Horsburgh, J. S., Morsy, M. M., Castronova, A., Goodall, J. L., Gan, T., Yi, H., et al. (2015). HydroShare: sharing diverse hydrologic data types and models as social objects within a hydrologic information system. J. Am. Water Resour. Assoc. 52, 873–889. doi: 10.1111/1752-1688.12363
Horsburgh, J. S., Tarboton, D. G., Maidment, D. R., and Zaslavsky, I. (2011). Components of an environmental observatory information system. Comput. Geosci. 37, 207–218. doi: 10.1016/j.cageo.2010.07.003
Horsburgh, J. S., Tarboton, D. G., Piasecki, M., Maidment, D. R., Zaslavsky, I., Valentine, D., et al. (2009). An integrated system for publishing environmental observations data. Environ. Model. Softw. 24, 879–888. doi: 10.1016/j.envsoft.2009.01.002
Horsburgh, J. S., Tarboton, D. G., Schreuders, K. A. T., Maidment, D. R., Zaslavsky, I., and Valentine, D. (2010). “Hydroserver: a platform for publishing space-time hydrologic datasets,” in Proceedings of the 2010 American Water Resources Association Spring Specialty Conference Geographic Information Systems (GIS) and Water Resources VI, (Orlando, FL: American Water Resources Association), 10–11.
International Standards Organization [ISO] (2004). Data Elements and Interchange Formats – Information Interchange – Representation of Dates and Times, 3rd Edn. 33. Available at: https://www.iso.org/standard/40874.html
Jiang, Q., Kresin, F., Bregt, A. K., Kooistra, L., Pareschi, E., van Putten, E., et al. (2016). Citizen sensing for improved urban environmental monitoring. J. Sens. 2016:5656245. doi: 10.1155/2016/5656245
Johnson, A., Billett, C., and Boon, N. (2018). The delaware river watershed initiative. Water Resour. Impact 20, 10–11.
Jones, A., Aanderud, Z. T., Horsburgh, J. S., Eiriksson, D., Dastrup, D., Cox, C., et al. (2017). Designing and implementing a network for sensing water quality and hydrology across mountain to urban transitions. J. Am. Water Resour. Assoc. 53, 1095–1120. doi: 10.1111/1752-1688.12557
Jones, A. S., Horsburgh, J. S., Reeder, S. L., Ramirez, M., and Caraballo, J. (2015). A data management and publication workflow for a large-scale, heterogeneous sensor network. Environ. Monit. Assess. 187:348. doi: 10.1007/s10661-015-4594-3
Karami, M., McMorrow, G., and Wang, L. (2018). Continuous monitoring of indoor environmental quality using an Arduino-based data acquisition system. J. Build. Eng. 19, 412–419. doi: 10.1016/j.jobe.2018.05.014
Mason, S. J. K., Cleveland, S. B., Llovet, P., Izurieta, C., and Poole, G. C. (2014). A centralized tools for managing, archiving, and serving point-in-time data in ecological research laboratories. Environ. Model. Softw. 51, 59–69. doi: 10.1016/j.envsoft.2013.09.008
Mazumdar, S., Wrigley, S., and Ciravegna, F. (2017). Citizen science and crowdsourcing for Earth observations: an analysis of stakeholder opinions on the present and future. Remote Sens. 9:87. doi: 10.3390/rs9010087
Muste, M. V., Bennerr, D. A., Secchi, S., Schnoor, J. L., Kusiak, A. K., Arnold, N. J., et al. (2013). End-to-end cyberinfrastructure for decision-making support in watershed management. J. Water Resour. Plan. Manage. 139, 565–573. doi: 10.1061/(ASCE)WR.1943-5452.0000289
Rundel, P. W., Graham, E. A., Allen, M. F., Fisher, J. C., and Harmon, T. C. (2009). Environmental sensor networks in ecological research. New Phytol. 182, 589–607. doi: 10.1111/j.1469-8137.2009.02811.x
Sadler, J. M., Ames, D. P., and Khattar, R. (2016). A recipe for standards-based data sharing using open source software and low-cost electronics. J. Hydroinform. 18, 185–197. doi: 10.2166/hydro.2015.092
Samourkasidis, A., Papoutsoglou, E., and Athanasiadis, I. N. (2018). A template framework for environmental timeseries data acquisition. Environ. Model. Softw. (in press). doi: 10.1016/j.envsoft.2018.10.009
Wickert, A. D. (2014). The ALog: inexpensive, open-source, automated data collection in the field. Bull. Ecol. Soc. Am. 95, 166–176. doi: 10.1890/0012-9623-95.2.68
Wong, B. P., and Kerkez, B. (2016). Real-time environmental sensor data: an application to water quality using web services. Environ. Model. Softw. 84, 505–517. doi: 10.1016/j.envsoft.2016.07.020
Keywords: low-cost, open-source, environmental sensors, data management, Arduino, Mayfly datalogger, EnviroDIY, Monitor My Watershed
Citation: Horsburgh JS, Caraballo J, Ramírez M, Aufdenkampe AK, Arscott DB and Damiano SG (2019) Low-Cost, Open-Source, and Low-Power: But What to Do With the Data? Front. Earth Sci. 7:67. doi: 10.3389/feart.2019.00067
Received: 07 December 2018; Accepted: 19 March 2019;
Published: 03 April 2019.
Edited by:
Rolf Hut, Delft University of Technology, NetherlandsReviewed by:
Ute Wollschläger, Helmholtz Centre for Environmental Research (UFZ), GermanyIoannis N. Daliakopoulos, Technological Educational Institute of Crete, Greece
Chet Udell, Oregon State University, United States
Copyright © 2019 Horsburgh, Caraballo, Ramírez, Aufdenkampe, Arscott and Damiano. This is an open-access article distributed under the terms of the Creative Commons Attribution License (CC BY). The use, distribution or reproduction in other forums is permitted, provided the original author(s) and the copyright owner(s) are credited and that the original publication in this journal is cited, in accordance with accepted academic practice. No use, distribution or reproduction is permitted which does not comply with these terms.
*Correspondence: Jeffery S. Horsburgh, amVmZi5ob3JzYnVyZ2hAdXN1LmVkdQ==