 Alia L. Khan
 Andrew G. Klein
 Joseph M. Katich
 Peng Xian
- 1Department of Environmental Sciences, Western Washington University, Bellingham, WA, United States
- 2National Snow and Ice Data Center, Cooperative Institute for Research in Environmental Sciences, University of Colorado Boulder, Boulder, CO, United States
- 3Department of Geography, Texas A&M University, College Station, TX, United States
- 4Chemical Sciences Division, NOAA Earth System Research Laboratory (ESRL), Boulder, CO, United States
- 5Cooperative Institute for Research in Environmental Sciences (CIRES), University of Colorado Boulder, Boulder, CO, United States
- 6Atmospheric Properties and Effects Section, Marine Meteorology Division, United States Naval Research Laboratory, Monterey, CA, United States
Antarctica is often regarded as the most pristine continent on Earth. However, local human activity can be significant point sources of production of contaminants, as well as light absorbing aerosols, such as black carbon (BC). In May 2015, over the Austral fall season (at the beginning of the accumulation season), surface snow was sampled at eight sites along a 1.7 km transect extending from Palmer Station, Antarctica. Two additional sites were sampled on Biscoe Point 14 km from the station. Snow samples were analyzed for refractory black carbon (rBC) with a Single Particle Soot Photometer (SP2). rBC concentrations increased with proximity to the Palmer Station 1.2–16.5 μg-rBC/L-H2O (4.7 ± 4.9 μg-rBC/L-H2O) and were higher than other studies of rBC in snow, such as in the McMurdo Dry Valleys, Antarctica (MDV) and the Clean Air Sector of the South Pole Station (CAS-SP), except on the more remote Biscoe Island, 0.4–1.2 μg-rBC/L-H2O, which had similar background concentrations to the MDV and CAS-SP, 0.3–1.2 (0.6 ± 0.3 μg-rBC/L-H2O) and (0.14–0.80 μg-rBC/L-H2O), respectively. However, concentrations were lower than previous observations at South Pole Station downwind of the generator and long the runway (6.6–7000 μg-rBC/L-H2O). Palmer Station is located on the southwestern coast of Anvers Island which lies off the western coast of the Antarctic Peninsula at 64∘ 46′S, 64∘ 03′W. Comparison with the Navy Aerosol Analysis Prediction System (NAAPS) model show that wildfire smoke may have reached this region of the Antarctic continent during the time period of the deposition of this seasonal snow, suggesting the increase in rBC may be a combination of local combustion of fossil fuels and regional wildfires. Although significant increases in rBC concentrations are found within a km of Palmer Station, like the South Pole Station, rBC is limited to a few kms from the station. Additionally, these measurements of rBC, which may be the only BC measurements in snow on the Antarctic Peninsula, show that background levels are similar to other locations on the continent.
Introduction
Palmer Station is the smallest of the three permanent scientific research stations operated by the United States Antarctic Program (USAP). It is located on the southwestern coast of Anvers Island which lies off the western coast of the Antarctic Peninsula at 64° 46′S, 64° 03′W (Figure 1). The current station, which was commissioned on 20 March 1968 supports U.S. scientific research in the Antarctic Peninsula Region. It replaced “Old Palmer Station” which was established in 1965 on Amsler Island adjacent to the British Antarctic Survey’s Base N, which was built in 1955 and abandoned in 1958. Palmer Station currently comprises two major and three smaller buildings, a boat dock and pier. Its maximum capacity is 44 individuals in the summer and approximately 20 people in winter. The R/V Laurence M. Gould regularly services the station. It is located within and supports research for the Palmer Long Term Ecological Research (LTER) site, which was established in the Fall of 1990.
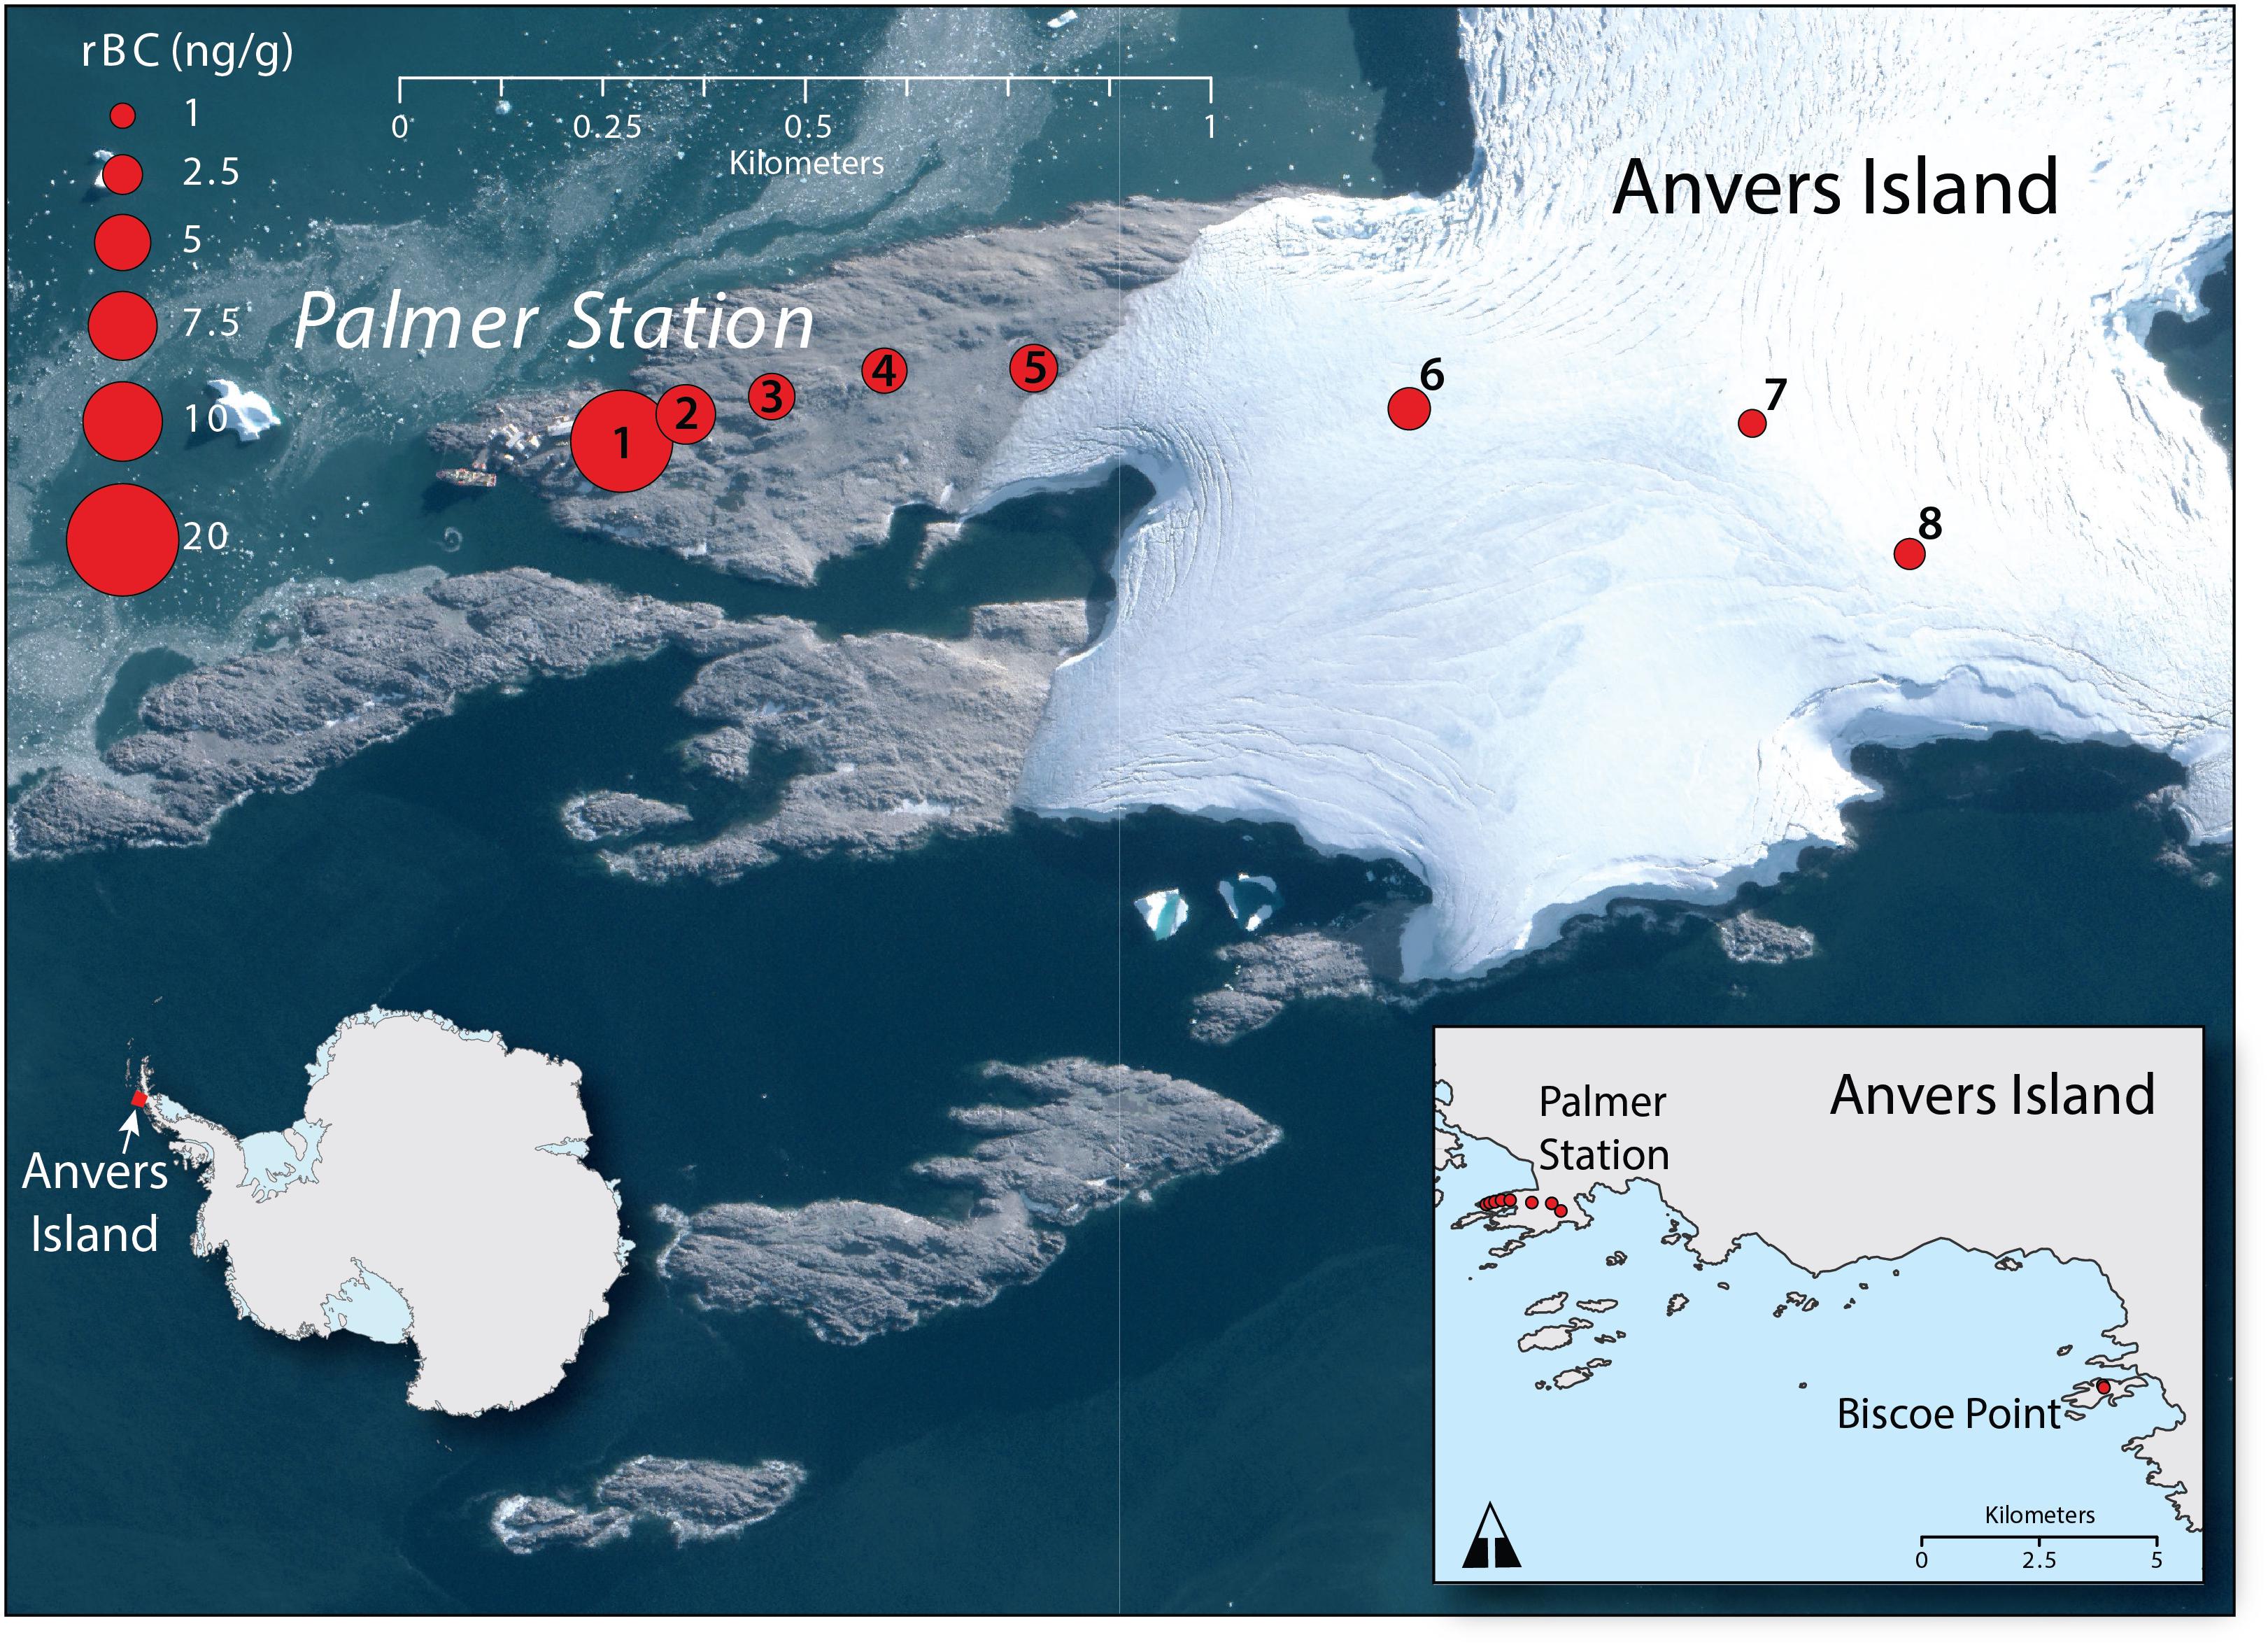
Figure 1. Surface snow-sampling locations. On the main map the size of the symbol is proportional to the concentration of rBC. The background image is a WorldView2 satellite image from March 24, 2013 courtesy of the Polar Geospatial Center, University of Minnesota.
Black carbon (BC) is a light-absorbing aerosol generated from the incomplete combustion of biomass burning and fossil fuels (Goldberg, 1985). BC influences atmospheric radiation and air quality (Bond et al., 2013) and the deposition of BC on snow/ice reduces the surface albedo (Warren and Wiscombe, 1980) and can lead to earlier and more rapid snow/ice melt (Xu et al., 2009). Previous studies have confirmed the presence of BC in snow and ice on the Antarctic continent (Warren and Wiscombe, 1980; Bisiaux et al., 2011, 2012; Bauer et al., 2013; Khan et al., 2016, 2017, 2018; Casey et al., 2017). The primary sources of BC to the southern hemisphere has been identified as biomass burning in Australia, South America, and Africa (Crutzen and Andreae, 1990). Variations in seasonal and decadal long-range BC transport to Antarctica have been observed to be due to changes in climate and the resulting influence on biomass burning in the Southern Hemisphere. Ice cores from Law Dome and the West Antarctic Ice Sheet (WAIS) showed significant annual to decadal variability (Bisiaux et al., 2012) where rBC transport to Antarctica was affected by ENSO climate patterns due to changes in biomass burning as a result of arid conditions.
Despite the perception that the Antarctic environment is pristine, it is subjected to diverse anthropogenic impacts on local to regional scales and these impacts are of concern (e.g., Tin et al., 2009). Over the past 25 years, the chemical signature of BC in the surface waters of McMurdo Dry Valley (MDV) lakes has shifted toward modern anthropogenic sources of BC (Khan et al., 2016), whereas a BC chemical signature of ancient biomass burning has been preserved in the lake bottom waters. The recent shift may be due to local combustion of fossil fuels from combustion toilets, diesel generators, all-terrain vehicles, and helicopters, which contribute 3.4 × 10⁵ g aerosol elemental carbon annually in the MDV (Lyons et al., 2000). Additionally, previous studies on the Antarctic continent have found the South Pole Station creates enough local pollution to reduce the surface albedo of snow downwind of the station (Warren and Wiscombe, 1980; Warren and Clarke, 1990) and along the runway, leading to refractory black carbon (rBC) concentrations of (6.6–7000 μg-rBC/L-H2O) (Casey et al., 2017). rBC is defined as BC detected via laser-induced incandescence via Single Particle Soot Photometer (SP2) (Petzold et al., 2013).
Environmental protection of Antarctica is internationally recognized and documented in the Antarctic Treaty (Watts, 1992). The Treaty and its annexes set forth national responsibilities to protect the environment. Individual treaty nations then enact national legislation, which regulates each country’s nationals while in Antarctica. The Treaty’s environmental protection practices were clarified and enhanced by the Protocol on Environmental Protection (often referred to as the Madrid Protocol), which entered into force in 1998 (Stokke and Vidas, 1998). The Protocol recognized that effective management of human impact on the continent required the monitoring of human activities. The snow samples in this study collected were collected as part of a program to design a long-term environmental monitoring program for Palmer Station similar to the program implemented for USAP’s much larger McMurdo Station (Kennicutt et al., 2010; Klein et al., 2014). While the spatial extent of anthropogenic impacts around Antarctic research stations varies by contaminant or type of impact, these impacts are generally limited to a few hundred meters or few kilometers from the station. This study provides an initial estimate of the spatial extent of Palmer Station’s BC emissions on the local environment.
Materials and Methods
Site Description
As with other USAP facilities, Palmer Station operates on petroleum and station activities produce hydrocarbon emissions. For Fiscal Years 2006–2010, fuel consumption at Palmer Station averaged 104,792 gallons annually. Of this, 80% was consumed by the station’s power plant, 19% for heating and hot water and 1% for vehicles (RSA Engineering, 2011). Two 250 kW Caterpillar engine generators (circa 1998) supply power to Palmer Station and heat to the building in which they are located. Oil boilers provide hot water for the other buildings. Machinery and small boats, at the time of this study, primarily inflatable Zodiacs, are also operated on station. A small incinerator is operated sporadically to incinerate poultry waste and a small wood-burning stove operates in one of Palmer’s two main buildings. Palmer Station has ∼20% of the population of the South Pole at its maximum.
The Research/Vessel (R/V) Laurence M. Gould (LMG), operated by Lockheed Martin, supports Science and operations at Palmer Station. The LMG is a 230 foot long ice-classed ABS-A1 research and resupply vessel on a long-term charter from Offshore Service Vessels LLC. The LMG has two main engines (Caterpillar 3606) and three generators (Caterpillar 3508). USAP’s larger vessel, the Nathaniel B. Palmer, services Palmer Station occasionally and approximately a dozen cruise vessels visit the station each year.
The LMG typically averages 8–9 visits to Palmer Station each year (RSA Engineering, 2011). During the period of snow accumulation in this study, the LMG made three cruises to Palmer Station LMG 15-02 (2/13-3/16), 15-03 (3/20-4/4), and 15-04 (4/7-5/11). Based on analysis of the LMGs navigational data (Aronson, 2015; O’Brien et al., 2015) and cruise history (United States Antarctic Program[USAP], 2018), the LMG spent approximately 13 days docked at Palmer Station from the first day of snow accumulation March 9th through sample collection on May 5th.
Snow Measurements
On 5 May 2015, during a period without recent snowfalls, surface snow samples were collected for rBC analysis at eight sites along a 1.7 km transect extending eastward from Palmer Station. These sites were augmented by samples collected from two more remote sites located approximately 14 km from Palmer Station on Biscoe Point (now an island) situated within the Biscoe Point Antarctic Specially Protected Area (ASPA) No. 139 on 1 May 2015. Entry to an ASPA requires special permitting to sample these pristine sites (Figure 1).
At each site three replicate sample duplicates were collected. rBC concentrations reported in Table 1 are the average of the three sample duplicates. Snow was collected in 500 ml glass jars which were pre-cleaned to meet Environmental Protection Agency (EPA) Protocol A Level 1 standards for contaminants. Samples were obtained by placing the opening of the glass jar perpendicular to the horizontal surface of the snowpack and pressing the jar through the snowpack until the snow completely filled the jar. Care was taken so the surface was only sampled once per replicate.
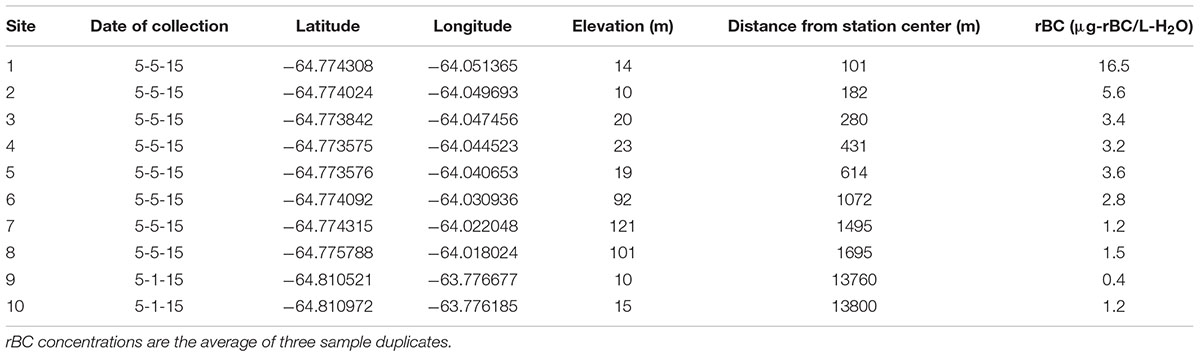
Table 1. rBC concentrations in snow collected along a transect away from Palmer Station.
After collection, snow samples were kept frozen at Palmer Station, during their transport to Punta Arenas, Chile and onward to Texas A&M University until they were shipped to the Institute of Arctic and Alpine Research (INSTAAR) in Boulder, CO and then transferred to the Earth System Research Laboratory at the National Oceanic and Atmospheric Administration for rBC analysis. Snow samples were then melted for the first time immediately before analysis. The thirty surface snow samples were analyzed for rBC mass mixing ratios (MMR). Briefly, snow samples were melted, then immediately aerosolized with a carefully calibrated nebulizer and sampled with an SP2 following the approach of Schwarz et al. (2012). The SP2 has excellent sensitivity and selectivity for rBC with minimal interference from non-BC materials and was calibrated with fullerene soot (Alfa Aesar, Woodbridge, MA, United States, Lot F12S011). Here, a CETAC Marin-5 nebulizer interfaced with the SP2, following the same protocol as Katich et al. (2017). The size-dependent nebulization efficiency was characterized with concentration standards of polystyrene latex spheres (PSLs) in the size range 220–3000 nm diameter, confirming low sensitivity to particle size over this range, consistent with recent results with concentric pneumatic nebulizers (Lim et al., 2014; Wendl et al., 2014; Mori et al., 2016; Katich et al., 2017). Size distributions were measured for samples with higher concentrations, and these indicated no appreciable contribution to rBC mass above 0.7 μm. Hence no size dependent corrections were applied for nebulizer size dependence. Background rBC contamination levels were bounded by measuring blank samples. Deionized water was used to flush the nebulization system between snow samples to reduce line contamination. Further, measurements of rBC concentrations in blank water samples were interspersed amongst snow samples to bound background contamination levels in the system. This averaged 0.43 μg/L over 15 blank water measurements, indicating a low enough background to avoid significant interference with the rBC MMR measurements. The blanks provide an upper bound on possible contaminants associated with the estimated 60% uncertainty for rBC MMR in the snow, which conservatively accounts for uncertainties dominated by calibration issues (Schwarz et al., 2012).
Local Meteorological Observations
Information on local meteorological conditions during the period of early snow accumulation in 2015 was obtained from two sources. Local Daily Summaries provided daily weather observations including snow depth and accumulation measurements recorded by Palmer Station personnel and were obtained from the Antarctic Meteorological Research Center (AMRC) at the University of Wisconsin (Antarctic Meteorological Research Center [AMRC], 2018) 2-min observations from the Palmer Automated Weather System (PALMOS) available from the Palmer Station Antarctica LTER (Long Term Ecological Research Network-Network Data Portal [LTER-NDP], 2017) were used to investigate wind speed and directions during the period of snow accumulation. Analysis of the weather observations was accomplished using the Anaconda Scientific Python Distribution. The wind roses are produced using IDL software (Fanning, 2019). All mapping was accomplished using ArcMap or ArcGIS Pro.
Aerosol Transport Modeling
Smoke aerosol optical depth (AOD) and concentrations from biomass burning comes from the Navy Aerosol Analysis and Prediction System (NAAPS) reanalysis (Lynch et al., 2016), which was developed and validated at the Naval Research Laboratory. The NAAPS model was used to explore regional and long-range biomass burning smoke transport events during the study period. It is a global 1°×1° decade-long 6-hourly aerosol reanalysis product. It utilizes a modified version of the NAAPS as its core and assimilates quality controlled retrievals of AOD from Moderate Resolution Imaging Spectroradiometer (MODIS) on Aqua and Terra, as well as the Multi-angle Imaging Spectroradiometer (MISR) on Terra (Zhang and Reid, 2006; Hyer et al., 2011; Shi et al., 2014). NAAPS characterizes anthropogenic and biogenic fine aerosol (including primary and secondary organic aerosols and sulfate), biomass burning smoke, dust, and marine sea salt aerosols. Biomass burning smoke is derived from near-real time thermal anomaly satellite based data used to construct smoke source functions (Reid et al., 2009), with orbital corrections on MODIS-based regional tunings and emissions. The fine and coarse mode reanalysis AOD at 550 nm is shown to be in agreement with the ground-based global scale sun photometer network Aerosol Robotic Network AOD (Holben et al., 1998).
Results and Discussion
rBC Concentrations
rBC concentrations in surface snow decrease with increasing distance from Palmer Station (Figure 1 and Table 1). Elevated rBC concentrations were found near the station, 16.5–1.5 μg-rBC/L-H2O, especially as compared to the low concentrations found on Biscoe Island, 0.4 and 1.2 μg-rBC/L-H2O. This suggests that the station’s influence on rBC extends at least 1 km from the station. rBC concentrations in this study near Palmer station were higher than other studies of rBC in snow on the Antarctic continent, such as in the MDV, 0.3–1.2 μg-rBC/L-H2O, except on the more remote Biscoe Island, 0.4 and 1.2 μg-rBC/L-H2O, which like the MDV, has restrictions to entry, and had similar background concentrations indicative of long-range atmospheric transport. However, concentrations in this study were less than previous findings downwind of the generator and along the runway at the South Pole Station (6.6–7000 μg-rBC/L-H2O) (Casey et al., 2017). It should be noted that Palmer Station has ∼20% of the population of the South Pole at its maximum. Additionally, samples from the clean air sector at the South Pole (0.14–0.80 μg-rBC/L-H2O) (Casey et al., 2017) contained similar background concentrations of rBC as found in this study and in the MDV. Although, significant increases in rBC concentrations are found within a km of Palmer Station, like the South Pole Station, rBC is limited to a few kms from station.
During 2015, Palmer Station recorded some of its highest snow depths over the period of record (Figure 2). The period preceding snow sampling on May 1st and 5th saw intermittent snow on the ground from March 9 to April 5 after which snow was continuously present at the station. It reached a depth of 40 cm in late April. However, April 28–30 saw air temperatures remaining above freezing and maximum air temperatures exceeding 4° causing snow to disappear at the Palmer snow stake on May 1st. Therefore, the snow sampled on May 1st and 5th represent the snow that remained in patches or on the glacier from the early period of well-above average snow accumulation.
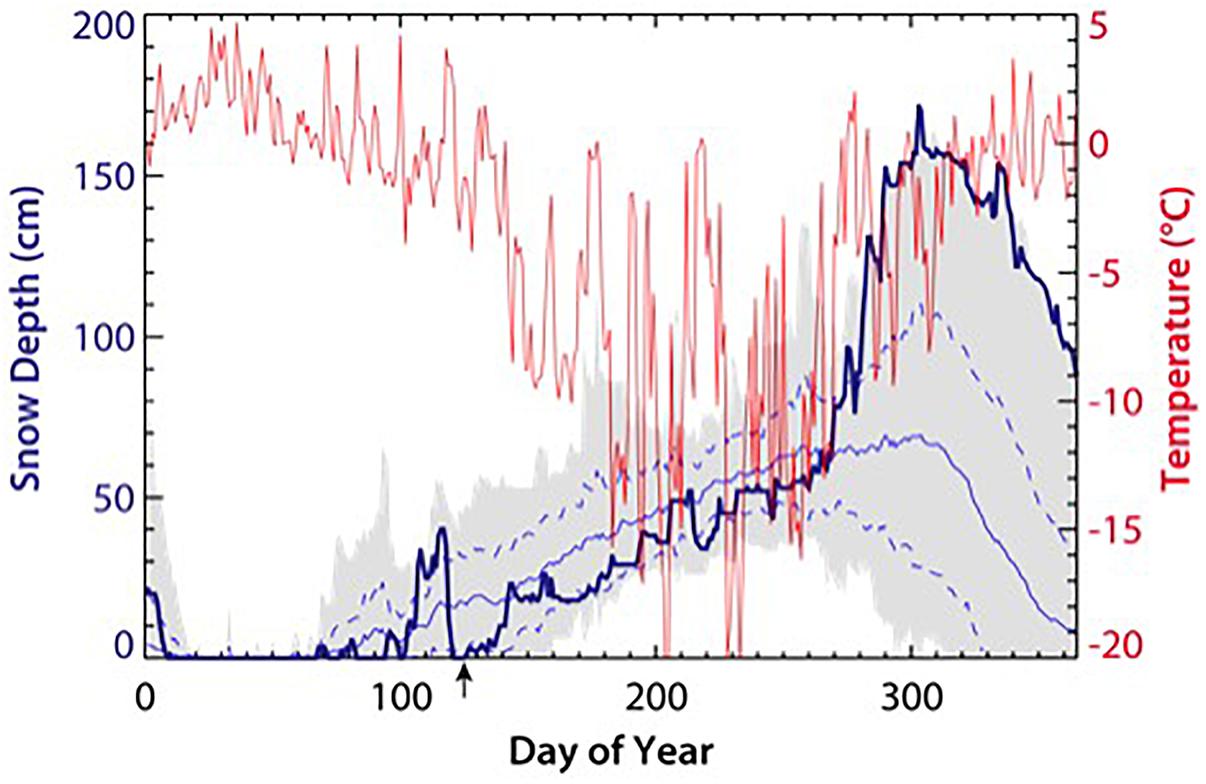
Figure 2. Snow depths and temperature at Palmer Station for 2015. Daily snow depths (cm) during 2015 are shown as the thick blue line while the thin red line indicates corresponding average daily temperatures. The minimum and maximum daily snow depths recorded during the period of record (1991–2015) are indicated by the gray envelope. The light solid blue line indicates the average snow depth for each day while the dotted blue lines are +/– 1 standard deviation from the mean. The arrow pointing to day 125 indicates May 5th the major sampling day.
The wind roses illustrated in Figure 3 show that surface winds during the snow accumulation period of the sampling differ from long-term averages for the entire year and the March to May (MAM) period. The period of snow accumulation captured by the sampling was characterized by a much higher occurrence of SSW surface winds than is typical.
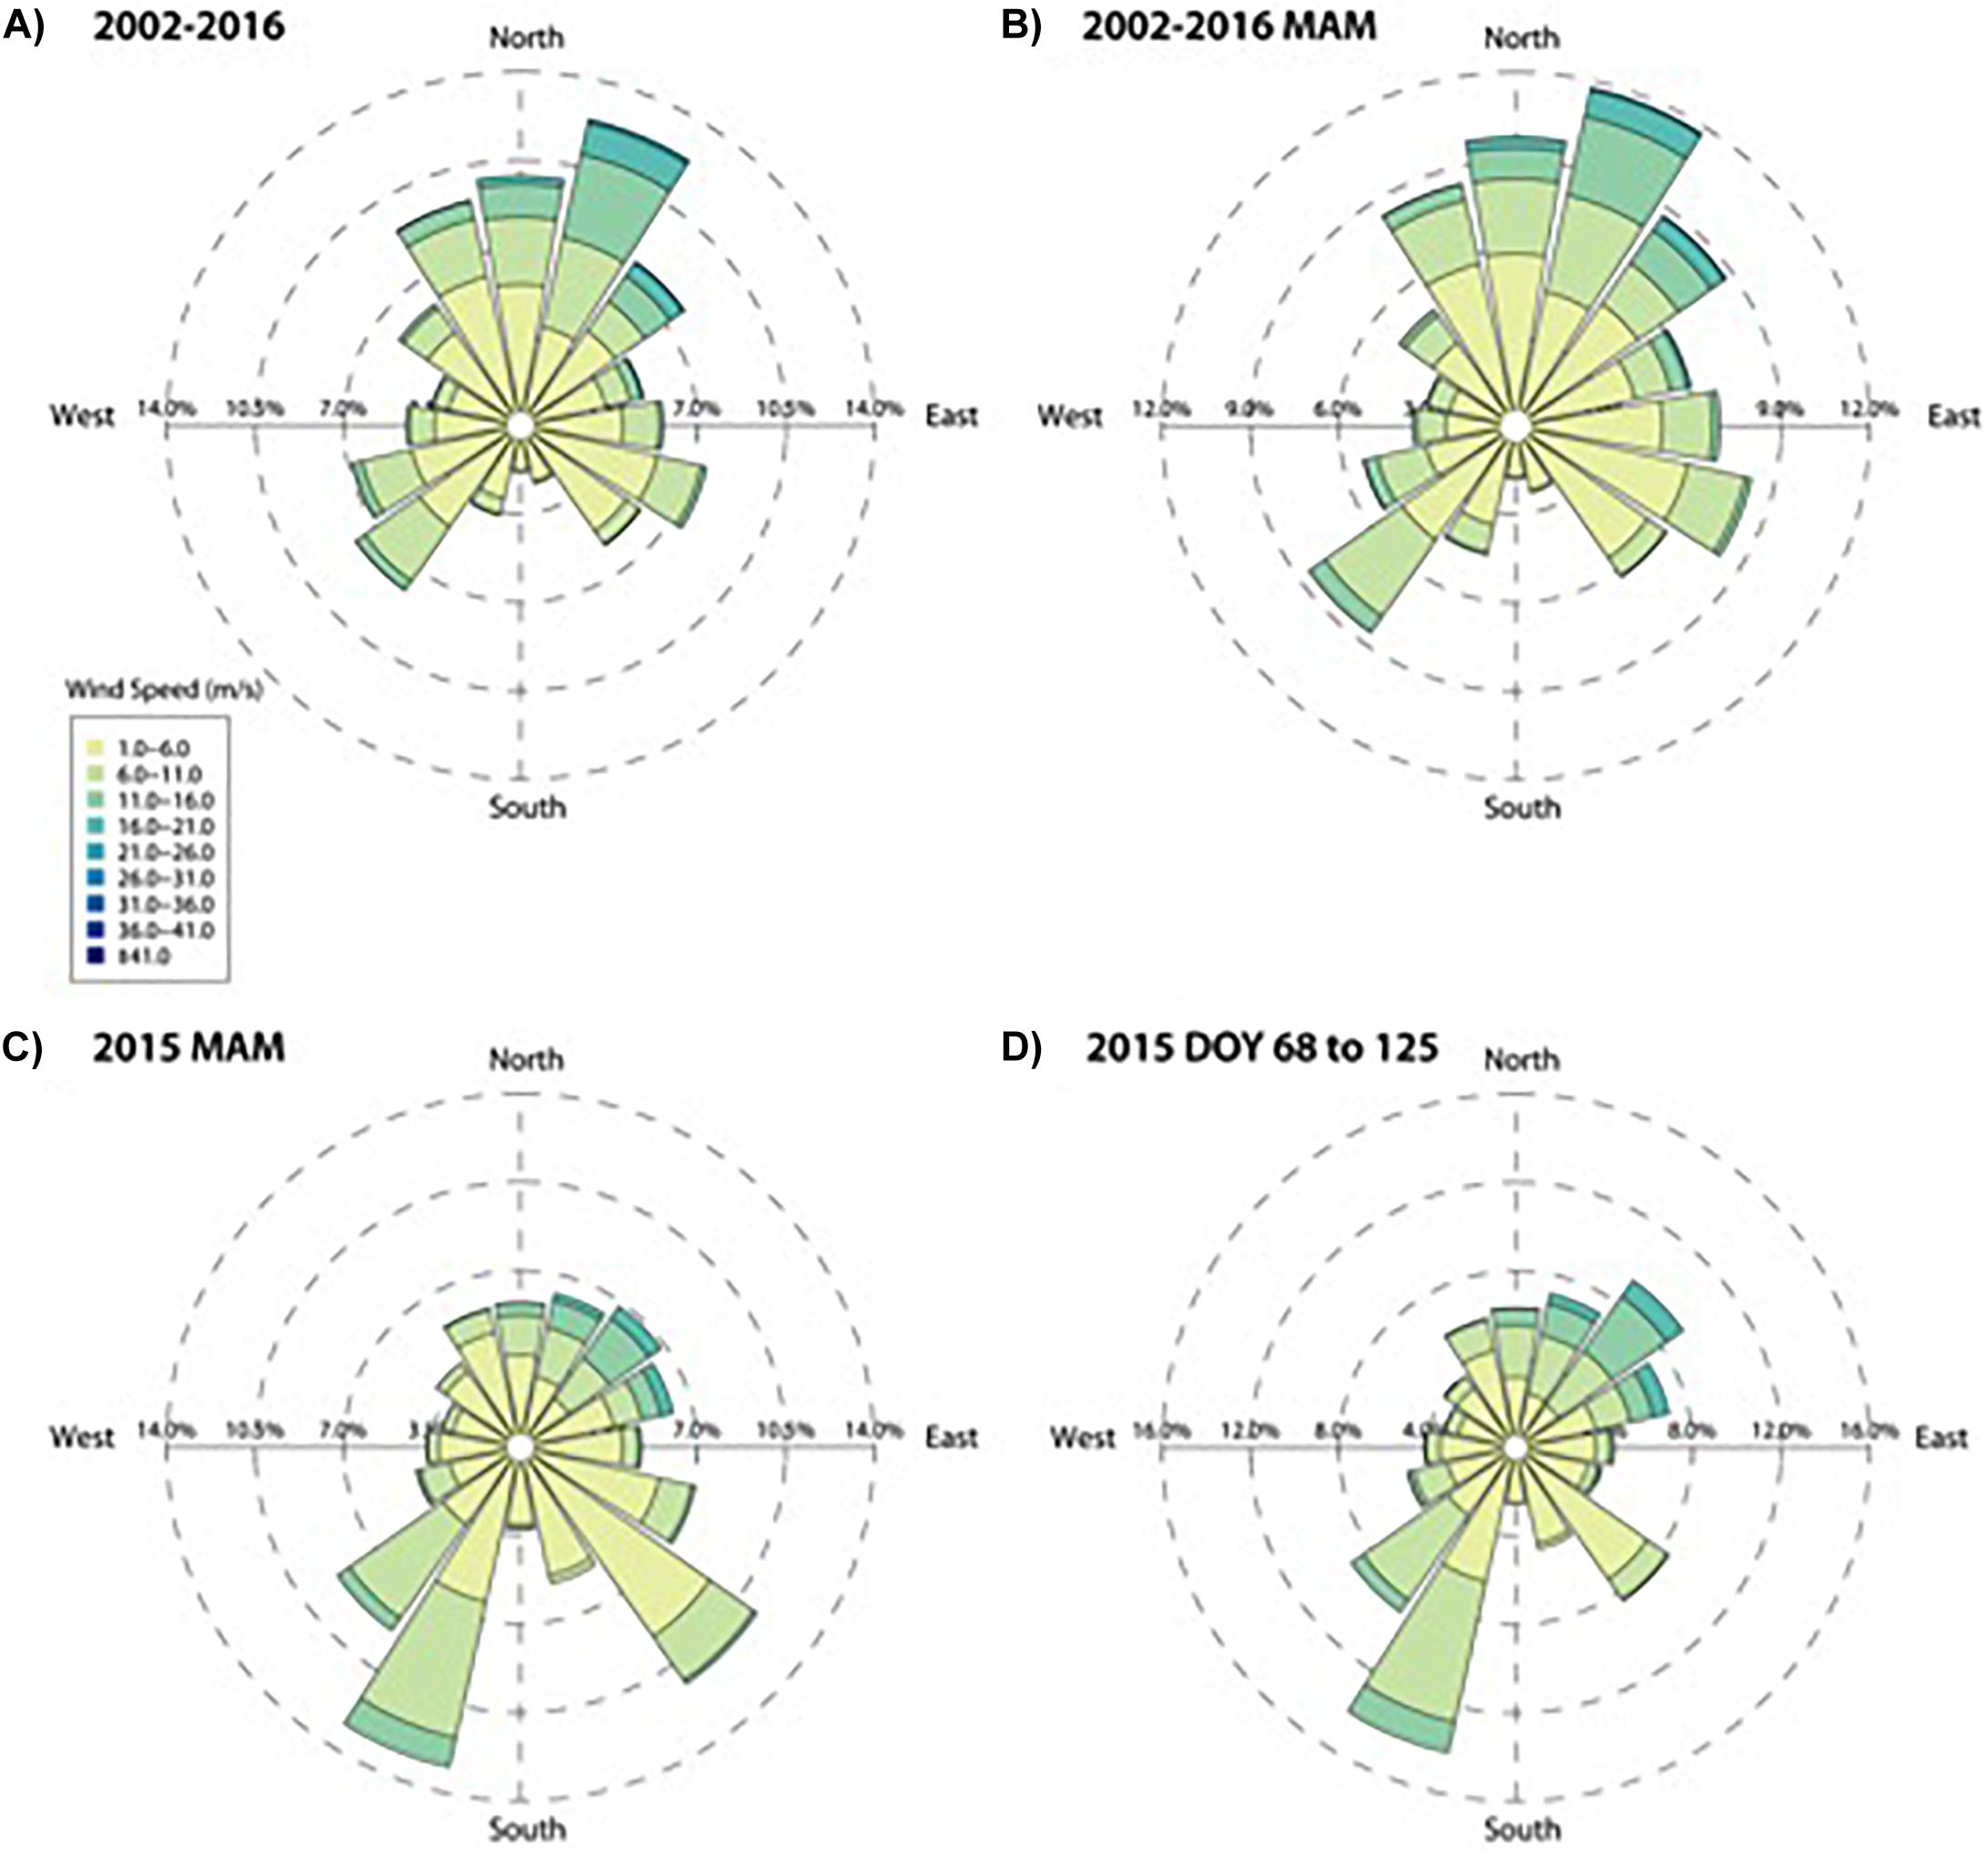
Figure 3. Four wind roses indicating the number of observations from a particular direction and wind speed. The data is from the Palmer Station Automated Weather Station and represent 10-min average wind speeds. (A) All observations inclusive from 1/1/2002 to 12/31/2016, (B) All March, April, and May (MAM) observations from 1/1/2002 to 12/31/2016, (C) All March, April, and May (MAM) observations for 2015 (when samples were collected), and (D) Observations from the beginning of snow (March 9) to sample date (May 5th), 2015.
NAAPS Model Results
According to the NAAPS analysis, a small amount of biomass burning smoke was transported southward from South America to Palmer Station on April 9, 2015 (Figure 4a) and on April, 28, 29, 2015 (Figure 4b). As evidenced by the NAAPS model plots, when there is southward wind blowing from South America, there is possible smoke transport to the Antarctic Peninsula (Figures 4a,b). Thus, it is possible that biomass burning smoke was deposited on the sampled snow layer. However, AOD time series of the study site for the whole year of 2015 (Figure 4c) show that the amount of smoke transported over the study period is smaller compared to the peak biomass season (September–October) transport. Palmer Station is located in the roaring circumpolar strong westerly wind belt; therefore sea salt is excluded in the time series plot, as it dominates the AOD signal.
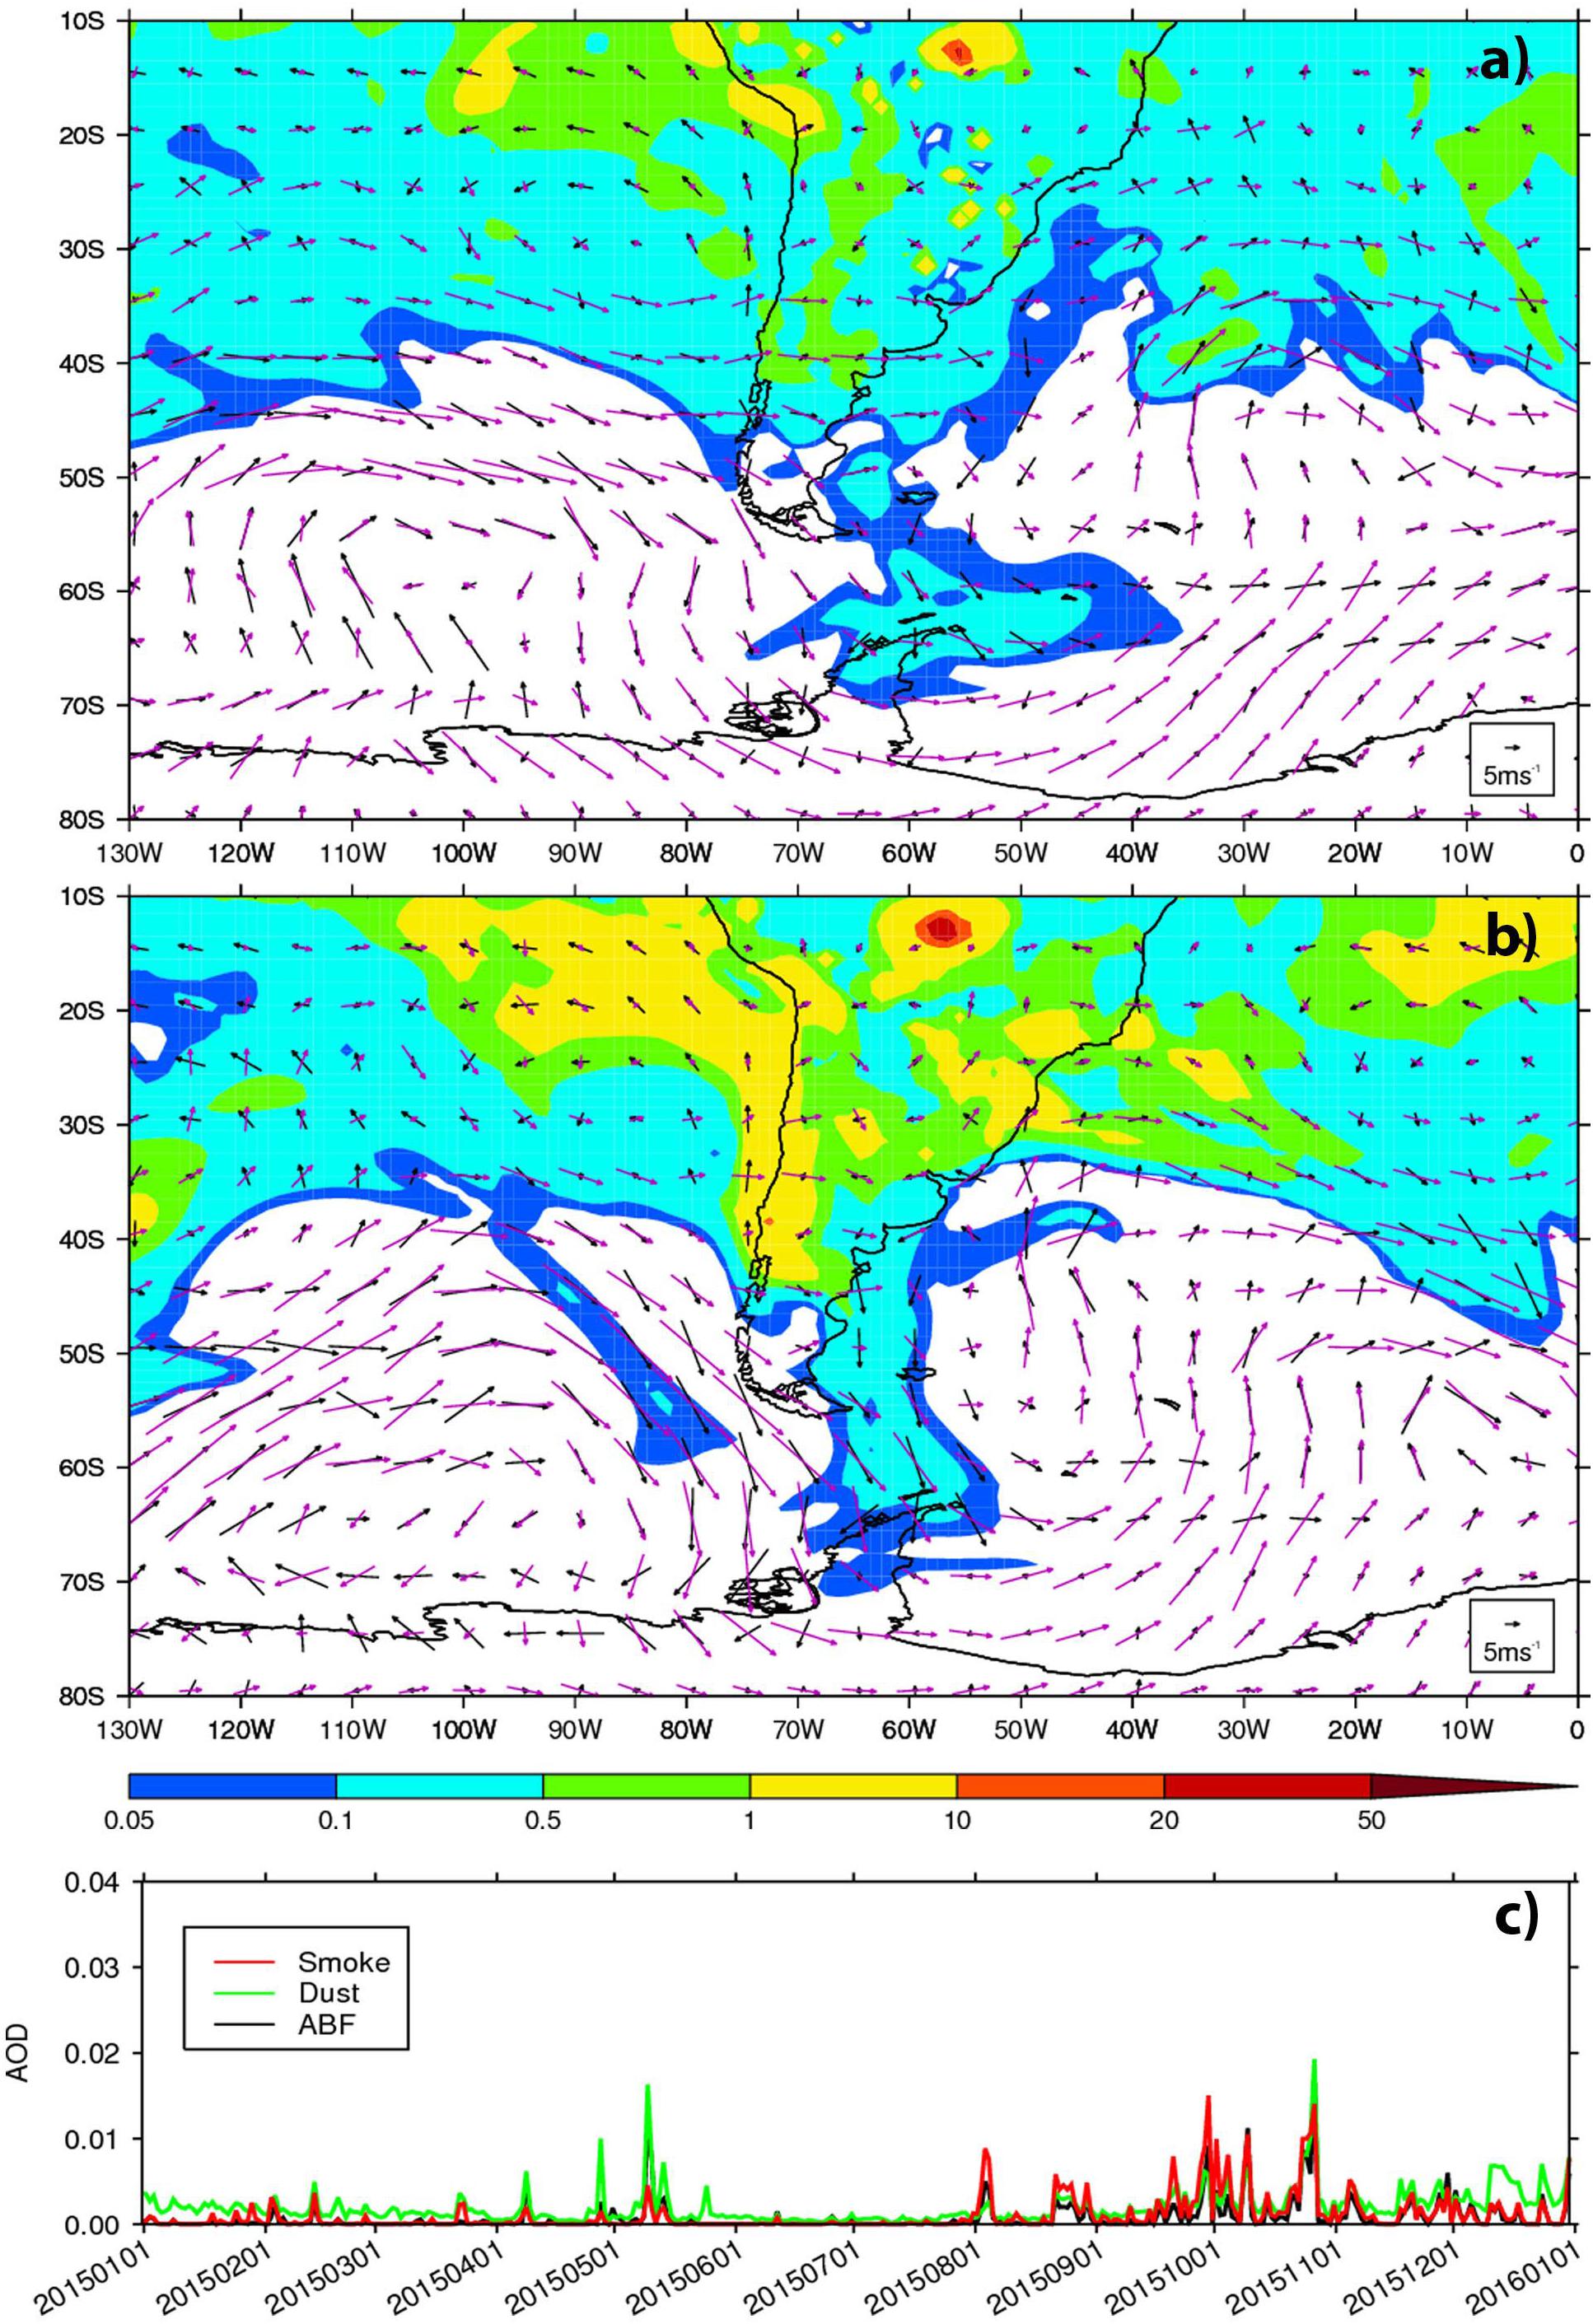
Figure 4. NAAPS surface concentration of biomass burning smoke (μg/m3), surface (black vector) and 700 hpa wind (magenta vector) at (a) 18Z April 9th (b) 18Z April 28th 2015. (c) Time series of NAAPS aerosol optical depths (AOD) from anthropogenic and biogenic fine (ABF), biomass-burning smoke and dust aerosols for Palmer Station over 2015.
Summary and Conclusion
These first observations of black carbon in seasonal snow on the Western Antarctic Peninsula show that rBC concentrations are similar to other pristine regions of the continent, including the MDV and the South Pole. This study provides a preliminary quantification of the Palmer Station “emissions or black carbon footprint” (Brooks et al., 2018). rBC concentrations in surface snow decrease with increasing distance from the Palmer Station. Elevated rBC concentrations near the station appear to show the station’s local impact extends at least 1 km, as similarly found downwind of the South Pole station (Warren and Wiscombe, 1980; Casey et al., 2017). NAAPS model results show that smoke from regional wildfires occurring on the South American continent may have transported biomass burning derived rBC to the study site prior to sample collection. However, the AOD smoke signal over the Austral fall, when the samples were collected, is smaller than the peak southern hemisphere wildfire season in the Austral spring. Although the NAAPS AOD signal is smaller over the snow sample collection period than in the Austral spring, the background rBC concentrations found near Palmer Station and on Biscoe Island are likely a mix of locally produced BC and regional transport of smoke from wildfires.
In the future, this dataset can be improved by expansion both temporally and spatially, along Anvers Island, as well as the entire Antarctic Peninsula. Additionally, samples in this study were collected from snow remaining after an abnormally high early-season snowfall, followed by rapid and nearly total snow melt. Collection of samples over the entire snow season and immediately after snowfall would be an improvement, as well as over a larger spatial range. This is one of a small number of studies to look at the spatial footprint of airborne pollution around scientific installations on the continent. It demonstrates that for a station with a population of 44 the spatial footprint is somewhat limited and beyond 1 km the concentrations the pristine snow concentrations of the Western Antarctic Peninsula are similar to other pristine regions of the continent.
Data Availability
All measurement data generated are included in the manuscript, but further questions can be directed to YWxpYS5raGFuQHd3dS5lZHU=.
Author Contributions
AK and AGK conceived of the study. AGK conducted the sampling. AK and JK conducted the refractory black carbon analysis. PX conducted the NAAPS analysis. All authors contributed to the development, data analysis, and writing on the manuscript.
Funding
Funding for this work came from DOD-ARMY-COE-Cold Region Research Award W913E5-16-C-0006. The authors appreciate the support of the University of Wisconsin-Madison Antarctic Meteorological Research Center for the data set, data display, and information, NSF grant number ANT-1535632. PX was supported by the Office of Naval Research Code 322.
Conflict of Interest Statement
The authors declare that the research was conducted in the absence of any commercial or financial relationships that could be construed as a potential conflict of interest.
References
Antarctic Meteorological Research Center [AMRC] (2018). Antarctic Meteorological Research Center at the University of Wisconsin (AMRC-UW). Available at: https://amrc.ssec.wisc.edu.
Aronson, R. (2015). Processed Ship-Based Navigation Data from the Southern Ocean Acquired During the Laurence M. Gould expedition LMG1502 (2015). Punta Arenas: Integrated Earth Data Applications (IEDA), doi: 10.1594/IEDA/321907
Bauer, S. E., Bausch, A., Nazarenko, L., Tsigaridis, K., Xu, B., Edwards, R., et al. (2013). Historical and future black carbon deposition on the three ice caps: ice core measurements and model simulations from 1850 to 2100. J. Geophys. Res. Atmos. 118, 7948–7961. doi: 10.1002/jgrd.50612
Bisiaux, M. M., Edwards, R., McConnell, J. R., Curran, M. A. J., Van Ommen, T. D., Smith, A. M., et al. (2011). Large scale changes in 20th century black carbon deposition to Antarctica. Atmos. Chem. Phys. 11, 27815–27831. doi: 10.5194/acpd-11-27815-2011
Bisiaux, M. M., Edwards, R., McConnell, J. R., Curran, M. A. J., Van Ommen, T. D., Smith, A. M., et al. (2012). Changes in black carbon deposition to Antarctica from two high-resolution ice core records, 1850-2000 AD. Atmos. Chem. Phys. 12, 4107–4115. doi: 10.5194/acp-12-4107-2012
Bond, T. C., Doherty, S. J., Fahey, D. W., Forster, P. M., Berntsen, T., DeAngelo, B. J., et al. (2013). Bounding the role of black carbon in the climate system: a scientific assessment. J. Geophys. Res. Atmos. 118, 5380–5552. doi: 10.1002/jgrd.50171
Brooks, S. T., Jabour, J., and Bergstrom, D. M. (2018). What is ‘ footprint ’ in Antarctica: proposing a set of definitions. Antarct. Sci. 30, 227–235. doi: 10.1017/S0954102018000172
Casey, K. A., Kaspari, S. D., Skiles, S. M., Kreutz, K., and Handley, M. J. (2017). The spectral and chemical measurement of pollutants on snow near South Pole, Antarctica. J. Geophys. Res. Atmos. 122, 6592–6610. doi: 10.1002/2016JD026418
Crutzen, P., and Andreae, M. O. (1990). Biomass burning in the tropics: impact on atmospheric chemistry and biogeochemical cycles. Science 250, 1669–1678. doi: 10.1126/science.250.4988.1669
Fanning, D. (2019). Last updated 2015, 03-27. Coyote Graphics Routines for cgwindrose.pro. Available at: http://www.idlcoyote.com/idldoc/cg/cgwindrose.html
Goldberg, E. D. (1985) Black Carbon in the Environment: Properties and Distribution. New York, NY: Wiley.
Holben, B. N., Eck, T. F., Slutsker, I., Tanré, D., Buis, J. P., Setzer, A., et al. (1998). AERONET — a federated instrument network and data archive for aerosol characterization. Remote Sens. Environ. 66, 1–16. doi: 10.1016/S0034-4257(98)00031-5
Hyer, E. J., Reid, J. S., and Zhang, J. (2011). An over-land aerosol optical depth data set for data assimilation by filtering, correction, and aggregation of MODIS Collection 5 optical depth retrievals. Atmos. Meas. Tech. 4, 379–408. doi: 10.5194/amt-4-379-2011
Katich, J. M., Perring, A. E., and Schwarz, J. P. (2017). Optimized detection of particulates from liquid samples in the aerosol phase: focus on black carbon. Aerosol Sci. Technol. 51, 543–553. doi: 10.1080/02786826.2017.1280597
Kennicutt II, M. C., Klein, A., Montagna, P., Sweet, S., Wade, T., Palmer, T., et al. (2010). Temporal and spatial patterns of anthropogenic disturbance at McMurdo Station, Antarctica. Environ. Res. Lett. 5:034010. doi: 10.1088/1748-9326/5/3/034010
Khan, A. L., Jaffé, R., Ding, Y., and McKnight, D. M. (2016). Dissolved black carbon in Antarctic lakes: chemical signatures of past and present sources. Geophys. Res. Lett. 43, 5750–5757. doi: 10.1002/2016GL068609
Khan, A. L., McMeeking, G. R., Schwarz, J. P., Xian, P., Welch, K. A., Berry Lyons, W., et al. (2018). Near-surface refractory black carbon observations in the atmosphere and snow in the mcmurdo dry valleys, antarctica, and potential impacts of foehn winds. J. Geophys. Res. Atmos. 123, 2877–2887. doi: 10.1002/2017JD027696
Khan, A. L., Wagner, S., Jaffe, R., Xian, P., Williams, M., Armstrong, R., et al. (2017). Dissolved black carbon in the global cryosphere: concentrations and chemical signatures. Geophys. Res. Lett. 44, 6226–6234. doi: 10.1002/2017GL073485
Klein, A. G., Sweet, S. T., Kennicutt II, M. C., Wade, T. L., Palmer, T. A., and Montagna, P. (2014). “Long-term monitoring of human impacts to the terrestrial environment at McMurdo Station,” in Antarctic Futures, eds T. Tin, D. Liggett, P. Maher, and M. Lamers (Dordrecht: Springer), 213–227.
Lim, S., Faïn, X., Zanatta, M., Cozic, J., Jaffrezo, J. L., Ginot, P., et al. (2014). Refractory black carbon mass concentrations in snow and ice: method evaluation and inter-comparison with elemental carbon measurement. Atmos. Meas. Tech. 7, 3549–3589. doi: 10.5194/amtd-7-3549-2014
Long Term Ecological Research Network-Network Data Portal [LTER-NDP] (2017). Published 2017-04-17. 2-minute PALMOS Automatic Weather Station Meteorological Measurements (precipitation, radiation, cloud base, temperature, etc.) From Palmer Station Antarctica, 2001 - March 2017. Available at: https://portal.lternet.edu/nis/mapbrowse?packageid=knb-lter-pal.214.3.
Lynch, P., Reid, J. S., Westphal, D. L., Zhang, J., Hogan, T. F., Hyer, E. J., et al. (2016). An 11-year global gridded aerosol optical thickness reanalysis ( v1. 0 ) for atmospheric and climate sciences. Geosci. Model Dev. 9, 1489–1522. doi: 10.5194/gmd-9-1489-2016
Lyons, W. B., Nezat, C. A., Welch, K. A., Kottmeier, S. T., and Doran, P. T. (2000). Fossil fuel burning in taylor valley, southern victoria land, antarctica: estimating the role of scientific activities on carbon and nitrogen reservoirs and fluxes. Environ. Sci. Technol. 34, 1659–1662. doi: 10.1021/es990794l
Mori, T., Moteki, N., Ohata, S., Koike, M., Goto-Azuma, K., Miyazaki, Y., et al. (2016). Improved technique for measuring the size distribution of black carbon particles in liquid water. Aerosol Sci. Technol. 50, 242–254. doi: 10.1080/02786826.2016.1147644
O’Brien, K. (2015). Processed ship-based Navigation Data from the Antarctic Peninsula acquired during the Laurence M. Gould expedition LMG1504 (2015). Interdiscip. Earth Data Appl. doi: 10.1594/IEDA/321941
Petzold, A., Ogren, J. A., Fiebig, M., Laj, P., Li, S.-M., Baltens-perger, U., et al. (2013). Recommendations for reporting “Black Carbon” measurements. Atmos. Chem. Phys. 13, 8365–8379. doi: 10.5194/acp-13-8365-2013
Reid, J. S., Hyer, E. J., Winkler Prins, E. A., Westphal, D. L., Zhang, J., Christopher, S. F., et al. (2009). Global monitoring and forecasting of biomass-burning smoke: description of and lessons from the fire locating and modeling of burning emissions ( FLAMBE ) program. IEEE J. Sel. Top. Appl. Earth Obs. Rem. Sens. 2, 144–162. doi: 10.1109/JSTARS.2009.2027443
RSA Engineering (2011). Palmer Station Major Systems Studies. Anchorage, AK: Prepared for National Science Foundation by RSA Engineering Inc., 53. Available at: https://www.usap.gov/USAPgov/conferencesCommitteesAndWorkshops/userCommittees/documents/Palmer%20Major%20Systems%20Study122910.pdf
Schwarz, J. P., Doherty, S. J., Li, F., Ruggiero, S. T., Tanner, C. E., Perring, A. E., et al. (2012). Assessing recent measurement techniques for quantifying black carbon concentration in snow. Atmos. Meas. Tech. 5, 3771–3795. doi: 10.5194/amtd-5-3771-2012
Shi, Y., Zhang, J., Reid, J. S., Liu, B., and Hyer, E. J. (2014). Critical evaluation of cloud contamination in the MISR aerosol products using MODIS cloud mask products. Atmos. Meas. Tech. 7, 1791–1801. doi: 10.5194/amt-7-1791-2014
Stokke, O. S., and Vidas, D. (eds). (1998). Governing the Antarctic: The Effectiveness and Legitimacy of the Antarctic Treaty System. Cambridge: Cambridge University Press.
Tin, T., Fleming, Z. L., Hughes, K. A., Ainley, D. G., Convey, P., Moreno, C. A., et al. (2009). Impacts of local human activities on the Antarctic environment. Antarct. Sci. 21, 3–33. doi: 10.1017/S0954102009001722
United States Antarctic Program[USAP] (2018). Last update 2018, December 18. RV LAURENCE M. GOULD Cruise History. Available at: https://www.usap.gov/USAPgov/vesselScienceAndOperations/documents/lmg_history.pdf
Warren, S. G., and Clarke, A. D. (1990). Soot in the atmosphere and snow surface of Antarctica. J. Geophys. Res. 95, 1811–1816. doi: 10.1029/JD095iD02p01811
Warren, S. G., and Wiscombe, W. J. (1980). A model for the spectral albedo of snow. II: snow containing atmospheric aerosols. J. Atmos. Sci. 37, 2734–2745. doi: 10.1175/1520-0469 (1980)037<2734:AMFTSA>2.0.CO;2
Watts, A. (1992). International Law and the Antarctic Treaty System. Cambridge: Sir Arthur Watts Grotius Publications Ltd, 480.
Wendl, I. A., Menking, J. A., Färber, R., Gysel, M., Kaspari, S. D., Laborde, M. J. G., et al. (2014). Optimized method for black carbon analysis in ice and snow using the single particle soot photometer. Atmos. Meas. Tech. 7, 3075–3111. doi: 10.5194/amtd-7-3075-2014
Xu, B., Cao, J., Hansen, J., Yao, T., Joswia, D. R., Wang, N., et al. (2009). Black soot and the survival of Tibetan glaciers. Proc. Natl. Acad. Sci. U.S.A. 106, 22114–22118. doi: 10.1073/pnas.0910444106
Keywords: black carbon, snow, Antarctica, local impact, wildfires and biomass burning, fossil fuel emissions
Citation: Khan AL, Klein AG, Katich JM and Xian P (2019) Local Emissions and Regional Wildfires Influence Refractory Black Carbon Observations Near Palmer Station, Antarctica. Front. Earth Sci. 7:49. doi: 10.3389/feart.2019.00049
Received: 31 August 2018; Accepted: 28 February 2019;
Published: 02 April 2019.
Edited by:
Outi Meinander, Finnish Meteorological Institute, FinlandReviewed by:
Henrique De Melo Jorge Barbosa, University of São Paulo, BrazilPaulina Wong, Lingnan University, China
Copyright © 2019 Khan, Klein, Katich and Xian. This is an open-access article distributed under the terms of the Creative Commons Attribution License (CC BY). The use, distribution or reproduction in other forums is permitted, provided the original author(s) and the copyright owner(s) are credited and that the original publication in this journal is cited, in accordance with accepted academic practice. No use, distribution or reproduction is permitted which does not comply with these terms.
*Correspondence: Alia L. Khan, YWxpYS5raGFuQHd3dS5lZHU=