 Miye Nakashima
 Pavla Dagsson-Waldhauserová
- 1Department of Atmospheric and Oceanic Sciences, University of California, Los Angeles, Los Angeles, CA, United States
- 2Agricultural University of Iceland, Hvanneyri, Iceland
- 3Faculty of Environmental Sciences, Czech University of Life Sciences Prague, Prague, Czechia
High latitude dust is an important contributor to the global dust cycle, which affects the radiative balance of the atmosphere. The frequency and severity of dust events are driven by variables such as wind speed, precipitation, temperature, surface cover type, and volcanic activity. The extent of impact of glacial retreat is yet to be determined, but glacial outburst floods, known as jökulhlaups, have been suggested to be a significant factor in the seasonal pattern of dust activity, with major jökulhlaups being attributed as a cause for an increase in dust activity in their subsequent year. However, in examination of ten meteorological stations from 1950 to 2009, there does not appear to be sufficient evidence that jökulhlaups are a significant driver of Iceland’s dust activity. Additionally, taking into account a larger range of dust codes, contributions from Icelandic dust plumes are found to be greater than previously assumed, with an average of 128 dust days per year as compared to a previously determined average of 34 dust days annually.
Introduction
High latitude regions such as Iceland, Greenland, Canada, Patagonia, and New Zealand have been acknowledged as sizeable contributors to the global dust cycle (Prospero et al., 2012; Bullard, 2013; Bullard et al., 2016). Unlike dry mid-latitude regions such as the Sahara and Gobi Deserts, some high latitudes regions may be exposed to high levels of precipitation, humidity, and vegetation. Iceland, in particular, has low vegetation and high wind speeds, which enhance active dust transport, in spite of relatively high annual precipitation and seasonal snow cover. Additionally, the presence of volcanoes and glaciers contribute to the creation of several types of barren, sandy landscapes, including sandurs (glacial outwash plains), which serve as major dust plume sources (Arnalds, 2010).
The potential impacts of glacial activity on dust emissions occur through two main events: glacial retreat and jökulhlaups. The process of glacial retreat contributes sediment supply by reworking flood paths (Maizels, 1997) and through the process of glacier basal sliding abrasions, which is especially effective during the melting of warm-based glaciers like those of Iceland (Bullard, 2013). The correlation between glacier meltwater discharge rates and sediment concentration flux is not linear, and is therefore difficult to predict (Bullard, 2013). Jökulhlaups are glacial outburst floods and consist of two main types: subglacial and proglacial (Björnsson, 1992). Subglacial jökulhlaups are due to a breach in lakes that formed under glaciers through geothermal heating, and can be triggered periodically as a result of gradual melting over time, or by sudden volcanic or seismic activity (Björnsson, 2002). Proglacial jökulhlaups are the result of the overflow of proglacial lakes, which are created from glacial melt runoff which collects along the margins of the glacier extent. Both types of jökulhlaups carry sediment to sandur, where it can then be entrained into the atmosphere. It has been speculated that summer temperatures increase jökulhlaup activity and is responsible for the seasonal increase of dust activity, and additionally that major jökulhlaups may be responsible for sizeable increases of dust activity in their subsequent year (Prospero et al., 2012).
The main objectives of this study are to investigate whether changes in the frequency of dust activity can be attributed to glacial activity, and to reassess whether dust activity in Iceland is comparable to that in mid-latitude deserts. As no published official record of minor jökulhlaup activity is available, this study does not aim to prove or disprove the direct impact of minor jökulhlaups on dust activity, but rather aims to draw to attention other variables such as temperature, wind speed, and precipitation, which may hold more significant influence over dust activity. This study further investigates the impact of jökulhlaups by placing three major jökulhlaups (1955, 1996, 1999) in the context of long-term dust activity fluctuations.
Materials and Methods
Synoptic observations were taken from meteorological stations run by the Icelandic Meteorological Office over the years of 1950–2009 from a total of ten different stations across Iceland as seen in Figure 1, grouped into three regions:
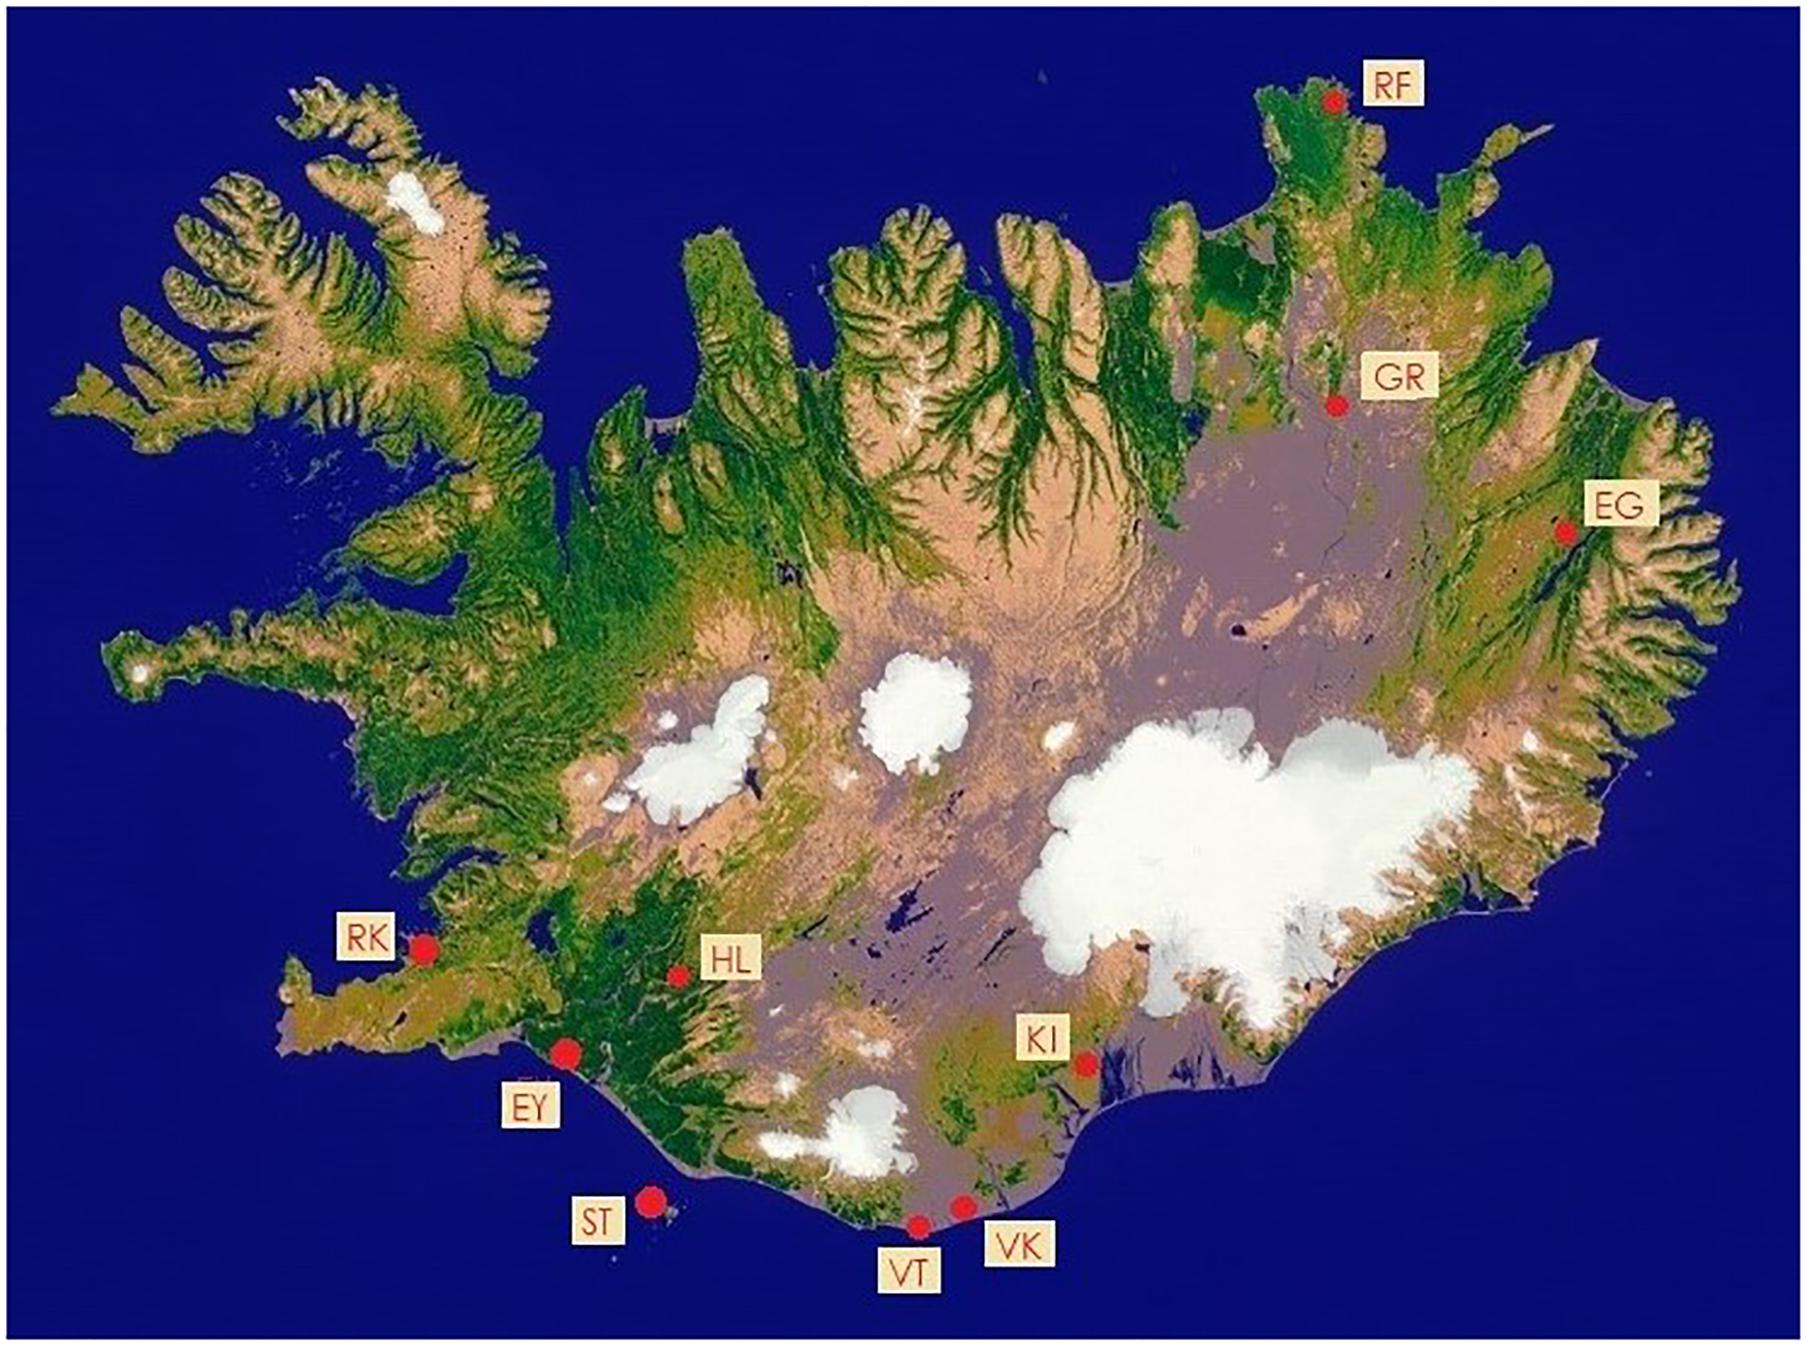
Figure 1. Vegetation map of Iceland. Source: Based on data from National Land Survey of Iceland (http://www.lmi.is/en/okeypis-kort/).*Station locations added: Grímsstaðir (GR), Raufarhöfn (RF), Egilsstaðir (EG), Reykjavik (RK), Eyrarbakki (EY), Hæll (HL), Stórhöfði (ST), Vatnsskarðshólar (VT), Vík í Mýrdal (VK), Kirkjubæjarklaustur (KI).
(1) Northeast (NE): Grímsstaðir, Raufarhöfn, Egilsstaðir;
(2) Southwest (SW): Reykjavik, Eyrarbakki, Hæll;
(3) South: Stórhöfði, Vatnsskarðshólar, Vík í Mýrdal, Kirkjubæjarklaustur.
Note that Raufarhöfn, Reykjavik, Eyrarbakki, Vatnsskarðshólar, Vík í Mýrdal, and Stórhöfði are situated close to the shoreline, while Grímsstaðir, Egilsstaðir, Hæll, and Kirkjubæjarklaustur are located further inland.
At all stations, synoptic dust observations were made every day of the year, 3–8 times a day. Many stations stopped reporting the present weather observations after the year 2009. A dust day is considered to be any day during which at least one observation of dust activity is observed, using synoptic dust codes as defined in the World Meteorological Organization Report (WMO, 2009). SYNOP codes of the present weather used in this study are 6 (dust in suspension, not raised by wind at or near the station at the time of observation), 7 (blowing dust raised by wind at time of observation, without the development of whirls or storms), 8 (developed dust whirls, but no storm), 9 (dust storm within sight within the past hour of observation), 30–32 (slight or moderate dust or sand storms), 33–35 (severe dust or sand storms), and additionally codes 4–5, which are used for the visibility reduced by volcanic ash resuspension and dust haze in Iceland. Codes 4–6 were omitted from the dust frequency studies published by Dagsson-Waldhauserová et al. (2013, 2014).
Average monthly temperature, wind speed, and precipitation were gathered from each of the stations via the Icelandic Meteorological Office1. Volcanic eruption records from 1950 to 2009 were taken from the Smithsonian Institution Global Volcanism Program2. These include the non-glacial volcanic activity in the Northeast (Askja and Krafla) and South (Hekla and Vestmannaeyjar’s Eldfell and Surtsey), as well as subglacial activity for Vatnajökull (Grímsvötn) and Mýrdalsjökull (Katla). Sandur and dust plume locations, as seen in Figure 2, were acquired from Arnalds (2010) by using Landsat and Moderate Resolution Imaging Spectroradiometer (MODIS).
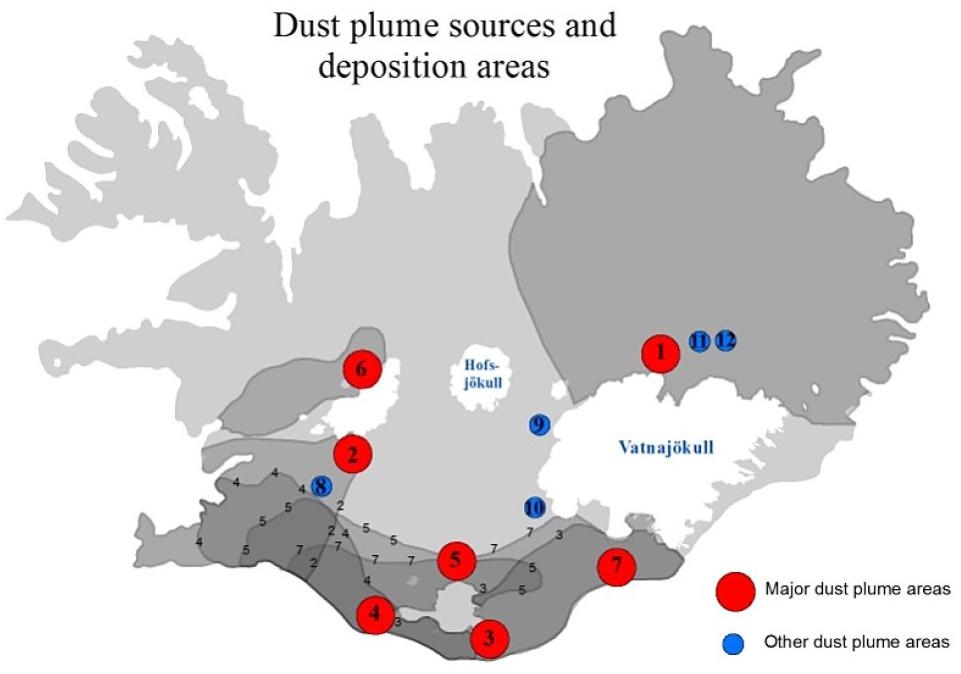
Figure 2. Major dust plume sources and estimated regions of deposition (Arnalds, 2010): (1) Dyngjusandur, (2) Hagavatn, (3) Mýrdalssandur, (4) Landeyjasandur, (5) Mælifellssandur, (6) Flosaskarð, (7) Skeiðarársandur.
Results
Meteorological Observations at Each Station
Figure 3 takes an average of the temperature, precipitation, and wind speed at each station for each month over the 60 year period. It shows that the general annual trends in temperature follow the same pattern at all stations, with the Northeast colder than the Southwest, and the Southwest colder than the South, though with Kirkjubæjarklaustur temperatures more in line with Southwestern stations than Southern ones. A line is drawn at 5°C, above which the months will be referred to as “warm season” and below which will be “cold season.” Months falling between 5 ± 0.7°C will be considered “transitional,” sometimes acting as a warm season month while other times acting as a cold season month.
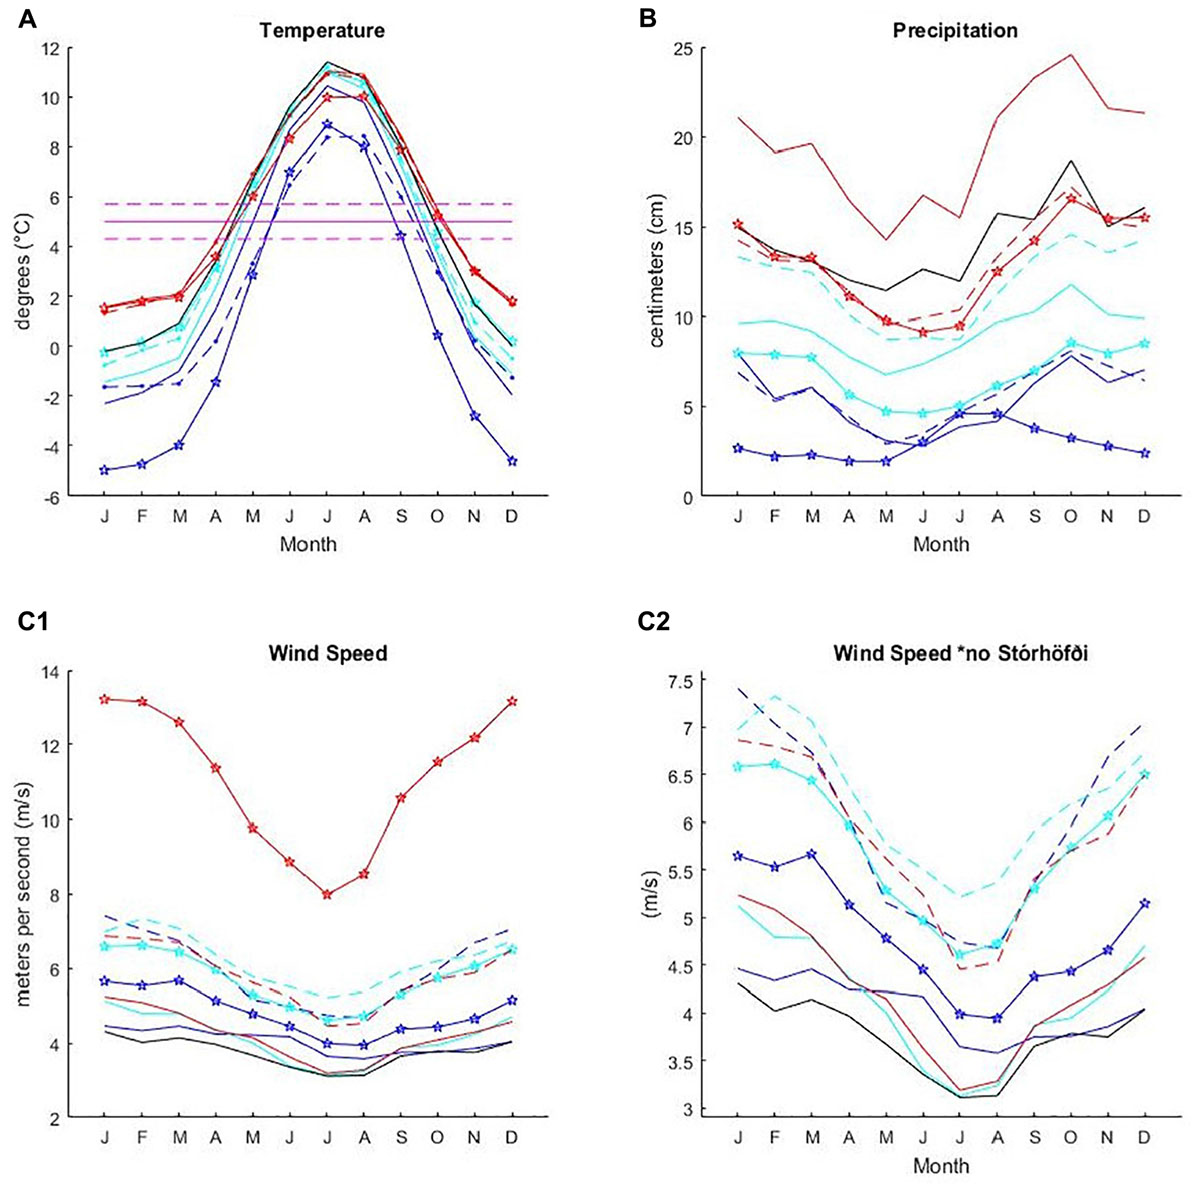
Figure 3. Sixty year average (A) Temperature (°C), (B) Precipitation (cm), and (C1) Wind speed (m/s) at each station for each month. (C2) provides a closer look at station wind speed disparities without Stórhöfði. Grímsstaðir (blue  ), Raufarhöfn (blue - - -), Egilsstaðir (blue –), Reykjavik (cyan ), Eyrarbakki (cyan - - -), Hæll (cyan –), Stórhöfði (red ), Vatnsskarðshólar (red - - -), Vík í Mýrdal (red –), Kirkjubæjarklaustur (black –).
Like temperature, precipitation ranges are distinguishable by region, though here, Kirkjubæjarklaustur aligns with the Southern stations instead of the Southwestern ones. Vík í Mýrdal precipitation records also far exceed the other stations. Grímsstaðir is the only station with warm season precipitation rising over cold season precipitation. Note that these precipitation records do not distinguish between types, such as rain or snow. No consistent, long-term record of snowfall exists for this time period.
Unlike temperature and precipitation, wind speed does not segregate by region, but rather by proximity to the coast or mountains. Coastal stations Raufarhöfn, Reykjavik, Eyrarbakki, and Vatnsskarðshólar tend to group together with a trend of higher wind speeds, while inland stations of Egilsstaðir, Hæll, and Kirkjubæjarklaustur group together with lower wind speeds. Grímsstaðir, despite also being an inland station, has moderate wind speeds, while Vík í Mýrdal, another coastal station, has wind speeds that are more similar to the inland stations, likely due to its location being sheltered by surrounding mountain terrain. Stórhöfði, the only separate island station, stands as an outlier, with its average wind speed exceeding the other stations’ maximums.
Dust Day Frequency at Each Station
Figure 4 shows the average number of dust days per month over the 60 year period at each station, with the final plot showing the average for the whole of Iceland. Each station peaks in dust day frequency (DDF) at the beginning of the warm season. Overall, dust activity is greatest in the summer, May through July, and lowest in the winter, December and January. Shown in Figure 5, Stórhöfði leads in average number of dust days per year with over 40, while also leading in wind speed at around 11 m/s, which is about 5 m/s above the next highest wind speed. Vík í Mýrdal, with the greatest amount of precipitation averaging at almost 20 cm/year, is among the three lowest DDFs, next to Raufarhöfn and Hæll.
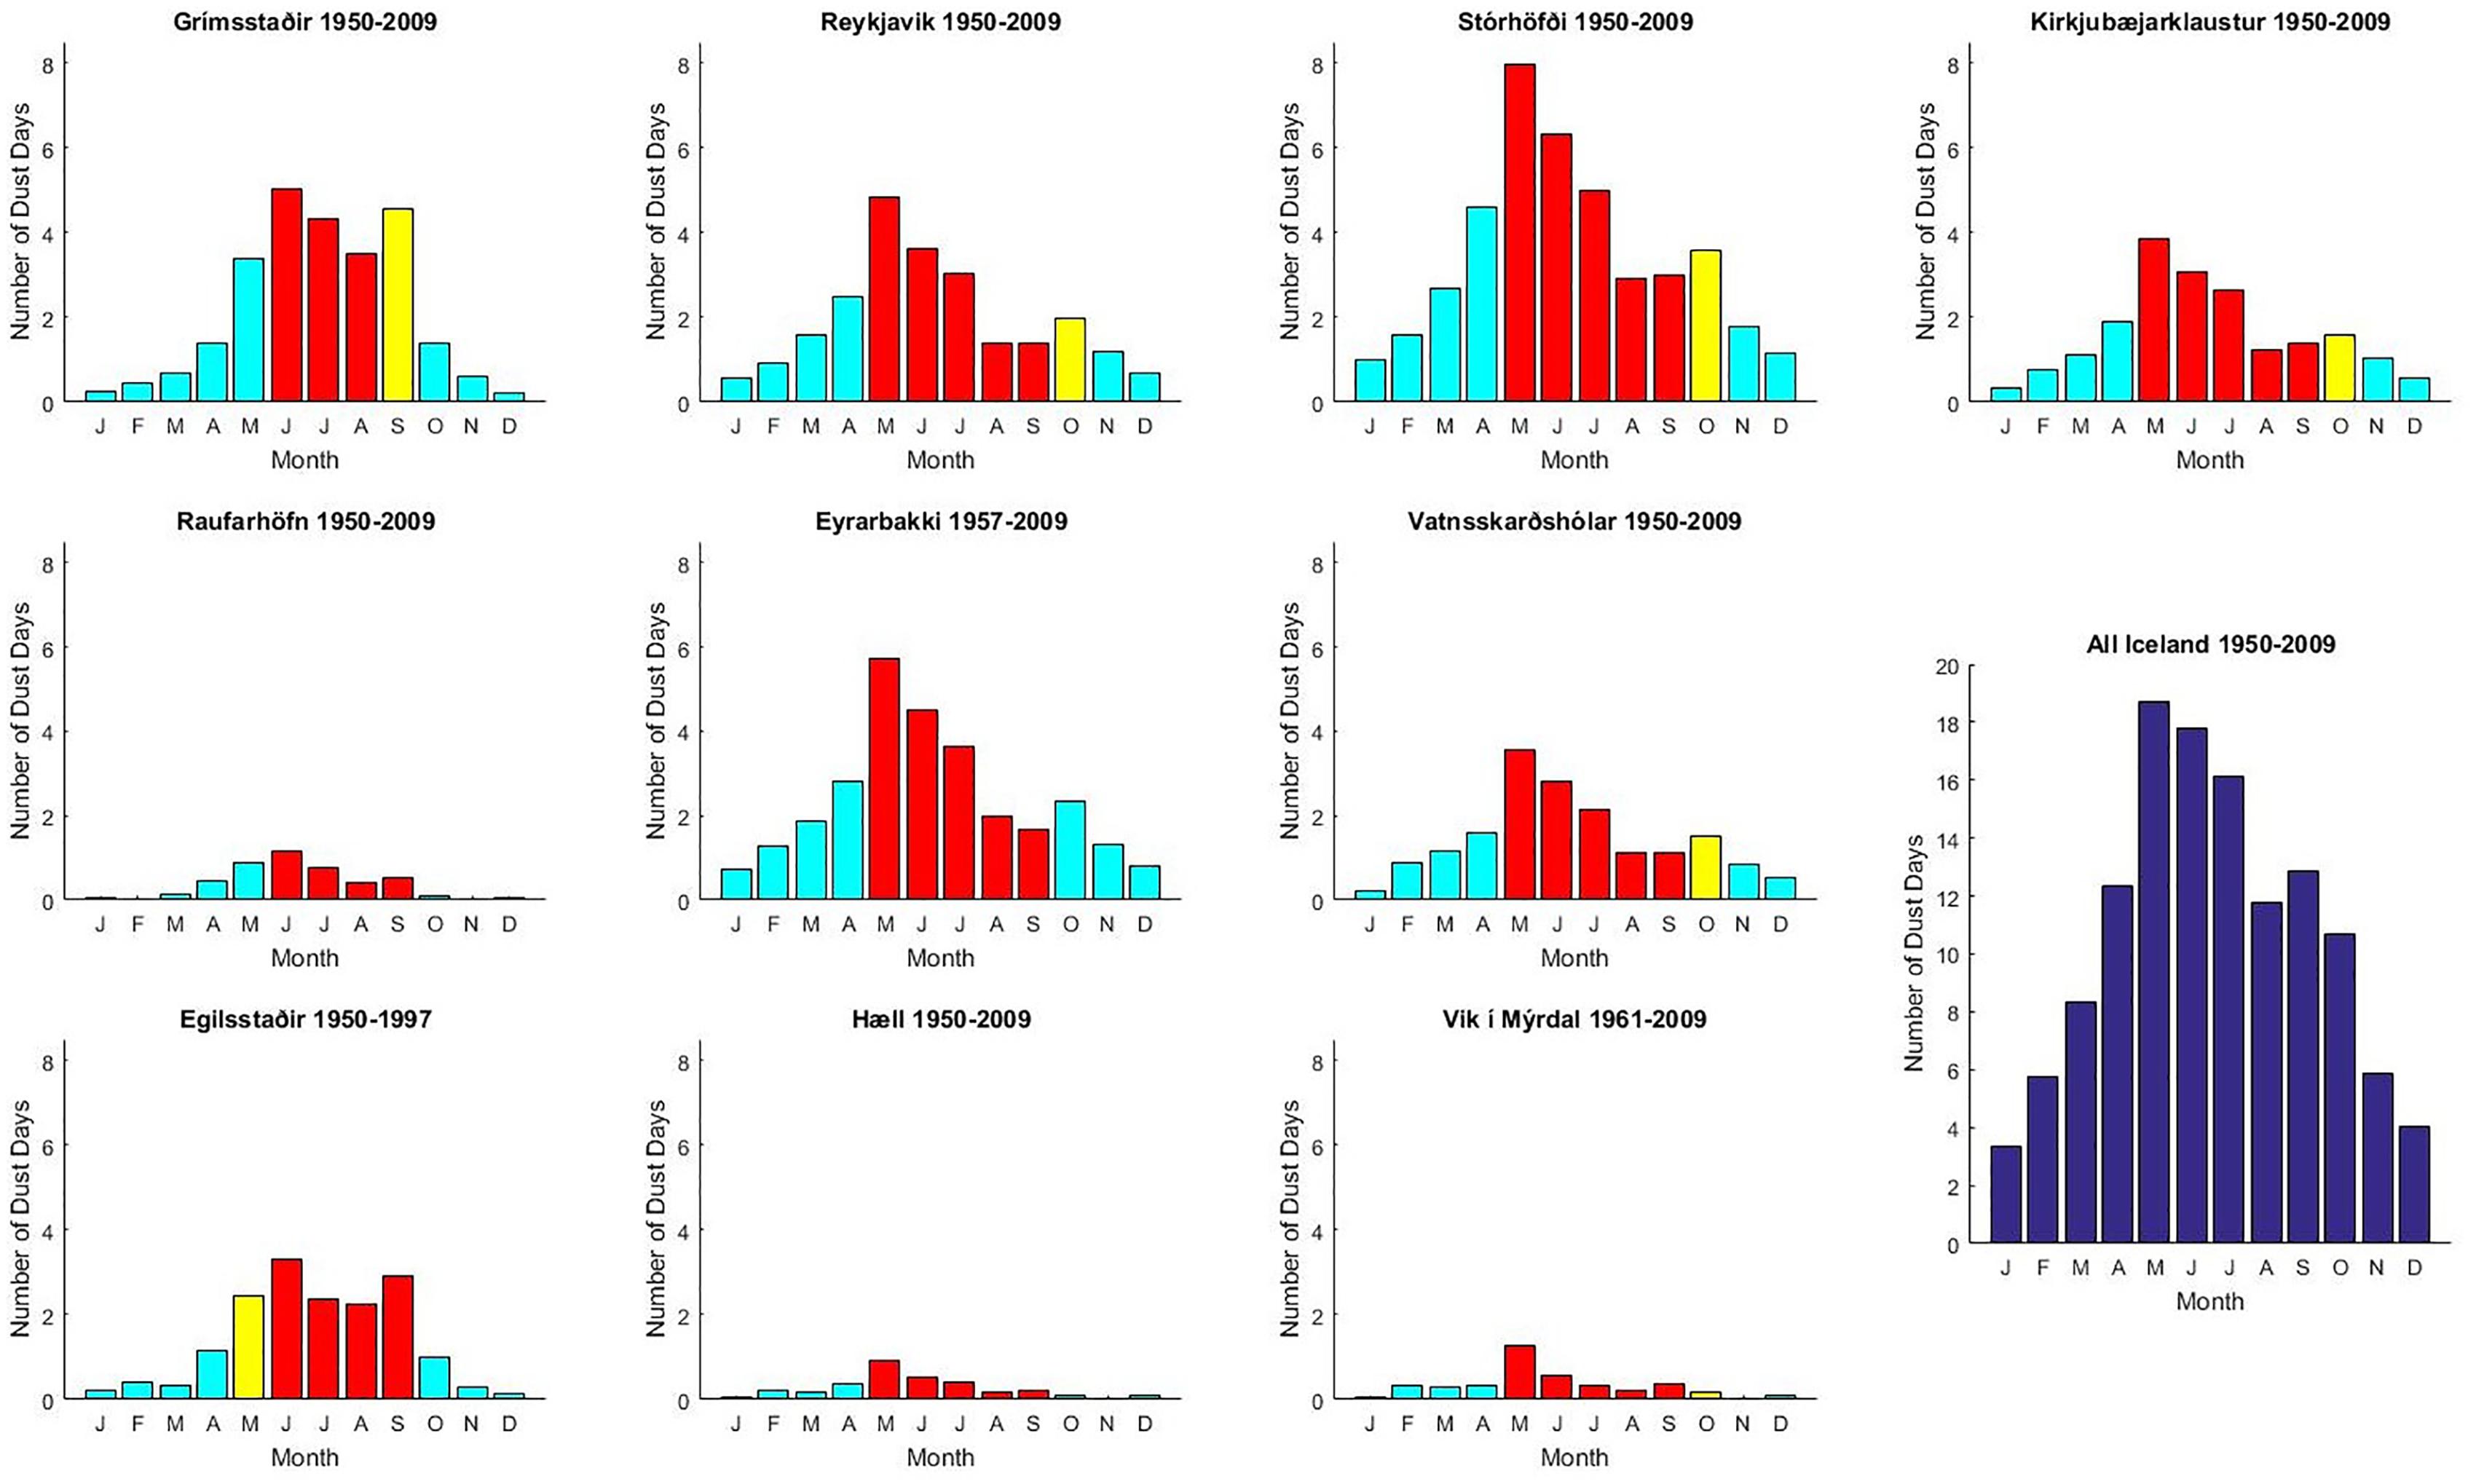
Figure 4. Average number of dust days per year, with cold season (cyan), warm season (red), and transitional (yellow). NE stations in the first column, SW stations in the second column, and South stations in the third and fourth column. The bottom-right graph depicts the average number of dust days per year for all of Iceland.
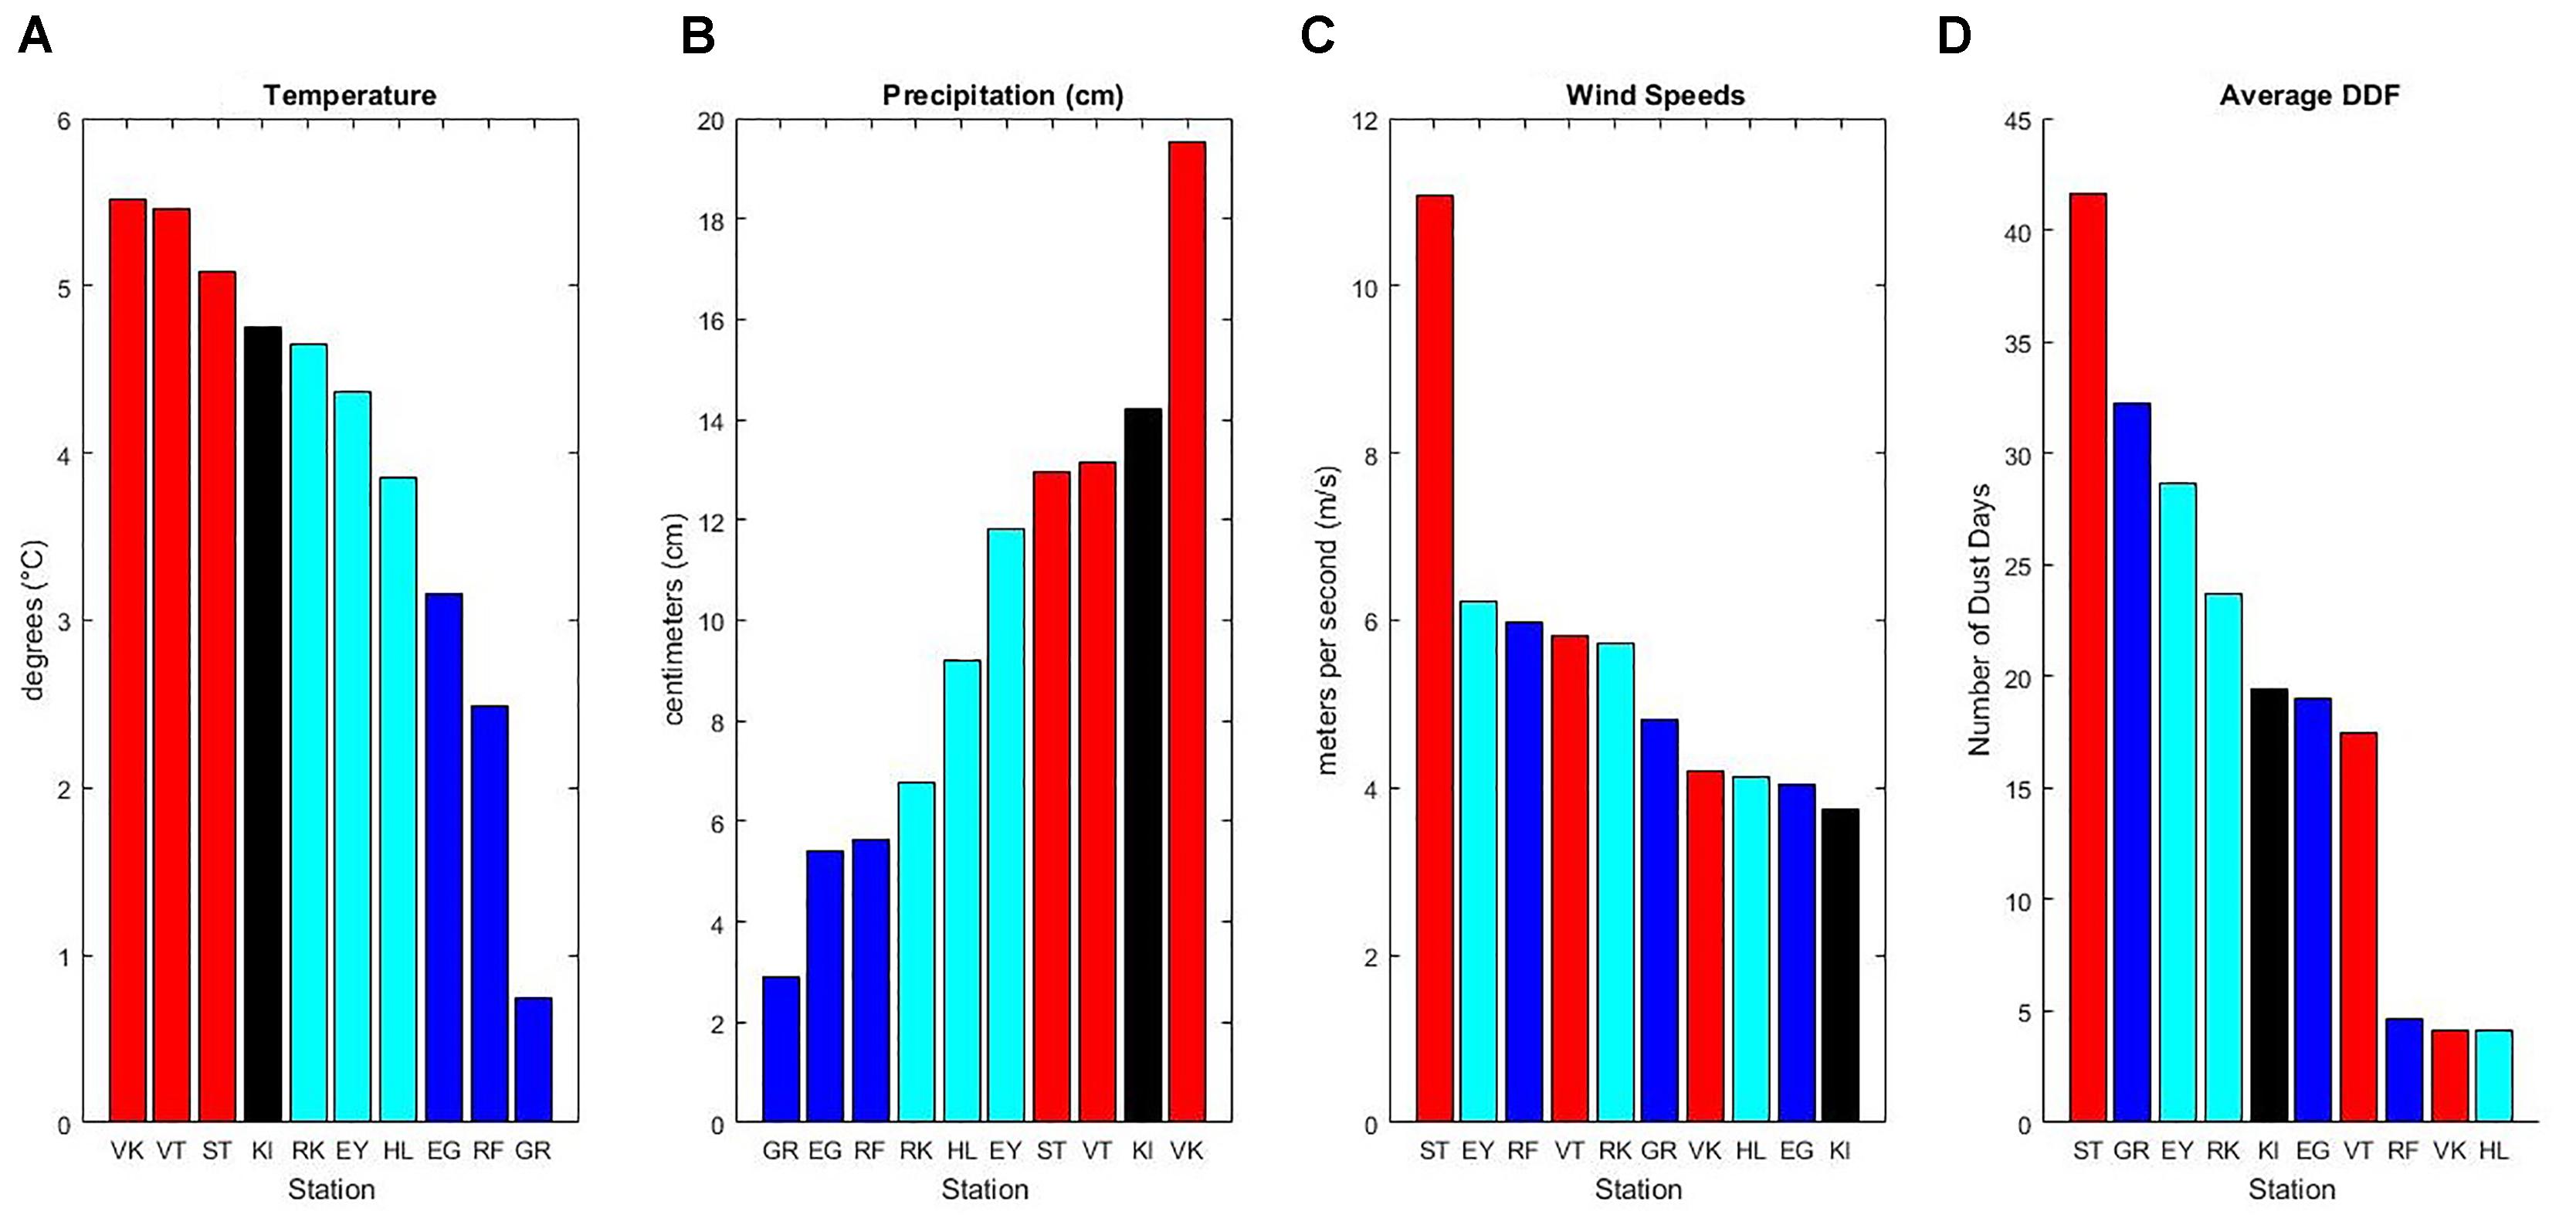
Figure 5. Average annual (A) Temperature, (B) Precipitation, and (C) Wind Speed over 60 year period. (D) Average number of dust days per year at each station: Grímsstaðir (GR), Raufarhöfn (RF), Egilsstaðir (EG), Reykjavik (RK), Eyrarbakki (EY), Hæll (HL), Stórhöfði (ST), Vatnsskarðshólar (VT), Vík í Mýrdal (VK), Kirkjubæjarklaustur (KI). NE stations in blue, SW stations in cyan, and South stations in red, with Kirkjubæjarklaustur black.
Figure 6 depicts the annual DDF for each region across the 60-year period. Included are vertical lines indicating volcanic eruptions and major jökulhlaups with the potential of affecting annual dust activity. Three major jökulhlaups are indicated in the figure, two from Mýrdalsjökull (located in South Iceland) in 1955 and 1999, and one in 1996 at Grimsvötn Gjalp (from Vatnajökull, which is bordered by Dyngjusandur on its north end and Skeiðarársandur on its south end). In South stations, the 1999 Mýrdalsjökulhlaup is followed by an increase in DDF the next year, but the 1955 Mýrdalsjökulhlaup is followed by a drop in DDF the next year. There is an increase in DDF seen in several stations the year following the Grimsvötn jökulhlaup, but greater peaks are seen throughout the 60 year period. However, the nearest weather stations from the jökulhlaup-affected areas are not always on the main dust plume paths and many dust events remain unreported. This occurs especially in South Iceland where dust plumes from the Mýrdalssandur and Skeiðarársandur areas head directly toward the ocean. The number of dust events after the jökulhlaups can therefore be underestimated.
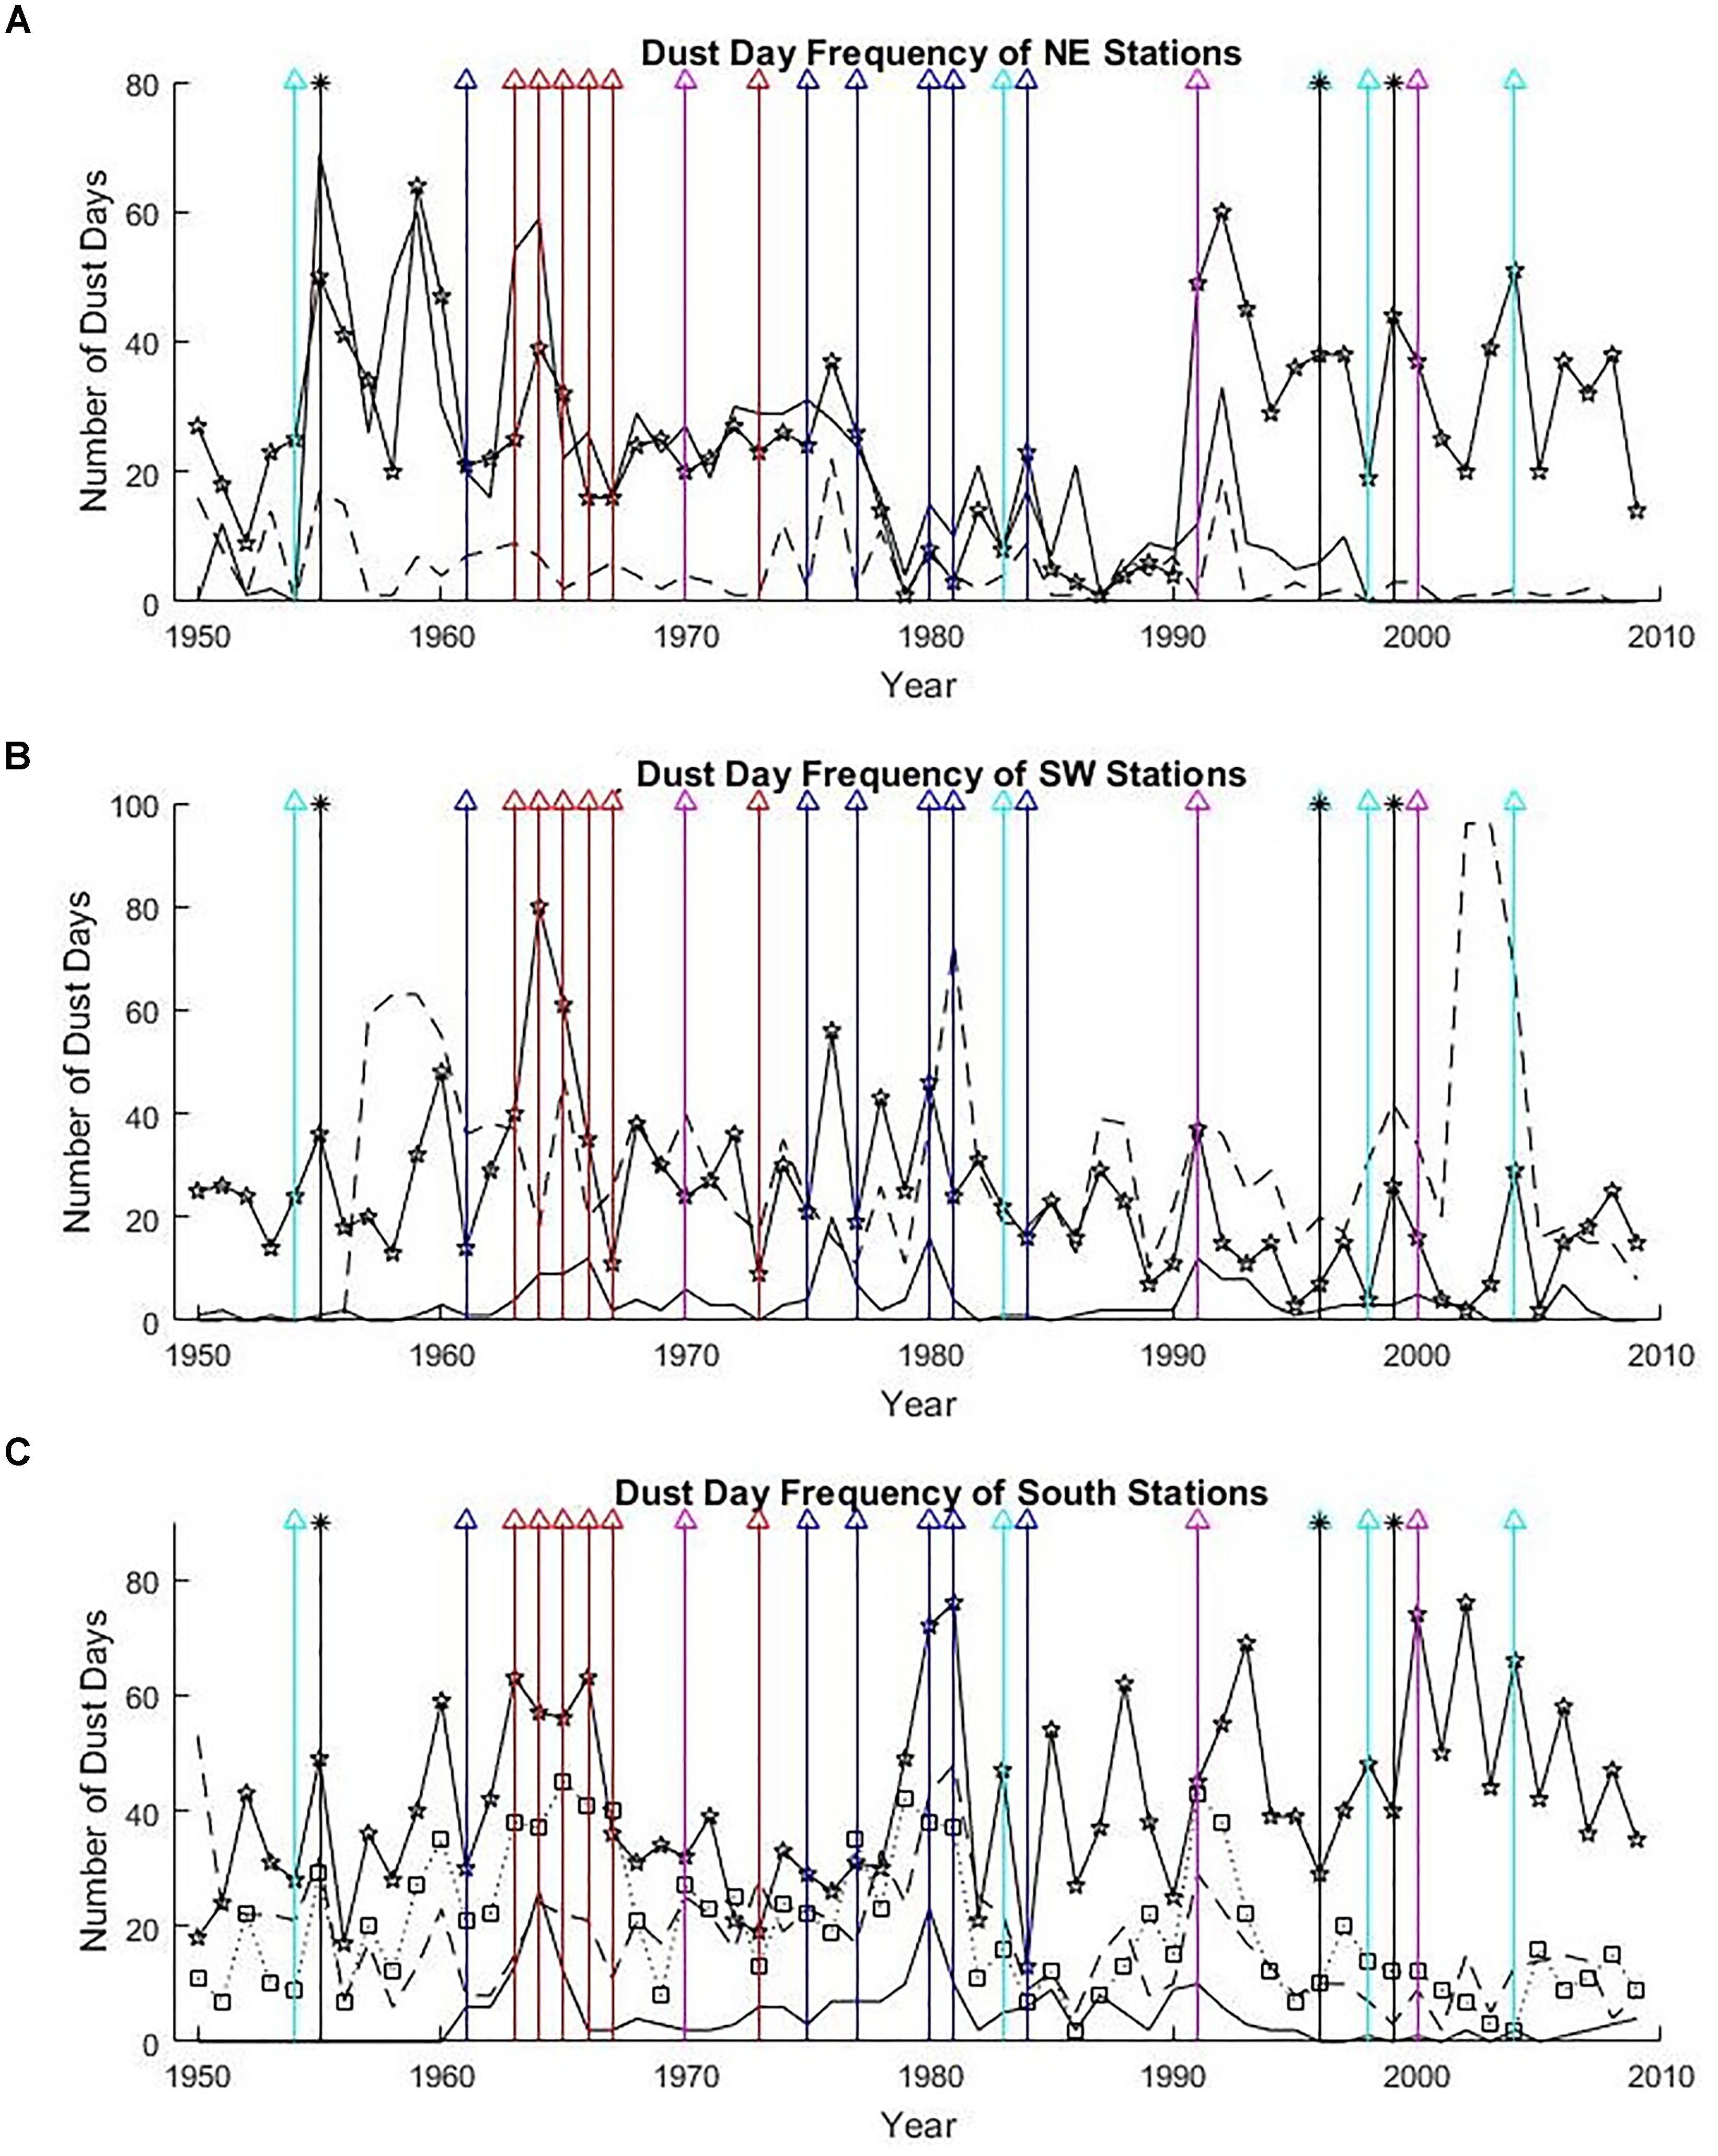
Figure 6. The line graphs along the y-axis indicate the number of dust days each year, separated by region. (A) NE stations: Grímsstaðir (), Raufarhöfn ( – – –), Egilsstaðir ( –), (B) SW stations: Reykjavik (), Eyrarbakki ( – – –), Hæll ( –), (C) South stations: Stórhöfði (), Vatnsskarðshólar ( – – –), Vík í Mýrdal ( –), Kirkjubæjarklaustur ( dotted line). Volcanic eruptions (∆) and major jokulhlaups (black ∗) depicted with vertical lines. In southern Iceland, there are eruptions in Vestmannaeyjar (red ∆) and Hekla (magenta ∆); in NE Iceland, there are eruptions in Askja and Krafla (blue ∆) and Grimsvötn (cyan ∆). The jökulhlaup (black ∗) in 1996 occured at Grimsvötn Gjalp, while the other two lines (black ∗) indicate Mýrdalsjökulhlaups in the South.
The most consistent dust activity occurs in South stations, but stations in other regions, such as Grímsstaðir and Eyrarbakki, experienced sharp increases in DDF that at times matched that of Stórhöfði. As seen in Figure 5, this contributes to their high number of average dust days per year. Overall though, Stórhöfði had the highest number of dust days, with a total of just under 2500 dust days from 1950 to 2009, as compared to 118 dust days previously reported at Stórhöfði from 1949 to 2011 (Dagsson-Waldhauserová et al., 2014).
Discussion
Seasonal Dust Day Variability
In each station, during the cold season, DDF increases as average temperature rises toward the warm season. It peaks at the start of the warm season, but dips before the return of the cold season. The drop that occurs after the start of the warm season may be because the increased temperature is accompanied by decreased wind speeds. There is likely a threshold temperature around 5°C, below which temperature acts as the limiting factor, as warmer temperatures are necessary in order to evaporate moisture between sediments and reduce particle adhesion for entrainment. Above 5°C, the rate of dessication may be sufficient for the frequency of entrainment to be determined mostly by wind speeds.
Other variance within the warm season may be due to precipitation. If DDF was only determined by wind speeds, it would increase as wind speed picks up after July. Instead, DDF drops even more sharply, coinciding with the sharp increase in precipitation after July. Though precipitation increases up through October, wind speeds also steadily increase, surpassing a threshold at which it outcompetes the effects of heavy precipitation. Once the cold season starts after September or October, entrainment is once again limited by desiccation rate, despite continually increasing wind speeds.
Dagsson-Waldhauserová et al. (2014) reported 1965 to be the driest year for SW Iceland in 100 years, and it is during that same year that Reykjavik peaks in DDF, further indicating a relationship between moisture and entrainment frequency. Furthermore, Dagsson-Waldhauserová et al. (2014) reported that almost half of the dust events in the south part of Iceland occurred in the winter or at subzero temperatures. Though including the dust haze synoptic code increased the number of dust days observed during warmer temperatures, the presence of cold-weather dust activity indicates greater connection of dust events to moisture as opposed to temperature.
Annual Dust Day Variability
Volcanic eruptions that took place within this time period do not appear to have a significant long-term effect extending more than a year beyond the time of eruption, though they may have sizeable impacts on short-term dust activity. For instance, the Eyjafjallajökull eruption in 2010 had increased the dust storm frequency in South Iceland significantly during the 6–9 months following the start of the eruptive explosion (Arnalds et al., 2013; Dagsson-Waldhauserová et al. (2014), though this eruption year is not included in the presented analysis, as it is outside the examined time frame.
While records of minor seasonal jökulhlaups are not present for the observation of seasonal impacts, major jökulhlaups do not appear to have a consistent impact on annual DDF. Prospero et al. (2012) attributes the increase of dust concentration at Stórhöfði in 1997 potentially to the 1996 jökulhlaup, but the total dust days for Stórhöfði in 1997 was 40, which is just below Stórhöfði’s 60 year annual mean of 41.6 (standard deviation of 15.8). They additionally linked the increase in dust concentration at Stórhöfði in 2000 to the 1999 Mýrdalsjökulhlaup, and though the number of dust days in 2000 was relatively high at 74 (two standard deviations above the mean), there are two other spikes in annual dust day number (1981 and 2002) that are at least two standard deviations above the mean and not temporally proximal to a major jökulhlaup. It may be relevant to note that the year 2000 coincides with an eruption of Hekla, located in Southwest Iceland just north of Landeyjasandur. The DDF in 1956, the year following the 1955 Mýrdalsjökulhlaup, was 17, which is greater than a standard deviation below Stórhöfði’s 60 year mean. Remaining South stations also did not reflect DDFs above their stations’ annual mean in the year following each of the three jökulhlaups.
Variability of Dust Activity Between Stations
Variations in overall DDF between stations may be due to sediment availability and the downwind location of stations from the dust plume sources. While Stórhöfði’s spot as the highest DDF can be attributed to its extraordinarily high wind speeds, other stations are not as simple. Vík í Mýrdal’s spot among the lowest three DDFs can be attributed to its extraordinarily high precipitation, as well as the fact that synoptic codes for this station were only measured at 9 a.m. and 9 p.m., missing long periods during the day at which dust activity may have occurred. The placement of Hæll and Raufarhöfn among the bottom three alongside Vík í Mýrdal may be due to their location in more vegetative regions, as can be seen in Figure 1. Vegetation serves to prevent erosion by holding together ground sediment and acting as a buffer between entrainable particles and the atmosphere. Egilsstaðir, with unremarkable temperature and wind speeds, but somewhat low precipitation, also has some vegetative cover and, like Raufarhöfn, is a fair distance from a dust plume source. However, it manages a moderate DDF compared to Hæll and Raufarhöfn, mainly due to dust flowing in the northeast direction from the Dyngjusandur dust plume source (Arnalds et al., 2016).
Vatnsskarðshólar has moderate wind speeds and is located in proximity to the Mýrdalsjökull floodplain. Despite this, it experiences a fair amount of precipitation, which is likely responsible for limiting its resulting DDF. Kirkjubæjarklaustur, which has similar wind speeds and precipitation to Vatnsskarðshólar and is likewise situated near major floodplains (Skeiðarársandur and Mýrdalssandur), follows with a similar resulting DDF.
The remaining stations Reykjavik, Eyrarbakki, and Grímsstaðir may owe their DDFs to a combination of moderate meteorological factors and unremarkable locational factors. Reykjavik has moderate temperature, precipitation, and wind speed, and is located a moderate distance from the Hagavatn dust plume source, but also receives dust from the South coast (Landeyjasandur) (Arnalds et al., 2016). As a result, its DDF falls in between the median three (Egilsstaðir, Vatnsskarðshólar, Kirkjubæjarklaustur) and the top three (Eyrarbakki, Grímsstaðir, Stórhöfði). Eyrarbakki, though also with fairly moderate meteorological factors, is located more proximally to an intersection zone of dust plume sources from Hagavatn, Landeyjasandur, and Mælifellssandur. Finally Grímsstaðir, with moderate wind speeds but extraordinarily low precipitation, is located within the dust plume region of Dyngjusandur, surrounded by barren desert.
Grímsstaðir in Northeast Iceland was originally the station with the highest reported frequency of dust storms in Iceland (Dagsson-Waldhauserová et al., 2013, 2014). Inserting all the dust codes into the analyses shows that the highest frequency of dust codes is now reported from South Iceland, at Stórhöfði. This describes the general situation in South Iceland, where many dust plume sources are located close to the seashore and dust plumes can only be captured on satellite images (Dagsson-Waldhauserová et al., 2014). Monitoring stations floating on the sea south of Iceland could possibly record the highest rates of airborne dust observations.
Conclusion
The analysis of dust day variability reveals correlation to location and wind speed. Location, such as proximity to dust plume sources and sandurs, determines whether there is ample exposed sediment supply, while high wind speeds enhance the transport of that accessible supply. Wind direction and gust, precipitation type, and duration of daylight exposure have yet to be accounted for, and may explain discrepancies in the relationship between meteorological variables and DDF.
The volcanic eruptions alone seem not to correspond to the frequent spikes in DDF year to year. There is an average of one eruption every 3–4 years in Iceland (Thordarson and Höskuldsson, 2008). Jökulhlaups in Iceland occur more frequently than explosive volcanic eruptions, and large jökulhlaups can bring >5 million tons of fine deposits (grain size < 0.05 mm) available for suspension every year (Jensen et al., 2018). Yet it appears that even the largest jökulhlaups do not directly lead to a significant increase in dust activity. This might be because jökulhlaups increase supply in active sandur regions that are not limited by sediment supply. If this is the case, minor jökulhlaups also may not be significantly accountable for seasonal DDF variability. The areas of main jökulhlaups are, however, poorly monitored, because the weather stations are not located in the main pathways of dust plumes from such places. This can cause the underestimation in number of dust SYNOP codes (O’Loingsigh et al., 2010; Arnalds et al., 2016).
Potential long-term impacts of glacier retreat must then reside primarily in the expansion of erodible surface area that was once covered by glaciers, thereby increasing the extent of areas rich in sediment supply. However, floodpaths and vegetation cover may also shift over time to balance this. A possible outcome is that floodplains initially expand as the rate of melting and magnitude of flooding increase; then, as the size of the glacier decreases and the size of its floods follow suit, the floodplains will subsequently be subjected to vegetation succession, especially in the lowland areas. This may eventually reduce the size of sediment supply areas, though many of the most active sand surfaces are hostile to vegetative succession due to abrasion (Vilmundardóttir, 2014).
Overall, we find that the frequency of dust day activity is higher than previously suggested, with an average of about 128 dust days annually for all Iceland, as compared to the previous annual mean of 34 dust days. Dust particles need to be further quantified and qualified in terms of their size and type for a better prediction of the potential impact of future fluctuations in dust activity on global radiative balance.
Author Contributions
The analysis of dust day frequency, meteorology, volcanic eruptions, and jokulhlaups was made by MN. MN and PD-W contributed to writing the manuscript. PD-W coordinated the writing of the paper.
Funding
This work was funded by the SIT (School for International Training) Study Abroad Program, a Program for World Learning, Iceland, and Greenland: Climate Change and the Arctic. The preparation of this manuscript was funded by the Icelandic Research Fund (Rannis) Grant No. 152248-051.
Conflict of Interest Statement
The authors declare that the research was conducted in the absence of any commercial or financial relationships that could be construed as a potential conflict of interest.
Acknowledgments
We would like to acknowledge SIT Program Coordinator Mr. Daniel Govoni and Ms. Alexandra Tyas. We would also like to thank professor Olafur Arnalds for helping with the manuscript preparation.
Footnotes
References
Arnalds, O. (2010). Dust sources and deposition of aeolian materials in Iceland. Icel. Agric. Sci. 23, 3–21.
Arnalds, O., Dagsson-Waldhauserová, P., and Olafsson, H. (2016). The icelandic volcanic aeolian environment: processes and impacts–A review. Aeolian Res. 20, 176–195. doi: 10.1016/j.aeolia.2016.01.004
Arnalds, O., Thorarinsdottir, E. F., Thorsson, J., Dagsson-Waldhauserova, P., and Agustsdottir, A. M. (2013). An extreme wind erosion event of the fresh Eyjafjallajokull 2010 volcanic ash. Nat. Sci. Rep. 3:1257. doi: 10.1038/srep01257
Björnsson, H. (1992). Jökulhlaups in Iceland: prediction, characteristics, and simulation. Ann. Glaciol. 16, 95–106. doi: 10.3189/1992AoG16-1-95-106
Björnsson, H. (2002). Subglacial lakes and jökulhlaups in Iceland. Glob. Planet. Change 35, 255–271. doi: 10.1016/S0921-8181(02)00130-3
Bullard, J. E. (2013). Contemporary glacigenic inputs to the dust cycle. Earth Surf. Process. Landf. 38, 71–89. doi: 10.1002/esp.3315
Bullard, J. E., Baddock, M., Bradwell, T., Crusius, J., Darlington, E., Gaiero, D., et al. (2016). High-latitude dust in the Earth system. Rev. Geophys. 54, 447–485. doi: 10.1002/2016RG000518
Dagsson-Waldhauserová, P., Arnalds, O., and Olafsson, H. (2013). Long-term frequency and characteristics of dust storm events in Northeast Iceland (1949-2011). Atmos. Environ. 77, 117–127. doi: 10.1016/j.atmosenv.2013.04.075
Dagsson-Waldhauserová, P., Arnalds, O., and Olafsson, H. (2014). Long-term variability of dust events in Iceland (1949-2011). Atmos. Chem. Phys. 14, 13411–13422. doi: 10.5194/acp-14-13411-2014
Jensen, E. H., Egilson, D., Pagneux, E., Björnsson, B. B., Zóphóníasson, S., Snorrason, S. P., et al. (2018). Hættumat Vegna Jökulhlaupa í Skaftá. Mat á Setflutningi Með Sögulegu Yfirliti. Reykjavík: Veðurstofa Íslands.
Maizels, J. (1997). Jökulhlaup deposits in proglacial areas. Q. Sci. Rev. 16, 793–819. doi: 10.1016/S0277-3791(97)00023-1
O’Loingsigh, T., Mc Tainsh, G., Tapper, N., and Shinkfield, P. (2010). Lost in code: a critical analysis of using meteorological data for wind erosion monitoring. Aeolian Res. 2, 49–57. doi: 10.1016/j.aeolia.2010.03.002
Prospero, J. P., Bullard, J. E., and Hodgkins, R. (2012). High latitude dust over the North Atlantic: inputs from Icelandic proglacial dust storms. Science 335, 1078–1082. doi: 10.1126/science.1217447
Vilmundardóttir, O. K. (2014). Early stage development of selected soil properties along the proglacial moraines of Skaftafellsjökull glacier. SE Iceland. Catena 121, 142–150. doi: 10.1016/j.catena.2014.04.020
WMO (2009). Manual on Codes: International Codes, Vol. 1 (Part A – Alphanumeric Codes). Available at: http://www.wmo.int/pages/prog/www/WMOCodes.html [accessed November 6, 2014].
Keywords: high-latitude, jökulhlaups, sandur, Iceland, dust aerosol, dust haze
Citation: Nakashima M and Dagsson-Waldhauserová P (2019) A 60 Year Examination of Dust Day Activity and Its Contributing Factors From Ten Icelandic Weather Stations From 1950 to 2009. Front. Earth Sci. 6:245. doi: 10.3389/feart.2018.00245
Received: 17 August 2018; Accepted: 18 December 2018;
Published: 09 January 2019.
Edited by:
Yuh-Lang Lin, North Carolina A&T State University, United StatesReviewed by:
Jose M. Baldasano, Universitat Politecnica de Catalunya, SpainHenrique De Melo Jorge Barbosa, University of São Paulo, Brazil
Copyright © 2019 Nakashima and Dagsson-Waldhauserová. This is an open-access article distributed under the terms of the Creative Commons Attribution License (CC BY). The use, distribution or reproduction in other forums is permitted, provided the original author(s) and the copyright owner(s) are credited and that the original publication in this journal is cited, in accordance with accepted academic practice. No use, distribution or reproduction is permitted which does not comply with these terms.
*Correspondence: Miye Nakashima, bmFrYXNoaW1hbWl5ZUBnbWFpbC5jb20=