
95% of researchers rate our articles as excellent or good
Learn more about the work of our research integrity team to safeguard the quality of each article we publish.
Find out more
ORIGINAL RESEARCH article
Front. Earth Sci. , 14 January 2019
Sec. Volcanology
Volume 6 - 2018 | https://doi.org/10.3389/feart.2018.00239
This article is part of the Research Topic Exploring Volcanic Paroxysmal Explosive Activity From Magma Source to Ground and Atmosphere View all 11 articles
 Roberto D'Aleo1*
 Marcello Bitetto1Dario Delle Donne1
 Mauro Coltelli2
 Diego Coppola3
 Brendan McCormick Kilbride4Emilio Pecora2
 Maurizio Ripepe5Lois Claire Salem4
 Giancarlo Tamburello6
 Alessandro Aiuppa1,7
The persistent open-vent activity of basaltic volcanoes is periodically interrupted by spectacular but hazardous paroxysmal explosions. The rapid transition from quiescence to explosive eruption poses a significant challenge for volcanic hazard assessment and mitigation, and improving our understanding of the processes that trigger these paroxysmal events is critical. Although magmatic gas is unquestionably the driver, direct measurements of a paroxysm's gas flux budget have remained challenging, to date. A particularly violent paroxysmal sequence took place on Etna on December 2015, intermittently involving all summit craters, especially the Voragine (VOR) that had previously displayed no activity for several years. Here, we characterize the volcano's SO2 degassing budget prior to, during and after this paroxysmal sequence, using ground-based (UV-Camera) and satellite (OMI) observations, complemented with ground- and space-borne thermal measurements. We make use of the high spatial resolution of UV-cameras to resolve SO2 emissions from the erupting VOR crater for the first time, and to characterize temporal switches in degassing activity from VOR to the nearby New Southeast Crater (NSEC). Our data show that onset of paroxysmal activity on December 3–5 was marked by visible escalation in VOR SO2 fluxes (4,700–8,900 tons/day), in satellite-derived thermal emissions (2,000 MW vs. ~2–11 MW in July-November 2015), and in OMI-derived daily SO2 masses (5.4 ± 0.7 to 10.0 ± 1.3 kilotonnes, kt; 0.5 kt was the average in the pre-eruptive period). Switch in volcanic activity from VOR to NSEC on December 6 was detected by increasing SO2 fluxes at the NSEC crater, and by decaying SO2 emissions at VOR, until activity termination on December 19. Taken together, our observations infer the total degassed SO2 mass for the entire VOR paroxysmal sequence at 21,000 ± 2,730 t, corresponding to complete degassing of ~1.9 ± 0.3 Mm3 of magma, or significantly less than the measured erupted magma volumes (5.1–12 Mm3). From this mismatch we propose that only a small fraction of the erupted magma was actually emplaced in the shallow plumbing system during (or shortly prior) the paroxysmal sequence. Rather, the majority of the erupted magma was likely stored conduit magma, having gone through extensive degassing for days to weeks prior to the paroxysm.
Open-vent mafic volcanoes are among the most persistent and spectacular forms of active volcanism on our planet (Rose et al., 2013). Apart from being prodigious sources of magmatic volatiles to the Earth's atmosphere during passive (quiescent) degassing (Shinohara, 2013; Carn et al., 2017), these basaltic volcanoes are also the most frequently erupting (Global Volcanism Program, 2013). Although their eruptions are most commonly effusive in nature, explosive paroxysmal eruptions do also periodically occur, ranging in size and intensity from Hawaiian-Strombolian (Volcanic Explosivity Index, VEI: 1–2) to Plinian (VEI: 5–6) in the most extreme events (Williams and Self, 1983; Coltelli et al., 1998; Houghton et al., 2004; Pérez et al., 2009).
Rapid transitions from quiescent behavior to violent eruptions pose a significant challenge for eruption forecasting and hazard management at open-vent basaltic volcanoes, and developing a deeper understanding of the processes that trigger and sustain paroxysms, or influence their magnitude and intensity, is critical (Manga et al., 2017). Magmatic volatiles are known to play a central role in the generation of these basaltic paroxysms (e.g., Aiuppa et al., 2010). Proposed mechanisms include the periodic collapse of gas-rich magmatic “foams” residing at the upper levels of crustal magma storage systems (Allard et al., 2005; Carbone et al., 2015; Chouet and Dawson, 2015) and recharging of relatively degassed shallow magmas with gas-rich magmas from greater depth (e.g., Albert et al., 2016; Pompilio et al., 2017). Improving our understanding of these, or alternative, mechanisms depends on the integration of several methods, and especially real-time observations of gas emissions.
Some of the most frequent and violent basaltic paroxysmal explosions in nature occur on Mt. Etna volcano, in Sicily. Since the late 1990s, roughly ~200 paroxysmal explosive events have occurred at Mt. Etna, frequently clustered in cycles of discrete lava fountaining events initially at the Southeast crater (SEC) (during 1996–2008; Allard et al., 2006; Behncke et al., 2006; Bonaccorso et al., 2011) and latterly at the New Southeast crater (NSEC) (2011-present; Behncke et al., 2014; De Beni et al., 2015). Paroxysmal events are exceptionally well characterized in terms of eruptive dynamics (Harris and Neri, 2002; Dubosclard et al., 2004; Marchetti et al., 2009; Andronico and Corsaro, 2011; Scollo et al., 2012; Ulivieri et al., 2013) and composition, texture and volume of erupted materials (Corsaro and Pompilio, 2004; Polacci et al., 2006; Kahl et al., 2015). Interpretation of their associated geophysical signals has led to increasingly refined models for their source region and triggering mechanisms (Alparone et al., 2003; Calvari et al., 2011; Bonaccorso and Calvari, 2013; Patanè et al., 2013; Bonaccorso, 2014; Spampinato et al., 2015; Gambino et al., 2016). The composition of magmatic gases in the co-eruptive clouds has also been measured (Allard et al., 2005; La Spina et al., 2015).
One major limitation of our current understanding of the mechanisms driving Etna's (and basaltic, in general) paroxysms is the poorly constrained syn-explosive gas output (e.g., the gas flux and total gas volume emitted during the paroxysm). In contrast to quiescent emissions, which are relatively easy to quantify by ground-based remote sensing (e.g., Mather et al., 2006; Burton et al., 2009; Galle et al., 2010; Allard et al., 2016), measuring the gas output from paroxysmal explosions is more challenging. The intensity of activity demands the use of optical remote sensing over in situ measurements, yet significant ash emissions can render the plume opaque to proximal sensors, and eruption column heights of a few kilometers make for challenging viewing geometries for near-source ground-based remote sensing networks. Optical remote sensing of dispersing gas plumes from space is a valuable alternative approach, particularly as the eruptive gas plumes disperse downwind over tens to hundreds of kilometers (Carn et al., 2016), but the relatively low temporal/spatial satellite resolution may prevent gas from individual paroxysms to be resolved.
In this study, we apply a suite of complementary methods to calculate a comprehensive gas emissions budget for a notably intense paroxysmal eruption sequence on Mt Etna volcano, Sicily, in December 2015 (Figure 1). While satellite observations of paroxysmal eruptions are now routinely made (Carn et al., 2016) and ground-based remote sensing studies have quantified SO2 emissions budgets for open-vent basaltic volcanoes during lower intensity activity (i.e., quiescent/passive degassing + low-level Strombolian, e.g., Dalton et al., 2010; Tamburello et al., 2012; Pering et al., 2014), to our knowledge this is the first attempt to report the gas budget of an Etna's major paroxysmal episode.
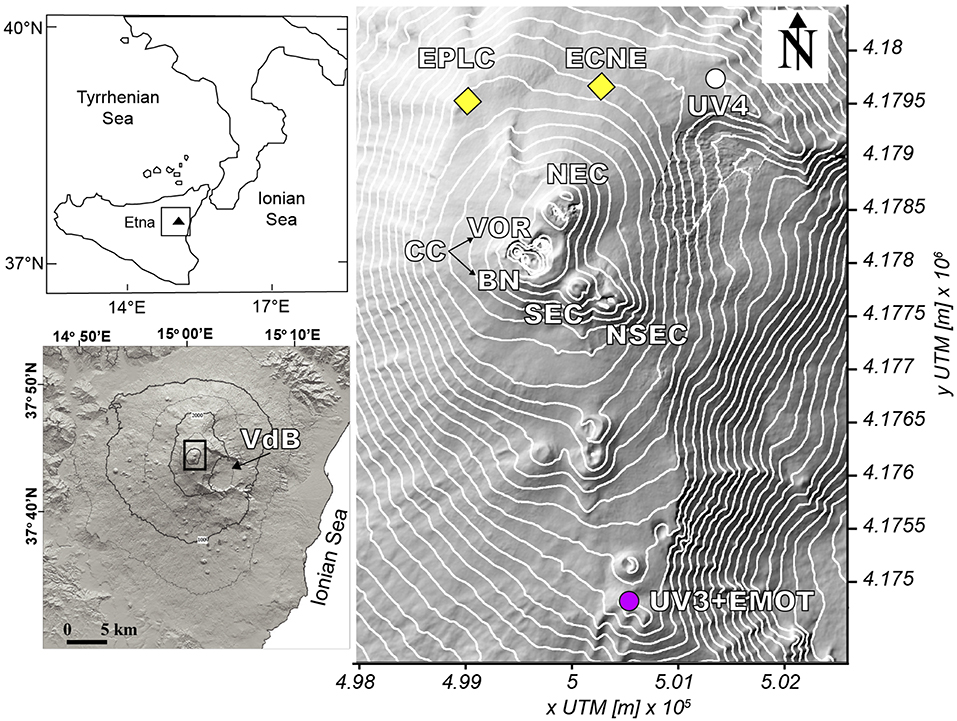
Figure 1. Map of the south of Italy show the position of the Mt. Etna, in the bottom there is a map of Etna, on the right there is map that shows the active summit craters (NEC: North East Crater, CC Central Craters, NSEC New South East Crater) and the location of the instruments used in this work. Results from EPLC and ECNE, part of the INGV-OE monitoring network, were used to generate the seismic tremor results displayed in Figure 4.
To this aim, we combine UV camera measurements (D'Aleo et al., 2016) with complementary satellite-based observations of the explosive SO2 release during the paroxysm(s), obtained from the Ozone Monitoring Instrument (OMI; Levelt et al., 2006, 2017; Carn et al., 2017). From these, we quantify the pre-, syn-, and post-paroxysmal SO2 emissions, and estimate the degassing magma volumes required to supply these emissions. Comparison between SO2-based degassing magma volumes and direct erupted magma measurements (Bonaccorso and Calvari, 2017; Pompilio et al., 2017) is used to derive constraints on the paroxysms' magmatic volatile source and mechanisms. To assist interpretation of the results, we also use seismic tremor data (Alparone et al., 2007), ground-based thermal radiance measurements (Coltelli et al., 2017) and infrared satellite images acquired by the Moderate Resolution Imaging Spectroradiometer (MODIS) (Wright et al., 2002; Wright and Flynn, 2004; Rothery et al., 2005; Wright and Pilger, 2008; Coppola et al., 2013, 2016). Thermal data, in particular, are increasingly used to characterize magma circulation (convection) at very shallow depth during the quiescent (e.g., in the absence of effusion) activity of open-vent volcanoes, and are thus very complementary to SO2 (Coppola et al., 2013; Werner et al., 2017; Aiuppa et al., 2018). We argue that our combined satellite- and ground-based approach could be more widely applied to studies of basaltic volcanism, and forms a useful comparison to indirectly quantified magmatic gas budgets for paroxysms, e.g., the petrological method (combining erupted volumes with pre-eruptive magma volatile content measured in melt inclusions) (e.g., Roggensack et al., 1997).
Since January 2011, Etna's eruptive activity has been characterized by 48 episodic events of lava fountaining from the NSEC, forming both ash-rich eruptive plumes (rising to 11 km a.s.l.) and lava flows flowing eastward and remaining confined within the Valle del Bove (VdB) depression (Figure 1). Between January and May 2015, strombolian activity eventually resumed (though intermittently) at VOR. This crater (one of the Etna's Central Craters CCs), although the oldest of those presently active on the volcano, had exhibited strong gas emissions but no eruptions since the intense 1998–1999 episode that included a sub-plinian explosion on 22 July 1998 (Aloisi et al., 2002). While SO2 degassing associated to NSEC activity has been discussed earlier (D'Aleo et al., 2016), VOR reactivation in 2015, and particularly the activity build-up in late December (see below), first opened the possibility to characterize SO2 degassing processes at the volcano's CCs.
Volcanic activity progressively escalated at VOR in the second half of 2015, eventually culminating into a violent paroxysmal sequence in early December (Figure 2). This sequence (Vulpiani et al., 2016; Corsaro et al., 2017; Pompilio et al., 2017) was composed of individual lava fountain episodes similar in duration (~1–2 h), magnitude (~109-1010 kg of erupted tephra) and fountain height (~1–4 km) to Etna's earlier paroxysms, but was also exceptional for (i) the unusually rapid progression of eruptive episodes, with 4 violent lava fountain events in < 2 days; (ii) the eruptive ash column reaching up to 12–15 km height; (iii) the nearly simultaneous reactivation of several summit craters; and particularly (iv) the first paroxysmal events at the Voragine crater (VOR) in more than a decade.
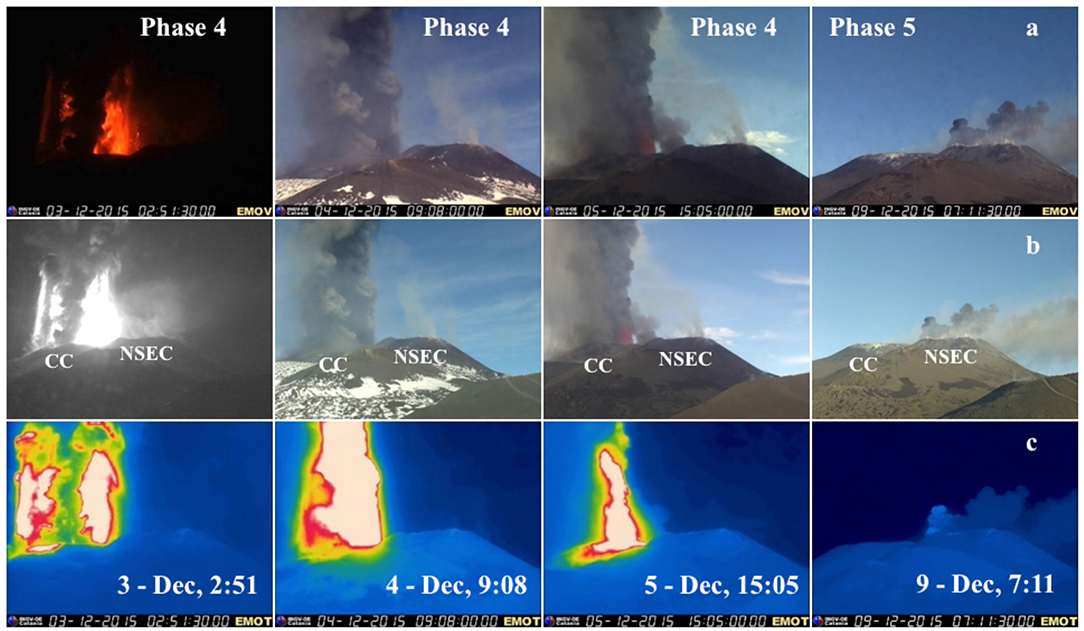
Figure 2. Visible (a,b) and thermal (c) images of Etna's paroxysmal activity from Central Crater (Voragine in this case) on December 3,4,5 (Phase 4). All images taken from the INGV-OE Montagnola multi-parametric Station (see Figure 1 for location), using (a) EMOV (b) EMHD and (c) EMOT cameras.
Etna's activity in June-December 2015 is divided into five phases, whose chronology is summarized below.
Etna remained relatively quiet between June and mid October 2015, with continuous passive gas emissions, and occasional reddish ash emissions from the Northeast Crater (NEC) (18–20 July) and VOR (20 August). Occasional, dilute ash puffs were observed until 12–18 October, when weak emissions of reddish ash at VOR became more continuous.
Mild explosive activity resumed inside the VOR crater on the morning of October 19 (Corsaro et al., 2017), and intensified in the following days. On 19 November, numerous explosions were observed in rapid succession (4–6 events in a few seconds). On November 25, weak strombolian activity at the NSEC began, while activity of the VOR continued without any evident change in intensity until the end of the month.
On 1–2 December, frequent and strong explosions were observed at VOR with ejecta rising tens of meters above the crater rim. Explosive activity from a small pit crater of the NSEC, accompanied by weak ash emissions, was also observed. On 2 December from 20:40 UTC, explosive activity at the VOR increased progressively, culminating in the early hours of 3 December in the first paroxysmal eruption.
A succession of four eruptive episodes was produced by VOR in <3 days during Phase 4) (Figure 2). These episodes were each characterized by paroxysmal phases of short duration ~47–97 min, as derived from Doppler-radar recordings (Donnadieu et al., 2016) and thermal/visible images recorded by INGV video cameras. The eruptive style was similar to the majority of the 230 episodes that have occurred at Etna's summit craters since 1979. The four paroxysmal events of 3-5 December all exhibited an initial phase of strombolian explosions that progressively increased in intensity before a sharply transition into a continuously jetting lava fountain. Each fountain formed a buoyant volcanic plume at the top of the gas-thrust region, while the largest volcanic clasts (spatter and bombs) were ejected and deposited near the vent, forming rootless lava flows filling VOR and BN craters.
The first episode (I; Figure 2 left panels) occurred on 3 December, after a rapid increase of strombolian explosions begun on 2 December at 20:00 UTC. The paroxysmal phase occurred from 2:08 to 3:28 UTC (duration, 80 min) and was characterized by a transition from strombolian activity to lava fountaining with an accompanying ash column. At 2:20 UTC, the area of incandescent clast fallout increased, peaking at 2:30 UTC when it covered both BN and the crater's slope in the VdB. A strong jet was maintained until 3:12 UTC, when it started to oscillate, gradually reducing to low lava fountaining and finally strombolian explosions after 3:28 UTC.
Episode II (Figure 2; second sets of panels from left) occurred on the morning of 4 December from 9:07 to 10:10 (63 min) following several hours of strombolian activity. The transition to lava fountaining, again with an ash column, occurred remarkably rapidly, within a few minutes, and produced a spectacular mushroom-shaped column similar to a classic plinian umbrella. After reaching peak intensity, paroxysmal activity decreased very slowly up to 9:40 UTC, when the fountain started to oscillate and gradually became low lava fountaining (10:10 UTC), finally waning to strombolian activity at 10:25 UTC.
Strombolian explosions continued until the evening of 4 December, when lava fountaining resumed at around 20:00 UTC (Episode III), reaching a climax at 20:27 UTC and terminating at 21:14 UTC. This event was shorter (47 min) and probably associated with a lower ash column. Activity switched to mild strombolian explosions at around 21:30 UTC, which continued throughout the night.
On 5 December (Figure 2; second sets of panels from right), after a long phase of stable strombolian activity, the intensity of the strombolian explosions increased from 13:30 UTC, and the final paroxysmal phase (Episode IV) occurred, from 14:48 UTC to 16:25 UTC (97 min duration). The transition to lava fountaining, again with an ash column, occurred in about 10 min. The fountaining became discontinuous from about 15:25 UTC, reducing the most powerful and continuous part of the episode to less than half an hour. From 17.30 UTC, activity switched to mild strombolian explosions that continued into the early hours of 6 December, alternating with increasingly frequent ash puffing.
The overall duration of the paroxysmal phases was about 5 h, in which lava fountaining produced incandescent jets reaching up to 1.7 km above the vent (Bonaccorso and Calvari, 2017). The first two episodes were accompanied by very high eruptive columns (~14–15 km a.s.l.), while in the following two episodes the eruption columns reached only ~10–12 km (Vulpiani et al., 2016; Corsaro et al., 2017). Estimates of mass discharge rate and total erupted mass, obtained from observation of lava fountains and ash columns using either camera images, radar recording or satellite data, show a spread of values (see Table 1; data from Vulpiani et al., 2016; Bonaccorso and Calvari, 2017; Corsaro et al., 2017), and do not closely match the limited available field measurements of lava volumes filling the craters and tephra deposits further afield (including material that traveled hundreds of km, and thus fell over the sea). Although the volume output of the four eruptive episodes is not yet accurately known, the available evidence does consistently suggest that episodes I and II were the most intense.
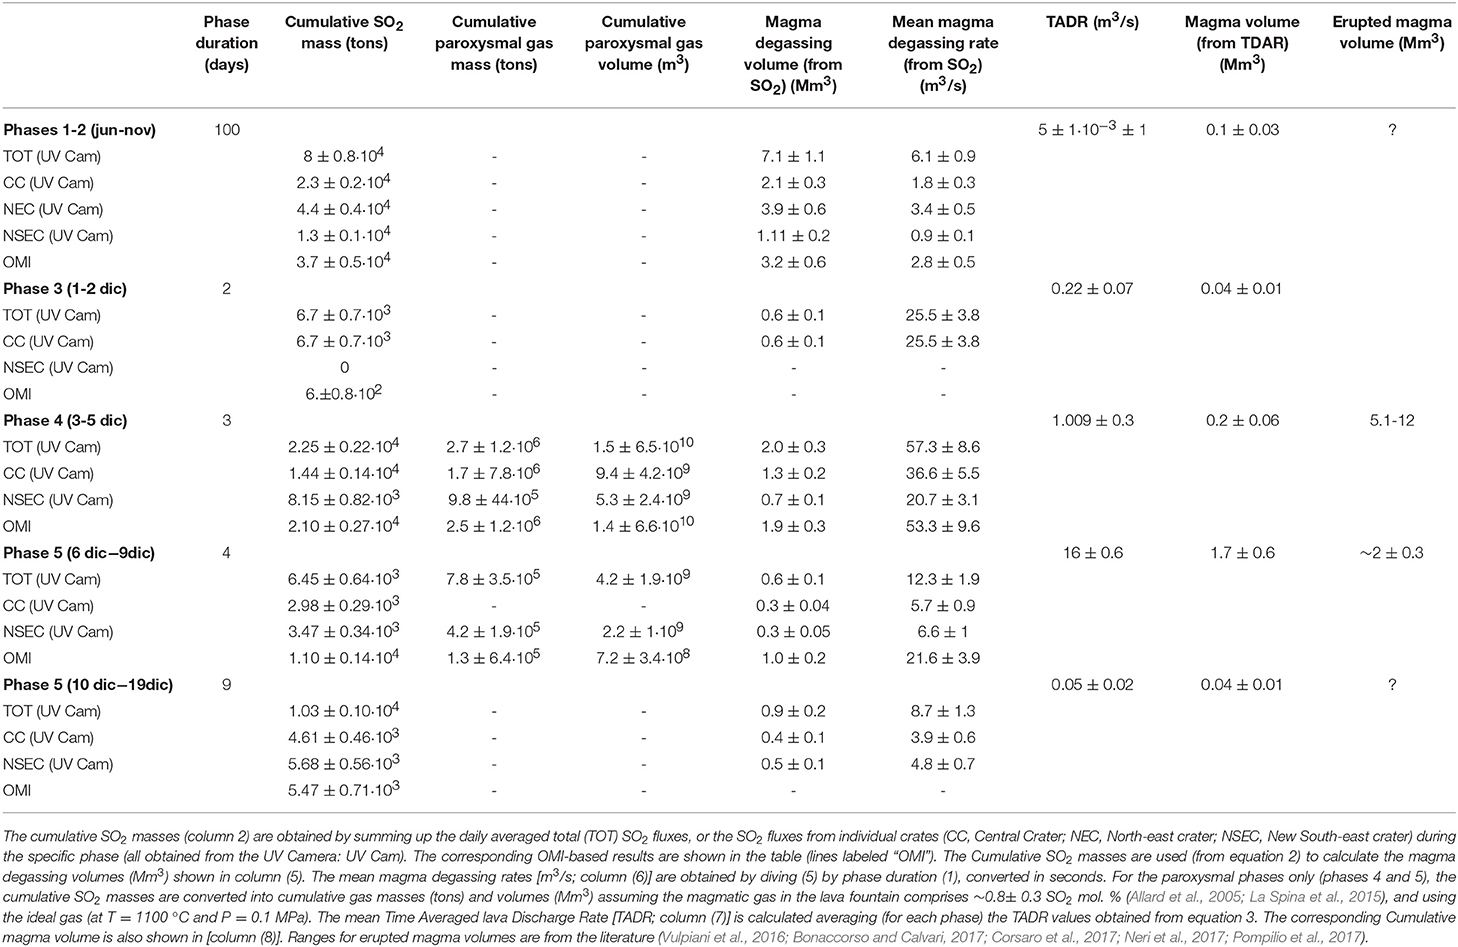
Table 1. Gas and magma budget estimates for the five phases of the June-December 2015 activity phase.
After the last paroxysmal episode, strombolian activity at VOR progressively decreased. On December 6 at 02:00 UTC, after a few hours of quiescence, Phase 5 started with a switching of eruptive activity to the NSEC (Figure 2; right panels). Phase 5 was characterized by intense strombolian activity concentrated at the pit crater located on the eastern flank of the NSEC, and by effusive activity in the VdB (~2 Mm3 of lava released) during December 6–9 (Corsaro et al., 2017). From 10 December, ash emissions gradually waned and disappeared completely by mid–December.
Etna's volcanic SO2 flux was measured from the ground using a permanent network of 2 stand-alone UV cameras run by University of Palermo (D'Aleo et al., 2016). These camera systems have been operational since 2014 and are located at Montagnola (UV3) and Pizzi Deneri Observatory (UV4) (Figure 1), see D'Aleo et al. (2016) for further details. The network has been deployed within the context of the FP 7 Project BRIDGE (http://www.bridge.unipa.it/) of the European Research Council (ERC).
Each UV camera system is equipped with two JAI digital cameras (JAI CM 140 GR, with 10-bit digitization and 1392 × 1040 pixels) fitted with two Edmund Optics pass-band filters at 310 nm and 330 nm, respectively. From the contrast in camera pixel brightness in each set of co-acquired 310 and 330 nm images, the 2D distribution of SO2 in a volcanic plume is derived and, by processing of consecutive sets of images, the SO2 flux (Mori and Burton, 2006; Burton et al., 2015). Each camera system also features a visible camera and one ocean optics USB2000+ spectrometer (for calibration of camera-derived absorbance images, see also Lübcke et al., 2013). At the UV3 site, images (UV, visible) and spectra are acquired for 5 h each day from 8 am to 1 pm Local Time, the period of maximum illumination and minimum cloud cover. Acquired data are collected and archived in a rack computer. The UV4 camera system is powered by batteries and equipped with a jetway embedded PC and runs 5 h per day. Each camera mounts a 9 mm Uka Optics UV lens with a field of view (FOV) of 45°. This FOV is selected to provide sufficient spatial resolution (up to 3 meters) to resolve degassing from New South East Crater (NSEC) and Central Craters (CC) (from UV3), and North East Crater (NEC), CC and NSEC (from UV4).
At each site, the two UV cameras capture sequential images of the volcanic plume with 0.5 Hz acquisition rate and ~5 m spatial resolution. Images are then post-processed as described in Kantzas et al. (2010) using an automatic routine version (Delle Donne et al., 2017) of the Vulcamera software (Tamburello et al., 2011, 2012). This yields, for each degassing crater (D'Aleo et al., 2016), time-series of SO2 integrated column amounts (ICA) along a plume cross-section. These SO2 ICAs are finally converted into a flux using simultaneous records of plume speed calculated directly from the camera data using an Optical Flow methodology based on the Lukas/Kanade algorithm (Lucas and Kanade, 1981; Bruhn et al., 2005) and integrated in Vulcamera.
Errors on UV camera-derived SO2 fluxes have recently been quoted at ±18.7% (Holland et al., 2011), ±15% (Tamburello et al., 2012). Use of optical-flow algorithms (Bruhn et al., 2005) to derive plume speed are thought to reduce uncertainty to ±10% (Kern et al., 2015), and this value is taken as representative for errors associated with the SO2 fluxes presented here.
The 2015 UV camera dataset is unfortunately not continuous. Due to logistical challenges (e.g., very high snow cover and extremely low temperatures in winter), the UV4 camera system is only maintained during summer-early autumn; the NEC SO2 flux dataset thus only extends from mid-June to mid-October 2015. The UV3 camera system sits in a robust housing (a hut, containing several multi-parametric instruments from INGV-OE). However, technical problems (including icing of the outer quartz window and un-sticking of the optical lenses from the cameras during quick temperature changes) together with the frequent cloud cover over the volcano's summit resulted in non-continuous SO2 flux measurements for the Central Craters (VOR + Bocca Nuova) and the NSEC. Although many of these technical issues have now been solved, the 2015 dataset demonstrates the challenges in maintaining a permanent UV camera system on a high-altitude volcano with occasionally extreme meteorological conditions.
The Ozone Monitoring Instrument (OMI) is a hyperspectral ultraviolet/visible spectrometer carried aboard the NASA satellite Aura (Levelt et al., 2006, 2017). OMI is one of several UV sensors used in monitoring global atmospheric SO2 concentrations, but it is arguably the most sensitive and effective, offering good spatial resolution (13 × 24 km at nadir), a wide spectral range (270–500 nm, with resolution of 0.45 nm) and contiguous daily coverage of the Earth. These factors are particularly beneficial in the daily monitoring of volcanic SO2 emissions, both during eruptions and in the intervals of passive degassing that may separate eruptions, and numerous studies have exploited OMI data for long-term studies of volcanic degassing at individual volcanoes and on a global basis (e.g., Carn et al., 2008, 2013, 2017; McCormick et al., 2012, 2015; Flower and Carn, 2015; Fioletov et al., 2016; Flower et al., 2016). Recently, a new SO2 retrieval algorithm based on principal component analysis has been developed that dramatically reduces the noise in the OMI SO2 data (Li et al., 2017). A new dataset, optimized for the study of volcanic emissions, and designated OMSO2VOLCANO is publicly available from the NASA Goddard Earth Sciences (GES) Data and Information Services Center (DISC; http://disc.sci.gsfc.nasa.gov/Aura/data-holdings/OMI/omso2_v003.html). SO2 column amounts are provided for a set of SO2 vertical profiles, distributed around a center of mass altitude (CMA). We use the lower tropospheric SO2 data (CMA of 3 km) for the interval before the onset of the paroxysmal eruption, and either middle troposphere (CMA of 8 km) or lower stratospheric data (CMA of 18 km) throughout the paroxysm, based on auxiliary plume height data (e.g., Corsaro et al., 2017). OMI data can be analyzed using OMIplot, a collection of bespoke software routines written in IDL (Carn et al., 2015).
Here, we use OMI observations to compute a time-series of daily SO2 mass loading over Etna for the paroxysmal interval in December 2015, and several months of preceding activity. The pixels in each OMI instantaneous field-of-view (IFOV, or “scene”) that contain SO2 are identified and the column concentration of SO2 in each pixel, reported in DU, is combined with pixel area and converted to a mass. We obtain a total scene mass loading by summing the mass of all SO2 pixels, and the resulting quantity is typically taken to be the daily SO2 mass released by the volcano, since OMI makes one daily overpass of each point on the Earth's surface. Under certain conditions, e.g. low windspeed or slow SO2 loss rates, it is possible that OMI could observe newly-emitted SO2 in addition to relict SO2 emitted on preceding days. In this study, we consider this unlikely to be a significant problem: local wind speeds at Etna plume altitudes (roughly, 4 to 10 km) are sufficiently high-usually >10 m/s based on NCEP2 Reanalysis Data (Palma, 2013) to carry SO2 rapidly downwind, which we tend to see in SO2 imagery (e.g., drifting plumes can be tracked downwind in consecutive OMI orbits). Moreover, the emissions that concern us in this study are mostly restricted to the free troposphere and as such would tend to have lifetime on the order of 1–2 days particularly for particle-rich volcanic plumes (Eatough et al., 1994; Oppenheimer et al., 1998; Faloona et al., 2009). To be certain of only including fresh SO2 in our daily mass loadings calculations, we examine each OMI scene manually, and compute separate mass loading for discrete drifting SO2 clouds within each image.
The temporal information required to convert SO2 mass loadings to emission rates is usually unavailable, since the satellite obtains an instantaneous snapshot of activity at the time of overpass. Where high quality atmospheric wind speeds and estimates of SO2 lifetime are available, mass loadings can be converted into emission rates (e.g., Carn et al., 2013; Lopez et al., 2013) though some of these methods require particular plume geometries to be successful. In this study, we favor the use of daily mass loadings rather than drawing on auxiliary data to compute emission rates from OMI observations, particularly because the key interval of interest for the satellite observations is the paroxysmal period of late November and early December 2017, where plume geometries are unfavorable for emission rate calculations, and the pulsatory nature of the paroxysmal eruption and emissions are not necessarily well-represented by emission rates averaged to tons per day (cf. per-cloud SO2 mass loadings).
Our reported daily mass loadings should be considered as minima, given the influence of the OMI Row Anomaly (ORA, Carn et al., 2016; Flower et al., 2016). Since 2009, certain rows of the OMI swath have been rendered unusable due to a blockage in the instrument's field of view. This obscures parts of the plume, leading to an underestimate, and on certain days the affected rows may be located squarely across a target volcano and the downwind dispersal area, obscuring the entirety of the plume. In practice this means that SO2 mass loadings may be underestimated on certain days, and moreover that gaps of 2–3 days between OMI observations are now not uncommon. Another potential problem in the use of tropospheric SO2 data is meteorological cloud cover obscuring lower altitude volcanic plumes. We include a time-series of mean scene reflectivity (Figure S1) here as a proxy for cloud cover during the OMI observations, and filtered out pixels where cloud fraction (computed from reflectivity) exceeds 30%. Relative to tropical volcanoes, cloud cover is anticipated to be a much less significant problem at Etna and based on the reflectivity time series is not considered likely to majorly impact our results. Factors such as ash interference and plume opacity also affect OMI measurements, and lead to some SO2 mass underestimation. In the best measurement condition, Yang et al. (2007) estimated an error of 20% on derived SO2 mass loadings. Recently (Torres et al., 2018) showed that improved processing algorithms may reduce errors to as low as 13%.
Thermal data acquired by MODIS were analyzed using the automated, near real time volcanic hot-spot detection system MIROVA (Coppola et al., 2016; www.mirovaweb.it). MIROVA uses middle infrared radiance (MIR) measured by the two MODIS sensors, carried on Terra and Aqua NASA's satellites, respectively. These satellites, scanning the Earth surface four times per day, allow monitoring of volcanic thermal activity globally on a daily basis (Wright et al., 2002; Wright and Flynn, 2004; Rothery et al., 2005; Wright and Pilger, 2008; Coppola et al., 2013, 2016).
The hot-spot detection algorithm includes spectral and spatial analysis of the original MODIS granules, and is designed to detect small to large-scale thermal anomalies (from <1 MW to >40 GW), and thus capture a large variety of volcanic activity (Coppola et al., 2016). Starting from hot spot pixels detected by MIROVA, we use the Wooster et al. (2003) formulation to retrieve the volcanic radiant power (VRP, W):
where LMIR and LMIRbk are the MIR radiances (W·m−2·sr−1·μm−1) characterizing the single hot spot pixel and the background. According to (Wooster et al., 2003), the coefficient 1.89 × 10⁷ (m2·sr·μm) allows estimating VRP with an error of ±30% for any hot surfaces having an integrated temperature between 600 and 1,500 K.
Volcanic activity at Mt. Etna is continuously monitored in real-time by INGV-OE using a network of video-surveillance cameras (five thermal, nine visible) located on the southern, eastern and western flanks of the volcano (Andò and Pecora, 2006; Behncke et al., 2006, 2009). In this study, we use images recorded by EMOT, EMOV and EMHD cameras, all hosted at La Montagnola Multiparametric Station, 3 km SE from the vent (Figure 1) and radiometric data recorded by ENT camera located in Nicolosi, 15 km south of the summit craters. These cameras provided the best quality information and images (Figure 2) during the 3–9 December paroxysmal sequence. Images acquired by these cameras are sent to a receiver in Catania through microwave, WiFi, 2 GHz video transmitter and/or cable. All images are digitized and archived on computers in AVI format, with each video clip representing 5 min.
EMOT is equipped with an A320 M Flir Thermovision camera, while ENT with an A40 M Flir Thermovision camera. Both record in the 7.5 and 13 μm spectral range, providing 320 × 240 pixel images with a spatial resolution of 1.3 mrad. The A320 M and A40 M have thermal sensitivities of 70 mK at 30°C and 80 mK at 25°C, respectively. Thermal images are converted on board the ENT camera to output the peak temperature found in a region of interest, centered on the zone affected by eruptive activity. This value is transmitted at 1 Hz to the acquisition center in Nicolosi. Thermal images and thermal data, recorded between 0 and 500°C, are processed in real-time by a dedicated software (NewSaraterm) developed with LabVIEWTM 8.0 to detect ash-rich eruptive columns, explosive, and effusive activity (Behncke et al., 2009). This software calculates, with a median filter, the daily thermal offset and extracts for each measurement the difference between the measured value and the dynamic thermal offset. NewSaraterm is set to transmit alert messages to the INGV-OE Operative Center anytime when prefigured thresholds are exceeded. Temperatures displayed in the video frames are much lower than the true temperatures at the target, because of the distance between the camera location and the target (the summit craters), environmental factors such as air humidity, pressure, air temperature, and the presence of an additional protective lens on the camera (Sawyer and Burton, 2006). The temperatures discussed here are thus apparent, not absolute, as they have not been corrected for the aforementioned factors.
EMOV is a Sony DXC 950 P visible camera equipped with a professional Canon YH 19 x 6.7 KTS lens, while EMHD uses a VIVOTEK IP8172P camera with a 1/2.5“ Progressive CMOS image sensor and maximum resolution of 2560 × 1920. The lens is a varifocal KOWA LMVZ3510M-IR 1/2” P-IRIS CS-MOUNT lens. The Focal Length is 3.5–10 mm and the Aperture is F 1.6 (wide) ~ F 2.7(tele). The Field of View is: 33° ~ 93° (horizontal), 24° ~ 68° (vertical) and 40° ~ 119° (diagonal). Minimum Illumination is 0.05 Lux @ F1.6 (Color) and 0.001 Lux @ F1.6 (B/W).
We use seismic data from EPLC and ECNE seismic stations (Figure 2), part of the INGV permanent multi-parametric monitoring network. These stations are characterized by a Broadband Nanometrics Trillium with an eigen-period of 40 s and a sensitivity of 1,500 V*s / m. Seismic signal is sampled at 100 Hz with a 24 bit resolution using Nanometrics Trident digitizers. Tremor is then calculated as RMS (root mean square) amplitude in the 0.5–5.5 Hz frequency band and using a moving window of 10 s.
Figure 3 shows examples of SO2 flux records (30 min each) taken by the UV camera network in 3 distinct measurement days: (a) 14 July, (b) 2 December, and (c) 6 December. These examples are selected to illustrate some of the characteristics of our SO2 flux measurements, but cannot be taken as an exhaustive representation of the highly variable degassing behaviors seen at Etna's different vents during the monitored period.
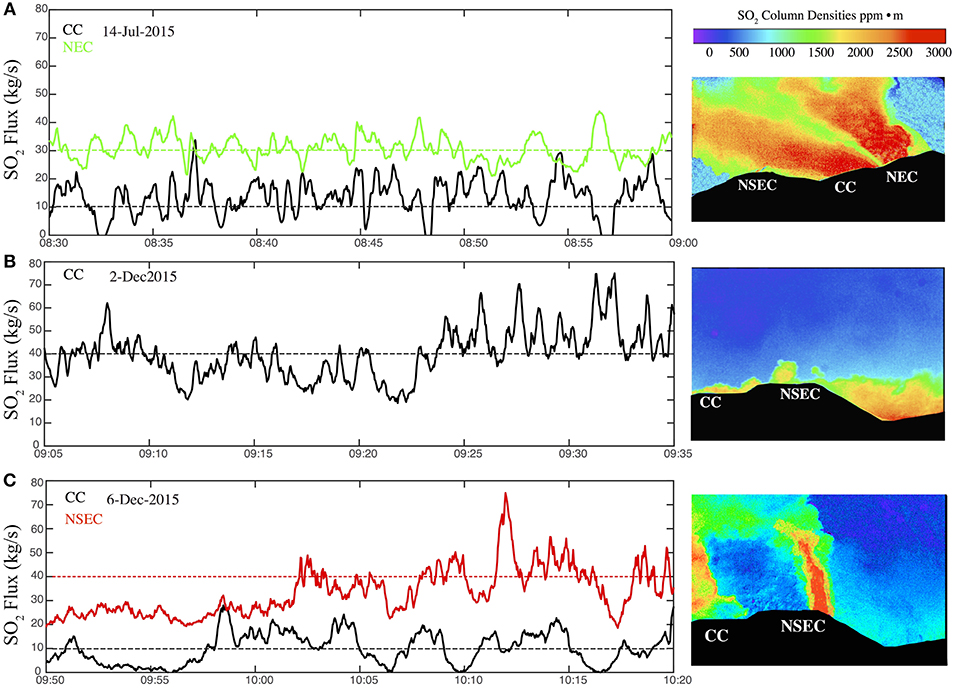
Figure 3. Examples of SO2 flux records (30 min each) taken by the uv camera network in 3 distinct measurement days. The horizontal dashed lines indicate the mean SO2 flux values. For each time-series (measurement day), a snapshot of a representative absorbance image (outputted by the camera system) is also shown to illustrate typical plume geometries (CC: Central Craters, NEC: Northeast crater; NSEC: New Southeast crater). (A) July 14 results obtained from UV4; (B) December 2 results obtained from UV3; (C) December 6 results obtained from UV3.
The 14 July dataset (Figure 3A) is taken as representative of background, quiescent degassing activity during Phase 1 (see section Etna's Eruptive Activity in June-December 2015). Both time-series and image show that, during Phase 1, the NEC is the dominant gas source on the volcano, the CCs are moderately degassing, while the NSEC exhibits low degassing.
The 2 December observations (Figure 3B) illustrate a visible acceleration in SO2 degassing from the CCs in Phase 3 (see section Etna's Eruptive Activity in June-December 2015), as a prelude to the ensuing paroxysmal sequence which started only a few hours later.
Paroxysmal activity from VOR during Phase 4 is fully captured only in the morning of December 4. The UV-camera SO2 flux record taken during a ~4 h period encompassing paroxysmal activity is illustrated in Figure 4. The three other VOR paroxysms occurred either during the night-time (episodes I and III on December 3 and 4, respectively; Figure 2) or during the daytime but outside the UV3 operational time window (episode IV on December 5; Figure 2). Our SO2 fluxes for December 3 and 5 thus essentially reflect degassing prior to or after the paroxysms (see below; Figure 5).
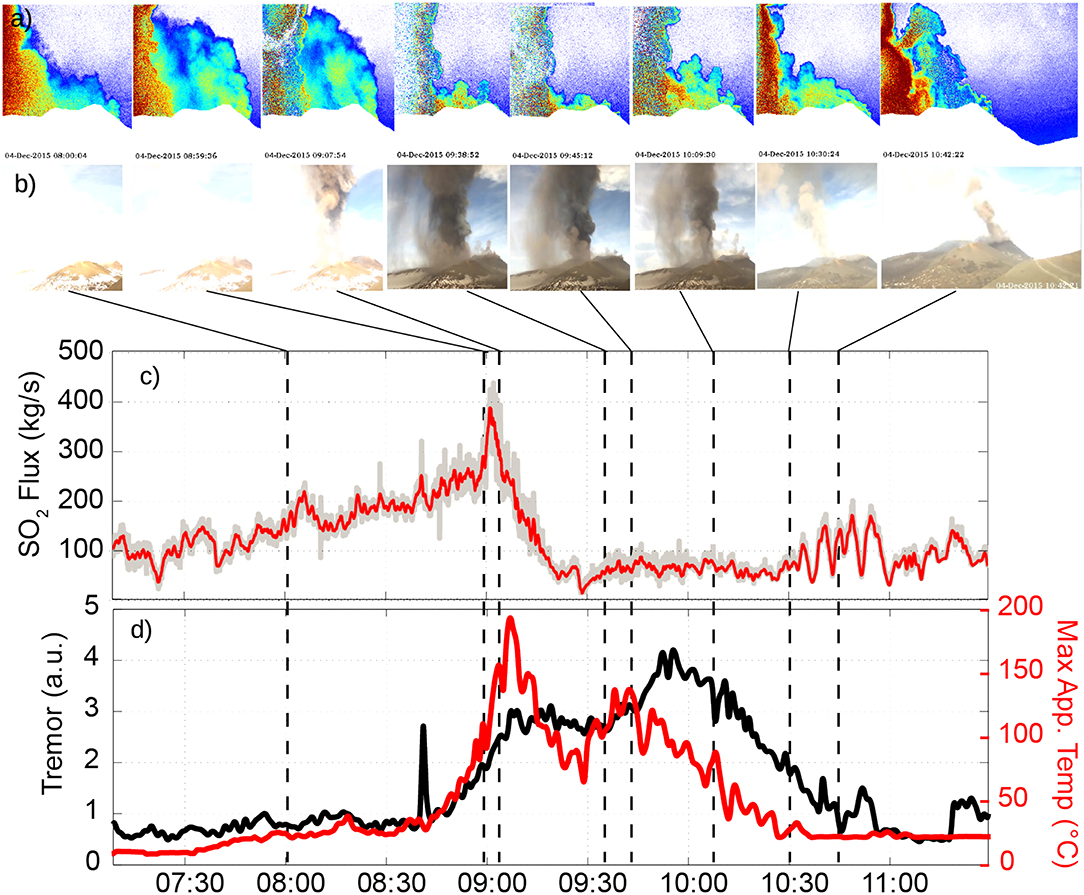
Figure 4. Frame sequence from (a) SO2 and (b) visible cameras capturing the 2015, Dec 4th lava fountaining event from VOR crater. (c) The corresponding SO2 flux record (in red a moving average of the flux signal, gray) shows an increase, from 180 to 400 kg/s, during the early phase eruption, which is coherent with increases in thermal radiance (measured from EMOT, ground based thermal signal) and tremor (see d). The presence of ash within the plume determines an apparent SO2 decrease (down to 100 kg/s) between 9:30 and 10:00, when lava fountaining is still active as shown by elevated thermal and tremor signals.
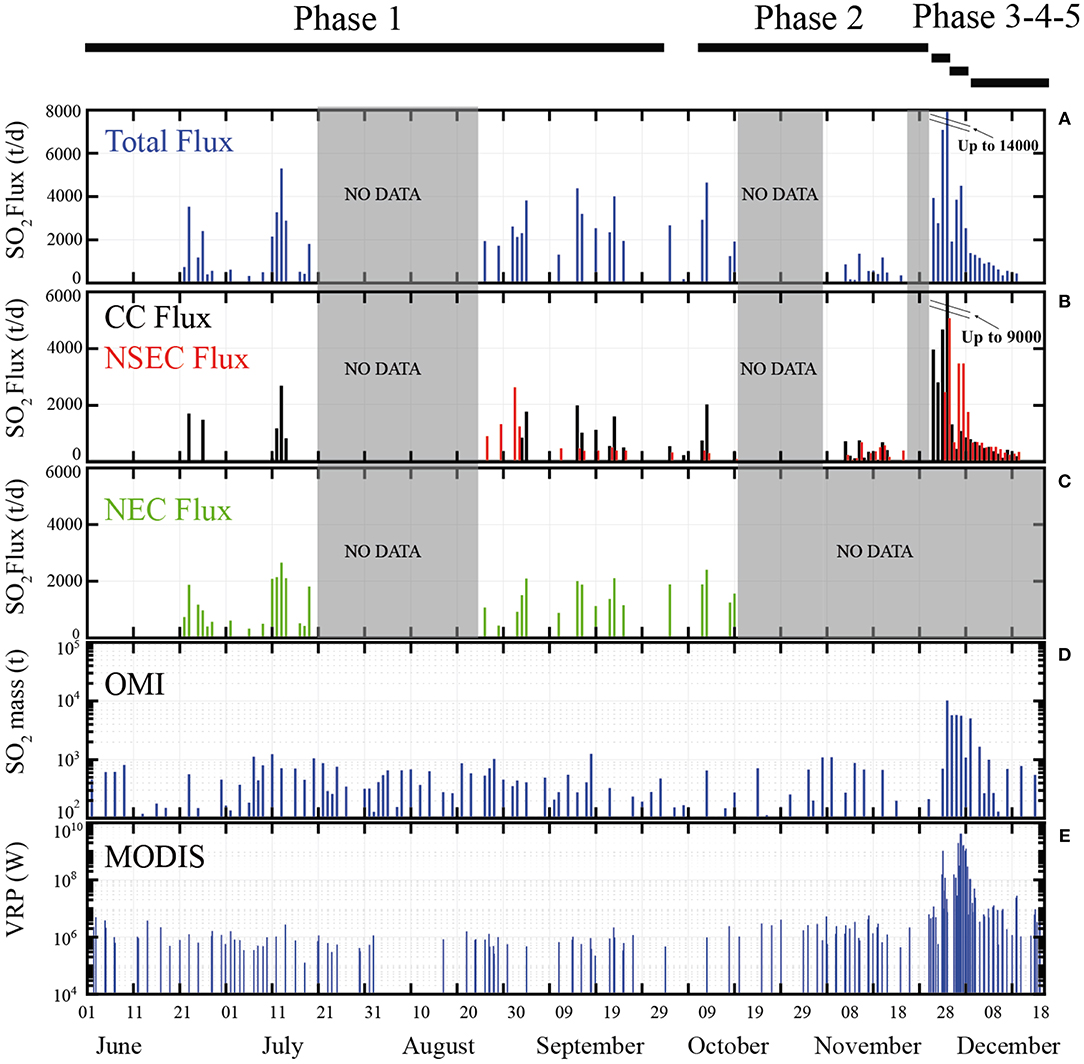
Figure 5. Temporal record of the monitored gas and thermal data, June-December 2015. The upper panel (A) is the daily averaged total SO2 flux from Etna, calculated from the summation of daily averaged SO2 flux contributions from the CC and NSEC (B) and the NEC (C). Note that the total fluxes are under-estimate since mid-October 2015, when the UV4 camera system was dismantled for the winter and the NEC contribution is thus not accounted for. It is also worth to remind that our daily averages are calculated from 5 h of daily observations only. (D) shows the temporal record of the daily SO2 mass loadings captured by OMI, while panel (E) is a temporal plot of the MODIS-derived Volcanic Radiant Rower (VRP), calculated by the MIROVA system. In all plots, note the visible escalation in SO2 degassing and thermal regime in Phase 4–5 (3–9 December), followed by a vanishing coda in mid- to late-December. The data plotted here are available in Table S1.
Figure 4 illustrates our December 4th example (Figure 4), corresponding to the second lava fountaining event of VOR (episode II, from 08:41 to 10:03; Figure 2). The pseudo-color images in the top panel (Figure 4a) illustrate the 2D distribution of SO2 in the basal (gas thrust) portion of the eruptive cloud. These figures show a dense, tall SO2-rich plume rapidly dispersing to the left of the camera's FOV (toward S-SW). Based on comparison with OMI data (see below), we are confident that, in the basal portion of the eruptive column (just right above the crater rim), where our integration cross-section is taken to derive the SO2 fluxes, the largest fraction of the plume is still captured in the camera's FOV. The SO2 flux time-series (Figure 4c) demonstrates ramping up SO2 release in the 2 h before the paroxysm, from ~100 ± 10 kg/s at 7:00 to ~400 ± 40 kg/s at the paroxysm onset (08:41 U.T.C.). After onset of the lava-fountaining phase, visible cameras (Figure 4b) detect significant ash injection in the atmosphere. At the same time, the SO2 flux (Figure 4c) abruptly decreases, from ~400 ± 40 kg/s to ~50 ± 5 kg/s within ~20 min (note degradation of pseudo-color images, Figure 4a), while tremor and thermal radiance still show relatively high and stationary intensities (Figure 4d). The presence of ash in the FOV is known to prevent reliable UV camera measurement since it increases plume opacity and leads to strongly underestimated SO2 column densities (Andres and Schmid, 2001). Assuming stationary SO2 emission during lava fountaining at ~400 kg/s (as observed prior to the onset), we can tentatively infer a factor 87% SO2 underestimation due to ash in the plume. After ~10:30 U.T.C., the SO2 flux oscillates around high (~150 kg/s) values during the paroxysm's waning phase.
A typical dataset for a Phase 5 measurement day (December 6) shows increased degassing from the erupting NSEC crater, and vigorous (though reduced, relative to Phase IV) degassing from the CCs (Figure 3C).
In the attempt to characterize Etna's SO2 degassing behavior in the ~6 month temporal window culminating in the December 2015 paroxysmal sequence, we calculate, for each available measurement day, the daily averaged SO2 flux, by simply taking the arithmetic mean of data in each 5 h-long daily acquisition (see Table S1). Results are illustrated in the synoptic temporal plot of Figures 5A–C, which also summarizes the results of satellite-based SO2 (Figure 5D) and thermal (Figure 5E) observations (see below).
In spite of the several data gaps, caused by adverse weather conditions and technical problems (see section Etna's Eruptive Activity in June-December 2015 and Table S1), the ground-based SO2 flux time-series (Figures 5A–C) documents the temporal evolution of Etna's degassing activity. This is indicated by changes in the Total SO2 flux (Figure 5A) and in the vent-resolved SO2 flux contributions from NEC (Figure 5B), NSEC, and CC (VOR+BN) (Figure 5C). We find that, in phase I (July-October), the Total (NEC+CC+NSEC) SO2 flux oscillates around a ~2,500 t/d average, with the NEC (mean, ~52%) and the CC (mean, ~40%) being the primary SO2 sources and the NSEC contributing only ~8% of the gas on average. The CC SO2 flux systematically remains < 2500 ± 250 tons/day (Figure 5B). Phase 2 (19 October-30 November), characterized by resumed strombolian activity at VOR, is unfortunately very poorly covered by our observations (note that, from Phase 2 onward, the Total SO2 flux accounts for the contribution of CC+ NSEC only, because UV4 was no longer operative, meaning that NEC emissions were not quantified). Corsaro et al. (2017), based on results of the INGV-OE permanent scanning-DOAS network (Salerno et al., 2009), report a SO2 flux increases to 2,500–4,000 tons/day during this phase of escalating strombolian activity at VOR. Intensification of eruptive-degassing activity at VOR is consistent with our UV camera records for Phase 3 (1–2 December; 3,900 and 2,700 tons/day, respectively; see Figures 5B, 6b). No appreciable SO2 is detected at the NSEC during this period (Figure 6c).
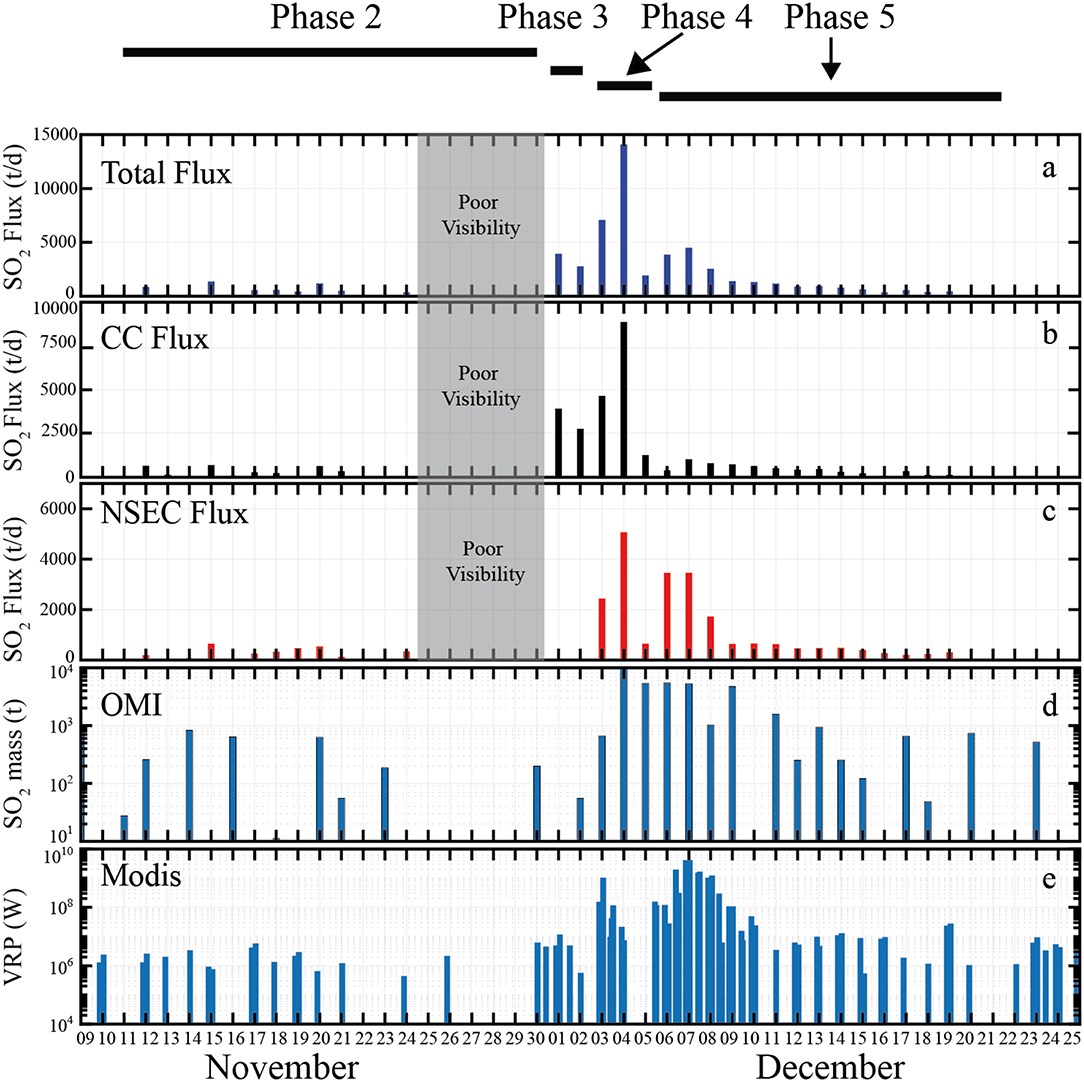
Figure 6. A detail of Figure 5, showing the temporal evolution of gas and thermal signals in November-December 2015. (a) Shows ground based SO2 flux from UV camera, panel (b,c) shows the contribution of Central Craters (CC) and New South East Craters. Between 25 and 30 November extremely weather condition. (d) shows SO2 mass loadings captured by OMI, panel (e) is a temporal plot of the MODIS-derived Volcanic Radiant Rower (VRP), calculated by the MIROVA system.
The onset of paroxysmal activity at VOR, Phase 4 (3–5 December), marks a sizeable increase in the CC (4,580–8,900 tons/day), NSEC (2,600–4,900 tons/day), and Total (~7,100–13,900 tons/day) SO2 flux (Figure 6). It is useful to recall that, since only episode II (December 4 morning paroxysm; Figure 4) matches with the UV camera acquisition interval, the SO2 increases on December 3 and 5 reflect heightened degassing in between the paroxysms themselves. During December 6–8, the onset of Phase 5, volcanic activity switched from VOR to NSEC (see section Material and Methods) as illustrated by increased SO2 fluxes at NSEC (up to 3,500 t/d, and by an abrupt decline of VOR SO2 emissions (compare Figures 6b,c). An exponential decay of SO2 emissions from all craters is observed in the waning phase of the paroxysmal sequence (10–18 December) (Figures 5, 6).
Example of SO2 mass loading maps on OMI scene from some selected days are shown in Figure 7. The OMI-derived daily SO2 mass loading over Etna varies widely during Phases 1–3, but remains systematically below 1,200 tons (Figure 5D). The wide range observed (from < 100 to ~1,200 tons) is likely to reflect daily variations in the passive degassing flux from Etna, but also variations in OMI's detection of the prevailing low-altitude and low mass SO2 clouds during this period of lower intensity activity. Increases in daily cloud cover or in the position of the ORA-affected portion of OMI's swath relative to Etna can both hamper accurate quantification of SO2 mass and small plumes during lower intensity volcanic activity suffer disproportionately. That OMI did not observe SO2 mass >1,200 tons in any overpass reflects the general low level activity of Etna during this passive degassing interval.
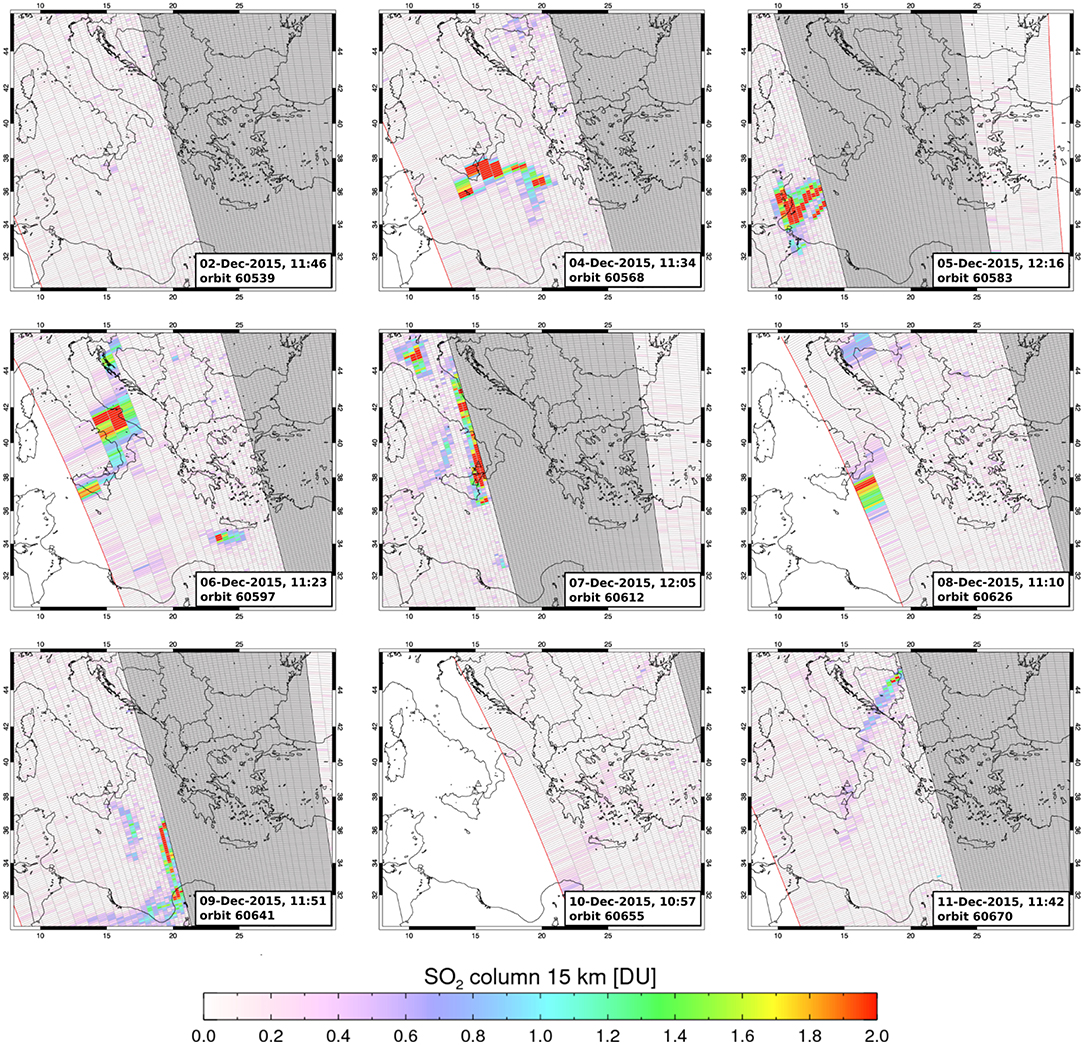
Figure 7. Individual OMI scenes for the paroxysmal period, showing SO2 column concentration in Dobson Units (i.e., the number of molecules in a square centimeter of atmosphere. If all of the Sulfur dioxide in a column of the atmosphere was compressed into a flat layer at standard temperature and pressure, one Dobson Unit would be 0.01 mm thick and would contain 0.0285 g of SO2 per square meter). OMI swath edges are shown by thin red lines, and the pixels within the swath are shown with their true geometries. Rows affected by the OMI row anomaly are highlighted in gray.
Onset of the Phase 4 paroxysmal activity marks a sizeable increase in daily SO2 mass loading on December 4 (~9,600 tons), indicating substantial SO2 injection in the higher atmosphere during the first two more vigorous VOR episodes. SO2 mass loading persists at high levels (~5,300 tons) over the next three consecutive days (5–7 December). During Phase 5, the high SO2 mass loading on December 9 reflects degassing from the erupting NSEC, but declines to pre-paroxysm levels (< 1,000 tons) by December 12.
The heightened SO2 degassing behavior of Etna in December 2015 is clearly illustrated by the plot of Figure 8, which compares the cumulative masses of degassed SO2 derived from space (OMI) and from ground (UV Camera).
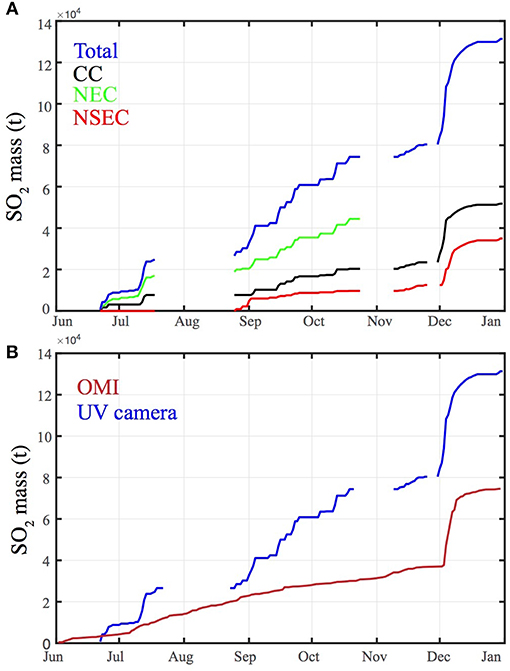
Figure 8. (A) Cumulative plot of UV camera-based SO2 masses (in tons), calculated by summing–up the daily SO2 fluxes of Figures 5A–C. (B) Comparison between camera-based and OMI-based cumulative SO2 masses. The cumulative OMI SO2 masses are obtained from summation of the daily SO2 mass loadings of Figure 5D. The camera-based SO2 cumulative trend exceeds the OMI trend in Phases 1–3, implying this latter method underestimates quiescent, low-altitude SO2 emission plumes. The two independently obtained cumulative SO2 masses are reasonable similar during the paroxysmal sequence of Phases 4–5 (see Table 1).
Between 01 July and 31 December 2015, 145 thermal anomalies are detected over Mt. Etna by the MODIS-MIROVA system (Coppola et al., 2016) (Figures 5E, 9A). The radiant heat flux spans from 0.15 MW to 4,151 MW (on 7 December 2015) with about 80% of the data below 10 MW (Figure 9B). Visual inspection of all the images allows us to discard thermal anomalies due to fires (located at more than 5 km from the summit), as well as to filter out thermal data affected by cloud/plume contamination or acquired under poor geometrical conditions (satellite zenith angle > 45°). The resulting dataset consists of 101 alerts (red line in Figure 9A), yielding a total radiant energy of 5.22 × 10¹⁴ J over the analyzed time window.
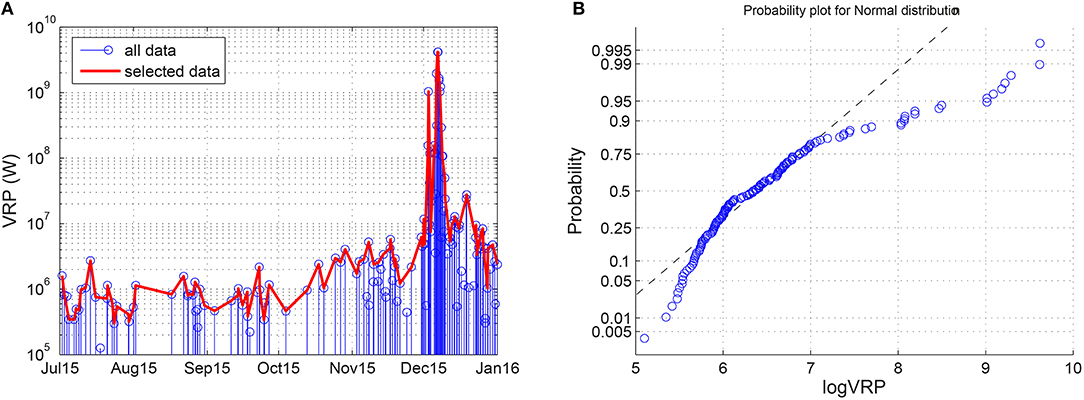
Figure 9. (A) Time series of Volcanic Radiant Power (VRP) detected by MODIS-MIROVA system over Etna volcano between July and December 2015. (B) Probability plot of log-transformed VRP (all data).
Between July and late September, during Phase 1, the radiant power is very low and relatively stable at around 1 MW (Figure 9A). However, thermal anomalies increase gradually during late October-November (Phase 2), to reach 5 MW, on 28 October 28, and 11 MW on 11 November 2015. On December 2 (Phase 3) at 21:00 (UTC), a sharp VRP increase at 155 MW coincides with the first VOR paroxysmal episode. The paroxysm itself generates a peak VRP of 1,037 MW on 3 December at 01:15 (UTC). In the following 2 days, the volcanic plume often obscures and attenuates thermal anomalies, thus precluding clear view observations of paroxysmal episodes 2–4. From December 6 (Phase 5), a new phase of increased thermal activity was detected by MIROVA, in response to lava effusion from the base of the NSEC. This phase is accompanied by a clear view of the Etna's summit area, and culminated on 7 December (00:50 UTC) with VRP reaching the maximum value of 4,151 MW (Figure 9A). Cessation of lava effusive activity in the evening of December 8 is marked by a VRP decline below 100 MW (Figures 5E, 9A). Thermal anomalies progressively declined throughout the following days, dropping to 3 MW by 31 December 2015.
Basaltic explosive eruptions are manifestly fuelled by magmatic volatiles (Vergniolle and Mangan, 2000; Taddeucci et al., 2015), so that direct measurements of volatile release during basaltic paroxysms are key to refining models for their trigger mechanisms, which are still debated (Gonnermann and Manga, 2003; Parfitt, 2004; Manga et al., 2017). Although only the third magmatic volatile in order of abundance, SO2 is the easiest to measure remotely (Oppenheimer et al., 2011), and thus represents an obvious target for gas observations during a paroxysm. However, while the SO2 budget for individual strombolian explosions is relatively straightforward to characterize (Mori and Burton, 2009; Kazahaya et al., 2011), SO2 flux measurements during the far more violent (and ash-richer) lava fountain eruptive clouds have remained challenging, to date.
On Etna, the inter-annual time-averaged SO2 flux is exceptionally well-characterized (Caltabiano et al., 1994, 2004; Allard, 1997; Allard et al., 2006), and is known to be dominated by persistent passive degassing from the summit craters. In contrast, the SO2 flux sustained by the brief but very intense paroxysmal episodes is thought to constitute only a small fraction of the long-term total emission budget. Quantifying this paroxysmal flux would nonetheless have profound implications for constraining the dynamics and trigger mechanisms of the paroxysms. It is well established that Etna's SO2 flux peaks (typically at >10,000 tons/day) during paroxysmal episodes (Caltabiano et al., 2004; Spampinato et al., 2015), but the explosive gas output from the erupting crater has proven difficult to resolve from the background quiescent emissions that persist at the other craters. Recently, we demonstrated the use of a novel network of UV cameras to obtain spatially resolved SO2 flux emission data from Etna's individual craters (D'Aleo et al., 2016). As a matter of fact, UV cameras offer improved spatial resolution over traditional spectroscopic techniques (COSPEC and scanning DOAS) that typically target a distal plume several km away from the summit area, where the two gas contributions (from the paroxysm and passive degassing) have already merged into a single aggregate plume (Salerno et al., 2009).
Our gas and thermal observations (Figures 5–9) here contribute novel constraints on degassing processes associated with Etna's December 2015 paroxysmal sequence. We show that, during the two days before the onset of the paroxysmal sequence (in Phase 3), SO2 degassing intensifies at the VOR (up to 3,500 tons/day, Figure 6). The SO2 flux results presented in Corsaro et al. (2017) imply that this SO2 flux increase (~2,600–4,300 tons/day) persisted during Phase 2 too (19 October-30 November), and therefore accompanied the entire sequence of escalating strombolian activity at VOR that occurred prior to the paroxysms. The onset of paroxysmal activity at VOR on 3 December sees a further escalation in UV camera-derived SO2 fluxes, and is also marked by an abrupt increase in OMI-derived SO2 loadings over Etna (Figures 5–7) and in radiant power (Figure 9). This anomalous SO2 output and thermal regime persists throughout the entire VOR (Phase 4) and NSEC (Phase 5) paroxysmal sequence, and then slowly decreases after 10 December, with SO2 and thermal emissions decaying to pre-paroxysm values by the end of the month.
Our results overall provide four sets of new information: (i) the SO2 flux during, prior and after a lava fountaining episode is measured for the first time, at high-temporal resolution (Figure 4; see section SO2 Flux Budget for an Individual Lava Fountain); (ii) the total SO2 budget from the eruptive sequence is fully reconstructed from both ground and space (Figure 8), leading to calculation of the associated degassing magma volumes (see section SO2 budget for the Etna's 2015 paroxysmal sequence, and calculation of magma volume fluxes); (iii) a systematic inter-comparison study between UV Camera and OMI (see section UV Camera vs. OMI) and gas- and thermal-based magma volumes (see section Magma Volume Fluxes From Satellite Thermal Data) is undertaken.
Our 4 December 2015 dataset (Figure 4) is, to the best of our knowledge, the first example of an high-frequency (0.5 Hz) SO2 flux record during a paroxysmal episode at Etna (VOR episode II). This dataset demonstrates both advantages and challenges in UV camera sensing of basaltic paroxysmal activities. Our results show that SO2 release escalates for ~1 h period prior to Etna's paroxysmal activity, peaking at ~400 kg/s at the paroxysm onset. This confirms escalating transport in the shallow conduits of gas, or perhaps of an effervescent gas-magma mixture, as the paroxysm's driver(s). Temporal SO2 flux fluctuations broadly correlated with seismic tremor and thermal amplitude (Figure 4), but are also modulated by ash content. In the most intense phase of the lava fountain (as marked by the peak in seismic tremor), the SO2 flux declines, implying severe SO2 underestimation during ash-rich periods, when plume opacity increases. In the VOR episode II example, rapid dispersion of the eruptive cloud toward SSW is an additional issue, and implies that only part of the column is contained in the cameras' FOV (this effect is minimized by taking the integration cross-section right at the crater rim edge, where the majority of the plume is captured). With these limitations in mind, we calculate by integration that 1220 ± 122 tons of SO2 is explosively released during < 2 h of vigorous VOR episode II (average flux, 169 ± 17 kg/s). To put this context, this SO2 mass corresponds to what normally released by the volcano in one full day of background quiescent activity (e.g., Phase 1 in 2015).
In a typical Etna lava fountain, SO2 comprises ~0.8 ± 0.3 mol. % of the gas phase (Allard et al., 2005; La Spina et al., 2015). From this and the paroxysmal SO2 mass of 1220 ± 122 tons (above), we estimate the total magmatic gas output for VOR episode II to be 8 ± 3.6·108 m3. In this calculation, we assume T = 1100 °C, P = 0.1 MPa, molecular weight = ~20.9 g/mol (for a 90 mol. % H2O gas composition; La Spina et al., 2015) and 45% uncertainty (based on error propagation on SO2 mass and chemical composition uncertainties). For comparison, Bonaccorso and Calvari (2017) calculated, based on processing of thermal camera images, a total fluid volume for this event of the same order of magnitude (1.5 × 10⁹ m3 of total fluid, with pyroclastic materials accounting for a trivial fraction of this volume, ~0.2 %).
VOR episodes I, III and IV (see section Etna's Eruptive Activity in June-December 2015) unfortunately occurred outside the daily UV camera acquisition hours, so that their volatile budget cannot be constrained from measurements on ground. The elevated SO2 fluxes observed on December 3 and 5 (Figure 6), therefore, are reflecting heightened quiescent (or weakly explosive) degassing in the periods between one paroxysmal episode and the successive.
We therefore place constraint on the total explosive SO2 release during the entire VOR sequence by using OMI record, which clearly peaks during Phase 4 (Figures 5, 6). OMI data are likely to fully capture eruptive gas emissions injected into the higher atmosphere, while being less sensitive to Etna's low-altitude quiescent emissions (we consider the average daily SO2 mass loading of ~500 ± 65 tons in July-October 2015 as representative of these background emissions) (see section UV Camera vs. OMI). Figure 8 enables us to estimate the cumulative SO2 mass released by the Etna's 2015 paroxysmal sequence. By summing up the SO2 mass loadings seen by OMI during December 3–6, we find a cumulative SO2 mass of ~21,000 ± 2,730 tons (Figure 8, Table 1). Thus, using this total eruptive mass (and the parameters as above for the composition and T-P conditions of the eruptive plume), we infer the total magmatic gas output for the entire Phase 4 (VOR episodes I-V) at 14 ± 0.6·109 m3. This is in the same order of magnitude of the total calculated erupted volume of fluid of Bonaccorso and Calvari (2017) (5.9·109 m3). Given the impact of the row anomaly on OMI mass loading measurements, this is likely to be a minimum estimate for the total gas output of Phase 4.
A similar approach can be used to quantify the SO2 degassing budget for the NSEC activity of Phase 5 (Table 1). Although OMI observes a composite plume from Etna, and cannot by itself distinguish the relative contributions of the distinct summit craters, the decrease in Central Crater flux measured by our UV camera network in Phase 5 gives us confidence that the SO2 mass dings measured by OMI are dominated by NSEC emissions. Using OMI data, we calculate that ~11,000 ± 1,430 tons of SO2 may have been explosively released by the NSEC during 6–9 December, from which we estimate (at same composition, temperature and pressure as above) a total magmatic gas output of ~7.2 ± 3.4·109 m3, or ~2 times less than during Phase 4. Again, given the influence of the ORA obscuring part of the plume detected by OMI, this is likely to be a minimum estimate of gas output.
One equally important exercise is to use the above-inferred erupted SO2 masses to calculate the volumes of degassing magmas required to produce them (e.g., the magma volume necessary to provide the gaseous content to drive the fountaining). In order to convert the SO2 masses (MSO2) into volumes of magma (Ve) needed to justify them, we use the same relation as in Allard (1997):
where [S] is the weight fraction of elemental sulfur degassed per unit mass of magma (3,000 mg/kg, from glass inclusion record; Métrich et al., 2004), ρ is typical basalt density (2700 kg/m3) and x is magma crystallinity (0.3; see Pompilio et al., 2017). We infer the uncertainty on the estimated magma volumes to be 15–18%, based on errors on either UV-camera (10%) or OMI-derived (13%) masses, and uncertainty in initial sulfur content in magma (5%). We caution these 15–18% errors are likely to correspond to minimum uncertainties, because melt-inclusion information on pre-eruptive S contents for this specific 2015 activity phase is currently unavailable, and because best-guess values for “typical” density and crystallinity of Etna's magmas are assumed throughout.
Using equation (2) and OMI-based SO2 masses, we find that a degassing magma volume of only ~1.9 ± 0.3 Mm3 (Table 1) is required to justify SO2 emissions during VOR activity (Phase 4). This is well below the erupted pyroclastic volume for 3–5 December, for which available estimates range between 5.1 Mm3 (Vulpiani et al., 2016; Pompilio et al., 2017), 7.1-7.2 Mm3 (Corsaro et al., 2017; Neri et al., 2017) and 12 Mm3 (Bonaccorso and Calvari, 2017) (Table 1). We consider this mismatch as only partially justifiable by OMI underestimating the real SO2 emissions, and interpret it instead as an evidence for that only a small fraction (8-33 %) of the erupted magma was actually emplaced above the SO2 degassing depth (~ 3 km below the summit; Spilliaert et al., 2006) during the VOR paroxysm(s). We argue thus that a large (77–92 %) fraction of the erupted magma was already degassed (SO2-poor) at the time of the paroxysm(s), likely because it had remained stored in the shallow (< 3 km) VOR conduit for days before the paroxysm. This interpretation is well consistent with textural and compositional features of Phase 4 ash particles (Pompilio et al., 2017), whose heterogeneity indicates coexistence in the VOR conduit of variably degassed/crystalline/viscous magma volumes that had been emplaced somewhere between hours to several days before. We calculate that, at the average magma shallow emplacement rate of 0.2 ± 0.02 to 0.4 ± 0.04 Mm3/day (implicit in the SO2 flux release of 2600 ± 260 to 4300 ± 430 tons/day in Phases 2–3) (Table 1), 9 to 45 days would have been required to accumulate, in the VOR conduits, the missing magma volume (the difference between the erupted and the syn-eruptive degassing magma). This 9–45 day interval is consistent with the total duration of the VOR activity observed from 19 October (43 days in total).
We conclude that the VOR paroxysmal phase in December 2015 was likely driven by progressive re-mobilization and eruption of degassed conduit magma, emplaced days to even >1 month before the onset of eruption. The ascent of fresh magma, perhaps corresponding to our syn-paroxysm ~1.9 ± 0.3 Mm3 magma volume, is the most likely trigger for destabilization of resident conduit magma, as invoked on completely independent basis by Pompilio et al. (2017). We finally argue that this mechanism may not be exclusive to the VOR paroxysmal sequence in 2015. For instance, a similar mismatch was observed for the ensuing NSEC activity between the co-paroxysmal degassing magma volume (~0.6 ± 0.1 Mm3) and the erupted (~2 ± 0.3 Mm3) magma volume (Table 1).
Our 2015 dataset also allows testing the level of agreement between ground-based and satellite-derived SO2 emission observations (Figure 8). Inter-comparison studies between ground- and satellite-based measurements of SO2 emissions are relatively sparse, and due to differences in sensitivity to SO2 and the spatial/temporal duration and resolution of each measurement type, strong quantitative agreement is limited to certain ideal cases, e.g., estimates of long-term emissions budgets where short-term variability of SO2 fluxes are suppressed (Carn et al., 2017).
In our specific Etna example, we caution that direct comparison between UV camera and OMI datasets is challenging, since the two measurement types target volcanic SO2 emissions on distinct temporal/spatial timescales and good quantitative correlation is therefore unlikely. UV camera SO2 measurements have very high temporal/spatial resolution, but observations are limited to only 5 h per day. Whether or not these 5 h of observations can confidently be extrapolated to quantify the total SO2 mass degassed in a daily—to become then comparable to the daily SO2 mass loadings delivered by OMI—depends on how dynamic and changeable the volcano's activity state is. While the operation is probably relatively safe in “calm” days of quiescent degassing (e.g., our Phase 1), it becomes more problematic when the volcano behavior changes dramatically within a day, as during the Phase 4–5 paroxysmal sequence. For example, measurements taken on December 4 encompass 2 h of intense fountaining and vigorous degassing that raise the mean SO2 flux at 160 ± 16 kg/s. This, if extrapolated over the entire measurement day, would lead to a daily output of ~14,000 ± 1,400 tons, exceeding the OMI SO2 mass measured on the following day (~5,400 ± 780 tons). In contrast, on December 3 and 5, the paroxysmal episodes occurred outside the UV camera measurement interval. Since the UV-derived mean fluxes (respectively, ~82 and ~22 kg/s) thus miss the paroxysmal gas contributions, their extrapolated masses (7,080 and 1,917 tons) do likely under-estimate the real daily SO2 output, and are unsurprisingly lower than the OMI-derived mass loading (10,000 ± 1,300 and 5,500 ± 720 tons for December 3 and 5, respectively). We thus find it more prudent to use OMI data for calculation of total eruptive gas masses and degassing magma volumes (see section SO2 budget for the Etna's 2015 Paroxysmal Sequence, and Calculation of Magma Volume Fluxes). Still, we note that eruptive gas masses and degassing magma volumes obtained from UV Camera data for Phase 4 are remarkably close (Table 1), implying that the above discussed effects cancel out over the entire paroxysmal sequence (3 days).
On the other hand, our results suggest OMI may under-estimate more sluggish SO2 quiescent emissions, at least in the conditions of our Phase 1–2 (see Figure 8). Over the 3 months period covered by Phase 1, for example, the cumulative mass loadings derived from OMI are nearly one order of magnitude lower than those measured on ground from the UV camera (Table 1). The sensitivity of ultraviolet satellite observations to atmospheric SO2 are strongly altitude dependent, and underestimates of SO2 mass loadings are relatively common for lower tropospheric plumes due to higher SO2 detection limits (e.g., McCormick et al., 2012; Carn et al., 2013).
We conclude that ground-based and satellite-based SO2 flux observations are complementary in monitoring basaltic volcanoes. While UV-camera measurements are more effective in monitoring quiescent emissions, and perhaps more useful to capture pre-paroxysm escalation in degassing activity (see Figure 4, and results in Corsaro et al., 2017), satellites become invaluable during paroxysmal explosive eruptions. Over longer intervals (timescales of several months), the SO2 degassing histories registered by the two independent monitoring tools show similar overall trends (Figure 8).
Satellite thermal IR data also potentially offer the opportunity to quantify the volumes of magma reaching the surface, before, during and after the paroxysmal sequence. The conversion between thermal and volumetric fluxes is based on the observed relationships between effusion rates and active lava flow areas [see Harris and Baloga (2009) for a review]. Various approaches have been proposed to adapt this methodology to satellite thermal data (i.e., Harris et al., 1998; Wright et al., 2001; Coppola et al., 2013), all aimed at calibration of a simple linear relationship between space-based radiant flux (for example the VRP) and the Time Averaged lava Discharge Rate (TADR).
The relationship can be written as:
where crad is a conversion coefficient empirically calculated (e.g., Coppola et al., 2013) or based on cooling models of active lava flows (e.g., Harris and Ripepe, 2007).
Here we used the values for crad calibrated during previous effusive eruptions of Mt. Etna (Coppola et al., 2013, 2016), that indicate a range between 2·108 J/m3 and 3.6·108 J/m3. According to equation (3), these two values allow us to estimate a maximum and minimum TADR, and consequently a range of erupted lava volumes. This methodology provides results in excellent agreement with field estimates (cf. Harris et al., 2007, 2011) and, once calibrated (as for at Etna), it allows us to assess erupted volume during effusive activity within ±30% uncertainty (Coppola et al., 2016, 2017).
On the other hand, it is important to highlight some limitations and assumptions of the thermal proxy, if applied to periods that include different types of volcanic activity (such as at Etna in late 2015):
1) A volume calculated using the thermal approach is based on the implicit assumption that the heat flux is generated by an active lava flow (cf. Coppola et al., 2013). Consequently, the model breaks down when the lava is not extruded but instead retained in the vent, as in the case of lava lakes or open-vent activity. In such circumstances, the thermal proxy provides a minimum estimate of the magma circulation (convection) at very shallow depth, rather than effusion rates, as long as the top of the magma column is sufficiently shallow to produce thermal anomalies on the surface (Werner et al., 2017; Aiuppa et al., 2018);
2) The coefficient crad is expressly calibrated for effusive (lava-flow-forming) eruptions (Coppola et al., 2016), and it does not necessarily work during explosive eruptions (i.e., paroxysms). During explosive eruptions, the heat flux detected by satellite is sourced by the lava fountains themselves and by the accumulation of intra-crateric material forming reomorphic lava bodies. In these cases, the relationship between erupted volumes and thermal energy is strongly altered by the complexity of the mixed heat source (lava fountains and reomorphic flows). In addition, the thermal approach does not allow us to estimate the volumes of tephra produced by explosive activity;
3) Accurate processing requires filtering out data contaminated by clouds, and/or acquired with extreme viewing angles. Alternatively, the maximum daily or weekly average (considering all data) can produce appropriate but less accurate estimates.
The application of equation (3) to the selected MIROVA dataset allows calculating a total volume of lava equal to 2.0 ± 0.6 Mm3 (Figure 10). However, based on the observed activity the interpretation of the calculated volume is subdivided according the distinct phases of activity:
- Phases 1–3 (01 July- 02 December 2015). During this phase we calculate that ~0.1 ± 0.03 Mm3 of magma reached the bottom of the summit craters, before being recycled back into Etna's shallow plumbing system (Table 1). Thus, the average TADR (0.005 m3/s) represents the fraction of the total degassing magma flux that actually reached the surface and radiated heat into the atmosphere. However, most of the degassing magma remains some tens or hundreds of meters below the surface (or more), and therefore does not contribute to the surface thermal anomaly. It is unsurprising that, if we use a cumulative degassed SO2 mass of 80,000 ± 8,000 tons (Table 1) for this period (time-averaged SO2 flux of ~1,700 ± 221 tons/day), in combination with eq. 2, we obtain a much higher magma degassing volume (~7 ± 1.1 Mm3; magma degassing rate, ~6 ± 0.9 m3/s; Table 1). Notably, between October and November 2015, the thermal-derived magma flux reaching the surface has gradually increased, likely reflecting the shallowing of the top of the magma column that preceded the onset of the paroxysmal phase (Figure 10). The beginning of intense strombolian activity, observed on 2 December at 21:00 (UTC) was marked by a TADR equal to 0.6 ± 0.2 m3/s that could represent a transition between open-vent passive degassing to explosive/effusive activity.
- Phase 4 (03–05 December 2015). In < 48 h, four consecutive paroxysms occurred at the summit craters of Etna. The plumes generated by this explosive activity often masked the thermal anomalies associated with the lava fountains and the incandescent material accumulated inside the VOR and BN craters. The thermal proxy applied during this phase indicates a minimum volume of ~0.2 ± 0.06 Mm3 (Table 1), but this figure severely underestimates both the SO2-based (~1.9 ± 0.3 Mm3) and erupted (5.1–12 Mm3) volumes (Table 1);
- Phase 5 (06–08 December 2015). During this phase, three small lava flows were emitted from a vent that opened at the base of the NSEC crater (Corsaro et al., 2017). The maximum TADR (16 ± 0.6 m3/s) was reached in the night between 6 and 7 December, when the lava flow reached a maximum extent of ~3.5 km. Based on MODIS data we estimate a total volume of ~1.7 ± 0.6 Mm3 which agrees well with independent field estimates (2.0 ±0.3 Mm3; Corsaro et al., 2017).
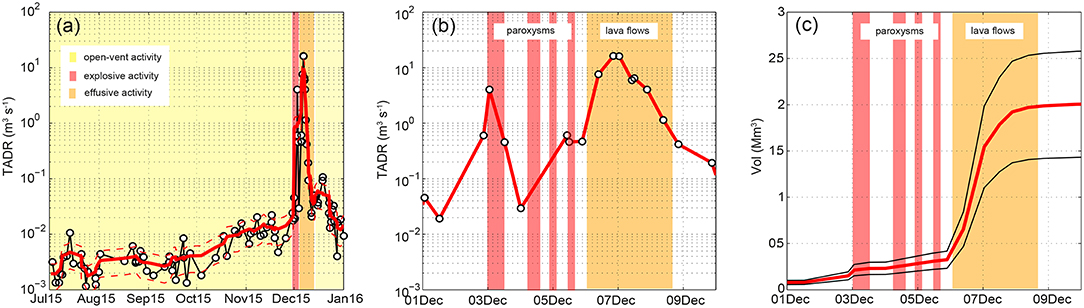
Figure 10. (a) Time Averaged lava Discharge Rate (TADR) calculated from MODIS-MIROVA thermal data using equation (3). Note the apparent increase of TADR during October-November that precede the explosive and effusive phases (b) Detail of MODIS-derived TADR during the four paroxysms (red field) and the effusive activity (orange field). (c) Detail of MODIS-derived volume retrieved during the first 10 days of December 2015.
Our results indicate that integrating multidisciplinary information from both ground and space, and including gas, thermal and seismic records, is key to unrevealing the complexities of the trigger mechanisms of basaltic paroxysms. The advent of high-rate UV Camera observations is now opening the way to real-time monitoring the volcanic SO2 flux behavior at the quiescence-to-explosive transition (Figure 4). Our Etna results, although preliminary, suggest that individual lava fountain episodes can be preceded by detectable SO2 flux escalation (Figure 4). We stress that similar high-temporal resolution SO2 flux time-series, possibly streamed in real-time by permanent UV Camera systems, are now urgently needed at other basaltic systems. At volcanic systems with multiple active vents (such as Etna and many others), the high spatial resolution offered by UV Cameras is vital to resolving explosive from passive gas emissions, and thus to obtaining accurate gas-based estimates of gas/magma budgets for individual explosions and/or paroxysmal sequences. However, comparison with independently derived gas/magma budgets, from satellites (both SO2 and thermal) and from measurements of erupted pyroclastic materials on ground, is key to interpretation.
We combine ground- and satellite-based information to characterize, with unprecedented detail, the SO2 degassing behavior associated with an Etna's paroxysmal sequence. The high-temporal/spatial resolution of UV Cameras allows us to obtain the first (at least to our knowledge) high-rate (0.5 Hz) records of the SO2 flux during a basaltic lava fountaining episode. Our results demonstrate a factor ~4 SO2 flux escalation prior to the fountain's onset (when SO2 peaks at ~400 ± 40 kg/s), confirming that magmatic volatiles are drivers of these events. We also constrain the total magmatic gas output during such a paroxysm at 8 ± 3.6·108 m3. We anticipate that these SO2-based estimates for the magmatic phase volume will now serve for better initializing/constraining models for the generation of basaltic explosive events.
Based on satellite-based OMI observations, we estimate that at least 21,000 ± 2,730 tons of SO2 may have been injected into the atmosphere during the entire VOR paroxysmal sequence, corresponding to a total magmatic gas output of 14 ± 0.6·109 m3. We also infer that the degassing magma required to generate the ~21,000 ± 2,730 tons of SO2 is ~1.9 ± 0.3 Mm3, or much less than the 5.1–12 Mm3 erupted volume. This mismatch is used to derive novel constraints of mechanisms governing the generation of the paroxysms. In particular, we suggest that a large fraction of magma erupted during the December 3–5 VOR paroxysms was shallow stored conduit magma, emplaced and degassed in the days (9 to 45) before the sequence onset. The paroxysmal sequence was also associated with an abrupt increase in thermal radiance, as observed by MODIS. Analysis of these data reveals a magma source of ~0.2 ± 0.06 Mm3, suggesting that the thermal proxy considerably underestimates the paroxysmal pyroclastic volume.
Our study also brings additional evidence for the ability of UV Camera systems to resolve switch in activity between different vents. In the December 2015 example, VOR paroxysms are followed by an activity switch to the NSEC, fully captured by the UV camera network. Based on OMI records, the NSEC activity released at least ~7.2 ± 3.4·109 m3 of gas, or a factor of 2 less than VOR activity. The MODIS thermal data constrain a magmatic infrared radiation source with a volume of 1.7 ± 0.6 Mm3, fitting well the lava erupted volume of ~2 ± 0.3 Mm3. Inverting MODIS data to lava volumes is more accurate during episodes with some effusive activity.
AA, MB, DD, GT, and RD conceived the idea. RD, MB, DD, GT, MC, and EP conducted the field experiments. RD, DD, DC, BM, LS, MC, and EP processed the data. AA, RD, DC, BM, EP, MC, and MR drafted the manuscript with help from all co-authors.
The research leading to these results has received funding from the European Research Council under the European Union's Seventh Framework Program (FP7/2007/2013)/ERC grant agreement n 305377 (PI, AA).
The authors declare that the research was conducted in the absence of any commercial or financial relationships that could be construed as a potential conflict of interest.
We wish to thank E. Privitera (Director of INGV-OE) and the INGV-OE staff for support to installation and maintenance of the UV3 camera system. The INGV-OE Unità Funzionale Sismologia is particularly acknowledged for providing seismic tremor data. Ente Parco dell'Etna is acknowledged for granting access to the volcano summit.
The Supplementary Material for this article can be found online at: https://www.frontiersin.org/articles/10.3389/feart.2018.00239/full#supplementary-material
Table S1. Data.csv contains the data used to generate Figure 5 (per-orbit SO2 mass loading from OMI, daily mean SO2 emission rate from the UV camera network, and per-orbit radiant power from MODIS and the ground-based thermal camera network). Further data used in this study are available from the authors upon request. The satellite- and ground-based SO2 data we present herein will ultimately be stored in a bespoke gas emissions data repository, currently being developed as a collaboration between the International Earth Data Alliance (IEDA) and the Deep Carbon Observatory DECADE programme (http://decade.iedadata.org/).
Figure S1. Time series of (A) mean reflectivity (in %) and (B) the daily SO2 mass burden (in tons) measured by OMI.
Aiuppa, A., Cannata, A., Cannavò, F., Di Grazia, G., Ferrari, F., Giudice, G., et al. (2010). Patterns in the recent 2007-2008 activity of mount etna volcano investigated by integrated geophysical and geochemical observations. Geochem. Geophys. Geosyst. 11, 1–13. doi: 10.1029/2010GC003168
Aiuppa, A., de Moor, M. J., Arellano, S., Coppola, D., Francofonte, V., Galle, B., et al. (2018). Tracking formation of a lava lake from ground and space: masaya volcano (Nicaragua), 2014–2017. Geochem. Geophys. Geosyst. 19, 496–515. doi: 10.1002/2017GC007227
Albert, H., Costa, F., and Martí, J. (2016). Years to weeks of seismic unrest and magmatic intrusions precede monogenetic eruptions. Geology 44, 211–214. doi: 10.1130/G37239.1
Allard, P. (1997). Endogenous magma degassing and storage at mount etna. Geophys. Res. Lett. 24, 2219–2222. doi: 10.1029/97GL02101
Allard, P., Behncke, B., D'Amico, S., Neri, M., and Gambino, S. (2006). Mount etna 1993-2005: anatomy of an evolving eruptive cycle. Earth-Sci. Rev. 78, 85–114. doi: 10.1016/j.earscirev.2006.04.002
Allard, P., Burton, M., and Muré, F. (2005). Spectroscopic evidence for a lava fountain driven by previously accumulated magmatic gas. Nature 433, 407–410. doi: 10.1038/nature03246
Allard, P., Burton, M., Sawyer, G., and Bani, P. (2016). Degassing dynamics of basaltic lava lake at a top-ranking volatile emitter: ambrym volcano, vanuatu arc. Earth Planet Sci. Lett. 448, 69–80. doi: 10.1016/j.epsl.2016.05.014
Aloisi, M., D'Agostino, M., Dean, K. G., Mostaccio, A., and Neri, G. (2002). Satellite and PUFF simulation of the eruptive cloud generated by the Mount Etna paroxysm of 22 July 1998. J. Geophys. Res. Solid Earth 107, ECV 9-1–ECV 9-12. doi: 10.1029/2001JB000630
Alparone, A., Andronico, D., Sgroi, T., Ferrari, F., Lodato, L., and Reitano, D. (2007). Alert system to mitigate tephra fallout hazards at Mt. Etna volcano, Italy. Nat. Hazards 43, 333–350. doi: 10.1007/s11069-007-9120-7
Alparone, S., Andronico, D., Lodato, L., and Sgroi, T. (2003). Relationship between tremor and volcanic activity during the Southeast crater eruption on Mount Etna in early 2000. J. Geophys. Res. Solid Earth 108, 1–13. doi: 10.1029/2002JB001866
Andò, B., and Pecora, E. (2006). An advanced video-based system for monitoring active volcanoes. Comput. Geosci. 32, 85–91. doi: 10.1016/j.cageo.2005.05.004
Andres, R. J., and Schmid, J. W. (2001). The effects of volcanic ash on COSPEC measurements. J. Volcanol. Geotherm. Res. 108, 237–244. doi: 10.1016/S0377-0273(00)00288-2
Andronico, D., and Corsaro, R. A. (2011). Lava fountains during the episodic eruption of South–East Crater (Mt. Etna), 2000: insights into magma-gas dynamics within the shallow volcano plumbing system. Bull Volcanol. 73, 1165–1178. doi: 10.1007/s00445-011-0467-y
Behncke, B., Branca, S., Corsaro, R. A., De Beni, E., Miraglia, L., and Proietti, C. (2014). The 2011-2012 summit activity of Mount Etna: birth, growth and products of the new SE crater. J. Volcanol. Geotherm. Res. 270, 10–21. doi: 10.1016/j.jvolgeores.2013.11.012
Behncke, B., Falsaperla, S., and Pecora, E. (2009). Complex magma dynamics at Mount Etna revealed by seismic, thermal, and volcanological data. J. Geophys. Res. Solid Earth 114:B03211. doi: 10.1029/2008JB005882
Behncke, B., Neri, M., Pecora, E., and Zanon, V. (2006). The exceptional activity and growth of the southeast crater, Mount Etna (Italy), between 1996 and 2001. Bull Volcanol. 69, 149–173. doi: 10.1007/s00445-006-0061-x
Bonaccorso, A. (2014). Eruptive processes leading to the most explosive lava fountain at Etna volcano: the 23 November 2013 episode. Geophys. Res. Lett. 41, 4912–4919. doi: 10.1002/2014GL060623
Bonaccorso, A., Bonforte, A., Calvari, S., Del Negro, C., Di Grazia, G., Ganci, G., et al. (2011). The initial phases of the 2008-2009 Mount Etna eruption: a multidisciplinary approach for hazard assessment. J. Geophys. Res. Solid Earth 116, 1–19. doi: 10.1029/2010JB007906
Bonaccorso, A., and Calvari, S. (2013). Major effusive eruptions and recent lava fountains: Balance between expected and erupted magma volumes at Etna volcano. Geophys. Res. Lett. 40, 6069–6073. doi: 10.1002/2013GL058291
Bonaccorso, A., and Calvari, S. (2017). A new approach to investigate an eruptive paroxysmal sequence using camera and strainmeter networks: lessons from the 3–5 December 2015 activity at Etna volcano. Earth Planet. Sci. Lett. 475, 231–241. doi: 10.1016/j.epsl.2017.07.020
Bruhn, A., Weickert, J., and Schörr, C. (2005). Lucas / Kanade Meets Horn / Schunck : combining local and global optic flow methods. Int. J. Comput. Vis. 61, 211–231. doi: 10.1023/B:VISI.0000045324.43199.43
Burton, M. R., Caltabiano, T., Murè, F., Salerno, G., and Randazzo, D. (2009). SO2 flux from Stromboli during the 2007 eruption: results from the FLAME network and traverse measurements. J. Volcanol. Geotherm. Res. 182, 214–220. doi: 10.1016/j.jvolgeores.2008.11.025
Burton, M. R., Salerno, G. G., D'Auria, L., Caltabiano, T., Murè, F., and Maugeri, R. (2015). SO2 flux monitoring at stromboli with the new permanent INGV SO2 camera system: a comparison with the FLAME network and seismological data. J. Volcanol. Geotherm. Res. 300, 95–102. doi: 10.1016/j.jvolgeores.2015.02.006
Caltabiano, T., Burton, M., Giammanco, S., Allard, P., Bruno, N., Murè, F., et al. (2004). “Volcanic gas emissions from the summit craters and flanks of Mt. Etna, 1987–2000,” in Mt. Etna: Volcano Laboratory (Washington, DC: American Geophysical Union), 111–128. doi: 10.1029/GM143
Caltabiano, T., Romano, R., and Budetta, G. (1994). SO2 flux measurements at Mount Etna (Sicily). J. Geophys. Res. Atmos 99, 12809–12819. doi: 10.1029/94JD00224
Calvari, S., Salerno, G. G., Spampinato, L., Gouhier, M., La Spina, A., Pecora, E., et al. (2011). An unloading foam model to constrain Etna's 11-13 January 2011 lava fountaining episode. J. Geophys. Res. Solid Earth 116, 1–18. doi: 10.1029/2011JB008407
Carbone, D., Zuccarello, L., Messina, A., Scollo, S., and Rymer, H. (2015). Balancing bulk gas accumulation and gas output before and during lava fountaining episodes at Mt. Etna. Sci. Rep. 5:18049. doi: 10.1038/srep18049
Carn, S. A., Clarisse, L., and Prata, A. J. (2016). Multi-decadal satellite measurements of global volcanic degassing. J. Volcanol. Geotherm. Res. 311, 99–134. doi: 10.1016/j.jvolgeores.2016.01.002
Carn, S. A., Fioletov, V. E., Mclinden, C. A., Li, C., and Krotkov, N. A. (2017). A decade of global volcanic SO2emissions measured from space. Sci. Rep. 7, 1–12. doi: 10.1038/srep44095
Carn, S. A., Krotkov, N. A., Yang, K., and Krueger, A. J. (2013). Measuring global volcanic degassing with the ozone monitoring instrument (OMI). Geol. Soc. London Spec. Publ. 380, 229–257. doi: 10.1144/SP380.12
Carn, S. A., Krueger, A. J., Arellano, S., Krotkov, N. A., and Yang, K. (2008). Daily monitoring of ecuadorian volcanic degassing from space. J. Volcanol. Geotherm. Res. 176, 141–150. doi: 10.1016/j.jvolgeores.2008.01.029
Carn, S. A., Yang, K., Prata, A. J., and Krotkov, N. A. (2015). Extending the long-term record of volcanic SO2 emissions with the ozone mapping and profiler suite nadir mapper. Geophys. Res. Lett. 42, 925–932. doi: 10.1002/2014GL062437
Chouet, B., and Dawson, P. (2015). Seismic source dynamics of gas-piston activity at Kilauea Volcano Hawai'i. J. Geophys. Res. Solid Earth 120, 2525–2560. doi: 10.1002/2014JB011789
Coltelli, M., Carlo, P., and Del Vezzoli, L. (1998). Discovery of a Plinian basaltic eruption of Roman age at Etna volcano, Italy. Geology 26, 1095–1098. doi: 10.1130/0091-7613(1998)026<1095:DOAPBE>2.3.CO;2
Coltelli, M., d'Aranno, J. P., de Bonis, R., Guerrero Tello, F. J., Marsella, M., Nardinocchi, C., et al. (2017). The use of surveillance cameras for the rapid mapping of lava flows: an application to Mount Etna Volcano. Remote Sens. 9:192. doi: 10.3390/rs9030192
Coppola, D., Di Muro, A., Peltier, A., Villeneuve, N., Ferrazzini, V., Favalli, M., et al. (2017). Shallow system rejuvenation and magma discharge trends at piton de la Fournaise volcano (La Réunion Island). Earth Planet Sci. Lett. 463, 13–24. doi: 10.1016/j.epsl.2017.01.024
Coppola, D., Laiolo, M., Cigolini, C., Delle Donne, D., and Ripepe, M. (2016). Enhanced volcanic hot-spot detection using MODIS IR data: results from the MIROVA system. Geol. Soc. London Spec. Publ. 426, 181–205. doi: 10.1144/SP426.5
Coppola, D., Laiolo, M., Piscopo, D., and Cigolini, C. (2013). Rheological control on the radiant density of active lava flows and domes. J. Volcanol. Geoth. Res. 249, 39–48. doi: 10.1016/j.jvolgeores.2012.09.005
Corsaro, R. A., Andronico, D., Behncke, B., Branca, S., Caltabiano, T., Ciancitto, F., et al. (2017). Monitoring the December 2015 summit eruptions of Mt. Etna (Italy): implications on eruptive dynamics. J. Volcanol. Geotherm. Res. 341, 53–69 doi: 10.1016/j.jvolgeores.2017.04.018
Corsaro, R. A., and Pompilio, M. (2004). “Dynamics of Magmas at Mount Etna,” in Mt. Etna: Volcano Laboratory (Washington, DC: American Geophysical Union), 91–110. doi: 10.1029/GM143
D'Aleo, R., Bitetto, M., Donne, D. D., Tamburello, G., Battaglia, A., Coltelli, M., et al. (2016). Spatially resolved SO2 flux emissions from Mt Etna. Geophys. Res. Lett. 43, 7511–7519. doi: 10.1002/2016GL069938
Dalton, M. P., Waite, G. P., Watson, I. M., and Nadeau, P. A. (2010). Multiparameter quantification of gas release during weak strombolian eruptions at Pacaya Volcano, Guatemala. Geophys. Res. Lett. 37:L09303. doi: 10.1029/2010GL042617
De Beni, E., Behncke, B., Branca, S., Nicolosi, I., Carluccio, R., D'Ajello Caracciolo, F., et al. (2015). The continuing story of Etna's new southeast crater (2012-2014): evolution and volume calculations based on field surveys and aerophotogrammetry. J. Volcanol. Geotherm. Res. 303, 175–186. doi: 10.1016/j.jvolgeores.2015.07.021
Delle Donne, D., Tamburello, G., Aiuppa, A., Bitetto, M., Lacanna, G., D'Aleo, R., et al. (2017). Exploring the explosive-effusive transition using permanent ultra-violet cameras. J. Geophys. Res. Solid Earth 122, 4377–4394. doi: 10.1002/2017JB014027
Donnadieu, F., Freville, P., Hervier, C., Coltelli, M., Scollo, S., Prestifilippo, M., et al. (2016). Near-source Doppler radar monitoring of tephra plumes at Etna. J. Volcanol. Geotherm. Res. 312, 26–39, doi: 10.1016/j.jvolgeores.2016.01.009
Dubosclard, G., Donnadieu, F., Allard, P., Cordesses, R., Hervier, C., Coltelli, M., et al. (2004). Doppler radar sounding of volcanic eruption dynamics at Mount Etna. Bull. Volcanol. 66, 443–456. doi: 10.1007/s00445-003-0324-8
Eatough, D. J., Caka, F. M., and Farber, R. J. (1994). The conversion of SO2 to sulfate in the atmosphere. Isr. J. Chem. 34, 301–314. doi: 10.1002/ijch.199400034
Faloona, I., Conley, S. A., Blomquist, B., Clarke, A. D., Kapustin, V., Howell, S., et al. (2009). Sulfur dioxide in the tropical marine boundary layer: dry deposition and heterogeneous oxidation observed during the Pacific atmospheric sulfur experiment. J. Atmos. Chem. 63, 13–32. doi: 10.1007/s10874-010-9155-0
Fioletov, V. E., McLinden, C. A., Krotkov, N., Li, C., Joiner, J., Theys, N., et al. (2016). A global catalogue of large SO 2 sources and emissions derived from the ozone monitoring instrument. Atmos. Chem. Phys. 16:11497. doi: 10.5194/acp-16-11497-2016
Flower, V. J. B., and Carn, S. A. (2015). Characterising volcanic cycles at soufriere hills volcano, montserrat: time series analysis of multi-parameter satellite data. J. Volcanol. Geotherm. Res. 304, 82–93. doi: 10.1016/j.jvolgeores.2015.07.035
Flower, V. J. B., Oommen, T., and Carn, S. A. (2016). Improving global detection of volcanic eruptions using the Ozone Monitoring Instrument (OMI). Atmos. Meas. Tech. 9:5487. doi: 10.5194/amt-9-5487-2016
Galle, B., Johansson, M., Rivera, C., Zhang, Y., Kihlman, M., Kern, C., et al. (2010). Network for observation of volcanic and atmospheric change (NOVAC)—a global network for volcanic gas monitoring: network layout and instrument description. J. Geophys. Res. 115:D05304. doi: 10.1029/2009JD011823
Gambino, S., Cannata, A., Cannavò, F., La Spina, A., Palano, M., Sciotto, M., et al. (2016). The unusual 28 December 2014 dike-fed paroxysm at Mount Etna: timing and mechanism from a multidisciplinary perspective. J. Geophys. Res. Solid Earth 121, 2037–2053. doi: 10.1002/2015JB012379
Global Volcanism Program (2013). Volcanoes of the World, v. 4.6.5, eds, Venzke, E. (Smithsonian Institution). https://dx.doi.org/10.5479/si.GVP.VOTW4-2013 doi: 10.5479/si.GVP.VOTW4-2013 (Accessed 22 Jan, 2018).
Gonnermann, H. M., and Manga, M. (2003). Explosive volcanism may not be an inevitable consequence of magma fragmentation. Nature 426, 432–435. doi: 10.1038/nature02138
Harris, A., and Ripepe, M. (2007). Synergy of multiple geophysical approaches to unravel explosive eruption conduit and source dynamics - a case study from Stromboli. Chemie. Der. Erde. Geochem. 67, 1–35. doi: 10.1016/j.chemer.2007.01.003
Harris, A., Steffke, A., Calvari, S., and Spampinato, L. (2011). Thirty years of satellite-derived lava discharge rates at Etna: Implications for steady volumetric output. J. Geophys. Res. Solid Earth 116:B08204. doi: 10.1029/2011JB008237
Harris, A. J. L., and Baloga, S. M. (2009). Lava discharge rates from satellite-measured heat flux. Geophys. Res. Lett. 36:L19302. doi: 10.1029/2009GL039717
Harris, A. J. L., Dehn, J., and Calvari, S. (2007). Lava effusion rate definition and measurement: a review. Bull. Volcanol. 70:1. doi: 10.1007/s00445-007-0120-y
Harris, A. J. L., Flynn, L. P., Keszthelyi, L., Mouginis-Mark, P. J., Rowland, S. K., and Resing, J. A. (1998). Calculation of lava effusion rates from Landsat TM data. Bull. Volcanol. 60, 52–71. doi: 10.1007/s004450050216
Harris, A. J. L., and Neri, M. (2002). Volumetric observations during paroxysmal eruptions at Mount Etna: pressurized drainage of a shallow chamber or pulsed supply? J. Volcanol. Geotherm. Res. 116, 79–95. doi: 10.1016/S0377-0273(02)00212-3
Holland, A. S. P., Watson, I. M., Phillips, J.-C., Caric- chi, L., and Dalton, M. P. (2011). Degassing processes during lava dome growth: insights from santiaguito lava dome, guatemala. J. Volcanol. Geoth. Res. 202, 153–166, doi: 10.1016/j.jvolgeores.2011.02.004
Houghton, B. F., Wilson, C. J. N., Del Carlo, P., Coltelli, M., Sable, J. E., and Carey, R. (2004). The influence of conduit processes on changes in style of basaltic plinian eruptions: Tarawera 1886 and Etna 122 BC. J. Volcanol. Geotherm. Res. 137, 1–14. doi: 10.1016/j.jvolgeores.2004.05.009
Kahl, M., Chakraborty, S., Pompilio, M., and Costa, F. (2015). Constraints on the nature and evolution of the magma plumbing system of Mt. Etna volcano (1991-2008) from a combined thermodynamic and kinetic modelling of the compositional record of minerals. J. Petrol. 56, 2025–2068. doi: 10.1093/petrology/egv063
Kantzas, E. P., McGonigle, J. S., Tamburello, G., Aiuppa, A., and Bryant, R. G. (2010). Protocols for UV camera volcanic SO2 measurements. J. Volcanol. Geotherm. Res. 194, 55–60. doi: 10.1016/j.jvolgeores.2010.05.003
Kazahaya, R., Mori, T., Takeo, M., Ohminato, T., Urabe, T., and Maeda, Y. (2011). Relation between single very long period pulses and volcanic gas emissions at Mt. Asama, Japan. Geophys. Res. Lett. 38:L11307. doi: 10.1029/2011GL047555
Kern, C., Sutton, J., Elias, T., Lee, L., Kamibayashi, K., Antolik, L., et al. (2015). An automated SO2 camera system for continuous, real-time monitoring of gas emissions from Kilauea Volcano's summit Overlook Crater. J. Volcanol. Geotherm. Res. 300, 81–94. doi: 10.1016/j.jvolgeores.2014.12.004
La Spina, A., Burton, M., Allard, P., Alparone, S., and Muré, F. (2015). Open-path FTIR spectroscopy of magma degassing processes during eight lava fountains on Mount Etna. Earth Planet. Sci. Lett. 413, 123–134. doi: 10.1016/j.epsl.2014.12.038
Levelt, P., Joiner, J., Tamminen, J., Veefkind, P., Bhartia, P. K., Stein Zweers, D., et al. (2017). The ozone monitoring instrument: overview of twelve years in space. Atmos. Chem. Phys. Discuss. 2017, 1–61. doi: 10.5194/acp-2017-487
Levelt, P. F., Oord, G. H. J., van den Dobber, M. R., Malkki, A., Visser, H., Vries, J., et al. (2006). The ozone monitoring instrument. IEEE Trans. Geosci. Remote Sens. 44, 1093–1101. doi: 10.1109/TGRS.2006.872333
Li, C., Krotkov, N. A., Carn, S., Zhang, Y., Spurr, R. J. D., and Joiner, J. (2017). New-generation NASA Aura Ozone Monitoring Instrument (OMI) volcanic SO2 dataset: Algorithm description, initial results, and continuation with the Suomi-NPP Ozone Mapping and Profiler Suite (OMPS). Atmos. Meas. Tech. 10, 445–458. doi: 10.5194/amt-10-445-2017
Lopez, T., Carn, S., Werner, C., Fee, D., Kelly, P., Doukas, M., et al. (2013). Evaluation of Redoubt Volcano's sulfur dioxide emissions by the ozone monitoring instrument. J. Volcanol. Geotherm. Res. 259, 290–307. doi: 10.1016/j.jvolgeores.2012.03.002
Lübcke, P., Bobrowski, N., Illing, S., Kern, C., Alvarez Nieves, J. M., Vogel, L., et al. (2013). On the absolute calibration of SO2 cameras. Atmos. Meas. Tech. 6, 677–696. doi: 10.5194/amt-6-677-2013
Lucas, B. D., and Kanade, T. (1981). An iterative image registration technique with an application to stereo vision. IJCAI, 81, 674–679.
Manga, M., Simon, A., Carn, K., Cashman, V., Amanda, B., Clarke, C. B., et al. (2017). Volcanic Eruptions and Their Repose, Unrest, Precursors, and Timing. Washington, DC: The National Academies Press.
Marchetti, E., Ripepe, M., Ulivieri, G., Caffo, S., and Privitera, E. (2009). Infrasonic evidences for branched conduit dynamics at Mt. Etna volcano, Italy. Geophy. Res. Lett. 36:L19308. doi: 10.1029/2009GL040070
Mather, T. A., Pyle, D. M., Tsanev, V. I., McGonigle, A. J. S., Oppenheimer, C., and Allen, A. G. (2006). A reassessment of current volcanic emissions from the central american arc with specific examples from Nicaragua. J. Volcanol. Geotherm. Res. 149, 297–311. doi: 10.1016/j.jvolgeores.2005.07.021
McCormick, B., Popp, C., Andrews, B., and Cottrell, E. (2015). Ten years of satellite observations reveal highly variable sulphur dioxide emissions at Anatahan Volcano, Mariana Islands. J. Geophys. Res. 120, 7258–7282. doi: 10.1002/2014JD022856
McCormick, B. T., Edmonds, M., Mather, T. A., and Carn, S. A. (2012). First synoptic analysis of volcanic degassing in Papua New Guinea. Geochem. Geophys. Geosyst. 13, 1–21. doi: 10.1029/2011GC003945
Métrich, N., Allard, P., Spilliaert, N., Andronico, D., and Burton, M. (2004). 2001 flank eruption of the alkali-and volatile-rich primitive basalt responsible for Mount Etna's evolution in the last three decades. Earth Planet. Sci. Lett. 228, 1–17. doi: 10.1016/j.epsl.2004.09.036
Mori, T., and Burton, M. (2006). The SO2 camera: A simple, fast and cheap method for ground-based imaging of SO2 in volcanic plumes. Geophys. Res. Lett. 33, 1–5. doi: 10.1029/2006GL027916
Mori, T., and Burton, M. (2009). Quantification of the gas mass emitted during single explosions on Stromboli with the SO2 imaging camera, J. Volcanol. Geotherm. Res. 188, 395–400. doi: 10.1016/j.jvolgeores.2009.10.005.
Neri, M., De Maio, M., Crepaldi, S., Suozzi, E., Lavy, M., Marchionatti, F., et al. (2017). Topographic maps of Mount Etna's summit craters, updated to December 2015. J. Maps 13, 674–683. doi: 10.1080/17445647.2017.1352041
Oppenheimer, C., Francis, P., Burton, M., Maciejewski, A. J. H., and Boardman, L. (1998). Remote measurement of volcanic gases by fourier transform infrared spectroscopy. Appl. Phys. B. Lasers Opt. 67, 505–515. doi: 10.1007/s003400050536
Oppenheimer, C., Scaillet, B., and Martin, R. S. (2011). Sulfur degassing from volcanoes: source conditions, surveillance, plume chemistry and earth system impacts. Rev. Min. Geochem. 73, 363–421 doi: 10.2138/rmg.2011.73.13
Palma, J. L. (2013). Wind Reanalysis. Available online at https://vhub.org/resources/windre.
Parfitt, A. E. A. (2004). Discussion of the mechanisms of explosive basaltic eruptions. J. Volcanol. Geotherm. Res. 134, 77–107, doi: 10.1016/j.jvolgeores.2004.01.002
Patanè, D., Aiuppa, A., Aloisi, M., Behncke, B., Cannata, A., Coltelli, M., et al. (2013). Insights into magma and fluid transfer at Mount Etna by a multiparametric approach: a model of the events leading to the 2011 eruptive cycle. J. Geophys. Res. Solid Earth 118, 3519–3539. doi: 10.1002/jgrb.50248
Pérez, W., Freundt, A., Kutterolf, S., and Schmincke, H. U. (2009). The Masaya triple layer: a 2100 year old basaltic multi-episodic Plinian eruption from the Masaya caldera complex (Nicaragua). J. Volcanol. Geotherm. Res. 179, 191–205. doi: 10.1016/j.jvolgeores.2008.10.015
Pering, T. D., Tamburello, G., McGonigle, A. J., Hanna, E., and Aiuppa, A. (2014). Correlation of oscillatory behaviour in matlab using wavelets. Comput. Geosci. 70, 206–212. doi: 10.1016/j.cageo.2014.06.006
Polacci, M., Corsaro, R. A., and Andronico, D. (2006). Coupled textural and compositional characterization of basaltic scoria: Insights into the transition from strombolian to fire fountain activity at Mount Etna, Italy. Geology 34, 201–204. doi: 10.1130/G22318.1
Pompilio, M., Bertagnini, A., Del Carlo, P., and Di Roberto, A. (2017). Magma dynamics within a basaltic conduit revealed by textural and compositional features of erupted ash: the December 2015 Mt. Etna paroxysms. Sci. Rep. 7:4805. doi: 10.1038/s41598-017-05065-x
Roggensack, K., Hervig, R. L., McKnight, S. B., and Williams, S. N. (1997). Explosive basaltic volcanism from cerro negro volcano: influence of volatiles on eruptive style. Science 277, 1639–1642. doi: 10.1126/science.277.5332.1639
Rose, W. I., Palma, J. L., Delgado Granados, H., and Varley, N. (2013). “Open-vent volcanism and related hazards: Overview,” in Understanding Open-Vent Volcanism and Related Hazards, eds. W. I. Rose, J. L. Palma, H. D. Granados, and N. Varley (Boulder: Geological Society of America), 7–9. doi: 10.1130/2013.2498(00)
Rothery, D. A., Coppola, D., and Saunders, C. (2005). Analysis of volcanic activity patterns using MODIS thermal alerts. Bull. Volcanol. 67, 539–556. doi: 10.1007/s00445-004-0393-3
Salerno, G. G., Burton, M. R., Oppenheimer, C., Caltabiano, T., Randazzo, D., Bruno, N., et al. (2009). Three-years of SO2 flux measurements of Mt. Etna using an automated UV scanner array: comparison with conventional traverses and uncertainties in flux retrieval. J. Volcanol. Geotherm. Res. 183, 76–83. doi: 10.1016/j.jvolgeores.2009.02.013
Sawyer, G. M., and Burton, M. R. (2006). Effects of a volcanic plume on thermal imaging data. Geophys. Res. Lett. 33:L14311. doi: 10.1029/2005GL025320
Scollo, S., Kahn, R. A., Nelson, D. L., Coltelli, M., Diner, D. J., Garay, M. J., et al. (2012). MISR observations of Etna volcanic plumes. J. Geophys. Res. Atmos. 117, 1–13. doi: 10.1029/2011JD016625
Shinohara, H. (2013). Volatile flux from subduction zone volcanoes: insights from a detailed evaluation of the fluxes from volcanoes in japan. J. Volcanol. Geotherm. Res. 268, 46–63. doi: 10.1016/j.jvolgeores.2013.10.007
Spampinato, L., Sciotto, M., Cannata, A., Cannavò, F., La Spina, A., Palano, M., et al. (2015). Multiparametric study of the February-April 2013 paroxysmal phase of Mt. Etna New South-East crater. Geochem. Geophys. Geosyst. 16, 1932–1949. doi: 10.1002/2015GC005795
Spilliaert, N., Métrich, N., and Allard, P. (2006). S–Cl–F degassing pattern of water-rich alkali basalt: modelling and relationship with eruption styles on Mount Etna volcano. Earth Planet. Sci. Lett. 248, 772–786. doi: 10.1016/j.epsl.2006.06.031
Taddeucci, J., Alatorre-Ibarguengoitia, M. A., Palladino, D. M., Scarlato, P., and Camaldo, C. (2015). High-speed imaging of strombolian eruptions: gas-pyroclast dynamics in initial volcanic jets, Geophys. Res. Lett. 42, 6253–6260. doi: 10.1002/2015GL064874
Tamburello, G., Aiuppa, A., Kantzas, E. P., Mcgonigle, A. J. S., and Ripepe, M. (2012). Passive vs. active degassing modes at an open-vent volcano (Stromboli, Italy). Earth Planet. Sci. Lett. 359–360, 106–116. doi: 10.1016/j.epsl.2012.09.050
Tamburello, G., Kantzas, E. P., McGonigle, A. J. S., Aiuppa, A., and Giudice, G. (2011). UV camera measurements of fumarole field degassing (La Fossa crater, Vulcano Island). J. Volcanol. Geotherm. Res. 199, 47–52. doi: 10.1016/j.jvolgeores.2010.10.004
Torres, O., Bhartia, P. K., Jethva, H., and Ahn, C. (2018). Impact of the ozone monitoring instrument row anomaly on the long-term record of aerosol products. Atmos. Meas. Tech. 11, 2701–2715. doi: 10.5194/amt-11-2701-2018
Ulivieri, G., Ripepe, M., and Marchetti, E. (2013). Infrasound reveals transition to oscillatory discharge regime during lava fountaining: implication for early-warning. Geophys. Res. Lett. 40, 3008–3013. doi: 10.1002/grl.50592
Vergniolle, S., and Mangan, M. T. (2000). “Hawaiian and Strombolian eruptions,” in Encyclopedia of Volcanoes, eds, H. Sigurdsson, B. Houghton, S. R. McNutt, H. Rymer, and J. Stix (San Diego, CA: Academic Press), 447–461.
Vulpiani, G., Ripepe, M., and Valade, S. (2016). Mass discharge rate retrieval combining weather radar and thermal camera observations. J. Geophys. Res. Solid Earth 121, 5679–5695. doi: 10.1002/2016JB013191
Werner, C., Kern, C., Coppola, D., Lyons, J. J., Kelly, P. J., Wallace, K. L., et al. (2017). Magmatic degassing, lava dome extrusion, and explosions from Mount Cleveland volcano, Alaska, 2011–2015: insight into the continuous nature of volcanic activity over multi-year timescales. J. Volcanol. Geotherm. Res. 337, 98–110. doi: 10.1016/j.jvolgeores.2017.03.001
Williams, S. N., and Self, S. (1983). The October 1902 plinian eruption of Santa Maria volcano, Guatemala. J. Volcanol. Geotherm. Res. 16, 33–56. doi: 10.1016/0377-0273(83)90083-5
Wooster, M. J., Zhukov, B., and Oertel, D. (2003). Fire radiative energy for quantitative study of biomass burning: derivation from the BIRD experimental satellite and comparison to MODIS fire products. Remote Sens. Environ. 86, 83–107. doi: 10.1016/S0034-4257(03)00070-1
Wright, R., Flynn, L., Garbeil, H., Harris, A., and Pilger, E. (2002). Automated volcanic eruption detection using MODIS. Remote Sens. Environ. 82, 135–155. doi: 10.1016/S0034-4257(02)00030-5
Wright, R., and Flynn, L. P. (2004). Space-based estimate of the volcanic heat flux into the atmosphere during 2001 and 2002. Geology 32, 189–192. doi: 10.1130/G20239.1
Wright, R., Flynn, L. P., and Harris, A. J. (2001). Evolution of lava flow-fields at Mount Etna, 27–28 October 1999, observed by Landsat 7 ETM+. Bull Volcanol. 63, 1–7. doi: 10.1007/s004450100124
Wright, R., and Pilger, E. (2008). Satellite observations reveal little inter-annual variability in the radiant flux from the Mount Erebus lava lake. J. Volcanol. Geotherm. Res. 177, 687–694. doi: 10.1016/j.jvolgeores.2008.03.005
Keywords: volcanic SO2, Etna, UV camera, OMI, basaltic paroxysms, thermal remote sensing
Citation: D'Aleo R, Bitetto M, Delle Donne D, Coltelli M, Coppola D, McCormick Kilbride B, Pecora E, Ripepe M, Salem LC, Tamburello G and Aiuppa A (2019) Understanding the SO2 Degassing Budget of Mt Etna's Paroxysms: First Clues From the December 2015 Sequence. Front. Earth Sci. 6:239. doi: 10.3389/feart.2018.00239
Received: 14 February 2018; Accepted: 10 December 2018;
Published: 14 January 2019.
Edited by:
Peter William Webley, University of Alaska Fairbanks, United StatesReviewed by:
Tom D. Pering, University of Sheffield, United KingdomCopyright © 2019 D'Aleo, Bitetto, Delle Donne, Coltelli, Coppola, McCormick Kilbride, Pecora, Ripepe, Salem, Tamburello and Aiuppa. This is an open-access article distributed under the terms of the Creative Commons Attribution License (CC BY). The use, distribution or reproduction in other forums is permitted, provided the original author(s) and the copyright owner(s) are credited and that the original publication in this journal is cited, in accordance with accepted academic practice. No use, distribution or reproduction is permitted which does not comply with these terms.
*Correspondence: Roberto D'Aleo, cm9iZXJ0by5kYWxlbzAxQHVuaXBhLml0
Disclaimer: All claims expressed in this article are solely those of the authors and do not necessarily represent those of their affiliated organizations, or those of the publisher, the editors and the reviewers. Any product that may be evaluated in this article or claim that may be made by its manufacturer is not guaranteed or endorsed by the publisher.
Research integrity at Frontiers
Learn more about the work of our research integrity team to safeguard the quality of each article we publish.