 Anouk Beniest
 Ernst Willingshofer
 Dimitrios Sokoutis3,4
95% of researchers rate our articles as excellent or good
Learn more about the work of our research integrity team to safeguard the quality of each article we publish.
Find out more
ORIGINAL RESEARCH article
Front. Earth Sci. , 23 October 2018
Sec. Structural Geology and Tectonics
Volume 6 - 2018 | https://doi.org/10.3389/feart.2018.00148
This article is part of the Research Topic Cutting-Edge Analogue Modeling Techniques Applied to Study Earth Systems View all 10 articles
We investigate the development of margin geometries during extension of a continental lithosphere containing lateral strength variations. These strength variations may originate from the amalgamation of continents with different mechanical properties as was probably the case when Pangea was assembled. Our aim is to infer if localization of deformation is controlled by the boundary between two lithospheres with different mechanical properties (e.g., “weak” and “strong”) or not. We ran a series of lithosphere-scale physical analog models in which we vary the strength contrast across equally sized lithospheric domains. The models show that deformation always localizes in the relatively weaker compartment, not at the contact between the two domains because the contact is unfavorably oriented for the applied stress and does not behave as a weak, inherited discontinuity. Wide-rifts develop under coupled conditions when the weak lithosphere consists of a brittle crust, ductile crust and ductile mantle. When a brittle upper mantle layer is included in the weak segment, the rift system develops in two phases. First, a wide rift forms until the mechanically strong upper mantle develops a necking instability after which the weak lower crust and weak upper mantle become a coupled, narrow rift system. The margin geometries that result from this two-phase evolution show asymmetry in terms of crustal thickness and basin distribution. This depends heavily on the locus of failure of the strong part of the upper mantle. The models can explain asymmetric conjugate margin geometries without using weak zones to guide deformation localization.
The South Atlantic domain resulted from the separation of the African and the South American continents. Prior to rifting and break-up, the supercontinent Pangea (Figure 1) consisted of (a) fold and thrust belts, including the Gondwana Fold and Thrust Belt (Cobbold et al., 1992) and the Dom Feliciano Gariep belts, representing inverted back-arc basins (Engelmann de Oliveira et al., 2016; Konopásek et al., 2016; Will and Frimmel, 2017), (b) magmatic provinces of different ages and (c) cratons (Will and Frimmel, 2017). When rifting initiates, the developing rift axes and the locus of the continental break-up sometimes follows the craton's boundary. This is, for example, the case of the western and eastern rift branches of the East African Rift System that surrounds the Tanzanian craton (Ebinger, 1989). In other cases, rifting does not follow these former craton boundaries so strictly, but is distributed over a wide region affecting pre-existing geological features. The Pan-African Araçuai – West Congo orogenic belt is an example where the rift system went through the orogen rather than close to the craton's boundary. At present, roughly two-thirds of this orogen can be found on the South American plate and the rest on the African plate (Pedrosa-Soares et al., 2008). Another example are the remnants of rift features, e.g., horst and graben structures, which are nowadays located on the margins of the southern segment of both the South American and African plates (Figure 1, Blaich et al., 2011).
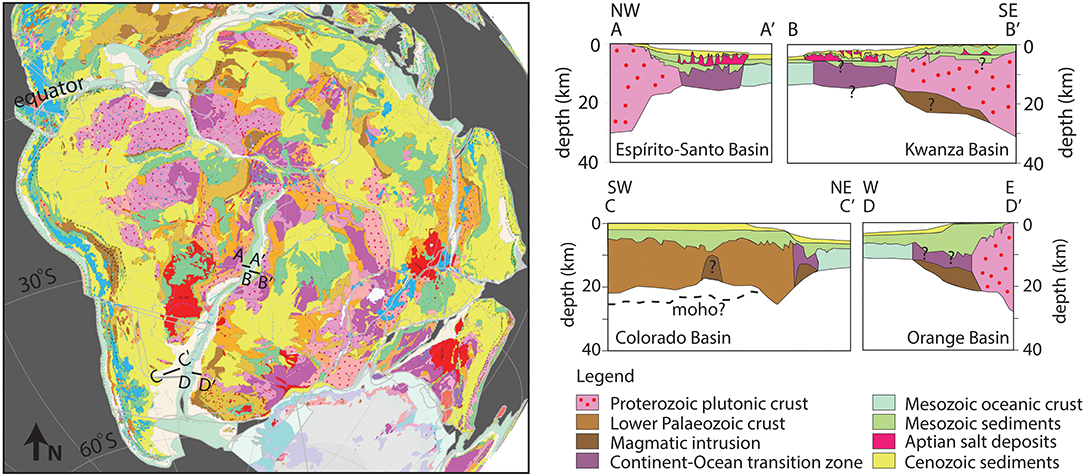
Figure 1. Reconstructed projection of the geological maps of South America and Africa before break-up. Reconstruction has been done using the rotation poles and continental polygons of Seton et al. (2012). The geological map has been extracted from the Geological Map of the World by Bouysse (2014). The cross-sections A-A', B-B', C-C', and D-D', have been simplified after Blaich et al. (2011) and projected on the reconstruction. The reconstructed geology shows that the continents consist of an amalgamation of different crustal features. This has been adopted for the crustal cross-sections resulting in similar crustal features for the continental part of the Espírit-Santo Basin and Kwanza Basin margins (Proterozoic plutonic crust) and different crustal features for the continental part of Colorado Basin margin (Proterozoic sedimentary crust) and the Orange Basin margin.
Continental rift initiation and eventual break-up at crustal and lithospheric scale has been studied with physical analog and numerical modeling techniques. Initial setups used in these studies are often simplified with respect to natural cases (Burov and Diament, 1995; Brun and Beslier, 1996; Gueydan and Précigout, 2014; Manatschal et al., 2015; Naliboff et al., 2017). Weak seeds or weak zones representing the inheritance of earlier deformation phases are permitted to achieve strain localization at the desired place or in self consistent ways (Corti et al., 2007; Huismans and Beaumont, 2007; Sokoutis et al., 2007; Brune et al., 2014; Burov and Gerya, 2014; Nestola et al., 2015; Bonini et al., 2016; Zwaan et al., 2016). These studies have been valuable, because they have shown that weak zones in the lower crust have a higher impact on rift localization than weak zones in the lithospheric mantle (Sokoutis et al., 2007) and that strength variations within the lower crust are important for along margin segmentation of the crust (Cappelletti et al., 2013). Apart from weak zones or inherited structures, strain softening mechanisms (Gueydan et al., 2014), complex brittle-ductile stratification and thickness of the lithosphere (Burov and Diament, 1995; Brun and Beslier, 1996) and variations in extension rates (Brune et al., 2016; Naliboff et al., 2017) are important parameters to localize strain.
Few studies have been performed that investigate extension of systems with large, spatial strength variations. Bonini et al. (2007) found that strain preferably localizes in thinner lithosphere in cases where the thickness of the lithosphere varies prior to extension. Koptev et al. (2015, 2016) demonstrated that in lithospheres with a large strength contrast, mantle anomalies migrate along the base of stronger features, breaking the crust in the weaker parts. Beniest et al. (2017a,b) showed that large strength contrasts can result in different break-up styles and final margin geometries, including multiple break-up branches, depending on the location of thermal anomalies.
In this contribution we address the question whether large lateral strength variations within the continental lithosphere by themselves can direct deformation localization and the evolution of rift structures and geometries. Complementary to the studies of e.g., Beniest et al. (2017a,b), Bonini et al. (2007) and Koptev et al. (2015), we use analog modeling techniques that allow the implementation of large strength contrasts across lithospheric segments. Our aim is to understand why, like in the case of the South Atlantic, localization of deformation did not only follow inherited tectonic contacts like suture zones, but also went across old and rigid crustal features. The experimental results increase our understanding of extension affecting amalgamated continents or lithospheres such as Pangea, which was a complex assembly of cratons, fold-and-thrust belts and basins prior to its break-up (Will and Frimmel, 2017).
For our experimental setup we have chosen three different strength profiles that could represent (1) young crust according to the “crème brulée” model, or (2) intermediate strong continental crust and (3) old, cratonic crust, which are variations to the “jelly-sandwich” model (Burov, 2011). Geological observations on the South American and African continents show that these types of crust may occur in the vicinity of one another prior to break-up (Figure 1). The model's dimension is 36 × 30 cm (Figure 2). The total thickness of the lithosphere was kept the same at 4 cm for all models at the onset of extension, although strength variations may also be associated with thickness variations in nature (Burov and Diament, 1995). Material properties are specified in Table 1 and scaling laws have been adopted as described in Sokoutis et al. (2005). The models are performed at the Tectonic Laboratory (TecLab) of Utrecht University.
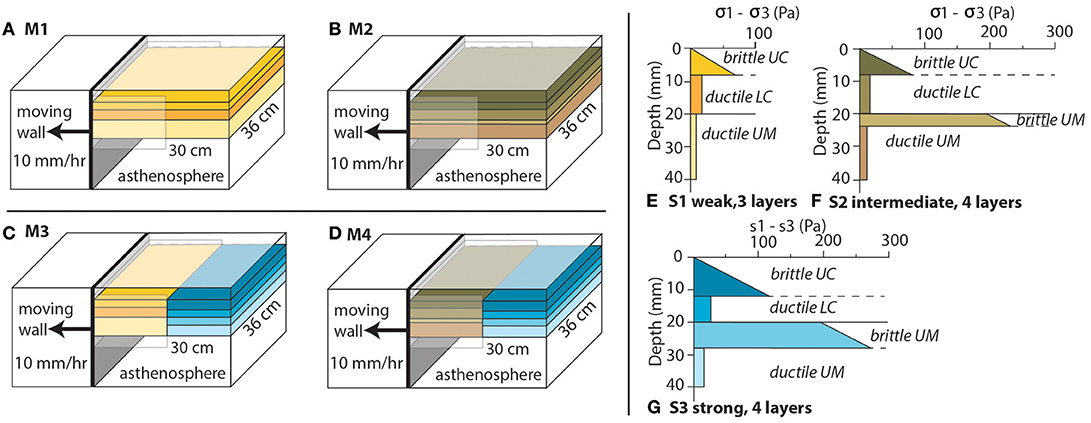
Figure 2. Experimental setup of the four analog models (A–D) with rheological strength envelopes (E–G). (A) Model 1 (M1), lateral homogeneous stratified strength profile S1 (weak, three layers, E). (B) Model 2 (M2), lateral homogeneous stratified strength profile S2 (intermediate, four layers, F). (C) Model 3, lateral variation in strength profile combining vertically stratified strength profile S1 (weak, three layers, E) and S3 (strong, four layers, G,D) Model 4, lateral variation in strength profile combining vertically stratified strength profile S2 (intermediate, three layers, E) and S3 (strong, four layers, (G)). The black arrow indicates the direction of the moving wall (10 mm/h, constant rate) that also holds the box-in-box construction. The layered lithosphere floats on a low viscosity high density fluid within the Plexiglas box. UC, upper crust; LC, lower crust; UM, upper mantle.
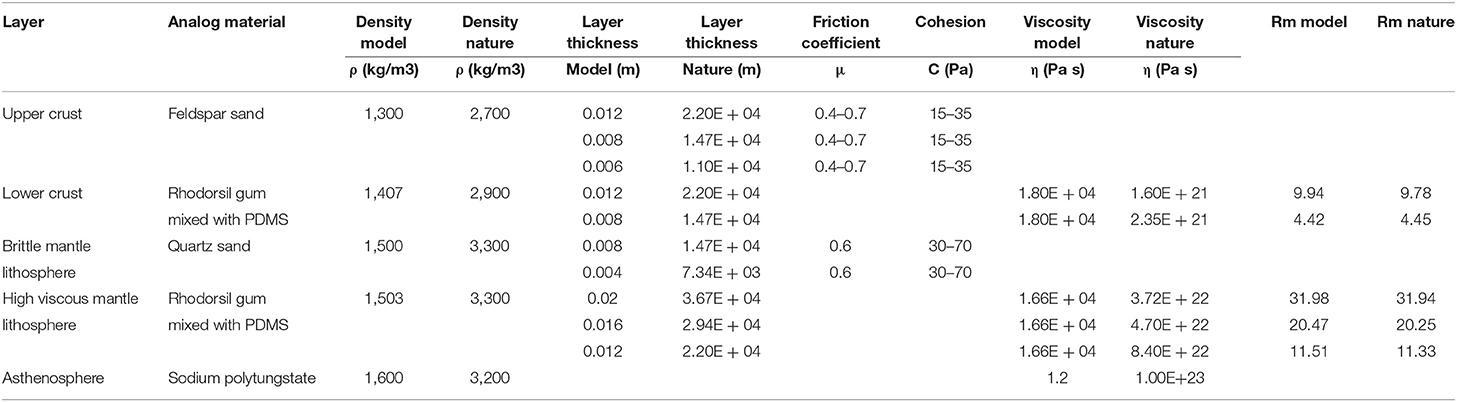
Table 1. Physical properties for experimental material and comparison between nature and experiments.
In this study we describe the experimental results of extending lithospheres with lateral strength variations against two reference models, representing weak (M1, Figure 2A) and intermediate (M2, Figure 2A) strength lithospheres. The strength of these lithospheres has been varied laterally by increasing the thickness of the brittle layers in expense of the ductile layers leading to combinations of weak and strong (model 3, M3, Figure 2C) and intermediate and strong lithospheres (model 4, M4, Figure 2D). Domains of different strength are equal in size and the separating boundaries are vertical. In our experiments, dry granular materials such as feldspar and quartz sand represent the brittle crust and brittle mantle, whereas mixtures of Rhodorsil Gomme GSIR (RG) silicone with fillers embody the viscous layers (ductile crust and ductile mantle lithosphere). These layers rest on a low viscosity, high density fluid of polytungstate, representing the asthenosphere.
The weakest strength profile (S1, Figure 2E) consists of three layers, representing, from bottom to top, the strong part of the lithospheric upper mantle, the ductile lower crust and the brittle upper crust (Bonini et al., 2012). The stronger part of the upper mantle is represented by ductile Rhodorsil-gum layer with a density of 1,503 kg/m3 and an almost Newtonian viscosity and is 2 cm in thickness. A second ductile Rhodorsil-gum layer with a density of 1,407 kg/m3 and an almost Newtonian viscosity represents the ductile lower crust with a thickness of 1.2 cm. A brittle feldspar layer with a density of 1,300 kg/m3 with Mohr-Coulomb behavior represents the upper crust that is 0.8 cm thick. The strength peak of this profile resides in the brittle upper crust. The middle and strongest strength profiles (S2 and S3, Figures 2F,G) both consist of four layers, a ductile Rhodorsil-gum layer (1.6 cm thick for S2 and 1.2 cm thick for S3) at the bottom of the model with a density of 1,503 kg/m3. This is covered by a quartz sand layer with Mohr-Coulomb criteria and a density of 1,503 kg/m3 (0.4 cm thick for S2 and 0.8 cm thick for S3). These two layers represent the strong part of the lithospheric mantle. The ductile lower crust is featured by a second Rhodorsil-gum layer with a density of 1,407 kg/m3 and an almost Newtonian viscosity (thickness of 1.2 cm for S2 and 0.8 cm thickness for S3). The top layer depicts the upper crust and consists of feldspar sand with Mohr-Coulomb behavior and a density of 1,300 kg/m3, the thickness being 0.8 cm for S2 and 1.2 cm for S3. The intermediate and strong strength profiles have two strength peaks, one in the brittle crust and another in the brittle mantle lithosphere (e.g., Brun, 1999).
All models float on a heavy liquid of polytungstate-glycerol mixture, with a low viscosity and a density of 1600 kg/m3 and to avoid the model from subducting. This fluid represents the asthenosphere as well as the very weak part, with the least strength of the lithospheric mantle (Willingshofer et al., 2005). The models are subjected to extensional forces through gravity spreading upon moving one Plexiglas wall away from the experimental lithosphere at a constant rate of 1.0 cm/h, which scales to 1.4 cm/yr in nature. In this study we aim to capture the (first) deformational response of the continental lithosphere with lateral strength variations prior to break-up. As a consequence, the total amount of extension is not the same in all models and depends on the rheological setup of the experiments. Following Allemand and Brun (1991), extension of the lithosphere was implemented by a box-in-box construction. A small box that measured half of the model box' width was attached to the moving wall creating a velocity discontinuity at the long sides of the Plexiglas box (Figure 2). One half of the box was attached to the moving wall perpendicular to the contact between the lithosphere segments of variable strength (Figure 2). During the experiments, top view photos were taken every 10 min. Models ran for a variety of time (3 to 8.5 h).
Analog models are comparable with natural examples on various grounds. One is the rheological similarity between the silicon layers that behave in a ductile manner and the sand layers that behave in a brittle way that compare to the viscous and plastic behavior of rocks on geological time scales. Also geometric, dynamic and kinematic criteria need to be met. For geometric scaling the modeled length ratios need to be equal in all directions (x (length), y (width) and z (depth), i.e., ). The reference models M1 and M2 consist of a lateral homogeneous setup of 36 × 30 × 4 cm. M3 and M4 consist of two types of strength profiles, with equal thicknesses (4 cm), widths (36 cm), and lengths (16 cm). With a scale-factor of 6.67 e-7, this would represent 540 km × 480 km × 60 km in nature, or 1 cm is 15 km. Dynamic scaling of the model with a natural example can be accomplished by respecting the stress-scale factor which includes stress distribution, rheologies and densities (Hubbert, 1937; Ramberg, 1981; Brun, 1999; Sokoutis et al., 2005), , when conserving mass. The following conditions apply for the model:
where σ refers to stress, L to length, ρ to density, g to gravitational acceleration, ε to strain and t to time. The asterisk indicates that the number is unit-less, representing the ratio between the model and nature.
Experiments are carried out under normal gravity and therefore the gravity ratio (g*) is equal to 1. The densities for the model and the natural example are in the same order of magnitude (e.g., 1,300 kg/m3 for the model and 2,800 kg/m3 for the natural example), hence the density ratio (ρ*) is more or less equal to 1. This simplifies Equation. 1 to:
or in other words, the ratio between the stresses and the length of the model and natural example need to be roughly equal (Davy and Cobbold, 1991; Brun, 1999). For kinematic scaling, the model and the natural example abide a timescale that is proportional to the changes in shape and/or position in both the model and natural example (so etc.). Since velocity is given by length/time, the model can be scaled with respect to the prototype with the following equation:
where Vn is velocity in nature, Vm is velocity in the model, Ln is length in nature, Lm is length in the model, tn is time in nature and ttm is time of the model. With a modeled 1 cm/h extension rate (Vm) the natural velocity is 1.4 cm/yr, which is comparable to the average diverging rate in the South Atlantic domain (Müller et al., 2008).
The Reynolds number (Equation 5) for these kind of experiments is rather low for both the model and the natural example (Re = 10−8 and Re = 10−24).
where ρ stands for the density, v is the extension velocity, l the extended length and η the viscosity. Therefore inertial forces can be neglected compared to the viscous ones and this allows time and length ratios to be seen as separate variables (Ramberg, 1981; Dombrádi et al., 2010). The time ratio is thus calculated using the length ratios and corresponding velocities and results in a time ratio t* = 3.17−10 between the duration of the model and the geological time scale.
The Ramberg number (Rm, Equation 6) was calculated to test dynamic and kinematic similarities between the ductile layers assuming a background strain rate of 1.0E−16 for the natural prototype. This yielded viscosities between 9.5E+22 and 2.0E+23, which is within the range expected for natural systems (Burov, 2011).
where ρ is the density of the material, z the thickness of the layer, g the gravitational acceleration and σ1−σ3 refers to the ductile strength of the material (Bonini et al., 2012).
The models with laterally uniform strength have been extended for 8.5 cm (127.5 km in nature, M1, Figure 3A) and 5.3 cm (79.5 km in nature, M2, Figure 3B). Both experiments show that the brittle crust accommodates extension through normal faulting that outline horst and graben, half-graben, and tilted fault block structures. Faults grow either through laterally propagating graben structures or by coalescence of individually developed fault segments to form structures that span the entire width of the models (map views, Figures 3A,B). In cross-sections, these graben structures where lower crust is being exhumed, are shown by location x (Figures 3A,B). Asymmetric structures such as tilted blocks, half grabens or slightly asymmetric grabens exist on the scale of the brittle crust, but the overall deformation is symmetric, both on the scale of the individual layers as well as the entire lithosphere. With reference to the moving wall, the extensional structures develop randomly, not in sequence. This shows that deformation is evenly distributed. None of the structures developed into a major rift that would eventually lead to a break-up system. At deeper levels, the ductile upper mantle penetrates into the ductile lower crust at location y (Figures 3A,B). In M2, the brittle upper mantle develops pinch and swell structures where the ductile mantle rises (location y, Figure 3B). The most important difference observed on the cross-sections between the above described experiments is that grabens in M1 are distributed over a distinctly wider area as opposed to M2 (compare Figures 3A,B).
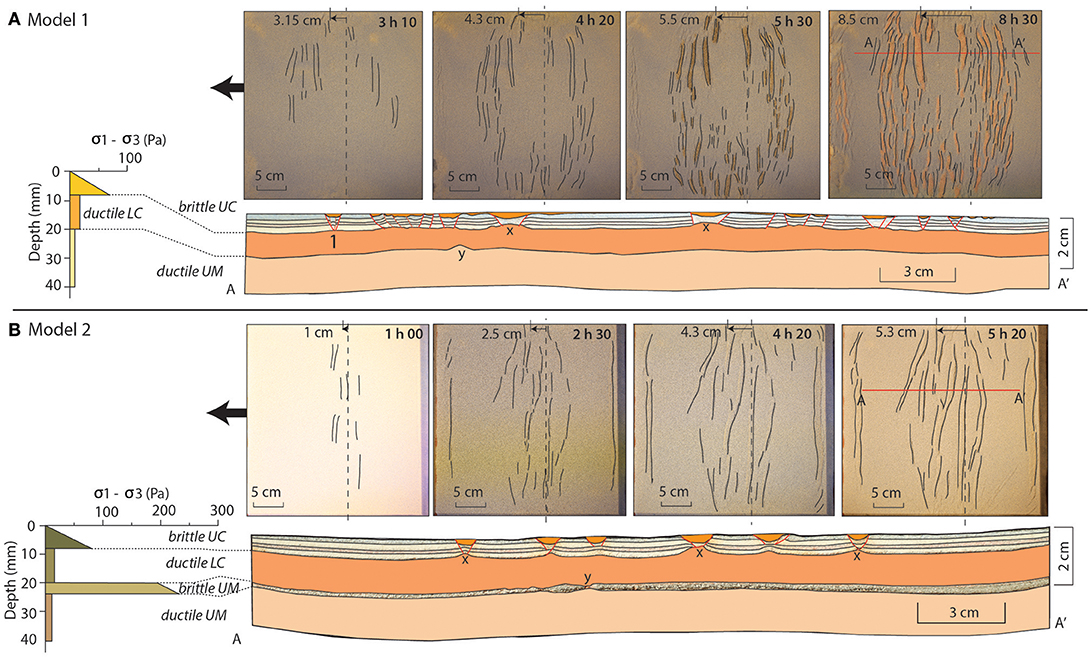
Figure 3. Experimental results of models with one type of lithosphere (A) Model 1 (M1) and (B) Model 2 (M2). Wide rifts form in both models, M2 being 25% less wide than M1 due to the presence of a stronger sub-Moho mantle. Ductile lower crust is exhumed (locations x, M1, and M2). Moho topography shows subtle long wavelength undulations, generally not in phase with the graben structures indicating the flow of material. Pinch and swell structures form in the brittle lithospheric mantle of M2 (location y). The bracketed line on the top-view images represents the contact between the two lithospheric segments. BC, brittle crust; DC, ductile crust; BM, brittle mantle; DM, ductile mantle.
The model with combined weak and strong lithospheres, M3, accommodated 3.2 cm of extension (48 km in nature, Figure 4A). This model develops deformation structures exclusively in the weak lithosphere. The structural style is similar to M1 with graben and half graben in the brittle crust and flow dominated deformation in the ductile layers. The more pronounced exhumation of the lower crust to shallow levels (location x, Figure 4A) and a more distinct Moho topography are the consequence of extension being focused within a less wide segment of lithosphere compared to M1. The final lithosphere-scale geometry of the model is asymmetric as a consequence of thinning of the weak lithosphere from 4.0 to 2.6 cm (35% thickness decrease). The combined intermediate and strong lithosphere, M4, has accommodated 6.2 cm of extension (93 km in nature, Figure 4B). The deformation appears to be distributed less randomly than in the other models and closer located toward the contact between the different rheological segments. Nevertheless deformation only occurs in the relatively weaker segment. Deformation in the brittle crust is symmetric with a series of grabens that exhume lower crust material. Faulting affects the brittle layers in M4 until the boundary between the two lithosphere segments (Figure 4B, position x). Different to M3, extension in M4 led to necking of the mantle lithosphere and exhumation of the ductile mantle layer where the brittle mantle broke and got separated (Figure 4B, position y). This region of maximum thinning of the mantle lithosphere is only matched by the location of one of the grabens within the crust that developed later in the evolutionary sequence (graben a, Figure 4B). Overall, narrow and localized deformation within the mantle lithosphere is compensated by distributed deformation within the crust. Besides thinning at the area of necking (4.0 to 2.6 cm, 35% thickness decrease), minor thickness change occurred within the mantle lithosphere of the intermediate-strength lithosphere (4.0 to 3.6 cm, 10% thickness decrease). For both M3 and M4 the strong segment kept its original thickness.
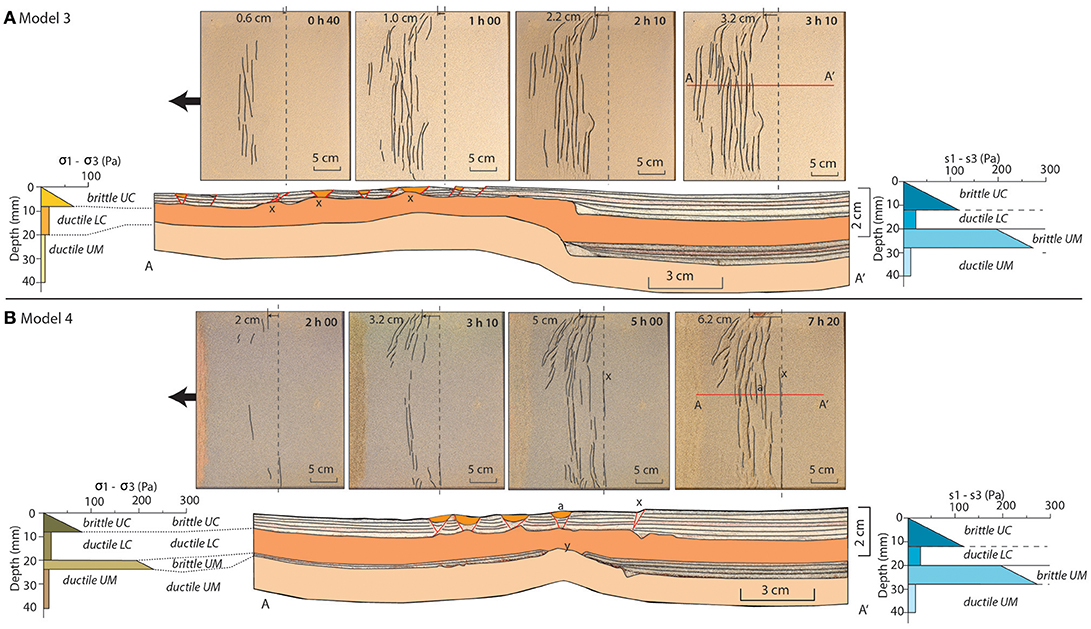
Figure 4. Experimental results of homogeneous lithospheric setup (A) Model 3 (M3) and (B) Model 4 (M4). M3 and M4 show that all extension is accommodated in the weak segment. The thickness of the weak segment of M3 decreases with 35% in a distributed fashion. In the weak segment of M4 the sub-Moho mantle has lost its strength and thickness decreases with 35% at the necking domain (B, location y). The original thickness of the strong domains of both models remains. The bracketed line on the top-view images represents the contact between the two lithospheric segments. BC, brittle crust; DC, ductile crust; BM, brittle mantle; DM, ductile mantle.
Our experiments consistently predict that extension of continental lithosphere with lateral strength variations will lead to stretching of the relatively weaker lithosphere (Figure 4, M3 and M4). Unexpectedly, deformation never initiates at the location where the rheological contrast is largest (at the transition of the weaker to the stronger lithosphere) but almost always starts within the weaker segment and never propagates into the stronger one. The only exception is M4 where one normal fault formed at the contact between the two different lithospheres very early in the rift evolution. Deformation eventually localizes somewhere in the weak domain and thus this small normal fault ceases to accommodate extension. One reason for this could be that the perpendicular orientation of the contact with respect to the extension direction might not be favorable for deformation localisation. Our results are therefore consistent with the analog modeling study of Bonini et al. (2007), who investigated lithosphere extension with laterally changing mechanical properties related to rifting in West Antarctica. In their models, deformation solely concentrated within the weak lithosphere, but compared to our models they differ on the aspect of strain localization. Bonini et al. (2007) show that the transition from strong to weak lithosphere can turn into the locus of the main boundary fault confining the evolving rift under initial conditions of having a stress gradient from the strong to the weak lithosphere in response to significant thickness variations. The impact of this stress gradient is probably enhanced through the application of the centrifuge technique. Additionally, there is in our experiments no predefined fault or zone of weakness that cuts across layers at the transition from the strong to the weak lithospheric domain that would facilitate strain localisation at the onset of deformation there. The continuity of brittle and ductile layers in our experiments, yet subject to thickness changes to produce the stronger and weaker domains, seems to render the actual rheological contrast insignificant for localizing deformation. This behavior is different to convergent settings where deformation tends to localize at transitions from stronger to weaker and vice versa crust or lithosphere (e.g., Willingshofer et al., 2005; Munteanu et al., 2014; Calignano et al., 2015). This emphasizes the sensitivity of the localization of deformation at strength contrasts to the orientation of that strength contrast with respect to the applied stress, i.e., to the tectonic regime (extensional vs. compressional). As shown by our experiments, the locus of deformation may thus significantly deviate from the position of rheological heterogeneities in the system in cases where no inherited weak structures exist at the contact of weak and strong domains.
Numerical models that have tested the influence of inherited structures on rift localisation clearly underline the importance of these structures for the early phases of rift evolution (e.g., Manatschal et al., 2015; Naliboff et al., 2017). After strain and structural softening, also the thermal and rheological structure control the break-up location (Huismans and Beaumont, 2007; Manatschal et al., 2015; Duretz et al., 2016). With the models presented here, we show that large strength contrasts in the lithosphere by itself are in-sufficient to localize deformation.
In our experiments extension affects large parts of the weaker lithosphere, whereby the width of deformation is regulated by the degree of coupling among the layers that constitute the lithosphere. The width of the deformed zone is wider when layers are coupled (M1, Figure 3A, and M3, Figure 4A) and narrower by 40–50% when layers are less well coupled (M2, Figure 3B, and M4, Figure 4B). This behavior is consistent with previous analog modeling studies that emphasize the importance of the mechanical coupling between the layers on width and style of deformation (Brun, 1999; Nestola et al., 2015; Gabrielsen et al., 2016; Brun et al., 2018). During distributed extension the ductile mantle rises below the larger grabens, leading to significant exhumation of the mantle lithosphere (Brun and Beslier, 1996; Corti et al., 2011; Brun et al., 2018) as often observed along passive margins (Manatschal et al., 2015). From the early stages of rifting to spreading, the style and architecture of the evolving rift system is in a first instance controlled by the thermal and mechanical structure of the extending crust and lithosphere, the presence of inherited heterogeneities (Buck, 1991; Manatschal et al., 2015; e.g., Brun et al., 2018). However, parameters like the extension rate may regulate the strength of the ductile layers as it affects the dynamics of the rifted domain (Bassi, 1995) and thus the degree of coupling amongst layers. Changes in extension rate may lead to a switch from distributed to localized deformation or vice versa (Brun et al., 2016; Naliboff et al., 2017). Additionally, we infer that the switch from distributed to localized deformation through time is also controlled by the strength of the sub-Moho mantle. This strength decreases during the initial distributed rifting phase (phase 1, wide-rift, Figure 5B) when pinch-and-swell structures develop (e.g., location y, Figure 3B). Once the ductile crust and ductile mantle are in direct contact (location y, Figures 4B, 5E), a localized weaker zone emerges (phase 2, narrow rift, Figure 5C) that develops into the necking domain. Such structural softening, following the necking of competent layers, has been described by Duretz et al. (2016) and we argue that the locus of necking in the mantle will control where maximum exhumation of the lower crust and mantle will take place and where the formation of a mid-oceanic ridge or spreading center will occur (Figure 5D).
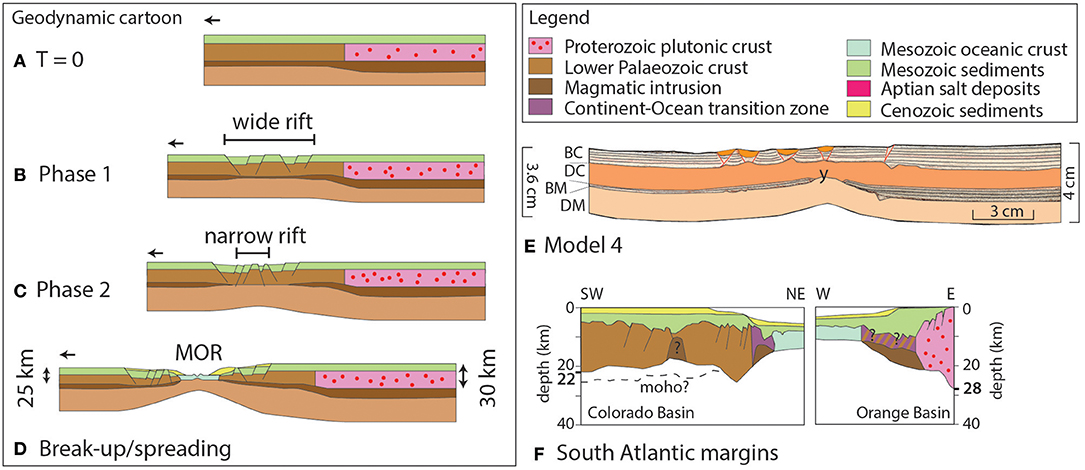
Figure 5. Cartoon showing the two-phased conceptual evolution of continental break-up in a system (A) consisting of two large lithosphere segments, T = 0. (B) Phase 1 shows the distributed or wide rift formation, with normal faulting occurring in the weak segment. (C) Phase 2 shows localized or narrow deformation that occurs directly above the location where the upper mantle has failed and the weak lower crust and the weak part of the upper mantle are in direct contact. (D) Continuous extension will eventually lead to breakup above the necking point that formed during the second phase, resulting in asymmetric margins in terms of crustal thickness and basin positioning. (E) M4, with two lithospheric segments of different strength shows a small decrease in thickness for the weak segment (right side) and a very. (F) The simplified cross-section of the South Segment continental margin of the South Atlantic shows that the crustal thickness of both margins is not equal, being thinner on the South American side also the transition zones have different thicknesses and more horst and graben structures are located on the margin of the South American continent.
The analog models presented here compare well to the numerical studies of Beniest et al. (2017a,b). The numerical experiments investigate the effect of thermal anomalies on the style of continental break-up of lithosphere consisting large domains with different strength. The mantle anomaly simulates the presence of the Tristan plume in the South Atlantic domain (Torsvik et al., 2006). The numerical results show that depending on the initial location of the mantle anomaly with respect to the contact between the different strength segments, several modes of continental break-up may develop. In other words, even though our analog models show that no thermal anomaly is needed to create a potential break-up locus, including thermal processes increases the variety of break-up styles that may occur in a setting consisting of multiple lithospheric domains with different strength. The numerical models are better at explaining high density/high velocity bodies as being underplated material or partial melts that result from migrating plume material at the base of the lithosphere (Beniest et al., 2017a,b) than the analog models, but asymmetric margin geometries can be reproduced by both analog and numerical experiments.
Our models are built to investigate the effect of extension on large strength contrast in (super)continents. The crustal strength of the South American plate is assumed to be weaker than the African crust due to a previous extensional deformation phase that has affected the Argentinian and Uruguayan margin (Autin et al., 2013), forming the E-W trending basins that are nowadays located along the margins of the South Segment of the South Atlantic. This deformation phase might have led to thinning of the lithosphere on the South American side, which is currently 120 km thick (Heit et al., 2007). In comparison, the continental lithosphere on the African side is currently up to 200 km thick (Fishwick, 2010). Also the occurrence of different types of outcrops on either side of the margin [Precambrian sediments on the South American side (Figure 1) and Precambrian volcanic rocks on the African side (Bouysse, 2014)] suggest different strengths on either side of the margin prior to break-up. Our models only show the first two phases of rifting in which a wide rift develops first and a narrow rift forms during a second phase when the strong upper mantle has failed and the weaker lower crust and weaker part of the upper mantle are in direct contact, representing the main softening mechanism. If extension would continue, continental separation is expected above this necking point (Figure 5D). This final geometry is comparable to the present day margins of the South Atlantic in various ways.
Firstly, it is comparable in terms of crustal thicknesses. As it is unknown what the crustal thickness was prior to break-up, it can be assumed that lithosphere thickness was different on both sides as a result of the first deformation phase that formed the roughly E-W trending basins and only affected the South American continent as pointed out by Autin et al. (2013). It can also be assumed that the crustal thicknesses were more equal despite this previous extension phase as the crustal thicknesses of the Brazilian and African cratons are currently within the same order of magnitude [42 km for the South American São Francisco craton (Van Der Meijde et al., 2013) and between 38 and 45 km for the southern African crust (Stankiewicz et al., 2002)]. Both cases of crustal thicknesses are justified. Our analog models presented here assume the latter case, where crustal thicknesses would be more equal. M4 shows that extending a system with two crustal segments with different strengths but similar thicknesses can produce thinning all over the weak segment, leaving the strong segment undeformed. The differences in crustal thicknesses can therefore also be explained just due to strength variations in the crust, without needing a previous deformation phase. The results are again comparable to the South Atlantic margins (Figure 5F), where the continental side of the South American margin is roughly 22 km thick and can be as thick as 25–30 km (Schnabel et al., 2008), compared to 28 on the African side (Blaich et al., 2011), which can be as thick as 40 km (Maystrenko et al., 2013).
Secondly, the models can be compared to nature in terms of basin distribution along the margins. The first phase of our M4 model (Figure 5E) produces a wide rift with basins distributed over a large part of the basin (Figures 4B, 5B). The localized rift that follows this first phase produces a necking zone that will eventually break the crust above this necking point, leaving an uneven basin distribution. In this case more basins reside on the right side than on the left side, which is comparable to the higher amount of small basins within the Colorado basin observed on the South American side below the sediments cover than on the African side (Figure 5F, Blaich et al., 2011). The distribution of the basins depends largely on the location where the resistant upper mantle fails, which does not have to be exactly in the center of the initial distributed rift (see section Rheological Control on the Locus of Extension and Style of Deformation in Continental Lithosphere With Lateral Strength Variations).
The width of the margins is a third comparison that can be made between the models and the natural case. If we consider the point of break-up to be directly above the necking point as formed in model M4, a sliver of weak lithosphere will become detached from the weak segment and remains attached to the strong segment. The margin that forms on the weak segment, will be thinner and wider for a large area, whereas the margin that develops on the strong segment will show a sharp decrease in thickness from the continent to the margin as the small, thin sliver of weak lithosphere will remain attached to the strong, thick continental lithosphere. On the cross-sections of Blaich et al. (2011) the upper limit of the Continent-Ocean-Transition is unsure. A hypothesis could be that a thin sliver of weaker material remained attached to the African continent after break-up, leading to asymmetric widths and geometries between both margins. In this case, the continent would not have been broken at the contact between the two segments but rather through a former back arc basin, which could have been the case for parts of the South Atlantic (Will and Frimmel, 2017).
We investigated the deformational response to extensional forces on continental lithosphere with lateral strength variations. Deformation structures that lead to significant rifting are only developed in the weaker lithosphere segment, not at the contact between the two segments, suggesting that in the absence of a weak zone at the contact, the rheological heterogeneity may be unfavorable oriented with respect to the applied stresses to facilitate strain localization at that point. The weaker segment thins, whereas the strong segment preserves its original thickness. Models including a strong sub-Moho mantle develop a necking zone once the strong part of the upper mantle has failed. The evolution of these models is two-phased with (1) a distributed or wide rift phase with normal fault systems throughout the weak segment and (2) a localized or narrow rift phase that forms once the strong upper mantle suffers strength failure and develops a necking zone. We have shown with these models that it is possible to break a continent at a different location than at a pre-existing heterogeneity, without the influence of thermal processes or by including inherited weak zones. This two phase evolution forms asymmetric margins that can be compared to a natural case, the South Atlantic domain, in terms of crustal thicknesses, basin distribution and margin widths. We state therefore that large-scale lateral strength variations in the lithosphere are an important factor controlling both the location of deformation localisation within the weak domain and the architecture of the rift system. We also argue that the strong part of the upper mantle plays a major role in determining the location of necking and future break-up.
AB, EW, and DS conducted the experiments in the laboratory. AB provided the figures of the manuscript. AB, EW, DS, and WS participated in model setup discussions. AB, EW, DS, and WS wrote and edited the manuscript.
The authors declare that the research was conducted in the absence of any commercial or financial relationships that could be construed as a potential conflict of interest.
EW and DS thank the Netherlands Research Centre for Integrated Solid Earth Sciences for supporting the infrastructure relevant for this study. AB thanks Antoine Auzemery for his indispensable help in the lab. This work has been included in the thesis of Beniest (2017).
Allemand, P., and Brun, J. P. (1991). Width of continental rifts and rheogical layering of the lithosphere. Tectonophysics 188, 63–69.
Autin, J., Scheck-Wenderoth, M., Loegering, M. J., Anka, Z., Vallejo, E., Rodriguez, J. F., et al. (2013). Colorado Basin 3D structure and evolution, Argentine passive margin. Tectonophysics 604, 264–279. doi: 10.1016/j.tecto.2013.05.019
Bassi, G. (1995). Relative importance of strain rate and rheology for the mode of continental extension. Geophys. J. Int. 122, 195–210.
Beniest, A. (2017). From Continental Rifting to Conjugate Margins: Insights From Analogue and Numerical Modelling. Paris IV : Université Pierre et Marie Curie -.
Beniest, A., Koptev, A., and Burov, E. (2017a). Numerical models for continental break-up: implications for the South Atlantic. Earth Planet. Sci. Lett. 461, 176–189. doi: 10.1016/j.epsl.2016.12.034
Beniest, A., Koptev, A., Leroy, S., Sassi, W., and Guichet, X. (2017b). Two-branch break-up systems by a single mantle plume : insights from numerical modeling. Geophys. Res. Lett. 44, 1–9. doi: 10.1002/2017GL074866
Blaich, O. A., Faleide, J. I., and Tsikalas, F. (2011). Crustal breakup and continent-ocean transition at South Atlantic conjugate margins. J. Geophys. Res. 116, 1–38. doi: 10.1029/2010JB007686
Bonini, L., Basili, R., Toscani, G., Burrato, P., Seno, S., and Valensise, G. (2016). The effects of pre-existing discontinuities on the surface expression of normal faults: insights from wet-clay analogue modelling. Tectonophysics 684, 157–175. doi: 10.1016/j.tecto.2015.12.015
Bonini, M., Corti, G., Del Ventisette, C., Manetti, P., Mulugeta, G., and Sokoutis, D. (2007). Modelling the lithospheric rheology control on the Cretaceous rifting in West Antarctica. Terra Nova 19, 360–366. doi: 10.1111/j.1365-3121.2007.00760.x
Bonini, M., Sane, F., and Antonielli, B. (2012). Basin inversion and contractional reactivation of inherited normal faults: a review based on previous and new experimental models. Tectonophysics 522–523, 55–88. doi: 10.1016/j.tecto.2011.11.014
Brun, J.-P., Faccenna, C., Gueydan, F., Sokoutis, D., Philippon, M., Kydonakis, K., et al. (2016). The two-stage Aegean extension, from localized to distributed, a result of slab rollback acceleration. Can. J. Earth Sci. 53, 1142–1157. doi: 10.1139/cjes-2015-0203
Brun, J. P. (1999). Narrow rifts versus wide rifts : inferences for the mechanics of rifting from laboratory experiments [and discussion]. Philos. Trans. R. Soc. Lond. Ser. A Math. Phys. Eng. Sci. 357, 695–712.
Brun, J. P., and Beslier, M. O. (1996). Mantle exhumation at passive margins. Earth Planet. Sci. Lett. 142, 161–173. doi: 10.1016/0012-821X. (96).00080-5
Brun, J. P., Sokoutis, D., Tirel, C., Gueydan, F., Van Den Driessche, J., and Beslier, M.-O. (2018). Crustal versus mantle core complexes. Tectonophysics. doi: 10.1016/j.tecto.2017.09.017
Brune, S., Heine, C., Pérez-Gussinyé, M., and Sobolev, S. V. (2014). Rift migration explains continental margin asymmetry and crustal hyper-extension. Nat. Commun. 5, 1–9. doi: 10.1038/ncomms5014
Brune, S., Williams, S. E., Butterworth, N. P., and Müller, R. D. (2016). Abrupt plate accelerations shape rifted continental margins. Nat. Publ. Gr. 536, 201–204. doi: 10.1038/nature18319
Buck, W. R. (1991). Modes of continental lithospheric extension. J. Geophys. Res. 96, 20161–20178. doi: 10.1029/91JB01485
Burov, E., and Gerya, T. (2014). Asymmetric three-dimensional topography over mantle plumes. Nature 513, 85–89. doi: 10.1038/nature13703
Burov, E. B. (2011). Rheology and strength of the lithosphere. Mar. Pet. Geol. 28, 1402–1443. doi: 10.1016/j.marpetgeo.2011.05.008
Burov, E. B., and Diament, M. (1995). The effective elastic thickness. (Te). of continental lithosphere: what does it really mean? J. Geophys. Res. 100, 3905–3927. doi: 10.1029/94JB02770
Calignano, E., Sokoutis, D., Willingshofer, E., Gueydan, F., and Cloetingh, S. (2015). Strain localization at the margins of strong lithospheric domains: insights from analog models. Tectonics 34, 396–412. doi: 10.1002/2014TC003756.Received
Cappelletti, A., Tsikalas, F., Nestola, Y., Cavozzi, C., Argnani, A., Meda, M., et al. (2013). Impact of lithospheric heterogeneities on continental rifting evolution: constraints from analogue modelling on South Atlantic margins. Tectonophysics 608, 30–50. doi: 10.1016/j.tecto.2013.09.026
Cobbold, P. R., Gapais, D., Rossello, E. A., Milani, E. J., and Szatmari, P. (1992). “Permo-Triassic intracontinental deformation,” in Inversion Tectonics of the Cape Fold Belt, Karoo and Cretaceous Basins of South Africa, ed S. W. Gondwana (Rotterdam: Balkema), 23–26.
Corti, G., Bonini, M., Innocenti, F., Manetti, P., Piccardo, G. B., and Ranalli, G. (2007). Experimental models of extension of continental lithosphere weakened by percolation of asthenospheric melts. J. Geodyn. 43, 465–483. doi: 10.1016/j.jog.2006.11.002
Corti, G., Calignano, E., Petit, C., and Sani, F. (2011). Controls of lithospheric structure and plate kinematics on rift architecture and evolution: an experimental modeling of the Baikal rift. Tectonics 30, 1–16. doi: 10.1029/2011TC002871
Davy, P., and Cobbold, P. R. (1991). Experiments on shortening of a 4-layer model of the continental lithosphere. Tectonophysics 188, 1–25. doi: 10.1016/0040-1951. (91).90311-F
Dombrádi, E., Sokoutis, D., Bada, G., Cloetingh, S., and Horváth, F. (2010). Modelling recent deformation of the pannonian lithosphere: lithospheric folding and tectonic topography. Tectonophysics 484, 103–118. doi: 10.1016/j.tecto.2009.09.014
Duretz, T., Petri, B., Mohn, G., Schmalholz, S. M., Schenker, F. L., and Müntener, O. (2016). The importance of structural softening for the evolution and architecture of passive margins. Nat. Publ. Gr. 6, 1–7. doi: 10.1038/srep38704
Ebinger, C. J. (1989). Tectonic development of the western branch of the East African rift system. Geol. Soc. Am. Bull. 101, 885–903.
Engelmann de Oliveira, C. H., Jelinek, A. R., Chemale, F Jr., and Bernet, M. (2016). Evidence of post-Gondwana breakup in Southern Brazilian Shield : insights from apatite and zircon fission track thermochronology. Tectonophysics 666, 173–187. doi: 10.1016/j.tecto.2015.11.005
Fishwick, S. (2010). Surface wave tomography: imaging of the lithosphere – asthenosphere boundary beneath central and southern Africa? Lithos 120, 63–73. doi: 10.1016/j.lithos.2010.05.011
Gabrielsen, R. H., Sokoutis, D., Willingshofer, E., and Faleide, J. I. (2016). Fault linkage across weak layers during extension : an experimental approach with reference to the Hoop Fault Complex of the SW Barents Sea. Pet. Geosci. 22, 123–135. doi: 10.1144/petgeo2015-029
Gueydan, F., and Précigout, J. (2014). Modes of continental rifting as a function of ductile strain localization in the lithospheric mantle. Tectonophysics 612–613, 18–25. doi: 10.1016/j.tecto.2013.11.029
Gueydan, F., Précigout, J., and Montési, L. G. J. (2014). Strain weakening enables continental plate tectonics. Tectonophysics 631, 189–196. doi: 10.1016/j.tecto.2014.02.005
Heit, B., Sodoudi, F., Yuan, X., Bianchi, M., and Kind, R. (2007). An S receiver function analysis of the lithospheric structure in South America. Geophys. Res. Lett. 34, 1–5. doi: 10.1029/2007GL030317
Hubbert, M. K. (1937). Theory of scale models as applied to the study of geologic structures. Bull. Geol. Soc. Am. 48, 1459–1520.
Huismans, R. S., and Beaumont, C. (2007). Roles of lithospheric strain softening and heterogeneity in determining the geometry of rifts and continental margins. Geol. Soc. Lond. Spec. Publ. 282, 111–138. doi: 10.1144/SP282.6
Konopásek, J., Sláma, J., and Kosler, J. (2016). Linking the basement geology along the Africa-South America coasts in the South Atlantic. Precambrian Res. 280, 221–230. doi: 10.1016/j.precamres.2016.05.011
Koptev, A., Burov, E., Calais, E., Leroy, S., Gerya, T., Guillou-Frottier, L., et al. (2016). Contrasted continental rifting via plume-craton interaction: applications to Central East African Rift. Geosci. Front. 7, 221–236. doi: 10.1016/j.gsf.2015.11.002
Koptev, A., Calais, E., Burov, E., Leroy, S., and Gerya, T. (2015). Dual continental rift systems generated by plume – lithosphere interaction. Nat. Geosci. 8, 388–392. doi: 10.1038/NGEO2401
Manatschal, G., Lavier, L., and Chenin, P. (2015). The role of inheritance in structuring hyperextended rift systems: some considerations based on observations and numerical modeling. Gondwana Res. 27, 140–164. doi: 10.1016/j.gr.2014.08.006
Maystrenko, Y. P., Scheck-Wenderoth, M., Hartwig, A., Anka, Z., Watts, A. B., Hirsch, K. K., et al. (2013). Structural features of the Southwest African continental margin according to results of lithosphere-scale 3D gravity and thermal modelling. Tectonophysics 604, 104–121. doi: 10.1016/j.tecto.2013.04.014
Müller, R. D., Sdrolias, M., Gaina, C., Steinberger, B., and Heine, C. (2008). Long-term sea-level fluctuations driven by ocean basin dynamics. Science 319, 1357–1362. doi: 10.1126/science.1151540
Munteanu, I., Willingshofer, E., Matenco, L., Sokoutis, D., and Cloetingh, S. (2014). Far-field contractional polarity changes in models and nature. Earth Planet. Sci. Lett. 395, 101–115. doi: 10.1016/j.epsl.2014.03.036
Naliboff, J. B., Buiter, S. J. H., Péron-Pinvidic, G., Osmundsen, P. T., and Tetreault, J. (2017). Complex fault interaction controls continental rifting. Nat. Commun. 8, 1–9. doi: 10.1038/s41467-017-00904-x
Nestola, Y., Storti, F., and Cavozzi, C. (2015). Strain rate-dependent lithosphere rifting and necking architectures in analog experiments. J. Geophys. Res. Solid Earth 120, 584–594. doi: 10.1002/2014JB011623.Received
Pedrosa-Soares, A. C., Alkmim, F. F., Tack, L., Noce, C. M., Babinski, M., Silva, L. C., et al. (2008). Similarities and differences between the Brazilian and African counterparts of the Neoproterozoic Araçuaí – West Congo. Geol. Soc. Lond. Spec. Publ. 294, 153–172. doi: 10.1144/SP294.9
Ramberg, H. (1981). Gravity, Deformation, and the Earth's Crust in Theory, Experiments Ad Geological Application. (London: Academic Press)
Schnabel, M., Franke, D., Engels, M., Hinz, K., Neben, S., Damm, V., et al. (2008). The structure of the lower crust at the Argentine continental margin, South Atlantic at 44°S. Tectonophysics 454, 14–22. doi: 10.1016/j.tecto.2008.01.019
Seton, M., Müller, R. D., Zahirovic, S., Gaina, C., Torsvik, T., Shephard, G., et al. (2012). Earth-science reviews global continental and ocean basin reconstructions since 200 Ma. Earth Sci. Rev. 113, 212–270. doi: 10.1016/j.earscirev.2012.03.002
Sokoutis, D., Burg, J., Bonini, M., Corti, G., and Cloetingh, S. (2005). Lithospheric-scale structures from the perspective of analogue continental collision. Tectonophysics 406, 1–15. doi: 10.1016/j.tecto.2005.05.025
Sokoutis, D., Corti, G., Bonini, M., Pierre Brun, J., Cloetingh, S., Mauduit, T., et al. (2007). Modelling the extension of heterogeneous hot lithosphere. Tectonophysics 444, 63–79. doi: 10.1016/j.tecto.2007.08.012
Stankiewicz, J., Chevrot, S., Van Der Hilst, R. D., and De Wit, M. J. (2002). Crustal thickness, discontinuity depth, and upper mantle structure beneath southern Africa: constraints from body wave conversions. Phys. Earth Planet. Inter. 130, 235–251. doi: 10.1016/S0031-9201.(02).00012-2
Torsvik, T. H., Smethurst, M. A., Burke, K., and Steinberger, B. (2006). Large igneous provinces generated from the margins of the large low-velocity provinces in the deep mantle. Geophys. J. Int. 167, 1447–1460. doi: 10.1111/j.1365-246X.2006.03158.x
Van Der Meijde, M., Julià, J., and Assumpção, M. (2013). Gravity derived Moho for South America. Tectonophysics 609, 456–467. doi: 10.1016/j.tecto.2013.03.023
Will, T. M., and Frimmel, H. E. (2017). Where does a continent prefer to break up? Some lessons from the South Atlantic margins. Gondwana Res. 53, 9–19. doi: 10.1016/j.gr.2017.04.014
Willingshofer, E., Sokoutis, D., and Burg, J.-P. (2005). Lithospheric-scale analogue modelling of collision zones with a pre-existing weak zone. Geol. Soc. London, Spec. Publ. 243, 277–294. doi: 10.1144/GSL.SP.2005.243.01.18
Keywords: rifting, lithosphere, analog modeling, South Atlantic, deformation localization
Citation: Beniest A, Willingshofer E, Sokoutis D and Sassi W (2018) Extending Continental Lithosphere With Lateral Strength Variations: Effects on Deformation Localization and Margin Geometries. Front. Earth Sci. 6:148. doi: 10.3389/feart.2018.00148
Received: 29 June 2018; Accepted: 18 September 2018;
Published: 23 October 2018.
Edited by:
Mélody Philippon, UMR5243 Géosciences Montpellier, FranceReviewed by:
Damien Delvaux, Royal Museum for Central Africa, BelgiumCopyright © 2018 Beniest, Willingshofer, Sokoutis and Sassi. This is an open-access article distributed under the terms of the Creative Commons Attribution License (CC BY). The use, distribution or reproduction in other forums is permitted, provided the original author(s) and the copyright owner(s) are credited and that the original publication in this journal is cited, in accordance with accepted academic practice. No use, distribution or reproduction is permitted which does not comply with these terms.
*Correspondence: Anouk Beniest, YW5vdWsuYmVuaWVzdEBldHUudXBtYy5mcg==
Disclaimer: All claims expressed in this article are solely those of the authors and do not necessarily represent those of their affiliated organizations, or those of the publisher, the editors and the reviewers. Any product that may be evaluated in this article or claim that may be made by its manufacturer is not guaranteed or endorsed by the publisher.
Research integrity at Frontiers
Learn more about the work of our research integrity team to safeguard the quality of each article we publish.