 Daniel Dzurisin
- David A. Johnston Cascades Volcano Observatory, United States Geological Survey, Vancouver, WA, United States
Since awakening from a 123-year repose in 1980, Mount St. Helens has provided an opportunity to study changes in crustal magma storage at an active arc volcano—a process of fundamental importance to eruption forecasting and hazards mitigation. There has been considerable progress, but important questions remain unanswered. Was the 1980 eruption triggered by an injection of magma into an upper crustal reservoir? If so, when? How did magma rise into the edifice without producing detectable seismicity deeper than ∼2.5 km or measurable surface deformation beyond the volcano’s north flank? Would precursory activity have been recognized earlier if current monitoring techniques had been available? Despite substantial improvements in monitoring capability, similar questions remain after the dome-forming eruption of 2004–2008. Did additional magma accumulate in the reservoir between the end of the 1980–1986 eruption and the start of the 2004–2008 eruption? If so, when? What is the significance of a relative lull in seismicity and surface deformation for several years prior to the 2004–2008 eruption onset? How did magma reach the surface without producing seismicity deeper than ∼2 km or measurable deformation more than a few hundred meters from the vent? Has the reservoir been replenished since the eruption ended, and is it now primed for the next eruption? What additional precursors, if any, should be expected? This paper addresses these questions, explores possible answers, and identifies unresolved issues in need of additional study. The 1980–1986 and 2004–2008 eruptions could have resulted from second boiling during crystallization of magma long-resident in an upper crustal reservoir, rather than from injection of fresh magma from below. If reservoir pressurization and magma ascent were slow enough, resulting strain might have been accommodated by viscoelastic deformation, without appreciable seismicity or surface deformation, until rising magma entered a brittle regime within 2–2.5 km of the surface. Given the remarkably gas-poor nature of the 2004–2008 dome lava, future eruptive activity might require a relatively long period of quiescence and reservoir pressurization or a large injection of fresh magma—an event that arguably has not occurred since the Kalama eruptive period (C.E. 1479–1720).
Introduction
Of fundamental importance to the understanding of active magmatic systems and to assessments of volcano hazards is the process of magma accumulation in crustal reservoirs. Indicators can include anomalous seismicity, ground deformation, changes in flux or composition of aqueous or gas emissions, and residual gravity changes (Tilling, 2008). Given current understanding and recent experience at several volcanoes worldwide, we can expect at least subtle changes in those indicators to occur months to perhaps years before the onset of eruptive activity—especially at closed-vent volcanoes after long repose periods. However, detecting those changes continues to pose a difficult challenge at one of the most closely monitored volcanoes on Earth.
At Mount St. Helens, Washington, United States, two eruptive episodes in the past four decades have provided opportunities to study changes in crustal magma storage at an active arc volcano: (1) a sequence of explosive and dome-forming eruptions during 1980–1986, and (2) a continuous dome-forming eruption during 2004–2008. Much has been learned, but important questions remain unanswered. New insights and modeling approaches have revealed complexities that have yet to be fully addressed. Seemingly enigmatic observations can be explained on an ad hoc basis, but a lack of hard constraints limits most of those explanations to plausibility arguments.
This paper explores the current state of knowledge, highlights some unresolved issues, and offers suggestions for ways to move forward both at Mount St. Helens and elsewhere. The emphasis is on seismic and geodetic information, reflecting the author’s background in geophysics; lesser amounts of geochemical and petrologic evidence are cited where pertinent. More information about geochemical signals to be expected at restless volcanoes is available in a recent review of that topic by Inguaggiato et al. (2018, and references therein). The principal focus of this paper is on the upper 15 km of Mount St. Helens’ magmatic system, including a magma storage zone that fed the 1980–1986 and 2004–2008 eruptions. The entire system from upper crust to Moho has been imaged recently by the multidisciplinary Imaging Magma Under St. Helens (iMUSH) project1. An anomalous zone between about 4 and 14 km below sea level (BSL), characterized by high seismic Vp/Vs ratios and low Vp values, is inferred to represent a crustal magma reservoir; maximum melt fractions of 10–12% are inferred at 4–6 km BSL (Kiser et al., 2016, 2018). Henceforth, when citing depths, I have in some cases specified below the surface, below the vent, or below sea level; where not specified, below the surface is implied. At Mount St. Helens, surface elevation in the vent area (1980 crater floor) is ∼2 km above sea level.
Mount St. Helens 1980: Lingering Questions
The Goat Rocks eruptive period at Mount St. Helens ended in 1857 (Hoblitt et al., 1980), 123 years prior to the volcano’s reawakening in 1980. Any signs that Mount St. Helens’ century-long quiescence was nearing an end went unnoticed until less than 2 weeks before the first phreatic eruption. The earliest indication of unrest was a gradual increase in daily earthquake counts starting on March 15, 1980, followed by the first of many magnitude 4+ earthquakes on March 20. The ensuing swarm intensified further on March 25 and peaked on March 27, when the first phreatic eruption occurred (Endo et al., 1981). Observers on an overflight several hours later reported (Christiansen and Peterson, 1981, p. 18):
A new crater about 60–75 m across had formed in the northern part of the old 400-m-wide ice-filled summit crater, and snow on the southeast sector of the volcano was covered by dark ash emitted from the new crater… The summit area was bisected by an east-trending fracture nearly 1,500 m long that extended from high on the northwest flank, across the old crater, down the upper northeast flank. Another less continuous fracture system paralleled this master fracture just north of the old crater rim and bounded the south side of a newly uplifted block, or bulge, on the volcano’s north flank. These changes clearly had occurred during the period of extremely high seismicity and initial eruption, between observations on the morning of March 25 and the afternoon of March 27.
Photogrammetric and geodetic measurements showed that the bulge grew outward at rates of 1.5–2.5 m/day until it failed catastrophically on May 18, disrupting a growing cryptodome, triggering a lateral blast, and producing a massive debris avalanche (Jordan and Kieffer, 1981; Lipman et al., 1981; Moore and Albee, 1981; Voight et al., 1981). Seismic, deformation, and petrologic evidence indicates that the main explosive phase of the eruption tapped a vertically elongate reservoir at least 7–8 km below vent level, extending to perhaps twice that depth (Scandone and Malone, 1985; Pallister et al., 1992 and references therein; Waite and Moran, 2009), consistent with recent seismic tomography results (Kiser et al., 2016, 2018).
Nearly all recorded seismicity during March 15–May 18, 1980, including more than 2,400 earthquakes with local magnitudes greater than 2.4, was confined to a small volume less than 2.5 km beneath the volcano’s north flank (Endo et al., 1981). The appearance of a graben and north-flank bulge on March 27, combined with the fact that the May 18 landslide transected an active cryptodome, indicates that magma had already intruded the edifice, probably to within several hundred meters of the surface, only 7 days after the onset of intense seismicity on March 20 (12 days after the initial uptick in seismicity on March 15). At the time there was no local seismic network, only one short-period vertical-component seismometer that was installed on the volcano’s west flank in 1972 (SHW, 3.5 km from the summit; Endo et al., 1981; Malone et al., 1981) (Figure 1). So, the lack of any deeper or longer-term seismic indication that the volcano’s repose was coming to an end can be attributed in part to limited seismic monitoring. However, the same is true for geodetic precursors: If any occurred prior to the onset of shallow seismicity or beyond the north-flank bulge, they went unnoticed.
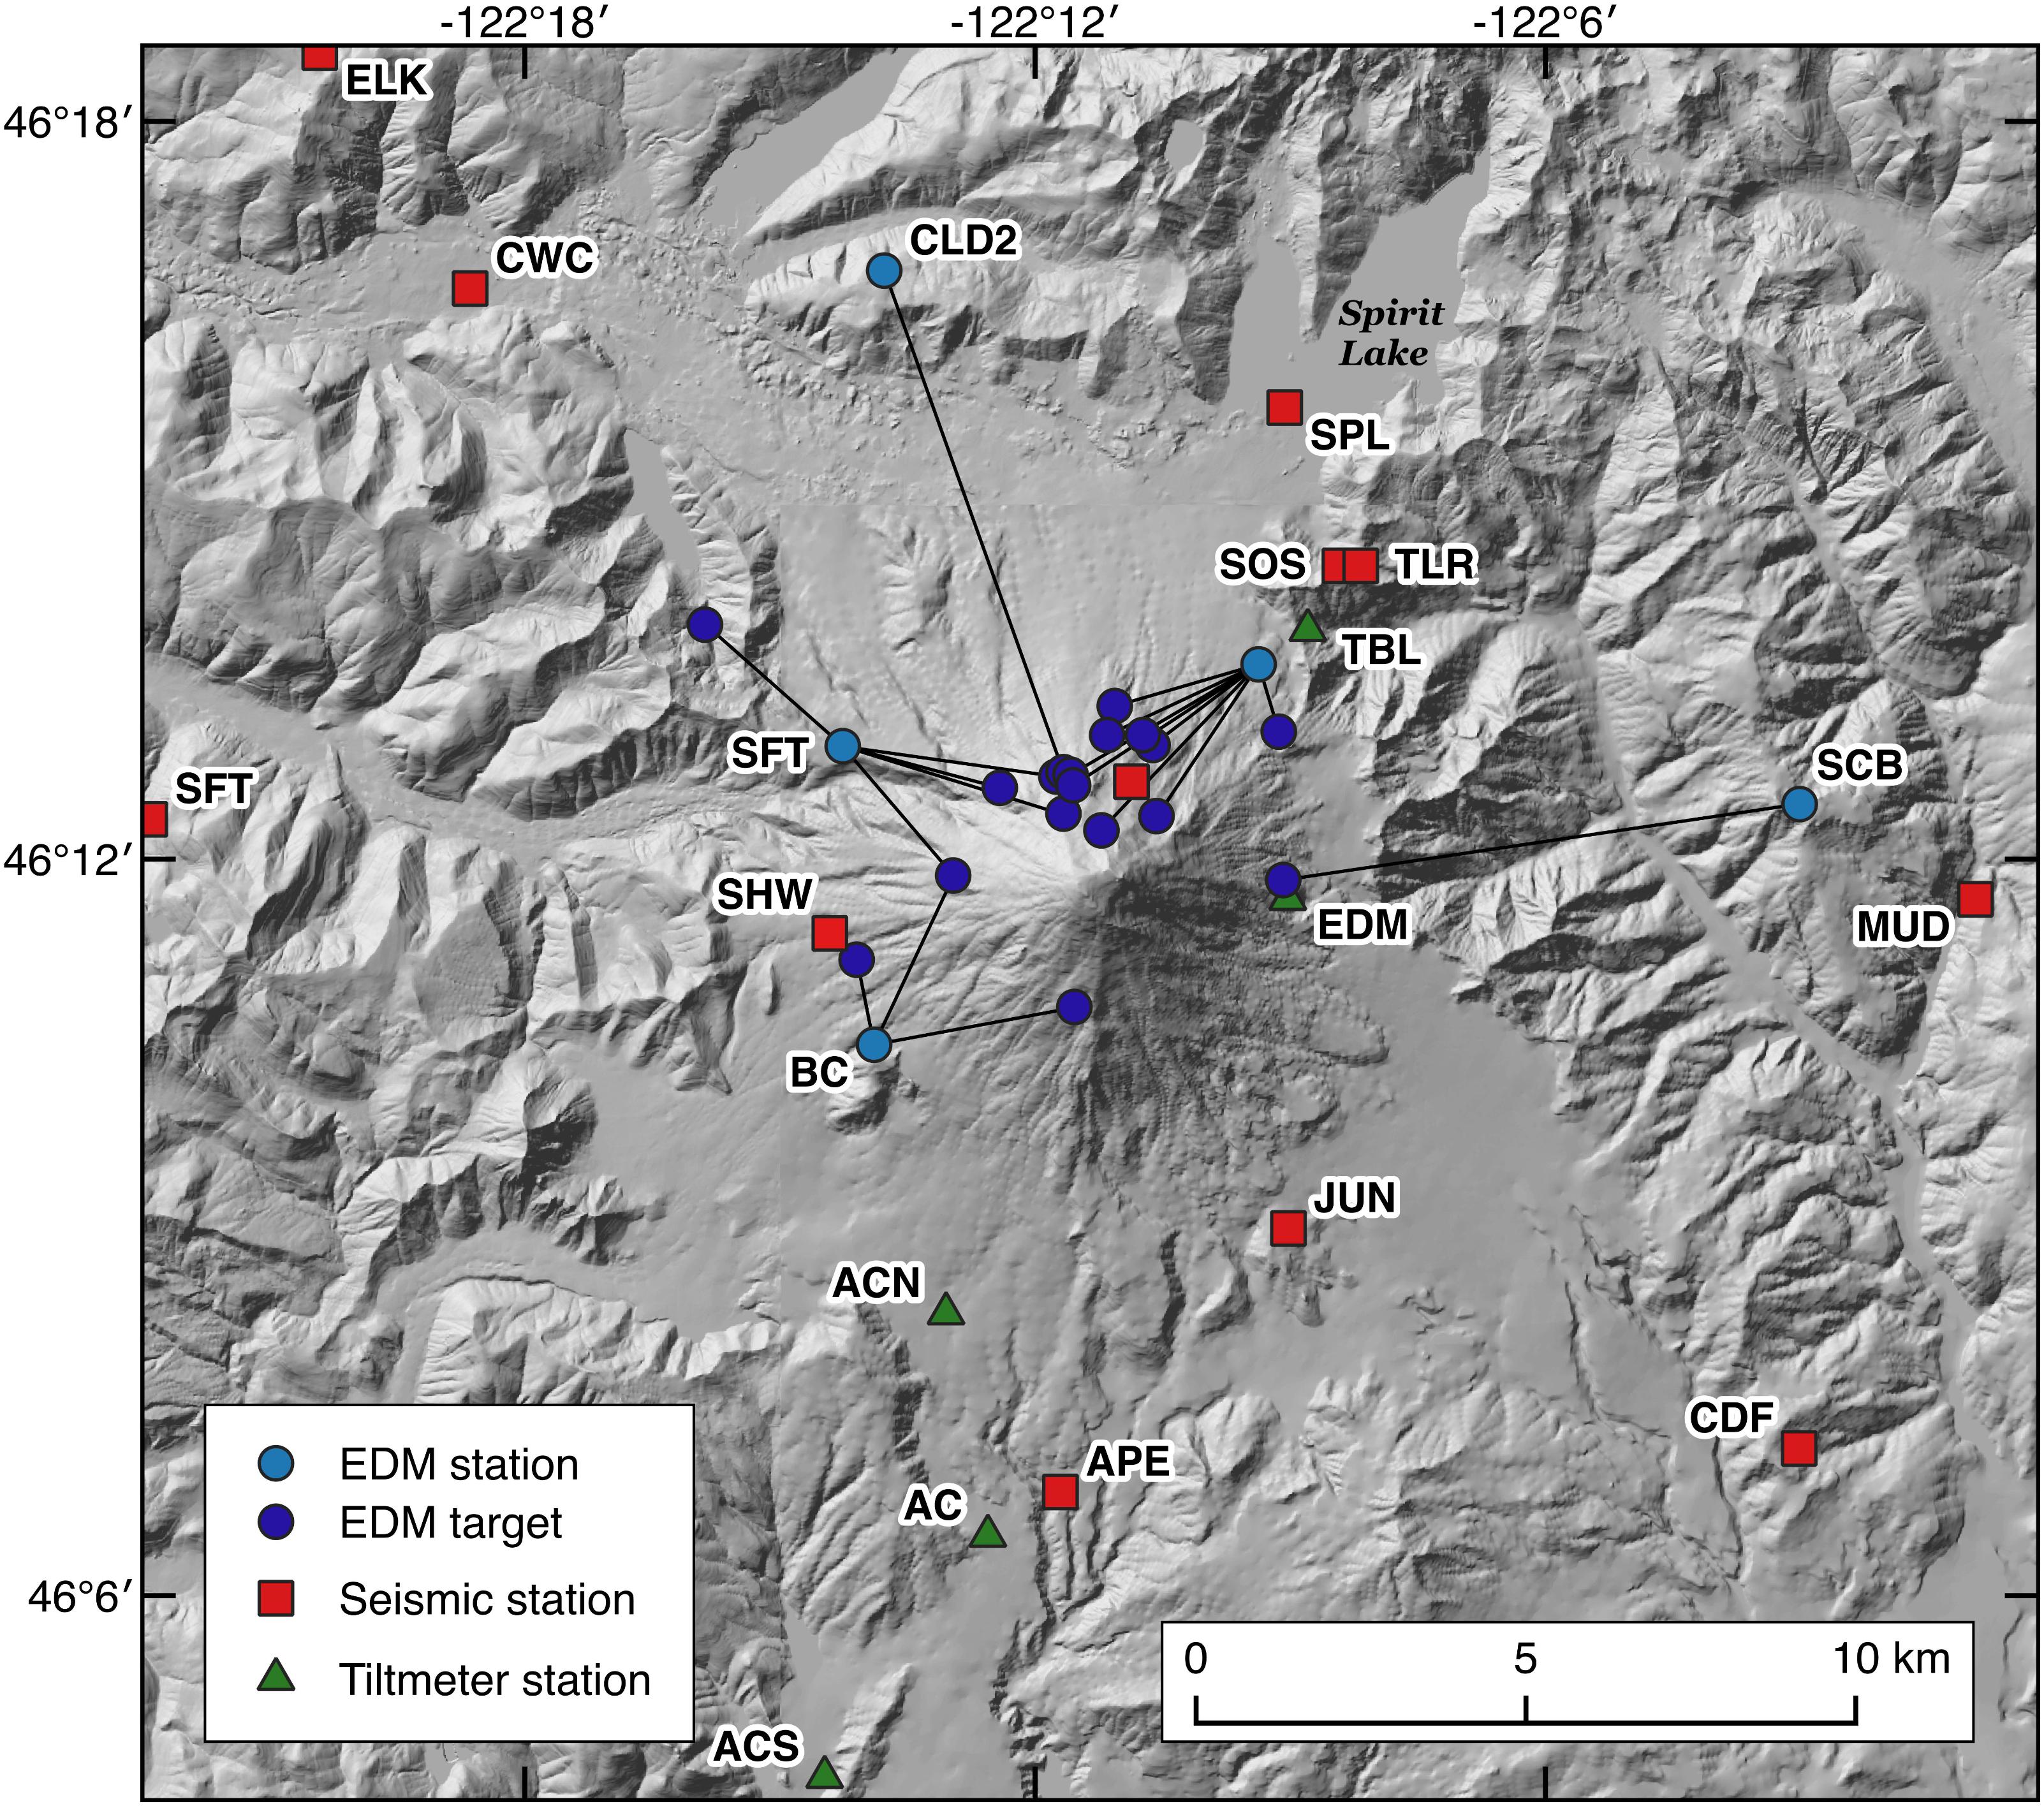
FIGURE 1. Map showing seismic, EDM, and tiltmeter stations at Mount St. Helens prior to the 1980–1986 eruption. Seismic station SHW and EDM line EDM–SCB were installed or first measured in 1972, respectively; all other stations and lines were installed or first measured after the onset of intense shallow seismicity on March 20, 1980. In addition to the spirit-level triangle at Timberline campground (TBL), the surface of Spirit Lake was used as a water tiltmeter (see text). Some peripheral seismic stations are omitted to keep the map at a legible scale. Seismic station locations are from Malone et al. (1981). EDM station and target locations are from Lipman et al. (1981). Tiltmeter station locations are from Dvorak et al. (1981). See original publications for additional information. Hillshade is based on a USGS topographic map and depicts pre-1980 topography.
Three types of ground-tilt measurements were made on the lower flanks and around the base of Mount St. Helens starting in late March 1980 (Figure 1). The ice-covered surface of Spirit Lake, ∼8 km NNE of the summit, was used as a large water tiltmeter, and a spirit-level triangle was established at Timberline campground ∼5 km NE of the summit (Figure 1, TBL). No tilts larger than the estimated measurement precision of 2 microradians were observed at Spirit Lake. At TBL, small inflationary tilts were observed before some phreatic eruptions and deflation during them, but no long-term trend indicative of a deeper magmatic source was apparent (Lipman et al., 1981). Five electronic tiltmeters were installed during the latter half of April at radial distances of 3–15 km from the summit; none recorded a significant change in tilt prior to the May 18 eruption (Dvorak et al., 1981).
A 7.6-km EDM line from Smith Creek Butte to East Dome—part of a trilateration network surrounding Mount St. Helens that was established in 1972—was re-measured for the first time on April 10, 1980, and again on April 25 (Figure 1, SCB–EDM). All line-length changes were within measurement uncertainty (Lipman et al., 1981). Dzurisin (2007, pp. 346–347) raised the possibility that the line’s configuration made it insensitive to pressure changes in the reservoir-conduit system that fed the May 18, 1980, eruption. An alternative explanation, consistent with the absence of progressive changes in ground-tilt at Spirit Lake, TBL, and all five tiltmeter sites, is that little or no far-field deformation occurred during 2 months of seismicity, phreatic eruptions, and cryptodome growth leading up to the catastrophic events of May 18. The situation was dramatically different on the volcano’s north flank, however.
A local geodetic network was established at Mount St. Helens in April 1980 (Figure 1). Repeated EDM and theodolite measurements revealed intense deformation of the volcano’s north flank but only small changes elsewhere on the edifice (1.5–2.5 m/day versus a few mm/day). Lipman et al. (1981, p. 151) concluded: “…except for the bulge, Mount St. Helens was geodetically stable during this period” (April 10–May 18, 1980).
In summary: (1) recorded seismicity leading up to the May 18, 1980, eruption was confined to a small volume beneath the volcano’s north flank within 2.5 km of the surface; (2) little or no surface deformation was detected outside the north-flank bulge after late March 1980; (3) magma had intruded the edifice by March 27, 1980, only 7 days after the onset of intense seismicity; and (4) seismic, geodetic, and petrologic evidence suggests the main phase of the eruption was fed from a magma reservoir at least 7–8 km deep. The apparent absence of deeper seismicity and far-field deformation can be attributed at least in part to lack of a local seismic network and sparse deformation measurements prior to March 1980. But if those precursors occurred, they were too early or too subtle to be detected by the monitoring efforts described above.
Was the 1980 eruption triggered by an injection of magma into the upper crustal reservoir beneath the volcano? If so, when? If after 1972, when seismic and geodetic monitoring began (albeit sparse), why was no evidence of magma injection detected? Following a 123-year repose, how did magma rise into the edifice without producing detectable seismicity deeper than ∼2.5 km or measurable surface deformation beyond the north-flank bulge? Would deeper or longer-term seismic precursors have been detected with a modern network of three-component broadband seismometers? Would far-field deformation indicative of a deep source have been detected if a continuous GPS (CGPS) network and InSAR monitoring had been in place? The answers to these questions are hypothetical, but nonetheless they are important for designing monitoring strategies at arc volcanoes, including Mount St. Helens and others in the Cascade arc. Before addressing issues raised by Mount St. Helens’ 1980 eruption further, the next section summarizes pertinent aspects of the volcano’s 2004–2008 dome forming eruption—and raises more questions.
Mount St. Helens 2004–2008: Questions Old and New
The May 18, 1980, eruption was followed by five smaller explosive eruptions during the remainder of 1980 and by episodic growth of a lava dome that ended in October 1986 (Swanson et al., 1987; Swanson and Holcomb, 1990; Brantley and Myers, 2000). Dome growth was accompanied by hundreds of small explosive events, some of which sent ash to heights of several kilometers above the volcano, showered the crater floor with rocks, and generated small lahars. These events, many of which were documented by observers in the field, provided context for similar events that occurred later. During August 1989–October 1991, at least six small ash-producing explosions occurred from the 1980–1986 dome, part of a series of 28 explosion-like seismic events with signatures similar to those described above (Mastin, 1994).
Measurements of a high-precision trilateration network surrounding Mount St. Helens were made with a Geodolite in 1982 and 1991, and with GPS in 2000 and 2003 (Figure 2). A small amount of areal dilatation, consistent with repressurization of the magma reservoir-conduit system that fed the 1980–1986 eruption, occurred at an average rate of 144 ± 39 nanostrain/yr during 1982–1991. With one exception, no additional deformation was detected during 1991–2000 or 2000–2003. The exception was campaign GPS station DMSH on the 1980–1986 lava dome, which moved downward ∼87 mm/yr and east-northeastward ∼35 mm/yr during 2000–2003, presumably as a result of cooling and compaction of the dome. Lisowski et al. (2008, p. 329) concluded: “Remarkably little far-field volcanic deformation has occurred around Mount St. Helens since shortly after the crater-forming collapse and eruption in 1980. Data collected in 1982 and 1991 for surveys of a regional high-precision trilateration network provide the clearest evidence for recharge of the volcano’s magma system.”
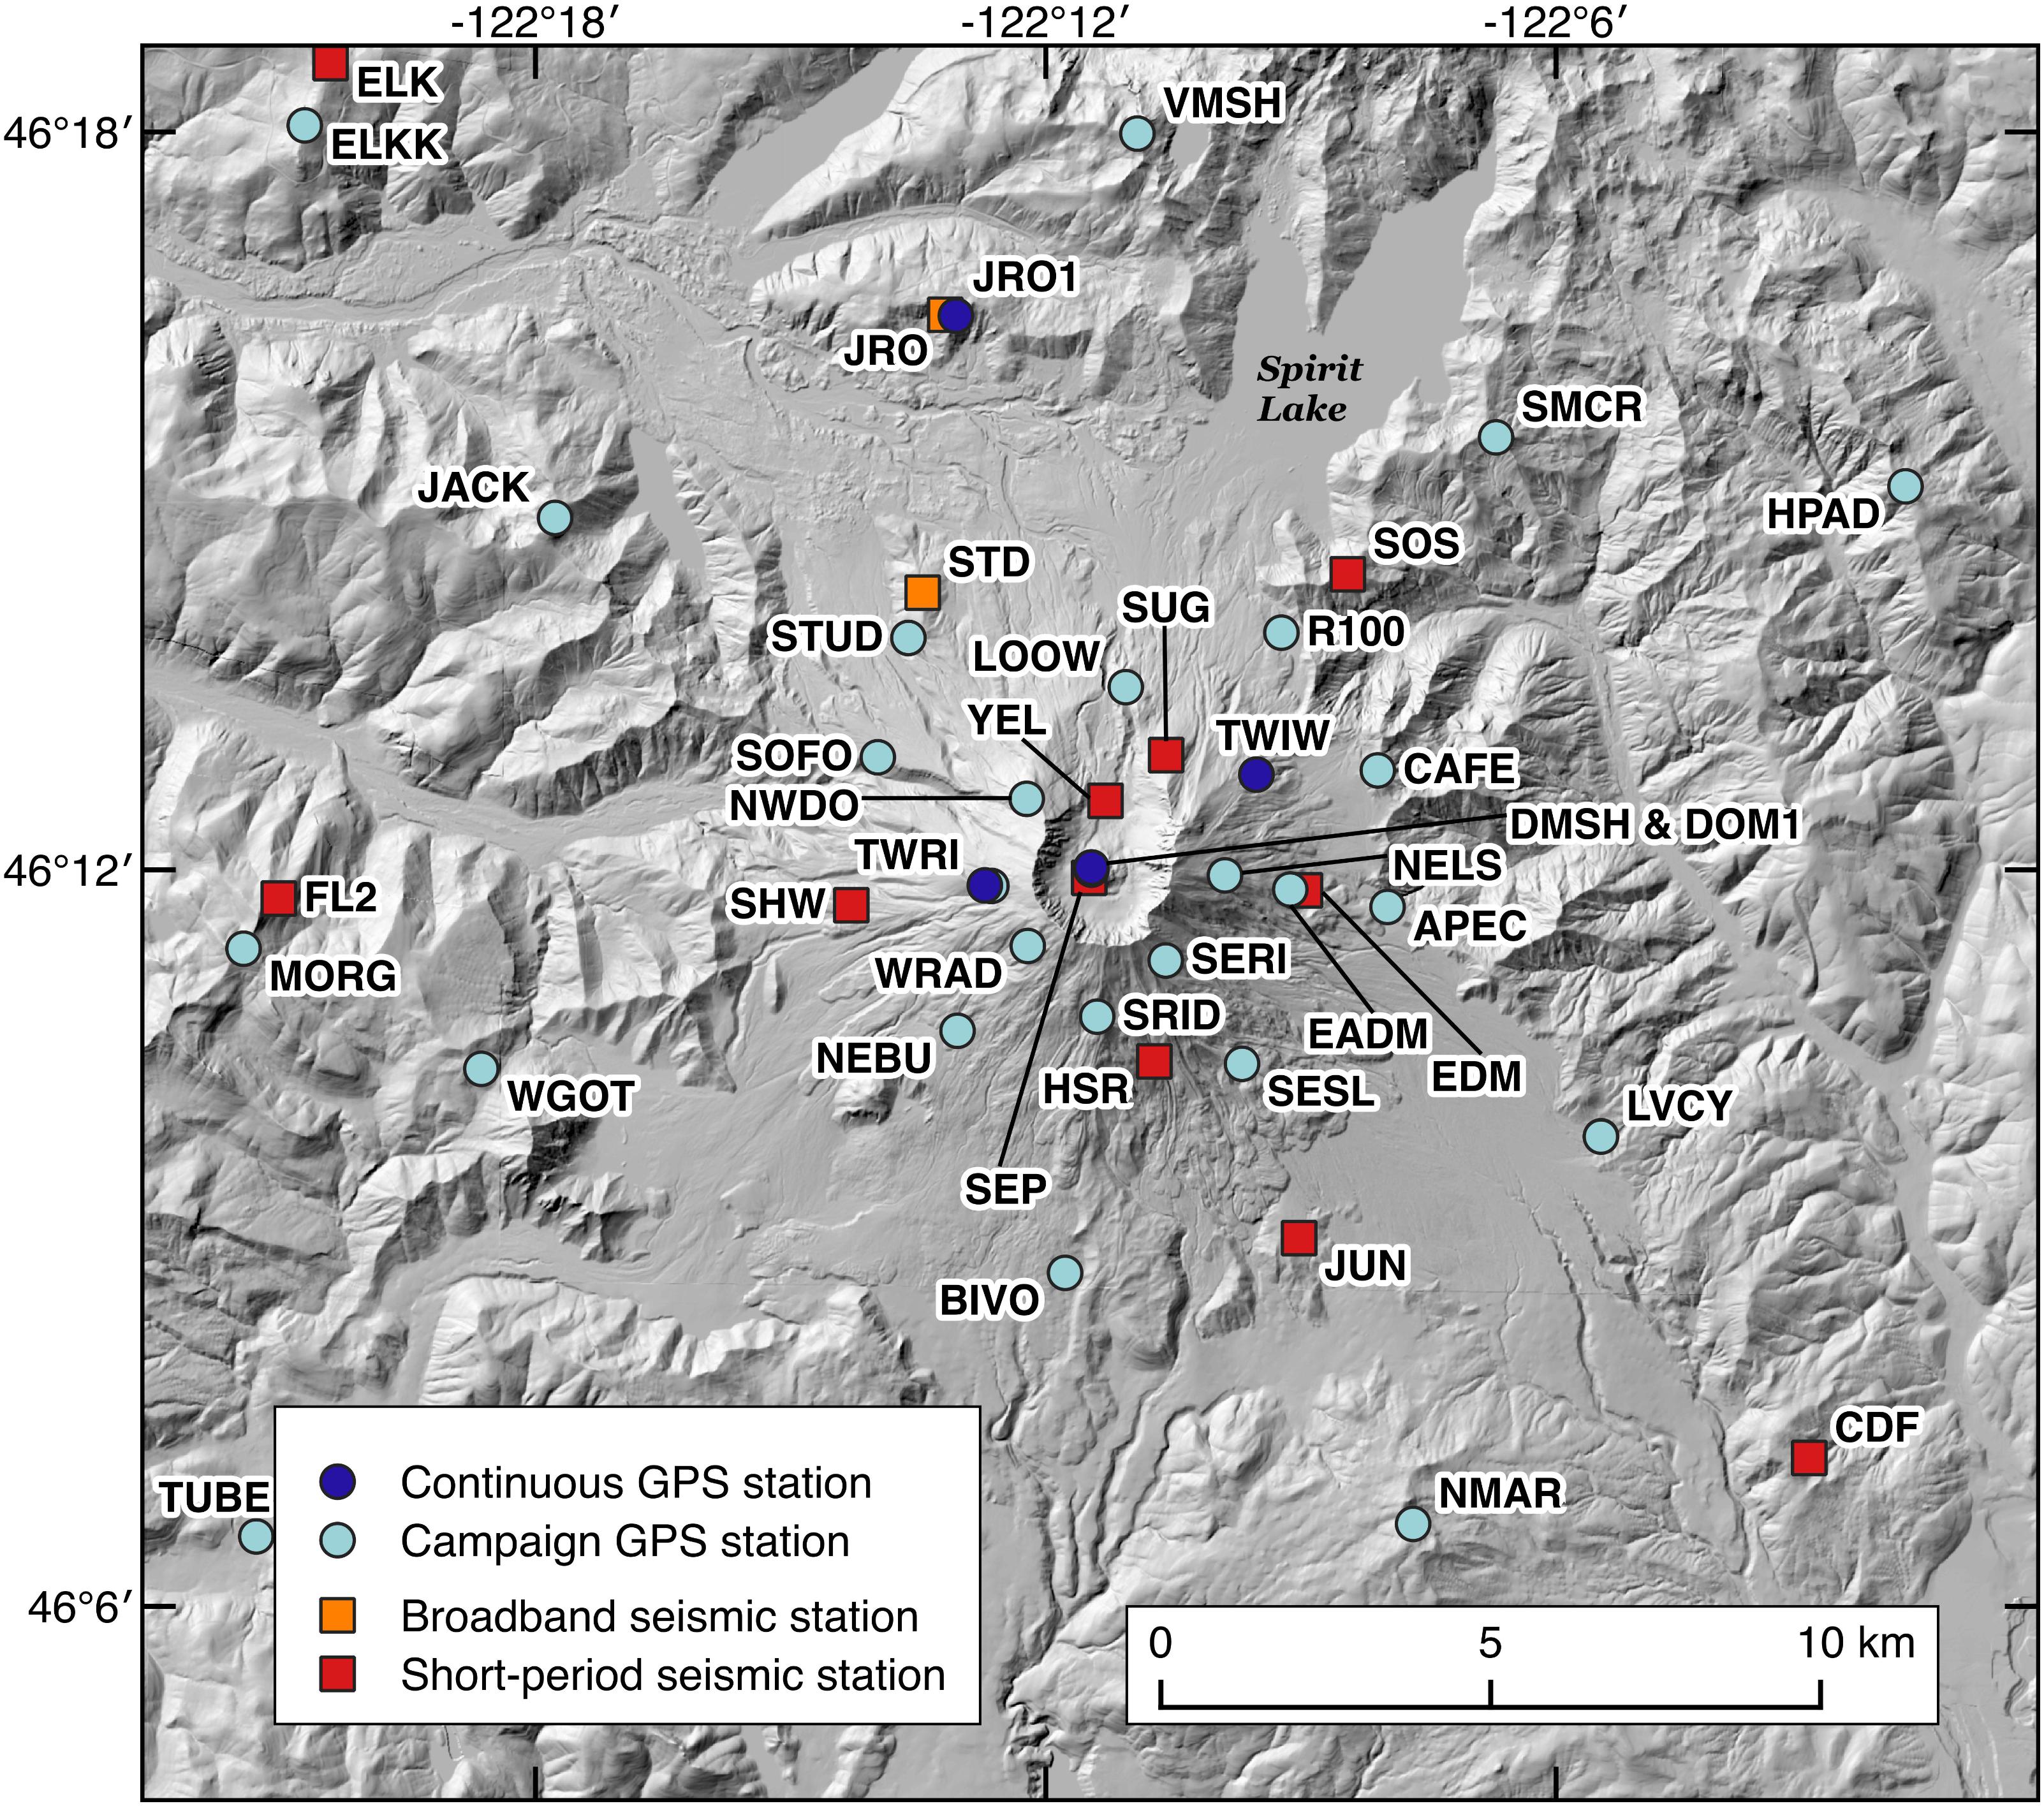
FIGURE 2. Map showing seismic and GPS stations at Mount St. Helens prior to the 2004–8 eruption. Two broadband seismic stations, JRO and STD, and two continuous GPS stations, TWRI and TWIW, were deployed in October 2004 after the start of a shallow earthquake swarm on September 23, 2004. JRO1 was the only CGPS station operating when the swarm began; power to CGPS station DOM1 was lost in January 2004 and restored on September 27, 2004. The campaign GPS network was measured in 2000, 2003, and partially in late September–early October 2004 (see Lisowski et al., 2008). Some peripheral seismic stations are omitted to keep the map at a legible scale. Seismic station locations are from Moran et al. (2008a). GPS station locations are from Dzurisin et al. (2008). See original publications for additional information. Hillshade is an ESRI Image Service product from 2013 accessed through ArcGIS Online and depicts post-1980 topography.
The trilateration results are consistent with data from CGPS station JRO1, which was established 9 km north of the volcano in 1997. It recorded no anomalous movement until the onset of shallow seismicity a few days before the appearance of a welt on the south crater floor and subsequent dome-forming eruption starting in October 2004 (see below). Together, the trilateration and JRO1 CGPS data show that only a small amount of deep-seated inflation occurred during 1982–1991 (perhaps starting after 1986, when dome extrusion ceased), and little or none occurred during 7+ years immediately preceding the start of the 2004–2008 eruption.
Starting in March 1980, the Mount St. Helens network of short-period vertical-component seismometers was expanded to include 10 stations within 10 km of the summit; more were added after the 2004–2008 eruption began, including two broadband stations (Moran et al., 2008a) (Figure 2). In 1987, earthquakes began to occur beneath Mount St. Helens at depths greater than 3 km, which had not been the case earlier except in the months following the May 18, 1980, eruption and briefly in March 1982 (Weaver et al., 1983; Moran, 1994; Musumeci et al., 2002) (Figure 3). The latter sequence was associated with an explosive eruption on March 19, 1982, that melted glacier ice in the 1980 crater and produced a lahar that reached Spirit Lake (Waitt et al., 1983). Moran (1994) computed focal mechanisms for earthquakes during 1987–1992 in two depth ranges: 4–6.5 km and 6.5–10 km BSL. Earthquakes in the first group are tightly clustered, their focal mechanisms are primarily strike-slip, and many P and T axes point in directions ∼80° offset from the regional stress field. These characteristics led Moran (1994) to conclude that they were caused by interaction of the regional stress field with the volcano’s magmatic plumbing system.
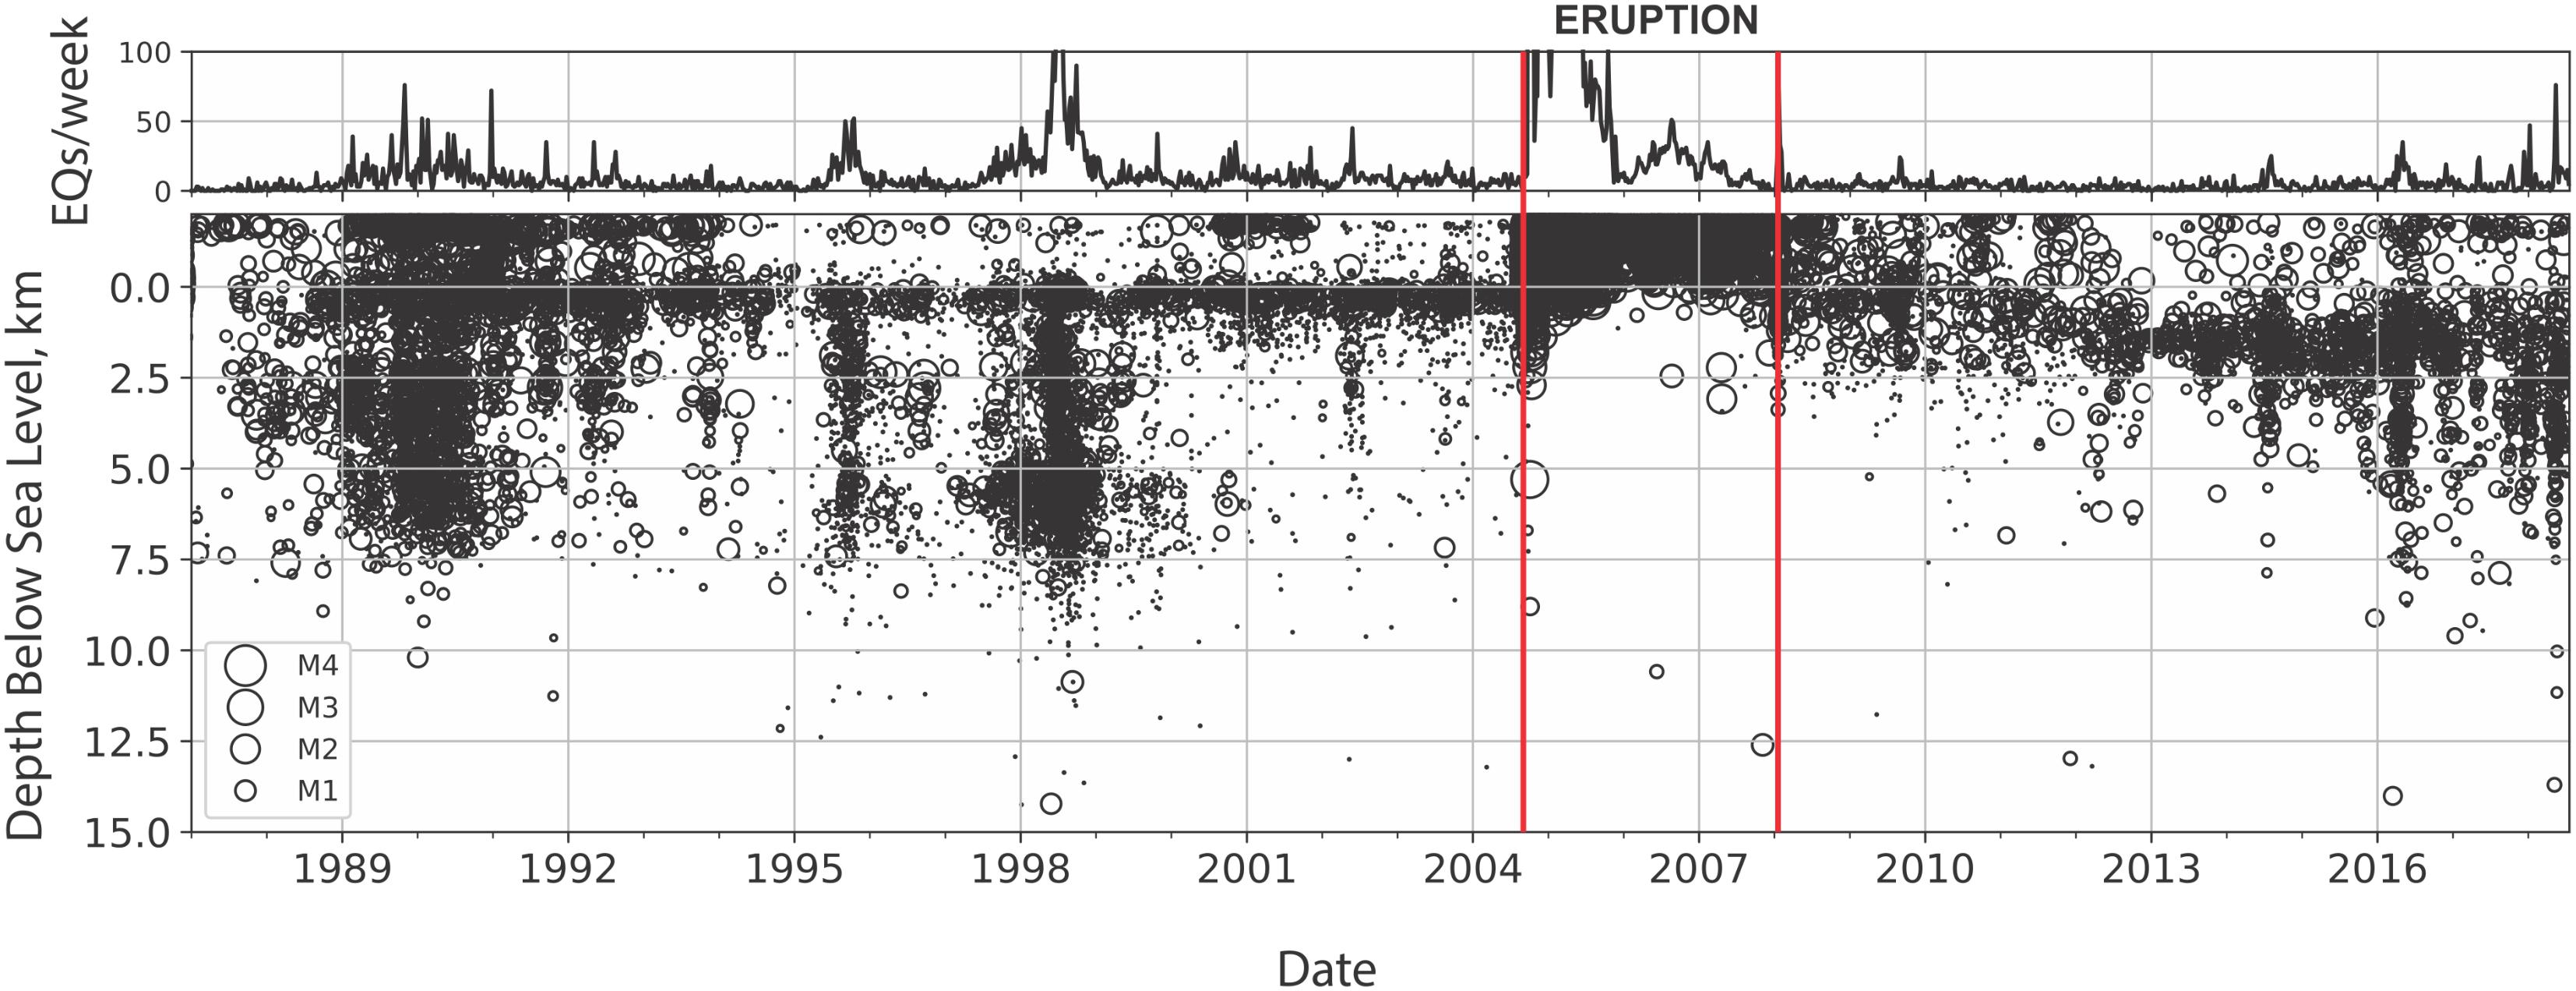
FIGURE 3. Weekly rate (top) and depth versus time plot (bottom) for earthquakes at Mount St. Helens, 1987–July 2018. Earthquakes used in this plot are from the Pacific Northwest Seismic Network (PNSN) catalog in a box bounded by 46.15 N and 46.25 N latitude, and by 122.25 W and 122.15 W longitude. All earthquakes are plotted regardless of the quality of the location. Depths are relative to sea level; surface elevations in the area are mostly 1–2 km above sea level.
The second, deeper group of earthquakes surrounds an aseismic zone that widens with depth – an inferred upper crustal magma reservoir, presumably the same one that fed the May 18, 1980, eruption (Figure 4). Earthquakes in the second group also have mostly strike-slip focal mechanisms, but unlike the first group their P and T axes show no dominant orientations. Instead, according to Moran (1994, p. 4343) “…there is a striking geometrical pattern when either the P or T axes are plotted in map view… The compressional axes define a wheel-spoke pattern, pointing radially away from the center of the 1987–1992 aseismic zone, and the tensional axes are tangentially aligned.” The pattern led Moran (1994) to conclude that the earthquakes occurred in response to pressurization of the magma storage system. Musumeci et al. (2002) came to the same conclusion based on precise relative hypocenter relocation of the earthquakes. Note that pressurization is not synonymous with replenishment, as the latter term is used here. By replenishment we mean addition of magma to a reservoir from below; in the case of a sealed reservoir or low gas-diffusivity magma, pressurization can occur without replenishment as a result of volatile exsolution during crystallization (“second boiling”).
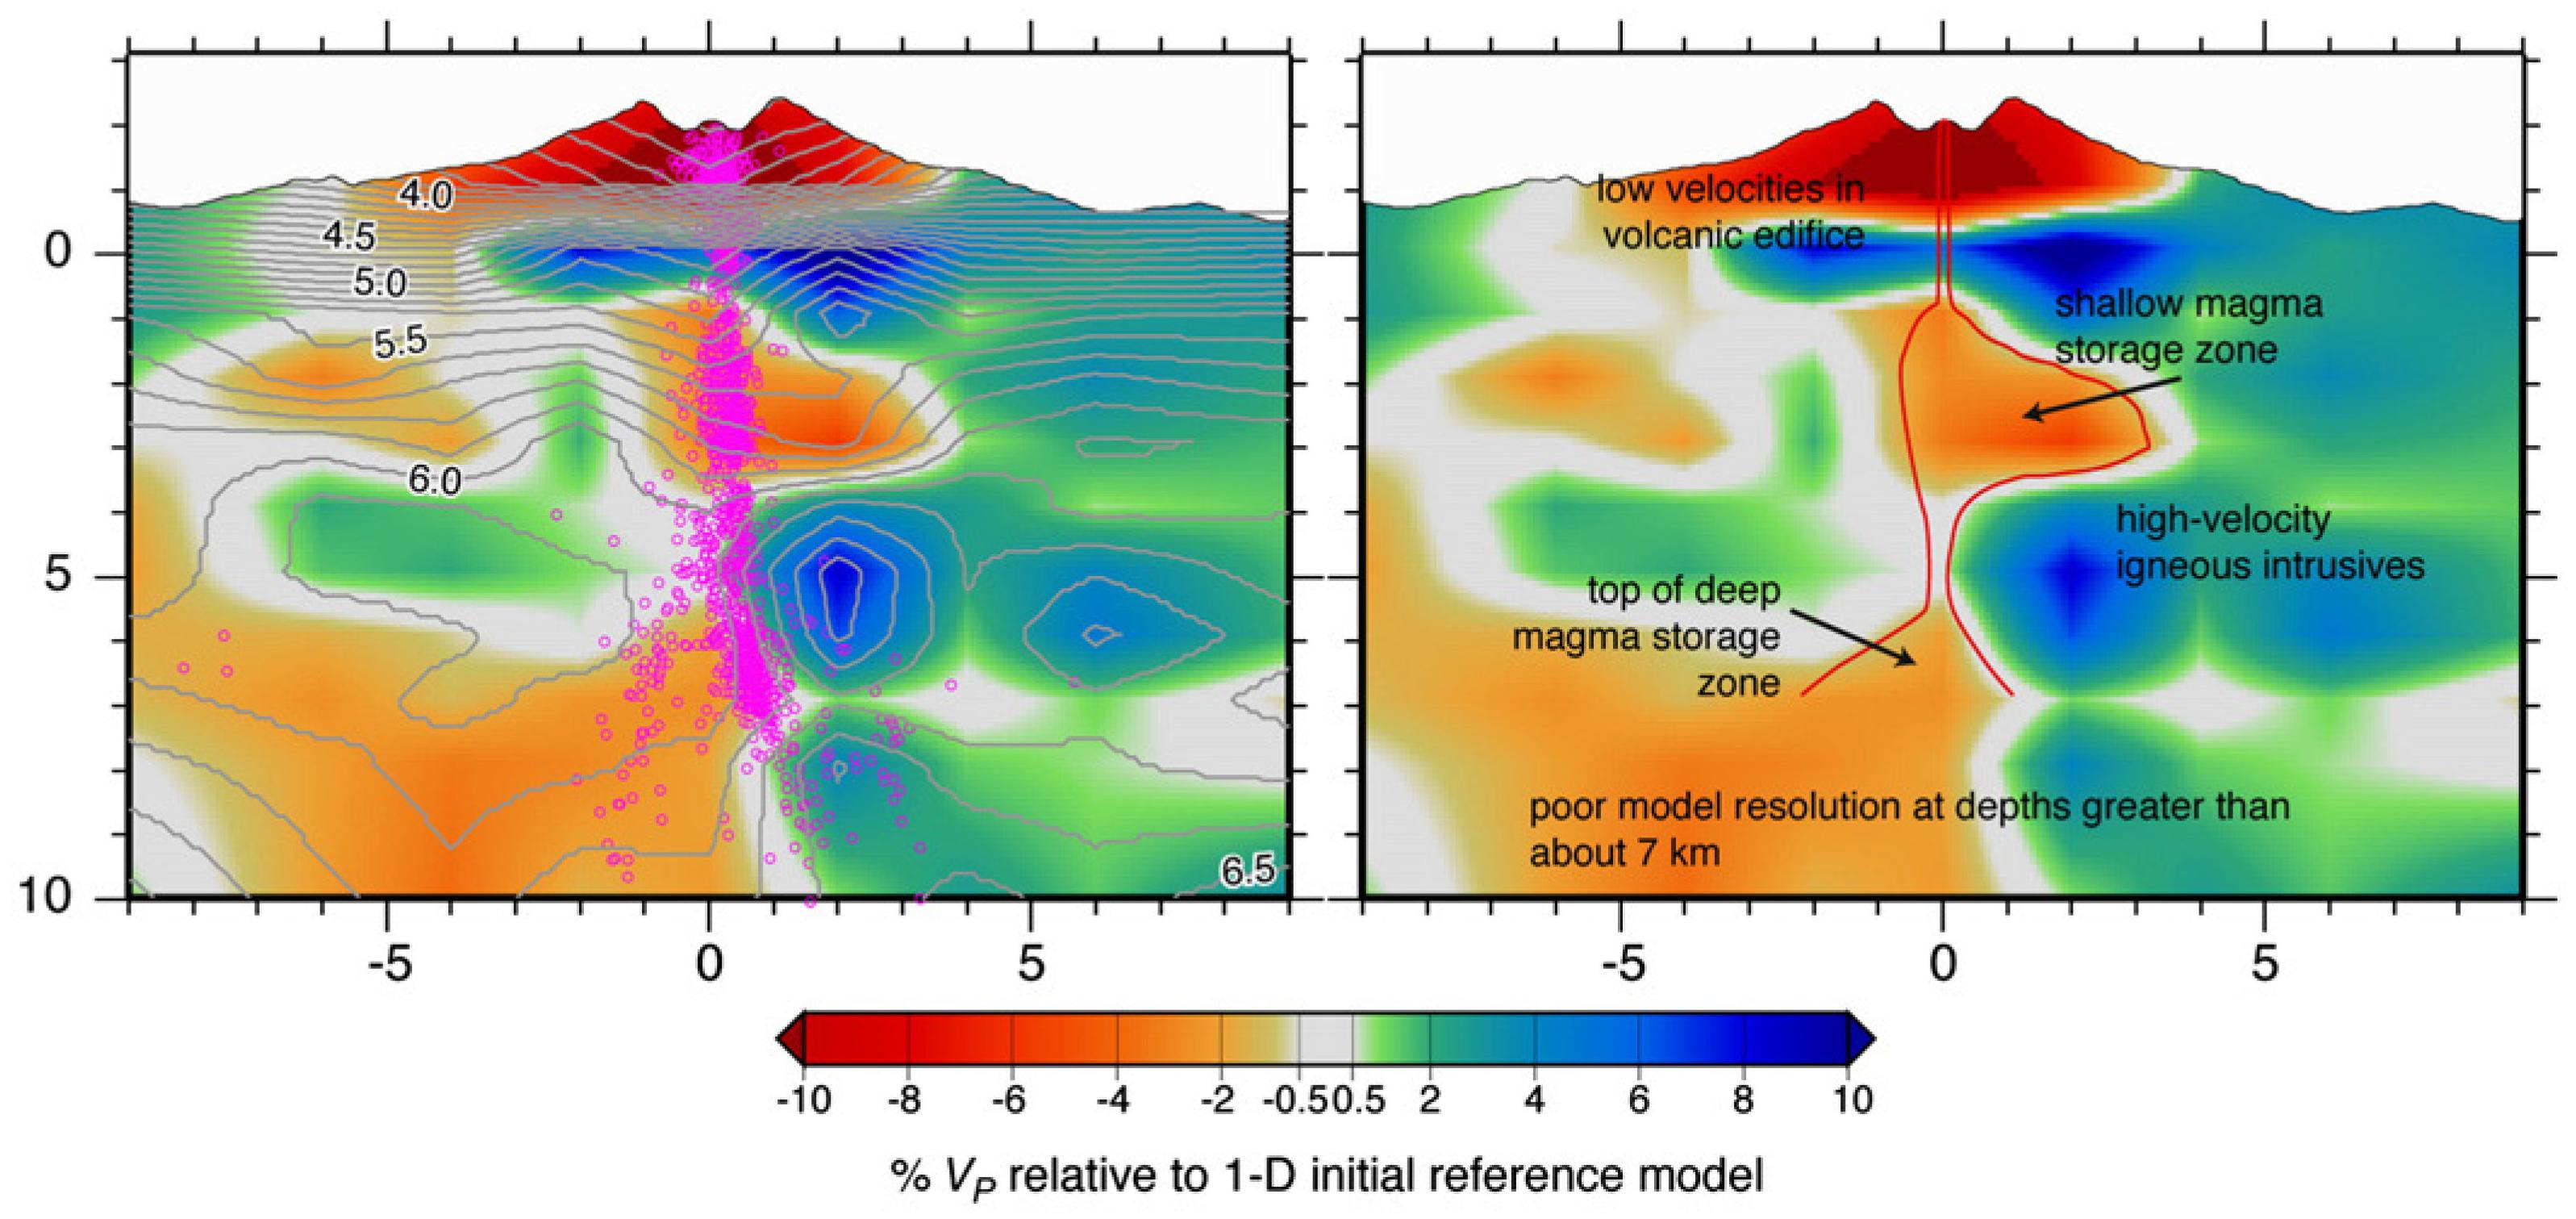
FIGURE 4. West–east cross-section showing seismic velocity structure (left) and inferred magma storage zones (right) at Mount St. Helens, reproduced from Waite and Moran (2009). Pink open circles (left) indicate earthquakes from March 1980 through June 2004, plus selected events from July 2005 to January 2006; see Waite and Moran (2009) for selection criteria. Low-velocity region labeled “top of deep magma storage zone” corresponds to the upper crustal reservoir that fed the May 18, 1980, eruption. The 2004–2008 dome-forming eruption was fed from the region labeled “shallow magma storage zone.” Vertical axis, depth in kilometers below sea level. For more recent seismic imaging of the crustal magmatic system, generally consistent but more detailed than shown here, see Kiser et al. (2016, 2018).
Seismicity continued in much the same way described by Moran (1994) through 1998. Thereafter, events deeper than ∼2 km became less common while seismicity near 2 km depth (0 km BSL in Figure 3) became more persistent. Also evident in Figure 3 is the sporadic nature of seismicity during 1987–1998. Much of the activity occurred in years-long swarms of volcano-tectonic (VT) events, with hypocenters that align along a vertical pipe from ∼0–8 km BSL. Moran (1994) and Musumeci et al. (2002) attributed the concentration of events near 2 km depth (0 km BSL) to progressive development of a plug near the top of a magma conduit outlined by seismicity in the 0–8 km BSL depth range, a process attributable to crystallization of conduit magma beneath the 1980–1986 dome. The last notable swarm below 2 km depth prior to the onset of short-term seismic and geodetic precursors to the 2004–2008 dome-forming eruption occurred in 1998. Paradoxically, seismicity deeper than 2 km was less intense during the 5 years immediately preceding the start of the eruption than it was during the previous decade (Figure 3). Recall from above that surface deformation followed a similar pattern: A small amount of dilatation occurred sometime during 1982–1991 (presumably after the 1980–1986 eruption ended), but thereafter the area was stable for more than a decade leading up to the 2004–2008 eruption.
A swarm of small VT earthquakes beneath the 1980 crater floor and south rim began on September 23, 2004, intensified for ∼36 h, and then declined to a minimum early on September 25. All located events were less than 2 km deep, most had magnitudes less than 1 (max = 2.2), and fault plane solutions were mixed. At that point the activity resembled a shallow swarm that occurred on November 2–4, 2001 (Moran et al., 2008a).
An important difference, however, is that in this case CGPS station JRO1 abruptly began moving toward the volcano and down at an average rate of 0.5 mm/day, concurrently with the start of the earthquake swarm (Lisowski et al., 2008) (Figure 5). L1 CGPS station DOM1, located ∼300 m north of what became the 2004–2008 vent (collocated with campaign GPS benchmark DMSH) also moved, but the timing is poorly constrained. Power to the station was lost in January 2004 and restored on September 27, 2004 (LaHusen et al., 2008). Sometime between January and September 28, 2004, DOM1 moved 236 ± 16 mm north-northwest and 90 ± 40 mm up, in strong contrast to its east-northeast and down motion during 2000–2003. Its 2004 movement was up and away from a shallow intrusion under the south crater floor beginning in late September 2004 (see below), suggesting a causal relationship. More than a dozen campaign GPS stations on and around Mount St. Helens were occupied during late September–early October 2004. All offsets were small and no convincing pattern of deformation emerged (Lisowski et al., 2008). Only CGPS stations JRO1, 9 km from the 2004–2008 vent, and DOM1, 300 m away, moved appreciably in the days before extrusion began—toward and away from the vent, respectively.
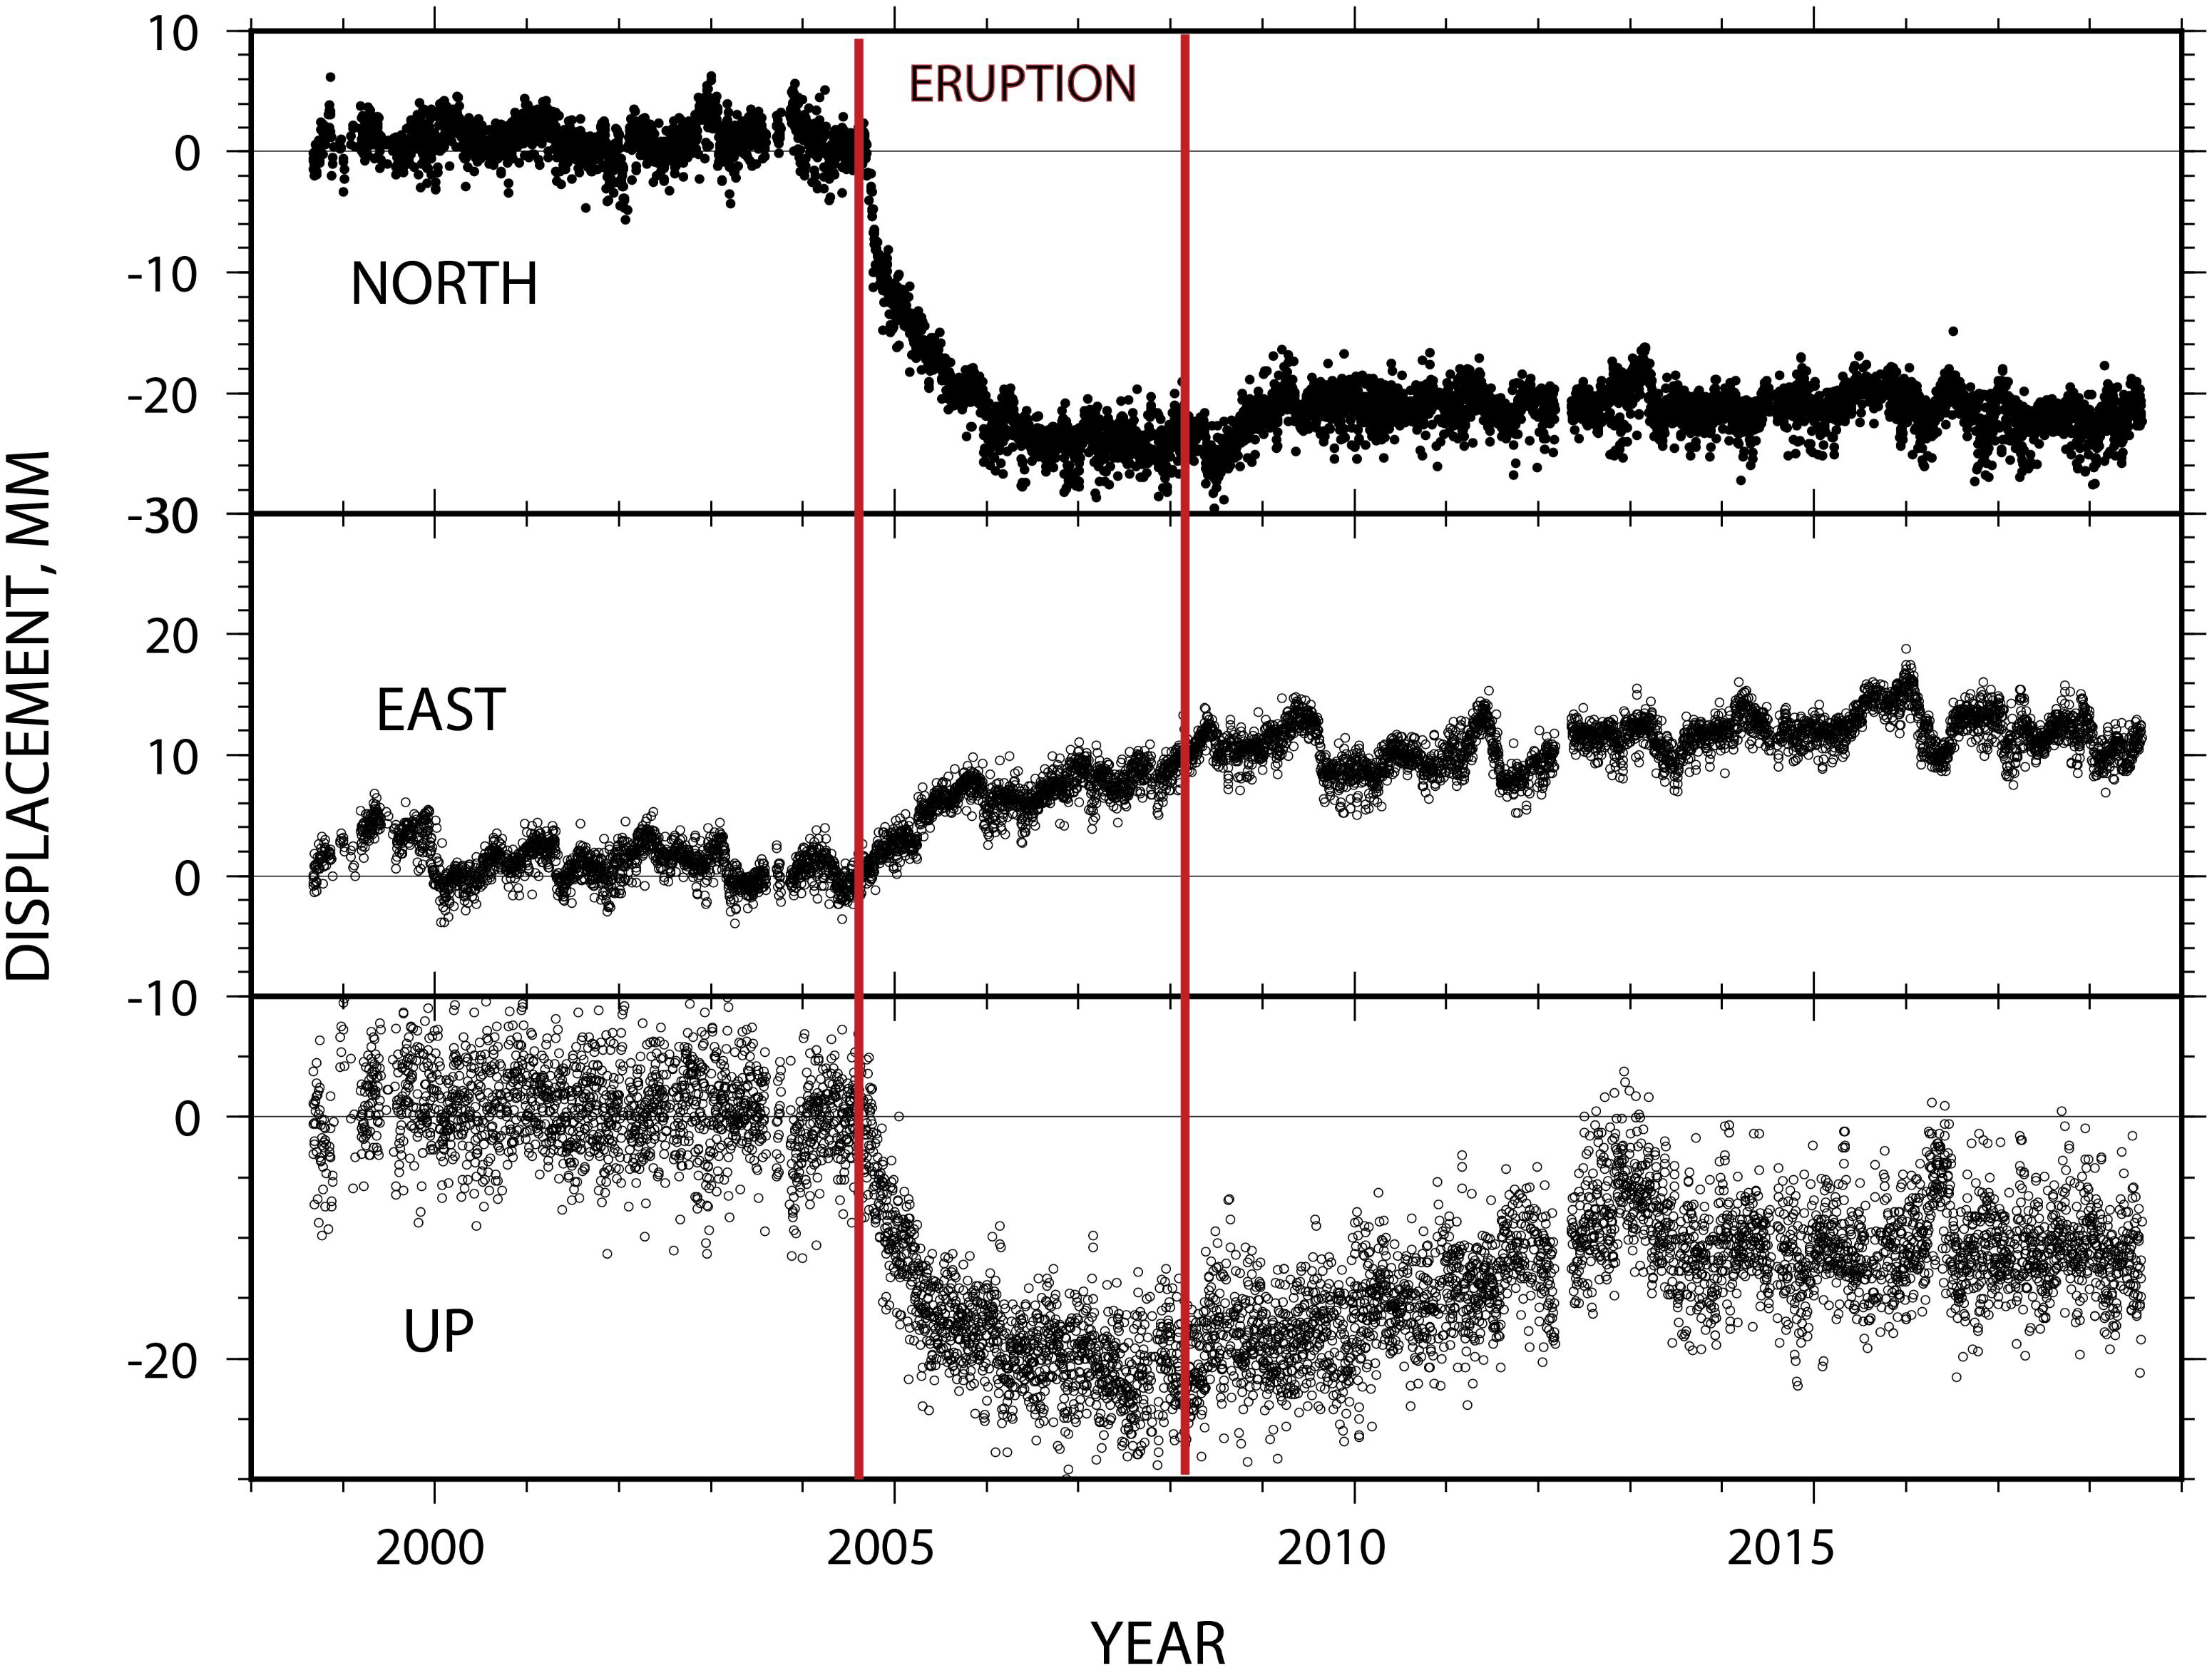
FIGURE 5. Time series plot showing North, East, and Up displacements at CGPS station JRO1, 1998–July 2018. Background deformation rates of 5.78 mm/yr North, 3.42 mm/yr East, and –0.5 mm/yr Up have been removed, along with seasonal effects. Slow-slip events along the Cascadia subduction zone affect mostly the East component, where they appear as a variable-amplitude signal with a period of ∼14 months.
The earthquake rate stabilized briefly but then increased over several days starting on September 26, while low-frequency (LF) and hybrid events began to accompany VT events (Moran et al., 2008a). Fresh crevasses in glacier ice on the south crater floor were recognized in hindsight in photographs taken during an observation flight on September 26. A photograph taken a day earlier by a hiker on the south crater rim showed no obvious disturbance in the same area, indicating that intense surface deformation began simultaneously with the uptick in seismicity on September 25–26. That inference is consistent with the large offset of DOM1 measured between January 2004 and September 28, 2004, although the timing of that motion is unknown. During the next several days, a surface welt indicative of a shallow intrusion grew in the deforming area at rates as high as 8.9 m3/s. By October 10 it was more than 100 m high, and the following day the first of several lava spines emerged. Extrusion continued uninterrupted until January 2008, forming a composite dacite dome and severely disrupting Crater Glacier (Dzurisin et al., 2008; Vallance et al., 2008; Dzurisin et al., 2015).
The appearance of fresh cracks in glacier ice 2–3 days after the onset of a shallow earthquake swarm on September 23, 2004, and subsequent growth of a welt on the south crater floor are reminiscent of the scenario that unfolded in 1980. In the earlier instance, surface faulting and growth of a bulge on the volcano’s north flank began 7 days after the onset of intense seismicity that might have signaled the start of magma’s ascent into the edifice. In both cases, magma reached the surface without producing notable seismicity deeper than 2–3 km below the surface, and without producing a commensurate amount of far-field surface deformation—even though the 1980 eruption tapped a magma reservoir at least 7–8 km deep and the same reservoir was the pressure source responsible for surface deformation during the 2004–2008 eruption (Lisowski et al., 2008). Note that the pressure source deduced by modeling deformation data need not be the same as the magma storage zone that fed the 2004–2008 eruption. On the contrary, phenocryst assemblages in Mount St. Helens dacite erupted in 1980 and 2004 imply different equilibrium source depths of 8.6 ± 1 km and ∼5 km below the surface, respectively (Rutherford, 1993; Pallister et al., 2008; Rutherford and Devine, 2008). The apparent discrepancy is explained if the shallower source tapped during the 2004–2008 eruption was in pressure communication (presumably contiguous) with the deeper source tapped in May 1980 (Figure 4). A likely scenario is that both eruptions were fed by magma from the upper part of a reservoir that had experienced a complicated crystallization history, i.e., the 2004–2008 magma was “left over” from the 1980–1986 eruption. Thornber et al. (2008, p. 727) wrote:
The diverse range in composition of amphibole in all samples of 2004–2006 dacite, and the complex zonation observed in many phenocrysts, suggests a well-mixed source magma with components that are subjected to repeated heating and (or) pressurization within this pressure-temperature window [∼900°C to ∼800°C between 100 MPa and ∼350–400 MPa or ∼4-km and 13.5–15-km depth]. Amphibole textural and compositional diversity suggest dynamic conditions in the upper-reservoir zone, which has been tapped steadily during ∼2 years of continuous and monotonous eruption. This well-mixed crystal mush is likely to have been subjected to repeated injection of hotter magma into cooler crystal-laden magma while simultaneously assimilating earlier generations of dacitic roof material and surrounding gabbroic rock.
The implications of these and other observations for several unanswered questions at Mount St. Helens are discussed below.
Discussion
Nearly four decades of study at Mount St. Helens has greatly increased understanding of the volcano’s eruptive history, magma plumbing system, and associated hazards (e.g., Sherrod et al., 2008 and references therein). However, progress has been accompanied by the realization that firm answers to several fundamental questions remain out of reach. Arguably, there are plausible answers to all of the questions posed above. The challenge is to move beyond plausibility arguments to a self-consistent explanation of what happened at Mount St. Helens since 1980, with an eye toward what the future might hold and how better to capture essential monitoring data in the future. The following sections address several unresolved issues, discuss one or more plausible explanations in each case, and suggest what might be done to move forward.
In Search of Answers: Mount St. Helens 1980–Present
Was the 1980 Eruption Triggered by an Injection of Magma Into an Upper Crustal Reservoir and, if so, When?
This question cannot be addressed with available seismic or geodetic observations, which did not reveal any unusual activity until the onset of shallow-seated unrest in March 1980. If one were to assume that a single short-period seismometer 3.5 km from the summit (SHW, Figure 1) would have detected seismicity produced by an injection of magma into the 7+ km-deep reservoir that fed the 1980 eruption, then the injection must have occurred prior to 1972. Likewise, if measurements of a single EDM line in 1972 and April 1980 (Lipman et al., 1981) (SCB–EDM, Figure 1) would have detected deformation caused by such an injection, then it must have occurred before 1972. Neither constraint is helpful, because the underlying assumptions are not likely to be valid. Neither a single short-period seismometer nor measurements of a single EDM line spanning 8 years is likely to have detected an injection of magma at depths ≥ 7 km, especially if the volume was small or the process was gradual. Whether a modern seismic or geodetic network would have detected such an event remains an open question (see section “Lessons From Other Volcanoes”). The seismic and geodetic monitoring networks were much better prior to the 2004–2008 eruption (Figures 1, 2), but again no activity deeper than ∼7 km that could be attributed to magma injection into the reservoir was detected. Possible explanations include: (1) there was none, (2) it had occurred prior to 1980, or (3) it was muted by the presence of mush zones in the magma column and by viscoelastic accommodation of strain in host rock.
Pallister et al. (1992) reviewed activity at Mount St. Helens during the past 500 years, including the Kalama (C.E. 1479–1720), Goat Rocks (C.E. 1800–1857), and 1980–1986 eruptive periods. The Kalama period began with two large-volume, highly explosive eruptions of dacite pumice, the first in C.E. 1479 (Wn tephra), the second in C.E. 1482 (We tephra). Activity during the ensuing ∼240 years included explosive eruption of dacitic and andesitic tephras and pyroclastic flows, relatively low explosivity eruption of andesite lava flows, and extrusion of a large dacitic summit dome. Erupted products gradually became more mafic: explosive dacitic eruptions were followed by weaker andesitic tephra eruptions and extrusion of andesitic lava flows. The compositional trend reversed near the end of the eruptive period with extrusion of the large dacitic summit dome (Mullineaux, 1996; Clynne et al., 2005). The Goats Rocks period began with a highly explosive, moderate-volume dacitic eruption in C.E. 1800 (T tephra), soon followed by extrusion of the andesitic Floating Island lava flow. Several small explosive eruptions were reported during C.E. 1831–1857, the largest in C.E. 1842. At about the same time, the dacitic Goat Rocks lava dome was extruded incrementally on the volcano’s north flank (Mullineaux, 1996; Clynne et al., 2005).
Pallister et al. (1992) assessed geochemical evidence for an influx of new magma to the crust during each of the eruptive periods mentioned above. They reported several indicators of magma mixing during Kalama time, including banded pumice and scoria clasts with compositions ranging from basalt to dacite (Pallister et al., 1992, p. 133–138). They concluded that the Kalama products were produced by mixing of arc dacite with REE-enriched basalt, i.e., by injection of basalt into a preexisting upper crustal reservoir of dacite. Pallister et al. (1992, p. 138–139) also reported that compositional variations during Goat Rocks time and 1980–1986 were smaller than during Kalama time, and evidence of mixing prior to or during those eruptive periods is equivocal or lacking. They concluded (p. 139): “…products of the Goat Rocks and current [i.e., 1980–1986] periods represent two diminishing oscillations following the major perturbation of the magmatic system brought about by influx of basaltic magma during the Castle Creek [2.55–1.895 ka] and Kalama periods.” A small additional influx of magma prior to Goat Rocks time or 1980–1986 cannot be ruled out, but Pallister et al. (1992) assessed that the geochemical data are consistent with fluid withdrawal from a zoned reservoir that might not have been replenished since Kalama time.
If the most recent injection of magma into Mount St. Helens’ upper crustal reservoir occurred more than 500 years ago, the absence of longer-term or deeper-seated precursors to the 1980 activity is understandable. Given available information, it seems plausible and perhaps even likely that the 1980 eruption resulted from crystallization and “second boiling” of magma that had resided in the reservoir for centuries to millennia. Second boiling is the process in which volatiles are increasingly concentrated in the residual melt as a magma body crystallizes; eventually they become saturated in the residual melt and are exsolved, raising the magma pressure to the point of eruption. Theoretical studies have shown second boiling to be a viable eruption trigger for magmas ranging in composition from basalt to rhyolite (e.g., Blake, 1984; Tait et al., 1989; Woods and Cardoso, 1997). Tait et al. (1989) showed that the time required is on the order of a few years for mafic melts and a few centuries for silicic melts. Accordingly, for the intermediate-composition reservoir at Mount St. Helens, the 123-year eruptive hiatus from 1857 to 1980 would be sufficient for second boiling to be a plausible eruption trigger. That possibility is reinforced by the reservoir’s large volume relative to the volume erupted on May 18, 1980 (0.22 km3 DRE, Nathenson, 2017). Barker and Malone (1991) estimated the reservoir volume to be 5–7 km3 based on stress-field modeling of post-1980 eruption earthquakes. Mastin et al. (2008, p. 480) came to a similar conclusion (“…the magma reservoir at Mount St. Helens is several to perhaps a few tens of cubic kilometers in size…”) based on modeling of geodetic and dome-growth measurements for the first ∼1.5 years of the 2004–2008 eruption. An unknown and possibly large proportion of the reservoir probably consists of low-melt-fraction crystal mush (Bachmann and Huber, 2016; Cashman et al., 2017) that is not eruptible. On the other hand, 0.78–2.3 km3 DRE of dacite magma erupted during the largest Holocene eruption at Mount St. Helens, the 3.4 ka Yn eruption (Nathenson, 2017), so a reasonable lower bound on the melt volume is ∼2 km3.
In the second-boiling scenario, high explosivity of the May 18, 1980, eruption derives from two factors. First, sometime prior to March 1980 a highly explosive and relatively buoyant body of magma rose from the gas-rich top of the primary reservoir, where volatiles had been accumulating since at least Goat Rocks time. Final ascent of the magma from 2–3 km depth starting in mid-March 1980 resulted in formation of the cryptodome, which was transected by the north-flank avalanche with explosive consequences. A second factor that contributed to high explosivity is that gravitational unloading of the magmatic system by the avalanche allowed a still gas-rich portion of the reservoir at least 7–8 km deep to be tapped directly, as suggested by a change in eruptive style and vigor around 1215 local time on May 18, nearly 4 h after the eruption began (Carey et al., 1990).
Second boiling of already-resident magma might explain the lack of longer-term precursors to the 1980 eruption, given that reservoir pressurization would have been gradual and might have spanned centuries, but what explains the lack of deeper-seated precursors?
How Did Magma Rise From a 7+ Km-Deep Reservoir Into the Edifice Without Producing Seismicity Deeper Than 2.5 Km or Measureable Deformation Beyond the Volcano’s North Flank?
Aseismic or near aseismic ascent of magma from great depth has been documented at several arc volcanoes, including Soputan, Indonesia (Kushendratno et al., 2012); Pinatubo, Republic of the Philippines; Volcán de Colima, Mexico (White and McCausland, 2018); and also at Hekla, Iceland (Einarsson, 2018). So it is plausible that Mount St. Helens’ 1980 eruption was triggered by magma injection to its upper crustal reservoir in the absence of detectable deep seismicity. However, as noted above, there is no geochemical evidence of magma mixing in the 1980 products to indicate such an occurrence.
Another plausible answer to the question posed above follows directly from the discussion in the preceding section. If no new magma was added to the upper crustal reservoir between Kalama time and 1980, and the 1980 eruption resulted from second boiling of long-resident magma, then the buildup to 1980 would have been gradual and any precursors spread across decades to centuries. Pressurization of the reservoir would have progressed at the rate magma crystallized and volatiles exsolved, a slow process in a large reservoir at 7+ km depth. Any resultant surface deformation would have accumulated at the same pace and likely would not have been detectable in the years or decades prior to 1980. Likewise, any seismic indications of second boiling might have been subtle and likely would have escaped detection by the minimal seismic network operating at the time.
The appearance of the north flank bulge on March 27 without attendant seismicity deeper than 3 km or surface deformation beyond the bulge itself seems more problematic. Hoblitt and Harmon (1993) studied dacite clasts incorporated in the May 18, 1980, blast deposit that are inferred to be fragments of the north-flank cryptodome (Hoblitt et al., 1981; Moore and Sisson, 1981). Based on the clasts’ chemical composition and mineralogy, Hoblitt and Harmon (1993) concluded (p. 428): “The magma that produced the cryptodome dacite is apparently derived directly from the source magma chamber rather than from magma remaining in the conduit from the preceding eruptive episode (the Goat Rocks episode).” We might reasonably expect that the rise of 0.11 km3 (Moore and Sisson, 1981) of dacite magma from the top of the reservoir at ∼7 km depth to within several hundred meters of the surface to form the cryptodome would have produced measureable seismicity over that depth range and surface deformation at distances commensurate with those source depths. The fact that neither was observed suggests the rise of cryptodome magma was accommodated by viscoelastic deformation of conduit fill and host rock. Presumably, that process occurred relatively slowly over some considerable time period prior to March 1980. From 2–3 km depth to the surface, the conduit fill and host rock were brittle enough to fracture at the strain rate imposed by the more rapidly intruding magma, accounting for the observed shallow seismicity. The fact no deformation was observed after the local geodetic network was established in April 1980 suggests the upper conduit was already decoupled from the edifice by that time, presumably as a result of the reaming process that began on March 20 with the first magnitude 4 earthquake and finished by March 27 when the north flank bulge was recognized and the first phreatic eruption occurred.
Did Additional Magma Accumulate in the Crust Between the End of the 1980–1986 Dome-Forming Eruption and the Start of the 2004–2008 Eruption? If So, When?
As described above, there is circumstantial evidence from both seismicity and surface deformation for repressurization of the upper crustal storage reservoir prior to the 2004–2008 eruption. A small amount of areal dilatation occurred between trilateration surveys in 1982 and 1991, and there were sporadic earthquake swarms at depths ranging from 2–8 km during 1987–1998. Both occurrences are indicative of magma system pressurization but neither is compelling evidence of magma influx; volatile exsolution during crystallization might account for both. Curiously, no additional deformation was detected during 1991–2003, and there was significantly less seismicity below 2 km depth during 1999–August 2004 (Figure 3).
Pallister et al. (2008) analyzed samples of 2004–2008 dome rocks and concluded (p. 648): “A relatively low pressure of last phenocryst growth suggests that the magma was derived from near the apex of the Mount St. Helens magma reservoir at a depth of about 5 km. Viewed in the context of seismic, deformation, and gas-emission data, the petrologic and geochemical data can be explained by ascent of a geochemically distinct batch of magma into the apex of the reservoir during the period 1987–1997, followed by upward movement of magma into a new conduit beginning in late September 2004.” They acknowledged evidence permissive of reservoir replenishment during the eruption, but preferred the following scenario (p. 683): “Since 1980, the magma reservoir has seen minimal replenishment, such that convection has produced a batch of well-mixed, crystal-rich magma with 65 percent SiO2 near the reservoir roof. A slow increase in pressure was brought about beginning in late 1987 by convection-driven exsolution of a water-rich volatile phase (which outpaced volatile losses through roof rocks). Magmatic pressure finally exceeded lithostatic load in late September 2004, and the eruption ensued.” In this scenario: (1) the small amount of surface dilatation measured between 1982 and 1991 probably started sometime after dome-building ended in late 1986 and reflected exsolution-driven pressurization of the reservoir (second boiling), (2) second boiling was responsible for the series of small ash-producing explosions and explosion-like seismic events that occurred during August 1989–October 1991 (Mastin, 1994), and (3) progressive sealing and pressurization of the conduit induced sporadic swarm seismicity at 0–7 km depth BSL during 1987–98 (Figure 3).
What Is the Significance of a Relative Lull in Seismicity and Surface Deformation for Several Years Prior to the 2004–2008 Eruption Onset?
Lack of measurable deformation starting in 1991 and the relative lull in seismicity after 1998 suggest the system reached a metastable condition in which the rate of pressurization was low enough to be accommodated mostly by aseismic, viscoelastic deformation. Such a condition might arise if a pressure connection existed between the reservoir and that segment of the conduit between the top of the reservoir and the brittle carapace at 2–3 km depth. It seems reasonable that such a connection might have persisted during the 18-year hiatus between the end of the 1980–1986 eruption and start of the 2004–2008 eruption. In that situation, the slow increase in conduit pressure might progressively inhibit exsolution of water from reservoir magma, slowing the rate of pressurization to the extent that the system remained metastable for several years while the pressure in the upper part of the conduit slowly approached and eventually exceeded lithostatic load. The paucity of earthquake activity below 2 km depth is understandable if the conduit and its host rock were hot enough to accommodate strain by viscoelastic relaxation rather than brittle failure.
How Did Magma Reach the Surface in 2004 Without Producing Seismicity Deeper Than 2 Km or Measurable Deformation More Than a Few Hundred Meters From the Vent?
According to the scenario above, intense seismicity between 2 km depth and the surface, soon followed by appearance of a welt on the crater floor, marked magma’s sudden breaching of the brittle carapace. Brittle-failure earthquakes did not occur along the conduit below the level of the carapace because at those depths the conduit and wall rocks were hot enough, and the strain rate imposed by slow ascent of gas-poor magma was low enough, that strain was accommodated by viscoelastic deformation. The same conditions explain the lack of surface deformation beyond a few hundred meters from the vent. The implication is that the conduit and its host rock between the surface and ∼2 km depth became cold and brittle from 1986 to 2004, while below that depth it remained hot enough for viscoelastic deformation to occur at low strain rates. Mount St. Helens receives average annual rainfall of 3.56 m and hosts numerous thermal springs (Tilling et al., 1990; Bergfeld et al., 2017). Perhaps the abundance of meteoric water and the fractured nature of the uppermost 2 km of the conduit facilitated water circulation and convective heat extraction, allowing a cold, brittle plug to form during the 18-year hiatus between eruptions. Hundreds of small explosive events during August 1989–October 1991 and sporadic earthquake swarms during 1987–1998 might have been a consequence of second boiling in the magma reservoir plus cooling of the upper part of the conduit (see section “Did Additional Magma Accumulate in the Crust Between the End of the 1980–1986 Dome-Forming Eruption and the Start of the 2004–2008 Eruption? If So, When?”).
Has the Magma Storage System Been Replenished Since the 2004–2008 Eruption Ended, and Is It Now Primed for the Next Eruption?
Four lines of observational evidence bear on this question: seismicity, deformation, residual gravity, and hydrothermal-system chemistry. Seismicity of the type attributed by Moran (1994) to re-pressurization after the 1980–1986 eruption began soon after the 2004–2008 eruption ended and was continuing when this was written in July 2018 (Moran and Lisowski, 2014) (Figure 3). Individual swarms below 2 km depth have been less intense than during 1989–1991 and 1998, for example, but seismicity has occurred over a similar depth range. The concentration of earthquakes near 2 km depth that was attributed to formation of a conduit plug in the late 1980s has yet to develop (Figure 3, 0 km BSL). If the conduit cooled at about the same rate after 2008 as it did after 1986, we can infer that the rate of re-pressurization has been less since 2008, i.e., although enough time has elapsed since 2008 for a plug to form, magmatic pressure is not yet great enough to begin fracturing it. Lava extruded during 2004–2008 was considerably more crystal-rich and gas-poor than 1980–1986 dome lava (Pallister et al., 2008). For that reason, we might expect less gas to be exsolved from magma remaining in the conduit after the more recent eruption, consistent with a lower rate of re-pressurization and the paucity of seismicity near 2 km depth relative to pre-2004. Alternatively, Pallister et al. (2008) inferred that conduit magma had solidified to a depth of 1–2 km below the vent as a consequence of decompression crystallization during the 2004–2008 eruption. They proposed the resulting plug was relatively porous along a marginal gouge zone, allowing escape of exsolved gasses (see also Gaunt et al., 2014). In either scenario, pressurization of the conduit occurred at lower rate after the 2004–2008 eruption than during 1986–2004, consistent with continued weak seismicity at 0–2 km depth.
A second line of evidence for magma-system re-pressurization since 2008 is a reversal in trend at several CGPS stations on or near the volcano that started while the 2004–2008 eruption was waning or soon after it ended. JRO1, for example, moved south (toward the volcano) and down during the eruption, but north and up during 2008–2012 (Figure 5). Since then, any motion has been below the detection threshold of ∼1 mm/yr. Dzurisin et al. (2015) attributed the reversal to partial re-pressurization of the magma system, but Segall (2016) showed that such a reversal could result from relaxation of a viscoelastic aureole surrounding the magma reservoir. The current situation is reminiscent of the small amount of areal dilatation that occurred between 1982 and 1991, followed by no additional deformation during 1991–2003 and then by the 2004–2008 eruption.
Repeated measurements of residual gravity at Mount St. Helens show progressive increases in subsurface mass during 2010–2016 which, combined with seismic and deformation observations described above, suggest replenishment of the upper crustal magma system (Battaglia et al., 2018). However, models of the gravity and deformation data are non-unique and no single source of mass increase explains all of the observed gravity increase. Battaglia et al. (2018) showed: (1) addition of ∼50 × 106 m3 of magma to the 5–6 km-deep magma reservoir that fed the 2004–2008 eruption can explain ∼20% of the gravity increase; (2) addition of ∼30 × 106 m3 of magma to the upper ∼2 km of the conduit can explain ∼60% of the increase, but the corresponding amount of surface deformation (assuming incompressible magma and elastic response of host rock) would be too great to have gone undetected; and (3) accumulation of groundwater in a shallow aquifer can explain ∼20–60% of the increase.
Chemical and isotopic analyses of water and gas collected at Mount St. Helens during 2002–2016 likewise provide suggestive, but not compelling, evidence for replenishment of the upper crustal magma system since 2008. Bergfeld et al. (2017) reported an increase in δ13C values of dissolved carbon in hot springs during 2006–2009 and a similar shift in δ13C-CO2 in bubble gas emissions, which they attributed to CO2 from an undegassed body of magma distinct from the 2004–2008 magma. They noted that the increases in δ13 were accompanied by rising trends in 3He/4He ratios in fumarole gases, another indicator of fresh magmatic input. Also, air-corrected helium isotope values (RC/RA) were distinctly higher after 2011 than during 1986–2002, which Bergfeld et al. (2017, p. 109) interpreted as “…additional evidence for some involvement of new magma as early as 2006, and possibly earlier, given the unknown time needed for CO2 and He to traverse the system and arrive at the springs.” What remains unclear is the depth of the fresh magma, i.e., whether below or within the upper crustal reservoir. As is the case for deformation signals, geochemical indicators of fresh magma input are likely to be affected by the presence and maturity of mush zones in the magma column (Parmigiani et al., 2017), making the recognition of an injection event more difficult.
In summary, seismicity provides the clearest evidence for repressurization of the upper crustal reservoir since the end of the 2004–2008 eruption. A small amount of surface inflation is consistent with that idea, but it could also be caused by relaxation of a viscoelastic aureole around the reservoir. Increases in residual gravity can be explained partly by addition of magma to the reservoir or conduit (replenishment), but also could be explained by groundwater accumulation. Finally, there is evidence from thermal springs for degassing of fresh magma since the 2004–2008 eruption, but it is not clear whether the source is the upper crustal reservoir or somewhere deeper in the system.
Why Has It Been Difficult to Detect Changes in Crustal Magma Storage at Mount St. Helens, Even Since It Has Become One of the Most Intensively Studied Volcanoes on Earth?
The preceding discussion suggests that several factors contribute to the difficulty in detecting changes in crustal magma storage at Mount St. Helens. First, the volcano’s upper crustal reservoir is ≥7 km deep, several to 10 s of km3 in volume (melt plus mush), and long-lived (>104 yr). Second, there is no compelling evidence that magma has been added to the upper part of the reservoir (≤7 km depth) in the past 500 years. All of Mount St. Helens’ eruptions during historical time (1800–1857, 1980–86, 2004–2008) can be understood as outcomes of an injection and mixing event prior to or during Kalama time (C.E. 1479–1720) (Pallister et al., 1992, 2008). That being the case, the likelihood of detecting seismic or deformation precursors sourced in the reservoir prior to 1980 is greatly reduced – especially with sparse monitoring networks at the time. The reservoir might have pressurized gradually as a result of second boiling, but the process would have spanned centuries and any surface deformation would have been muted by the reservoir’s depth, and perhaps also by compressibility of reservoir magma and viscoelastic accommodation by the reservoir’s host rock. Portions of the reservoir are likely rich in volatiles exsolved during formation of crystal mush zones (Parmigiani et al., 2017), and volatile-rich portions might be highly compressible. Thermal conditioning over the reservoir’s long lifespan would have facilitated viscoelastic behavior, further mitigating any surface deformation signal. Second boiling might have produced long-period seismicity indicative of fluid movement, but of what magnitude and at what rate is unknown. Nichols et al. (2011) examined 60 deep long-period (DLP) earthquakes that occurred during 1980–2009 under six of the ten Cascade volcanoes in Washington and Oregon, including Mount St. Helens. They proposed that DLPs are produced by movement of magma and/or magmatic fluids in the mid-to-lower crust, and that they might be an early indicator of renewed eruptive activity. Unfortunately, the minimal seismic network at Mount St. Helens prior to 1980 might not have detected DLPs if they occurred, so it is unknown whether their numbers or magnitudes increased prior to the start of intense shallow seismicity on March 20, 1980. None were detected by a local network of portable seismometers operated during March 20–May 18 (Weaver et al., 1981).
Another circumstance that makes Mount St. Helens a difficult monitoring target is the behavior of the crust below 2–3 km depth in response to magmatic processes. Very few earthquakes below that depth were detected before the May 18, 1980, eruption, while the volcano’s 123-year quiescent period was drawing to a close. On the other hand, earthquakes indicative of magma withdrawal and subsequent tectonic adjustment occurred to depths of 20 km beneath the volcano in the aftermath of the eruption (Weaver et al., 1981; Barker and Malone, 1991; Moran, 1994). We can infer that the crust below 2–3 km depth deformed in non-brittle fashion under the strain rates that prevailed prior to the morning of May 18, 1980. Only during and soon after the eruption were strain rates high enough to induce appreciable brittle failure below 3 km, making early (pre-March 1980) recognition of impending unrest difficult.
Even with a much-improved seismic network in place since 1980 (Figure 2), the most seismically productive zone has been between 2–3 km depth and the surface (Figure 3). Likewise, the amount of surface deformation prior to the eruptions in 1980–1986 (minor beyond the north-flank bulge) and 2004–2008 (minor during 1982–1991, none during 1991–2003) is disproportionately small relative to the volumes of erupted material if one were to assume (1) the crust beneath the volcano behaves as a homogenous, elastic half-space, (2) reservoir magma is incompressible, and (3) the reservoir and conduit walls are rigid. None of these conditions are likely to prevail beneath real-world volcanoes.
On a positive note, Moran (1994) interpreted focal mechanisms for earthquakes at 6.5–10 km depth during 1987–1992 as evidence for repressurization of the magmatic system, a conclusion borne out by the 2004–2008 eruption. Likewise, Moran and Lisowski (2014) reported seismic and geodetic evidence for repressurization since the end of the 2004–2008 eruption. Both studies point to the likelihood that future eruptive activity will be foreseen well in advance.
At Mount St. Helens, it seems, departures from idealized behavior are large enough, at least at the strain rates imposed by activity since 1980, to have strongly influenced patterns of precursory activity. At other volcanoes, recent eruptions have produced different patterns in response to different sets of conditions. The following sections describe a few examples in varying amounts of detail to illustrate specific points that might be instructive for understanding Mount St. Helens’ past and future behavior.
Lessons From Other Volcanoes
Not all arc volcanoes are as inscrutable as Mount St. Helens vis-à-vis eruption precursors. There have been many hundreds of eruptions at dozens of volcanoes since 1980, and precursory information is being compiled in several global volcano databases [e.g., Smithsonian Institution Global Volcanism Program2, World Organization of Volcano Observatories WOVOdat3, Volcano Disaster Assistance Program (VDAP) Eruption Forecasting Information System (EFIS)]. A comprehensive examination of eruption precursors would no doubt be instructive, but is beyond the scope of this paper. Instead, the following three sections focus on volcanoes that in recent decades have telegraphed their intentions earlier or with more clarity than Mount St. Helens. In these cases, seismic or geodetic precursors differed substantially from those at Mount St. Helens prior to its 1980–1986 and 2004–2008 eruptions. The differences reflect a few of many factors that undoubtedly influence precursory behavior, a topic to be addressed in a later section.
Mount Pinatubo, Philippines, 1991 – Rapid Injection of Basalt Into a Silicic Reservoir at a Long-Dormant Volcano
The June 15, 1991 eruption of Mount Pinatubo, Philippines (VEI 6, ∼5 km3 DRE) was the world’s largest since the 1912 eruption of Novarupta, Alaska (VEI 6, 13 ± 3 km3 DRE). Novarupta was essentially unmonitored prior to the eruption owing to its remote location; as a result, little is known about precursory activity. Pinatubo had been dormant for ∼500 years prior to 1991 and it, too, was not monitored before April 1991. However, more than 30,000 people were living on its flanks when residents began feeling local earthquakes in mid-March, 1991, followed by a series of steam explosions in early April. The high and immediate hazard prompted the Philippine Institute of Volcanology and Seismology (PHIVOLCS) to establish a local observatory and begin monitoring within a few days of the first reports (Figure 6).
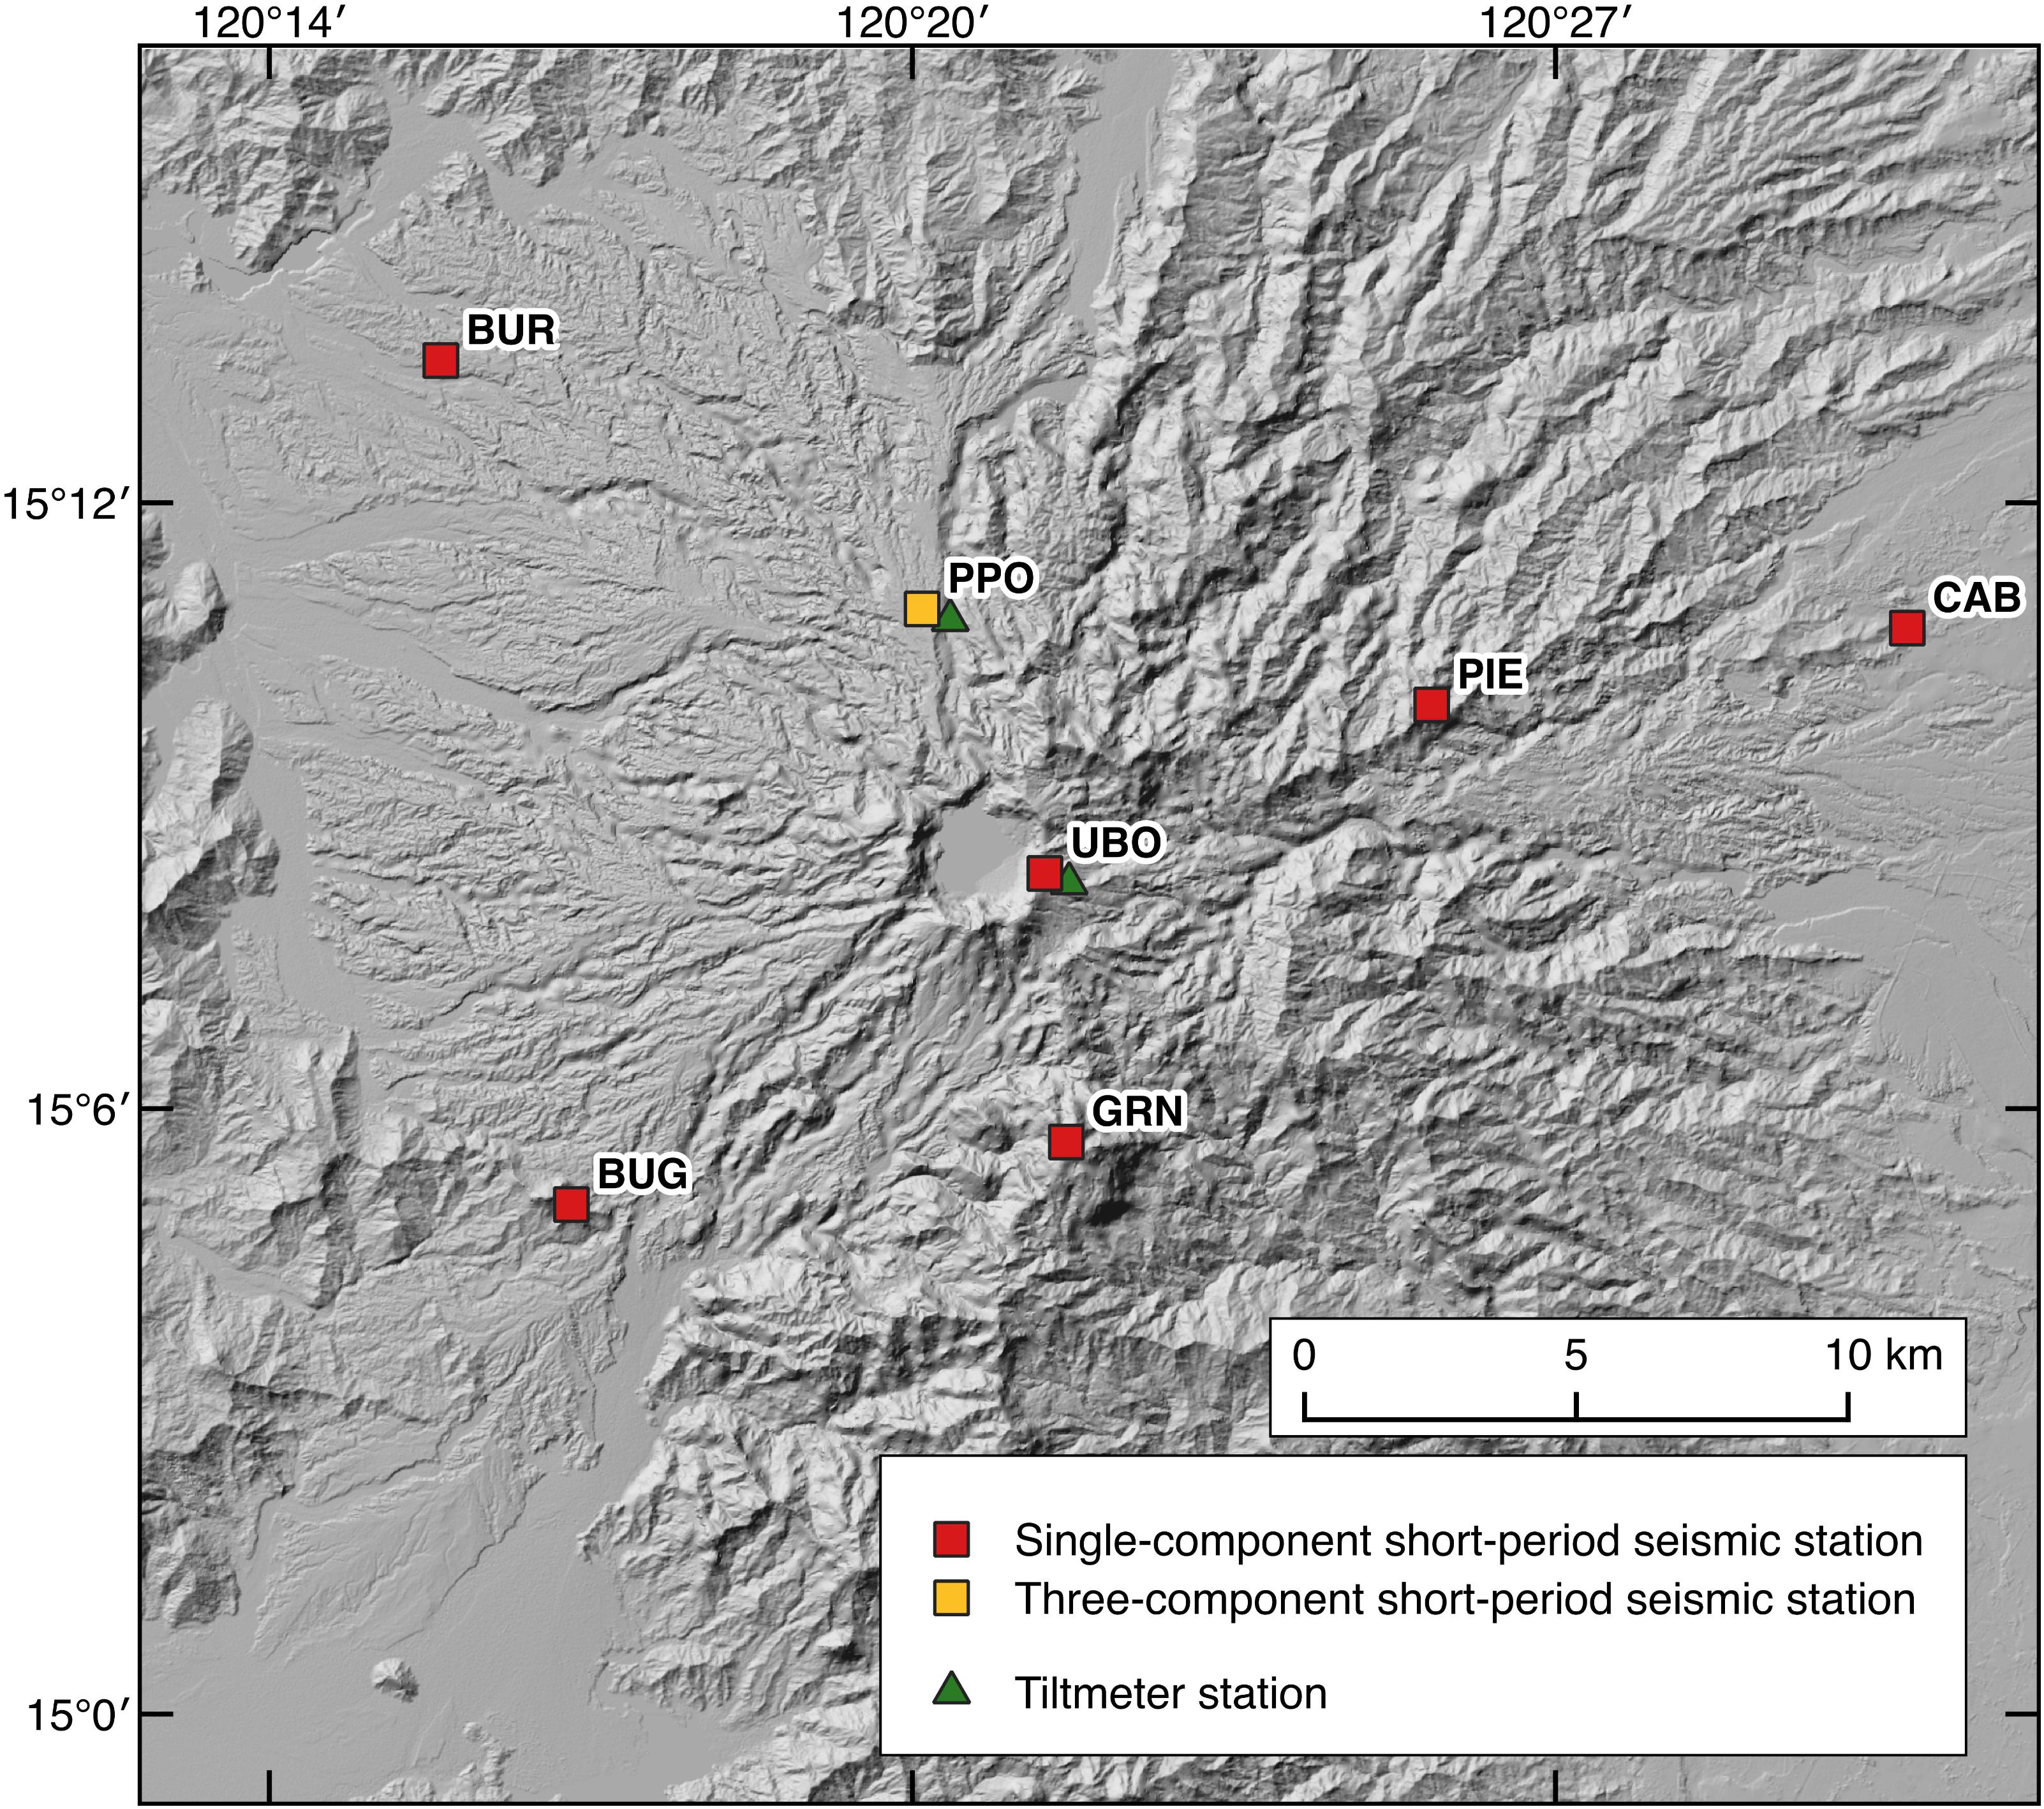
FIGURE 6. Map showing seismic and tiltmeter stations installed at Mount Pinatubo during April–early May 1991, prior to the climactic eruption on June 15, 1991. Seismic station locations are from Lockhart et al. (1996). Tiltmeter station locations are from Ewert et al. (1996). See original publications for additional details. Hillshade is an ESRI Image Service product from 2013 accessed through ArcGIS Online and depicts post-1991 topography.
As activity escalated through April and May, PHIVOLCS with assistance from the Volcano Disaster Assistance Program (VDAP) expanded the monitoring effort to include seismicity, ground deformation, and gas emission. The resulting record, together with subsequent analyses of erupted products, enables a remarkably detailed reconstruction to be made of events leading up to the climactic eruption (Newhall and Punongbayan, 1996). As summarized by Pallister et al. (2008, p. 682):
Rapid addition of new magma and fluids to a crustal reservoir can increase pressure and trigger an eruption from below. This was the case for the eruption of Pinatubo in 1991, in which new hydrous mafic magma from depth entered a crystal-rich dacite reservoir, vesiculated, mingled, and created a buoyant plume, which rose through the viscous and crystal-rich upper part of the reservoir, increased pressure in the hydrothermal system, fractured a new pathway to the surface, and triggered the eruption (Pallister et al., 1996). In the Pinatubo case, deep long-period seismicity recorded and tracked ascent of basalt from 35 or 40 km deep to the crustal reservoir at depths of less than 14 km before the eruption (White, 1996).
That scenario is strikingly different from the one that played out at Mount St. Helens in 1980. The volcanoes are similar in some respects and so, too, were their eruptions’ precursors—but with one important exception.
The crustal magma reservoirs (magma plus mush) beneath Mount Pinatubo and Mount St. Helens are both primarily dacitic. Both are large (40–90 km3 and several to 10 s of km3, respectively) (Mori et al., 1996; Mastin et al., 2008) and long-lived, with a top near 7 km and a bottom (mush zone) near twice that depth (Scandone and Malone, 1985; Pallister et al., 1992, 1996, 2008; White, 1996). Both volcanoes had been dormant for more than a century before their most recent climactic eruption. In both cases, strong precursors began 2–4 months beforehand and included intense shallow VT seismicity. Far-field deformation was not detected in either case, but that might be an artifact of inadequate monitoring. The primary difference is that the Pinatubo reservoir ingested what was probably a substantial volume of basaltic magma in a relatively short period of time. Pallister et al. (1996) suggested the process started on or before April 2, 1991, the date of the first phreatic explosions, and continued episodically until the climactic eruption on June 15, 1991. A similar scenario might have played out at Mount St. Helens during Kalama time, but not since. In terms of eruption precursors, the difference was manifest most clearly by the absence of detected seismicity deeper than 2.5 km at Mount St. Helens in 1980 and the preponderance of deep seismicity, especially long-period earthquakes, at Pinatubo in 1991. The distinction is clouded by the fact that only one short-period seismometer (SHW, 3.5 km from the summit) was operating at Mount St. Helens when intense seismicity began on March 20, 1980. However, four seismic stations were added within 28 h of the swarm onset, and by March 30 a total of 11 stations were operating within 35 km of the volcano (4 within 10 km) (Malone et al., 1981) (Figure 1). There remains a possibility that deep earthquakes occurred but went undetected at Mount St. Helens prior to its climactic eruption on May 18, 1980. If so, it seems likely they were considerably less energetic than at Pinatubo in 1991, and possibly also less than at Redoubt in 2009 and Augustine in 2006 (see below).
White (1996) began his report on precursory DLP earthquakes at Pinatubo with a remarkable statement (p. 307): “About 600 deep long-period (DLP) earthquakes occurred beneath Mount Pinatubo in late May and early June 1991. This number is higher than the combined total number of such earthquakes previously reported at all convergent-margin volcanoes worldwide.” He interpreted the DLP seismicity as “…the elastic manifestation of the injection of deep-seated basaltic fluids into the base of the magma chamber.” The contrast could not be starker: 600 DLPs in a matter of weeks at Pinatubo versus no known seismicity of any kind below 3 km depth during 2 months of precursory seismicity at Mount St. Helens. Clearly, DLPs can be an important indicator of magma injection into the crust. However, they are not a “magic bullet” for eruption forecasting, for at least three reasons: (1) some DLPs occur far from volcanic areas and might have non-magmatic source mechanisms; (2) during 1980–2009, more DLPs occurred under Mount Baker than any other volcano in Washington or Oregon, including Mount St. Helens; and (3) no DLPs in the study were associated with volcanic activity, including the 1980–1986 and 2004–2008 eruptions at Mount St. Helens (Nichols et al., 2011).
We might suspect that crustal injection events also have distinctive deformation signatures. Unfortunately, that suspicion cannot be confirmed or rejected for Mount Pinatubo, where pre-eruption monitoring was not adequate to have detected a deep-seated deformation signal. However, such signals have been recognized at arc volcanoes elsewhere. Two cases are instructive here.
Redoubt Volcano, Alaska, 2009 – Monitoring Data Track Months-Long Ascent of Magma From Deep in the Crust
Prior to its 2009 eruption, Redoubt Volcano had last erupted in 1965–1968 and 1989–1990, each time following a hiatus comparable to that at Mount St. Helens from 1986 to 2004. The 2009 activity at Redoubt included dozens of explosive events, extrusion and destruction of at least three, and possibly four lava domes, ending with extrusion of a final dome with a bulk volume of 72 × 106 m3. Total volume erupted was 80–120 × 106 m3. Geodetic, gas-emission, seismic, and petrologic evidence support a complex eruption scenario in which a deeply sourced, upward-moving, low-silica andesite encountered and mixed with high-silica andesite in the mid- to upper crust, forming a third, intermediate-silica andesite. All three magma types erupted during the 2009 activity (Bull and Buurman, 2013).
Compared to Mount St. Helens in 1980 and 2004, precursors to the 2009 Redoubt eruption were early, conspicuous, and telling. The nearest permanent CGPS station, 28 km northeast of Redoubt (AC17, installed in 2006 as part of the Plate Boundary Observatory), began recording subtle radially-outward motion in May 2008 (Grapenthin et al., 2013) (Figure 7). An H2S odor was reported by field geologists working on the edifice in July 2008, and an aircraft pilot reported a sulfur odor and increased snow melt in September 2008. Airborne gas-emission measurements detected anomalous levels of H2S, SO2, and CO2 during overflights starting in October 2008 (Werner et al., 2013). A pronounced increase in lower crustal DLP and VT earthquakes began in mid-December 2008: 30 DLP events were located at depths of 28–35 km beneath Redoubt from December 12, 2008, to December 31, 2010 (Power et al., 2013). Two months of discontinuous shallow volcanic tremor started on January 23, 2009, culminating in a phreatic explosion on March 15, 2009. Extrusion of the final dome ended by July 1, 2009 (Bull and Buurman, 2013).
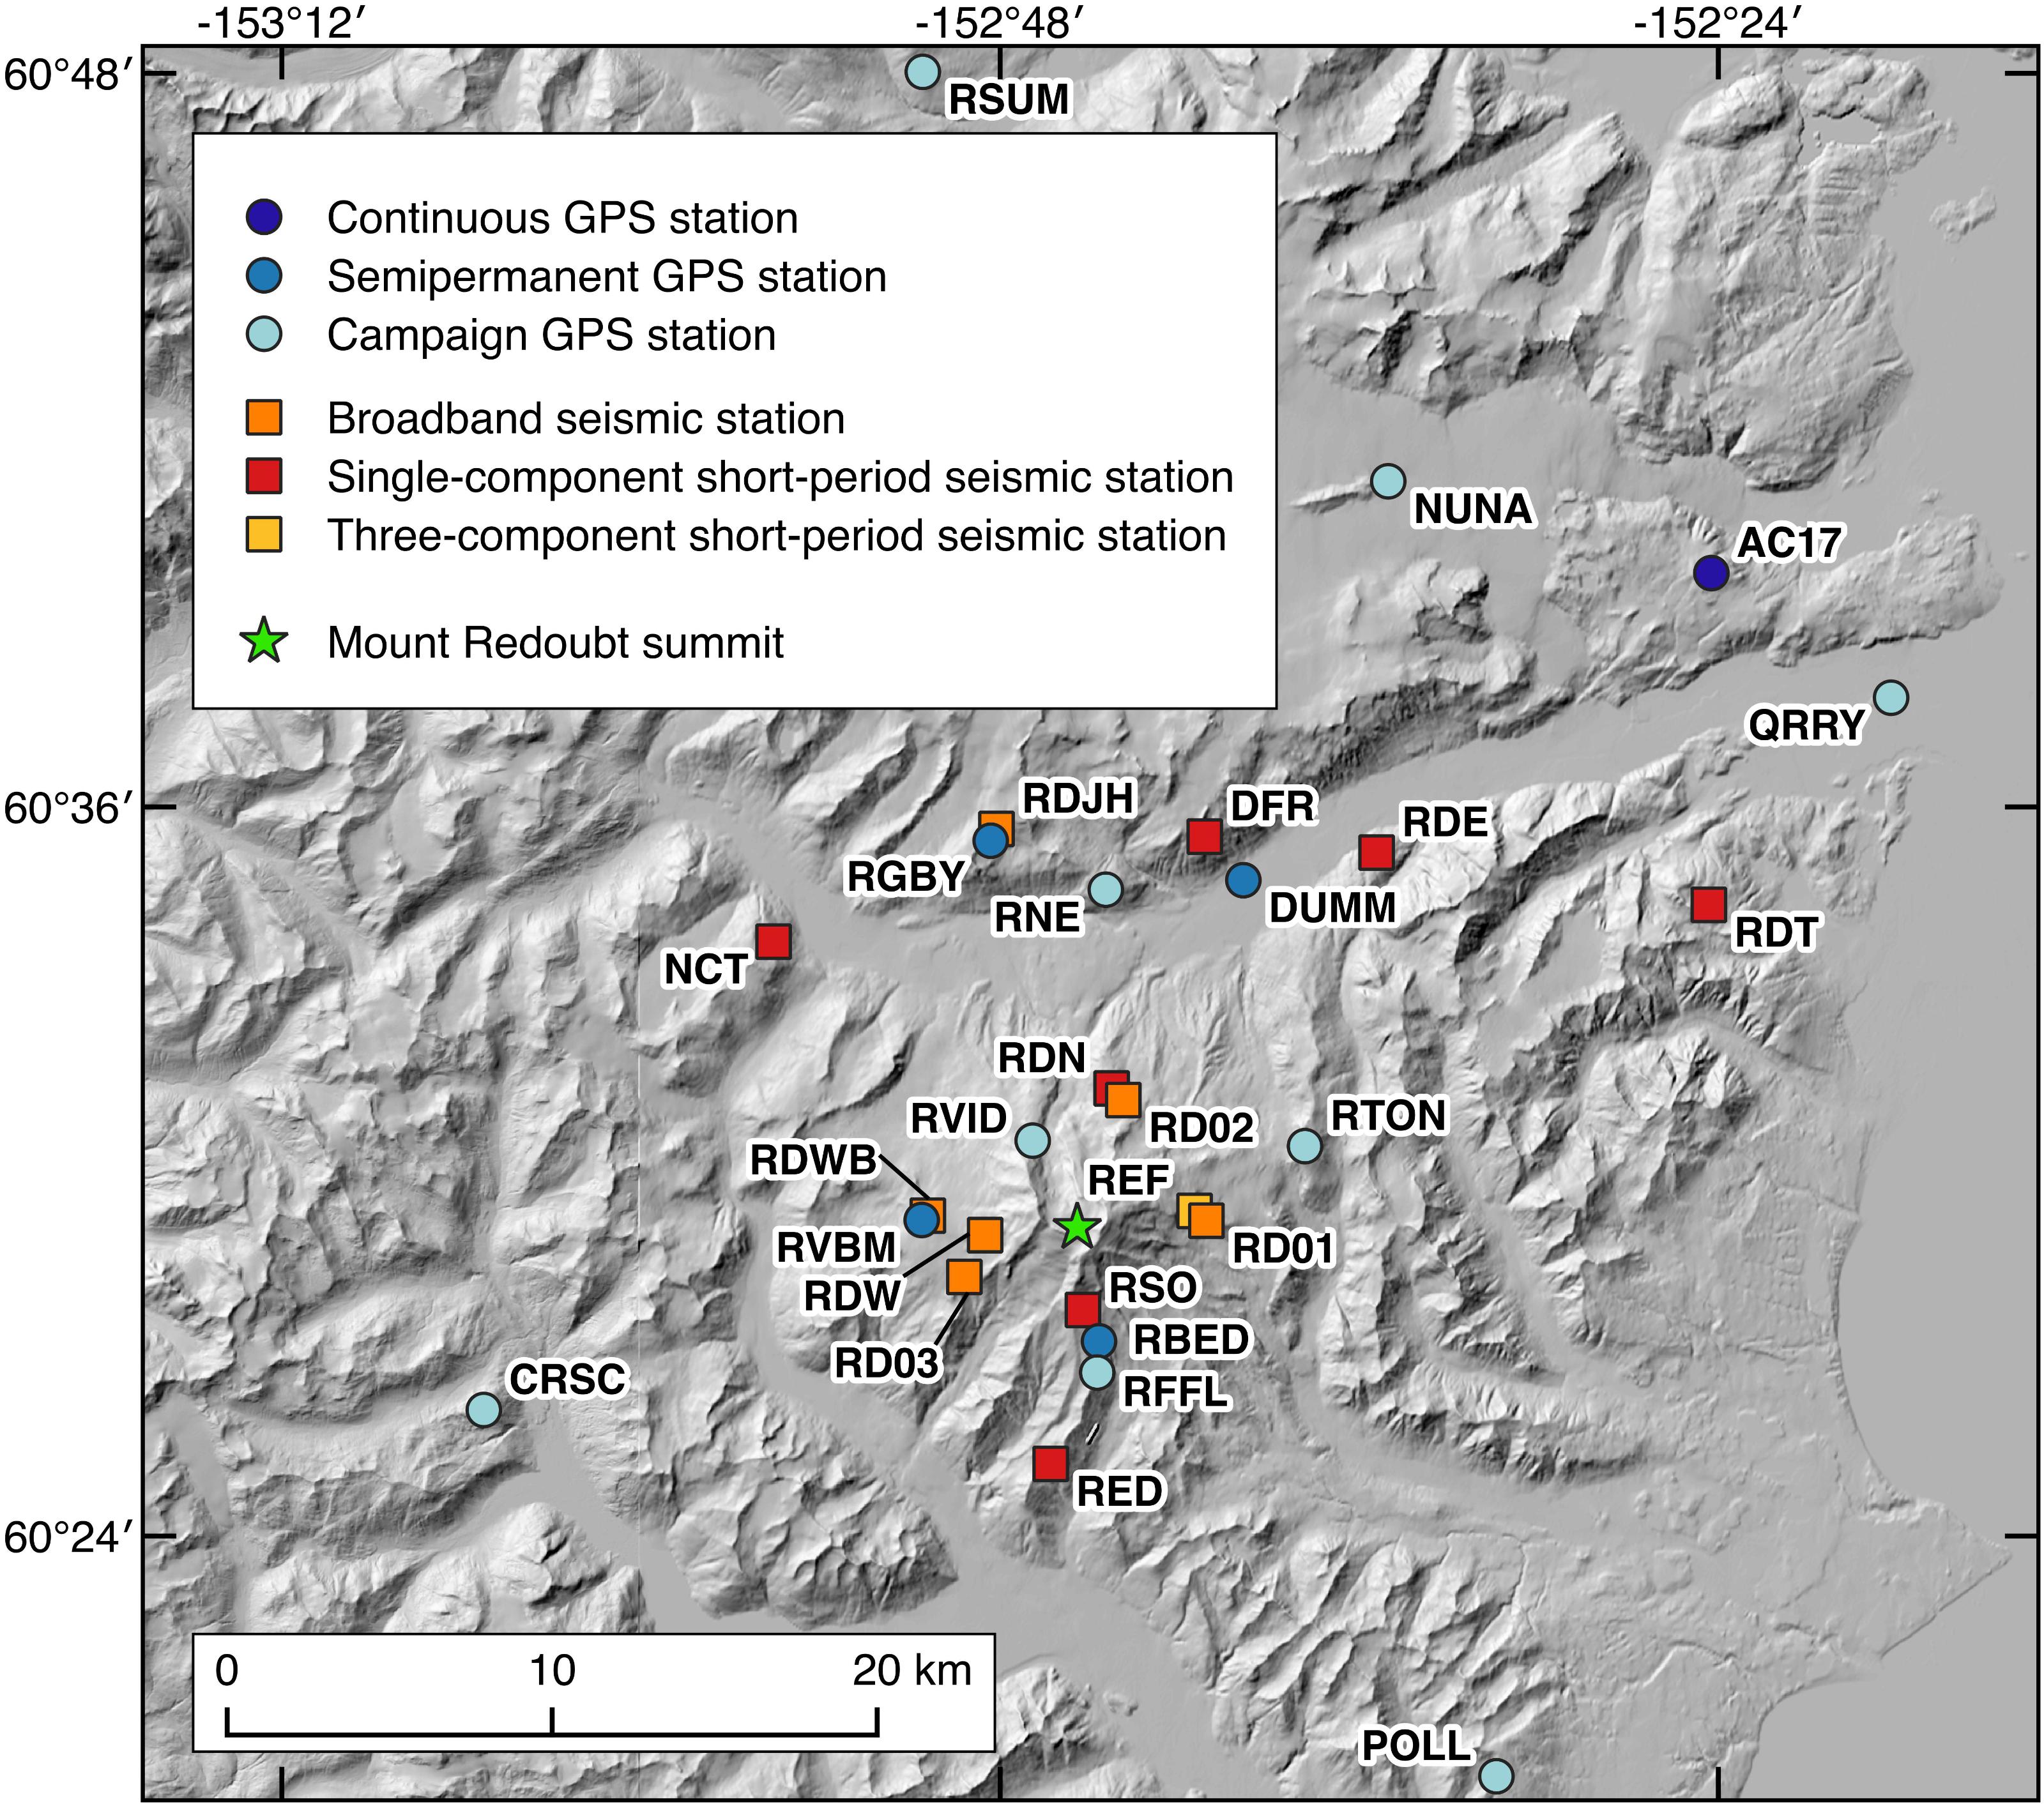
FIGURE 7. Map showing seismic and stations at Mount Redoubt prior to the 2009 eruption. Seismic station locations are from Dixon et al. (2010) and Power et al. (2013). GPS station locations are from Grapenthin et al. (2013). See original publications for additional details. Hillshade is an ESRI Image Service product from 2013 accessed through ArcGIS Online.
As was the case at Pinatubo in 1991, pre-eruption monitoring data and post-eruption petrologic analyses enable detailed inferences to be made regarding Redoubt’s magmatic system and the eruption scenario that played out in 2009. Elevated CO2 fluxes and high CO2/SO2 ratios detected in airborne samples starting 6 months prior to the eruption onset most likely resulted from degassing of magma at mid- to lower crustal depths or of magma that recently ascended from such depths (Werner et al., 2013). Grapenthin et al. (2013) modeled surface displacements at AC17 plus four temporary CGPS stations that were installed several weeks before the eruption onset at distances of 4–12 km from Redoubt. They identified two and possibly three deformation sources in the mid- to upper crust: (1) a Mogi source at 13.5 km depth, (2) a vertical prolate spheroid at 7–11 km depth, and (3) a secondary reservoir at 2–4.5 km depth that was inferred from petrologic evidence (Coombs et al., 2013) but poorly resolved by the geodetic data.
Uncertainties in the deformation models are such that sources 2 and 3 are compatible with the conceptual model proposed by Power et al. (2013, p. 42–43) based on seismic observations:
…the Redoubt magmatic system consists of a diffuse magmatic source zone at depths of 28 to 32 km depth, a mid-crustal magma storage area at depths of roughly 3 to 9 km and a conduit and system of interconnected cracks that extends from the mid-crustal storage zone to the Redoubt Crater floor. The deeper diffuse magmatic source area is defined by the hypocenters of DLP events and VT earthquakes that are observed at these depths before and after the 2009 eruption. The mid-crustal storage area is defined by hypocenters of VT earthquakes that increased in rate following the initiation of eruptive activity in December 1989 and April 2009 and are a persistent feature of the seismic record between 1989 and 2010. The shallow system of cracks is defined seismically by repetitive swarms of LP events, small VT earthquakes, and hybrid events that occur most prevalently during the eruptions in 1989–1990 and 2009.
The description by Power et al. (2013), in turn, is congruent with the 2009 eruption scenario that Coombs et al. (2013) inferred from geochemical and petrologic observations: (1) low-silica andesite (LSA) ascended from the lower crust, i.e., from the DLP and VT seismic source at 28–35 km depth, during or before precursory activity starting in May 2008; (2) ascending LSA encountered differentiated, high-silica andesite (HSA) remnant from pre-2009 intrusions at about 13 km depth (deformation source 1); (3) mixing of LSA and HSA produced intermediate-silica andesite (ISA) at depths of 7–11 km (deformation source 2); (4) ascent stalled temporarily at depths of 2–4.5 km (deformation source 3), where 2009 magmas staged for several months before eruption.
Redoubt Volcano shares several characteristics with Mount St. Helens. Both volcanoes have erupted a range of compositions from basalt to dacite during their histories (Mullineaux and Crandell, 1981; Till et al., 1994). Recent eruptive products are only slightly more mafic at Redoubt (∼58–63 wt.% SiO2 in 1989–1990 and 2009) than at Mount St. Helens (∼62–65 wt.% SiO2 in 1980–1986 and ∼65 wt.% SiO2 in 2004–2008). There is evidence in both cases for crustal magma storage at depths below ∼7 km, although the size and longevity of the Redoubt reservoir are unknown. Eruption intervals at both volcanoes are broadly similar. Mount St. Helens erupted repeatedly during 1800–1857, 1980–1986, and 2004–2008. Redoubt erupted in 1902, 1966–1968, 1989–1990, and 2009; there are unconfirmed reports of eruptions in 1881 and 1933 (Alaska Volcano Observatory, 2018a). The character and size of recent eruptions are similar. Redoubt erupted explosively more than 20 times during 1989–1990. Fourteen lava domes were extruded, 13 of which were destroyed by explosive activity. Total bulk volume of erupted products was 0.1–0.2 km3 (Miller, 1994; Miller and Chouet, 1994). At Redoubt in 2009 there were more than 19 explosive events, two and possibly three domes were extruded and later destroyed, and a fourth survived. Total erupted volume was ∼0.1 km3. At Mount St. Helens there were six explosive eruptions in 1980, two lava domes were extruded and destroyed, and a third dome grew episodically during 1980–1986. Total erupted volume was ∼0.3 km3 DRE. The 2004–2008 eruption was dominantly extrusive; bulk volume of the resulting dome was ∼0.1 km3.
These similarities belie some striking differences in precursory activity, only some of which can be attributed to differences in monitoring capability, and in the nature of erupted products. As was the case at Pinatubo in 1991, both the 1989–1990 and 2009 eruptions at Redoubt produced banded pumices indicative of magma mixing (Nye et al., 1994; Coombs et al., 2013). Such evidence is lacking at Mount St. Helens in 1980–1986 and 2004–2008 (Pallister et al., 1992, 2008). At Redoubt, the earliest precursors (sulfur odor, increased snow melt, far-field deformation) were recognized, at least in hindsight, 8–10 months before the start of the 2009 eruption. DLP and deep VT seismicity increased about 3 months before the eruption onset. Power et al. (2013, p. 40) suggested that a similar increase might have accompanied the 1989–1990 eruption, noting that some events could have escaped detection. It is clear that no such increase in deep seismicity preceded the 2004–2008 eruption at Mount St. Helens. None was detected before the 1980–1986 eruption, although the seismic network at the time might have lacked sufficient sensitivity. The same is true for far-field deformation: none was detected prior to 1980 and very little occurred prior to 2004. Any change in gas emission, if it occurred prior to the onset of shallow-seated unrest in 1980 or 2004, went unnoticed (Gerlach et al., 2008). Limited monitoring capability, especially at Mount St. Helens before 1980, might account for some of the differences in recognized precursory activity. However, the preponderance of evidence (DLP seismicity, banded pumices) suggests the recent Redoubt and Pinatubo eruptions share one characteristic that Mount St. Helens in 1980–1986 and 2004–2008 does not, i.e., magma ascent from the lower crust, mixing, and mobilization of magma stored in a crustal reservoir.
Augustine Volcano, Alaska – Long-Term Changes in Crustal Magma Reservoirs Tracked With InSAR and CGPS
Augustine Volcano in Cook Inlet, Alaska, erupted frequently during the 20th and early 21st centuries, most recently in 1976, 1986, and 2006 (Alaska Volcano Observatory, 2018b). Lee et al. (2010) examined more than 50 ERS-1 and ERS-2 radar interferograms (InSAR images) of Augustine Island that collectively span 1992–2005. Using a refined small baseline subset (SBAS) InSAR technique, they produced a time series of observations that showed 2–8 cm uplift of the entire volcano during the 13-year period of investigation – slightly less on the upper flanks than on the lower flanks. Lee et al. (2010) showed the InSAR deformation field was consistent with an expanding Mogi source 7–12 km BSL and a contracting Mogi source 2–4 km BSL, which they interpreted as magma storage zones.
Augustine erupted explosively on January 11, 2006, soon after the end of the InSAR time series analyzed by Lee et al. (2010). The eruption included: (1) an initial explosive phase (January 11–28, 2006) with 13 discrete explosive events and extrusion of one or perhaps two lava domes; (2) a continuous phase (January 28–February 10, 2006) with essentially continuous ash emission, pyroclastic flows, occasional seismic signals thought to represent more explosive events with associated ash clouds, and steady effusion of a lava dome and flow starting on February 3; and (3) an effusive phase (March 13–16, 2006) with growth of a larger summit dome, renewed growth of the earlier lava flow, and formation of a second flow – all accompanied by vigorous block-and-ash flows (Power et al., 2006; Coombs et al., 2013). Some of the larger explosive events during the first two phases of the eruption were accompanied by long-period earthquakes at 1–5 km depth BSL, which Syracuse et al. (2011) attributed to magma transport from a storage zone, through a conduit, to the surface. In light of experience at Pinatubo and Redoubt discussed above, and given clear evidence for magma mixing at Augustine prior to its 2006 eruption (see below), we suspect that deeper LPs also occurred at Augustine as a result of magma injection into a crustal reservoir. That no DLPs were detected might be an artifact of the small aperture (<10 km) of the Augustine seismic network, which is confined to Augustine Island (Figure 8).
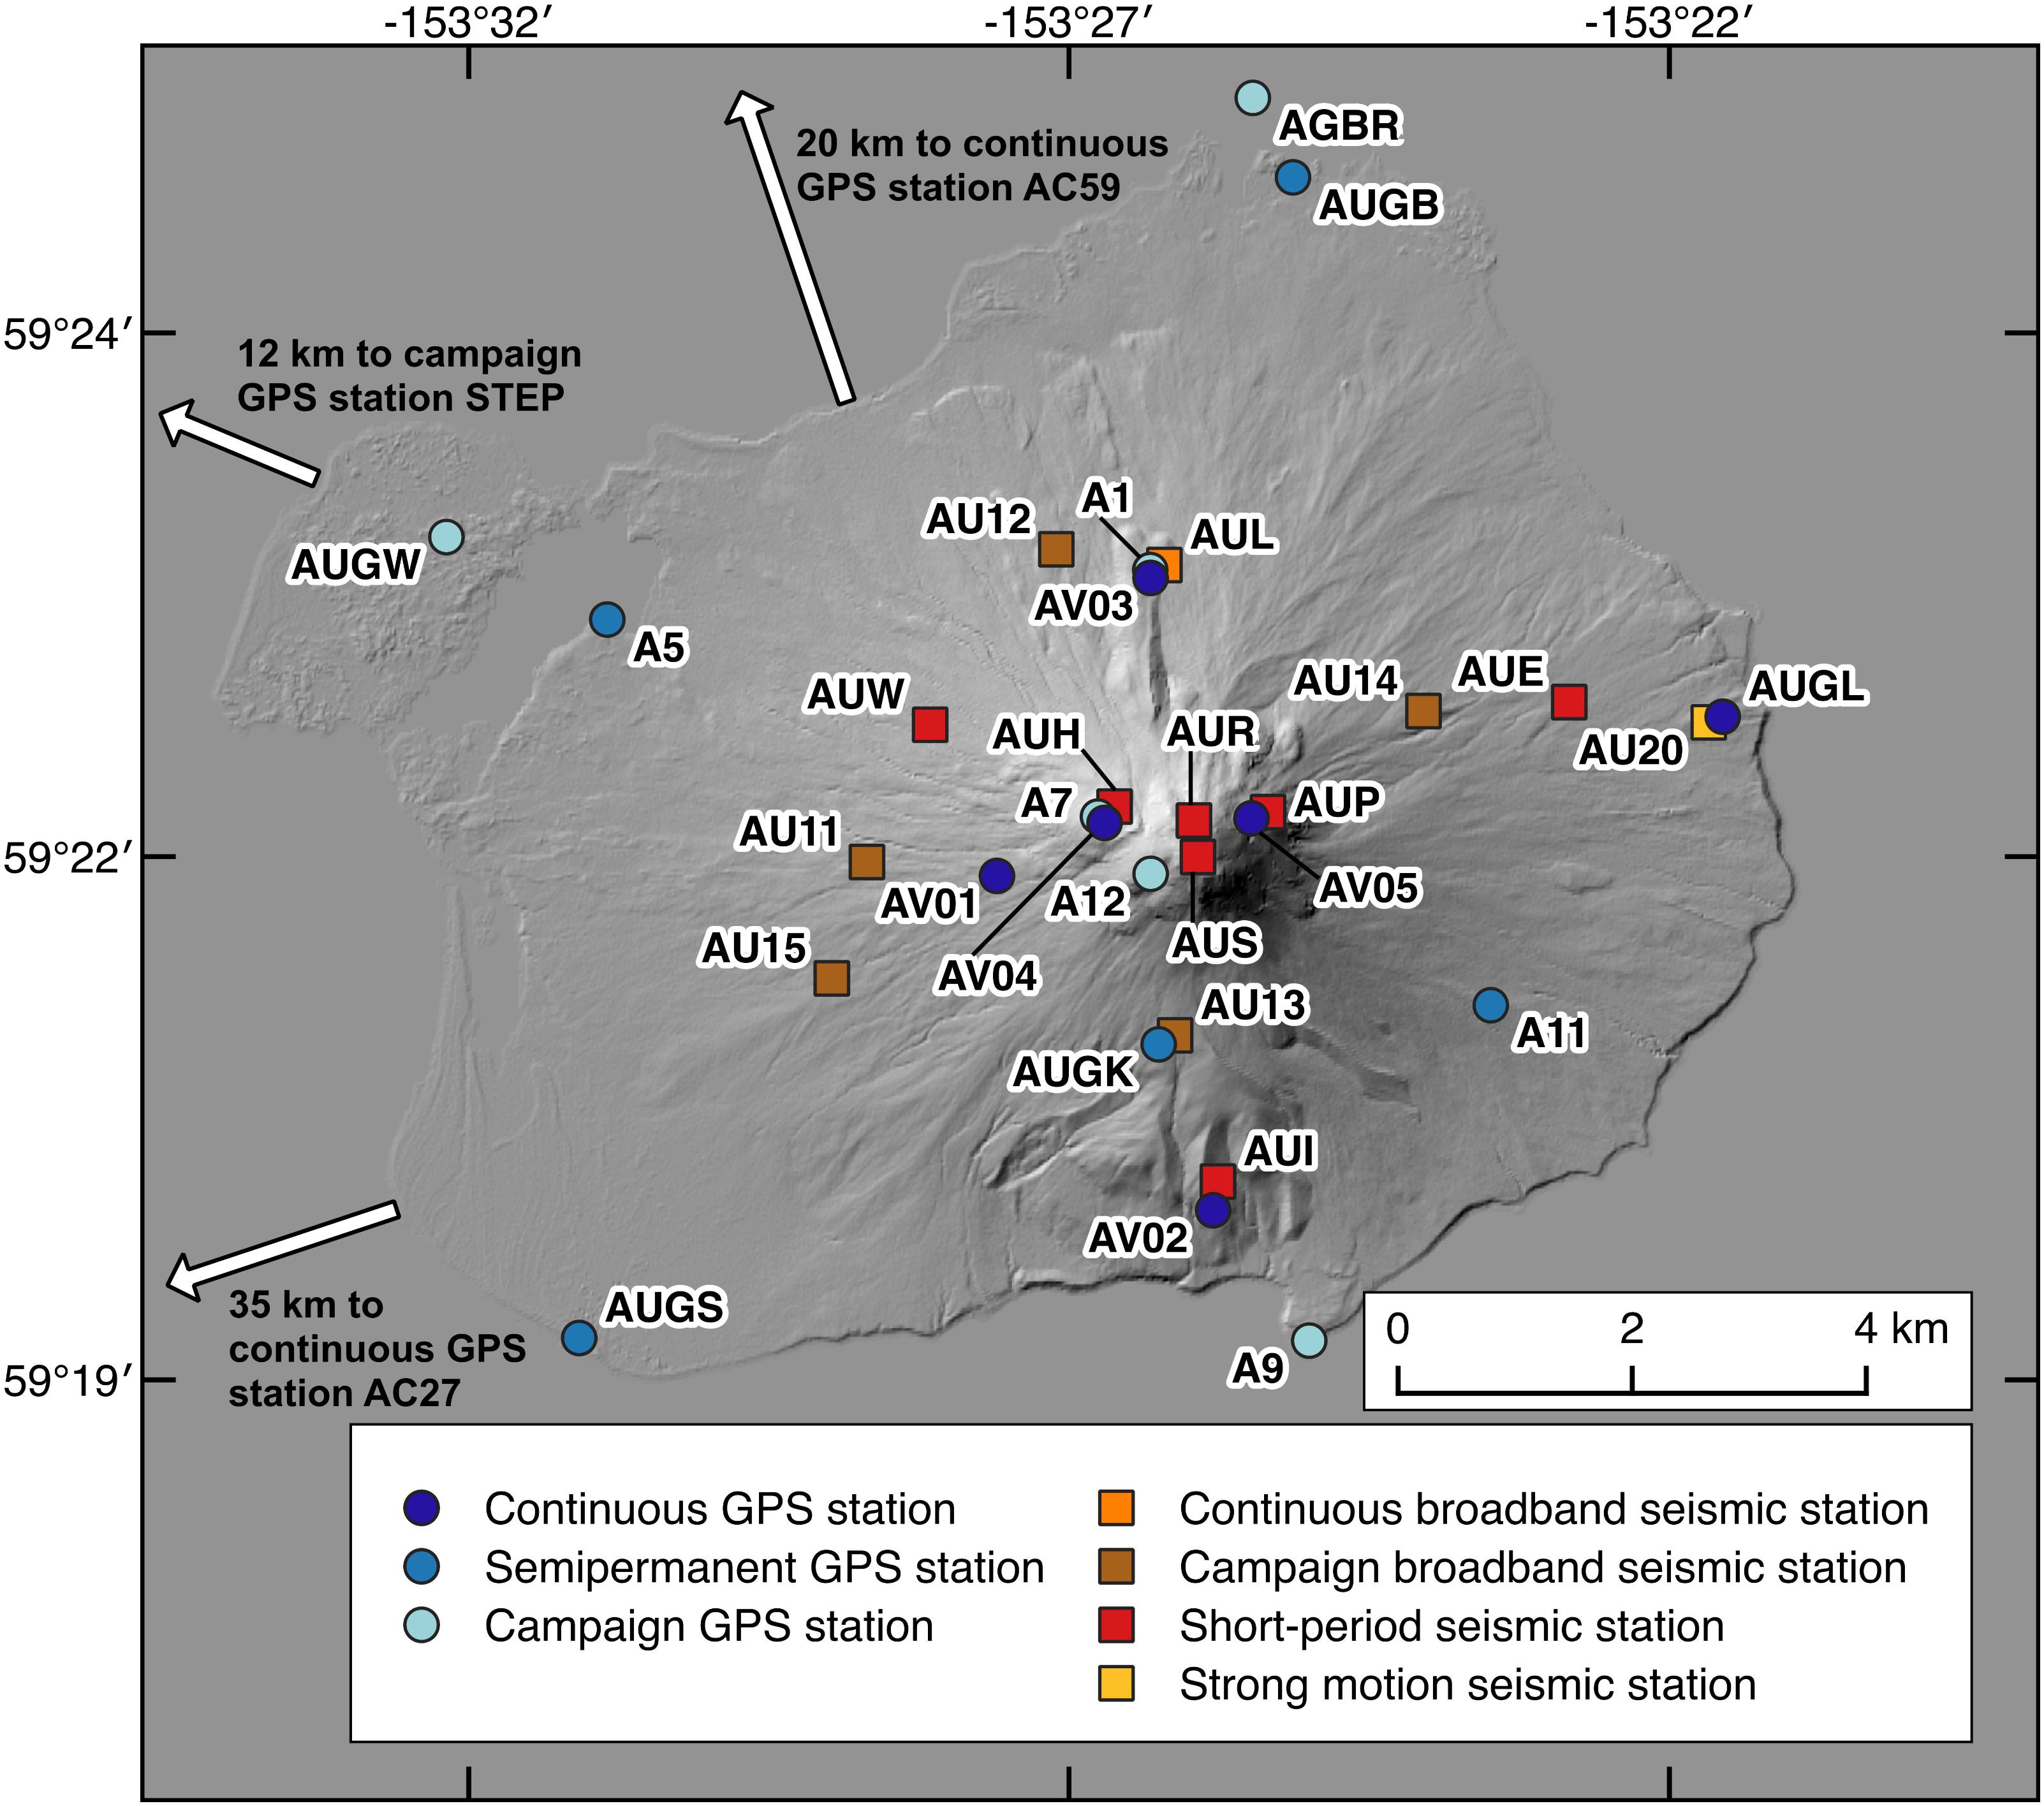
FIGURE 8. Map showing seismic and GPS stations at Augustine Volcano prior to the 2006 eruption. Seismic station locations are from Power and Lalla (2010). GPS station locations are from Cervelli et al. (2010); see also Pauk et al. (2010). For additional details, see original publications. Hillshade is an ESRI Image Service product from 2013 accessed through ArcGIS Online.
Larsen et al. (2010) reported that the 2006 eruption produced five major lithologies: (1) low-silica andesite (LSA) scoria, mostly during the initial explosive phase; (2) high-silica andesite (HSA) pumice, prevalent during the continuous phase; (3) dense low-silica andesite, predominantly during the late effusive phase; (4) dense intermediate andesite, erupted during all phases but most prevalent in deposits of the continuous phase; and (5) banded clasts of any combination of the above, present throughout the eruption but most abundant in the continuous phase. Based on petrological and geochemical evidence, they concluded (p. 335):
…the HSA was stored as a crystal-rich mush with its top at ∼5-km depth. An influx of basalt remobilized and partially mixed with a portion of the mush, forming the hybrid LSA. The lower viscosity LSA ascended toward the surface as a dike, erupting during the explosive phase in mid-January 2006. In late January, a large explosion produced the first significant volumes of HSA, followed by several days of rapid HSA effusion during the eruption’s continuous phase. After a 3-week hiatus marked by elevated gas output, signifying an open system, degassed LSA erupted during the final, effusive phase.
Cervelli et al. (2006; 2010) analyzed data from 11 permanent or semipermanent CGPS stations on the island that collectively span the eruption (Figure 8). Precursory inflation that began in mid-August 2005, 5 months before the eruption onset, can be modeled with a Mogi source located under the summit area and near sea level. Cervelli et al. (2010) attributed the inflation to pressurization by volatiles trapped near the impermeable base of the edifice—volatiles we can infer were released from the contracting magma reservoir 2–4 km BSL that Lee et al. (2010) identified. Cervelli et al. (2010) reported that deformation switched from inflation to deflation in late January 2006 during the period of continuous explosive activity. They modeled the source as a cylindrical magma body with a top depth of 3.5 ± 1.0 km and a bottom depth of 8.5 ± 2.0 km below Augustine’s summit (1.2 ± 1.0 km BSL and 7.2 ± 2.0 km BSL, respectively)—perhaps the top of, or a conduit above, the expanding magma storage zone at 7–12 km BSL modeled by Lee et al. (2010), which in turn might be related to the crystal mush zone with a top at ∼5-km BSL identified by Larsen et al. (2010).
The salient points here are: (1) InSAR evidence for long-term pressurization of a magma storage zone in the mid- to upper crust, (2) several months of precursory deformation from a shallower source tracked by CGPS, (3) deflation of the crustal reservoir during the continuous phase of the eruption, also tracked with CGPS, and (4) clear evidence for magma mixing triggered by an injection of basaltic magma into a crustal reservoir. Inflation of the shallow source prior to the eruption followed by deflation of the deeper source during the eruption implies a pressure connection between the two, initially for volatiles and eventually for the magma erupted in 2006. The apparent absence of DLP seismicity prior to the eruption, even though there is evidence for an influx of basalt to the crustal storage zone, might be an artifact of the small-aperture island seismic network.
What Additional Precursors, if Any, Should Be Expected Before Mount St. Helens’ Next Eruption?
Considering recent experience at Mount St. Helens and the three volcanoes profiled above, a case can be made that another dome-forming eruption at Mount St. Helens could begin with little warning beyond a few days of shallow seismicity and localized ground deformation. If patterns that emerged prior to the start of the 2004–2008 eruption repeat, we should expect more seismicity near 2 km depth, indicating formation of a conduit plug, and perhaps a general lull in seismicity before the plug eventually is overcome by slowly increasing magma pressure. The likelihood of little advance warning is greater if the next event is another in a progression of dome-forming eruptions that began in 1980–1986 and continued during 2004–2008, i.e., episodic ascent of relatively gas-poor magma remnant from the 1980 explosive activity. The case for this scenario is stronger if the 1980 activity was initiated by an injection event 500 years ago during Kalama time and not by a more recent perturbation of the upper crustal reservoir, as suggested by petrologic evidence cited above. In fact, progressively smaller compositional oscillations in erupted products from Kalama time through 2004–2008 (Pallister et al., 1992, 2008), combined with the remarkably gas-poor and low-temperature character of 2004–2008 lava (Gerlach et al., 2008; Vallance et al., 2008), suggest the cycle that began in Kalama time might be coming to an end. If so, the next eruption might not occur until there is another injection of gas or magma into the upper crustal reservoir to initiate a new cycle.
If an injection event were to trigger the next eruption, the case studies cited above suggest the eruption would be heralded by detectable DLP seismicity, far-field ground deformation, and increased gas emission, likely for several months or more unless the injection were large enough or rapid enough to mobilize reservoir magma or “blow through” the reservoir more quickly.
Factors That Affect Precursory Activity
The preceding sections call attention to a spectrum of precursory activity at arc volcanoes and, by implication, to a multitude of factors that might influence a volcano’s behavior prior to eruption. Following is a partial list of those factors, their likely effects, and implications for optimizing monitoring networks and strategies.
Pressurization of crustal magma reservoirs can result from ingestion of fluids (magma or volatiles) from below or exsolution of volatiles from already-resident magma during second boiling. With adequate monitoring, both processes are likely to produce detectable seismicity, ground deformation, and gas emission. If the fluid is magma and the intrusion is large enough or shallow enough, there also will be measureable changes in residual gravity; less so if the fluid is composed of volatile species (e.g., H2O, SO2, and CO2). Experience at Pinatubo and Redoubt suggests the intensity of DLP seismicity might scale with the size of the injection/mixing event: large or rapid > small or gradual, although the sample size is small and many factors probably influence the intensity of DLP occurrence. The same is probably true for ground deformation, which might be more pronounced and easier to detect if: (1) the intrusion is large and rapid, (2) the reservoir is relatively shallow, (3) the magma involved (intruding and resident) is relatively incompressible, (4) the reservoir walls are relatively rigid, and (5) the host rock is elastic. Viscoelastic behavior will tend to mute both seismicity and deformation, meaning that long repose periods and small reservoir size (i.e., colder plumbing systems) are conducive to stronger precursory activity than short reposes or large, long-lived reservoirs. Ascending silicic magmas, by virtue of their greater viscosity and gas content, are expected to produce more precursory VT and LP seismicity than mafic magmas. On the other hand, the greater compressibility of gas-rich magmas means that more can be accommodated in a given volume without producing as much deformation of host rock as would be the case for gas-poor magma. For that reason, gravity measurements are especially important for detecting accumulation of gas-charged, potentially explosive magma that might produce LP seismicity but relatively little ground deformation. Unfortunately, with current instrumentation and techniques, it might not be possible to detect a change in residual gravity if the mass change is small or the accumulation zone is deeper than a few kilometers.
Implications for Monitoring Strategies and Modeling Studies
Monitoring
If the next eruption at Mount St. Helens occurs relatively soon (within a few decades) and taps the same 1980-residual magma that fed the 1980–1986 and 2004–2008 dome-forming eruptions, we should expect precursors similar to those observed prior to the 2004–2008 event: (1) sporadic swarms of small VT earthquakes at depths of 2–10 km, indicating magma-system pressurization, (2) intensification of seismicity near 2 km depth, indicating incipient fracturing of a conduit plug, (3) a days-long swarm of intense shallow seismicity indicating cascading failure of the plug, accompanied by (4) localized, intense deformation of the crater floor or Crater Glacier (formation of a “welt”), and (5) slow extrusion of gas-poor dacite, perhaps preceded by phreatic eruptions when rising magma encounters shallow groundwater. A small increase in residual gravity might also be detected as magma accumulates aseismically beneath the conduit plug. If the current repose lasts more than a few decades and ends with another dome-forming eruption, precursors might be more protracted and intense because the conduit plug would have become more resilient. If there is an explosive onset, beyond phreatic explosions involving groundwater, magmatic volatiles would be implicated. In that scenario, we might expect LP seismicity and subtle far-field deformation as the magma system pressurizes; some increase in magmatic gas emission also is possible if the system is not completely sealed. Gaunt et al. (2014) showed that this is likely to be the case. Their study of 2004–2008 dome rocks revealed a marginal shear zone along the conduit wall that greatly facilitates upward mobility of volatiles. Volatile escape would slow the pressurization process and thus delay the onset of shallow seismicity, as seems to be the case as this is written in June 2018.
An alternate scenario is that the next eruption does not occur until the upper crustal reservoir is replenished during an injection event. In that case, precursors including energetic DLP seismicity, pronounced far-field ground deformation, increased gas emission, and residual gravity increases might herald the eruption several months or more in advance.
An effective monitoring strategy for Mount St. Helens must address the full range of plausible eruption scenarios in order to capture precursors that might range from subtle to obvious, localized to widespread, and protracted to sudden. Such a strategy was outlined by Ewert et al. (2005) as a framework for the National Volcano Early Warning System (NVEWS). A central tenet of the NVEWS approach is to avoid “playing catch-up” with a dangerous volcano, a situation that arises when a volcano awakens before a robust monitoring system is deployed, necessitating a suboptimal response. The proactive NVEWS approach is reminiscent of the conclusion by Dzurisin (2000, p. 1564) regarding the need for comprehensive deformation monitoring: “…to distinguish among the full range of possible source locations and geometries, especially if multiple sources might be present, it is necessary to make measurements virtually ‘everywhere, all the time’…” In this context, “everywhere” refers to the area susceptible to surface deformation from known or plausible sources, under the assumption that deformation is elastic. For the upper crustal reservoir at Mount St. Helens (7–14 km depth), the potentially deforming area extends more than 20 km from the volcano. In order to account for tectonic deformation, a regional network of CGPS stations at even greater distances is necessary. “All the time” means continuously, because deformation events at volcanoes can be sudden and/or reversible, especially given the complex rheology of the subsurface.
Mount St. Helens was among 18 United States volcanoes that Ewert et al. (2005) identified as “very high threat” – an assessment based on a combination of hazards and exposure. Current monitoring networks at Mount St. Helens generally conform to the recommendations made by Moran et al. (2008b) for very high threat volcanoes. Monitoring networks for seismic activity, ground deformation, and gas emission are capable of detecting the types and levels of precursory activity to be expected before the next eruption, at least a few days (renewed dome building) to several months (new explosive eruptive cycle triggered by magma or fluid injection) in advance. In light of experience in 2004, when preeruption deformation was confined to within a few hundred meters of the vent, it would be prudent to install two or more additional CGPS stations on the 1980–1986 dome or 2004–2008 dome (the only proximal areas not covered by Crater Glacier). Currently, only one CGPS station is operating this close to the vent, at the former site of DOM1, and the next closest station is ∼2 km away (Figure 2).
Modeling
A detailed conceptual model of Mount St. Helens’ magmatic system and behavior has emerged from nearly four decades of monitoring information and related research. The model applies remarkably well to three other arc volcanoes profiled above, and shares essential features with a generalized volcano model discussed by McCausland et al. (2017) (Figure 9).
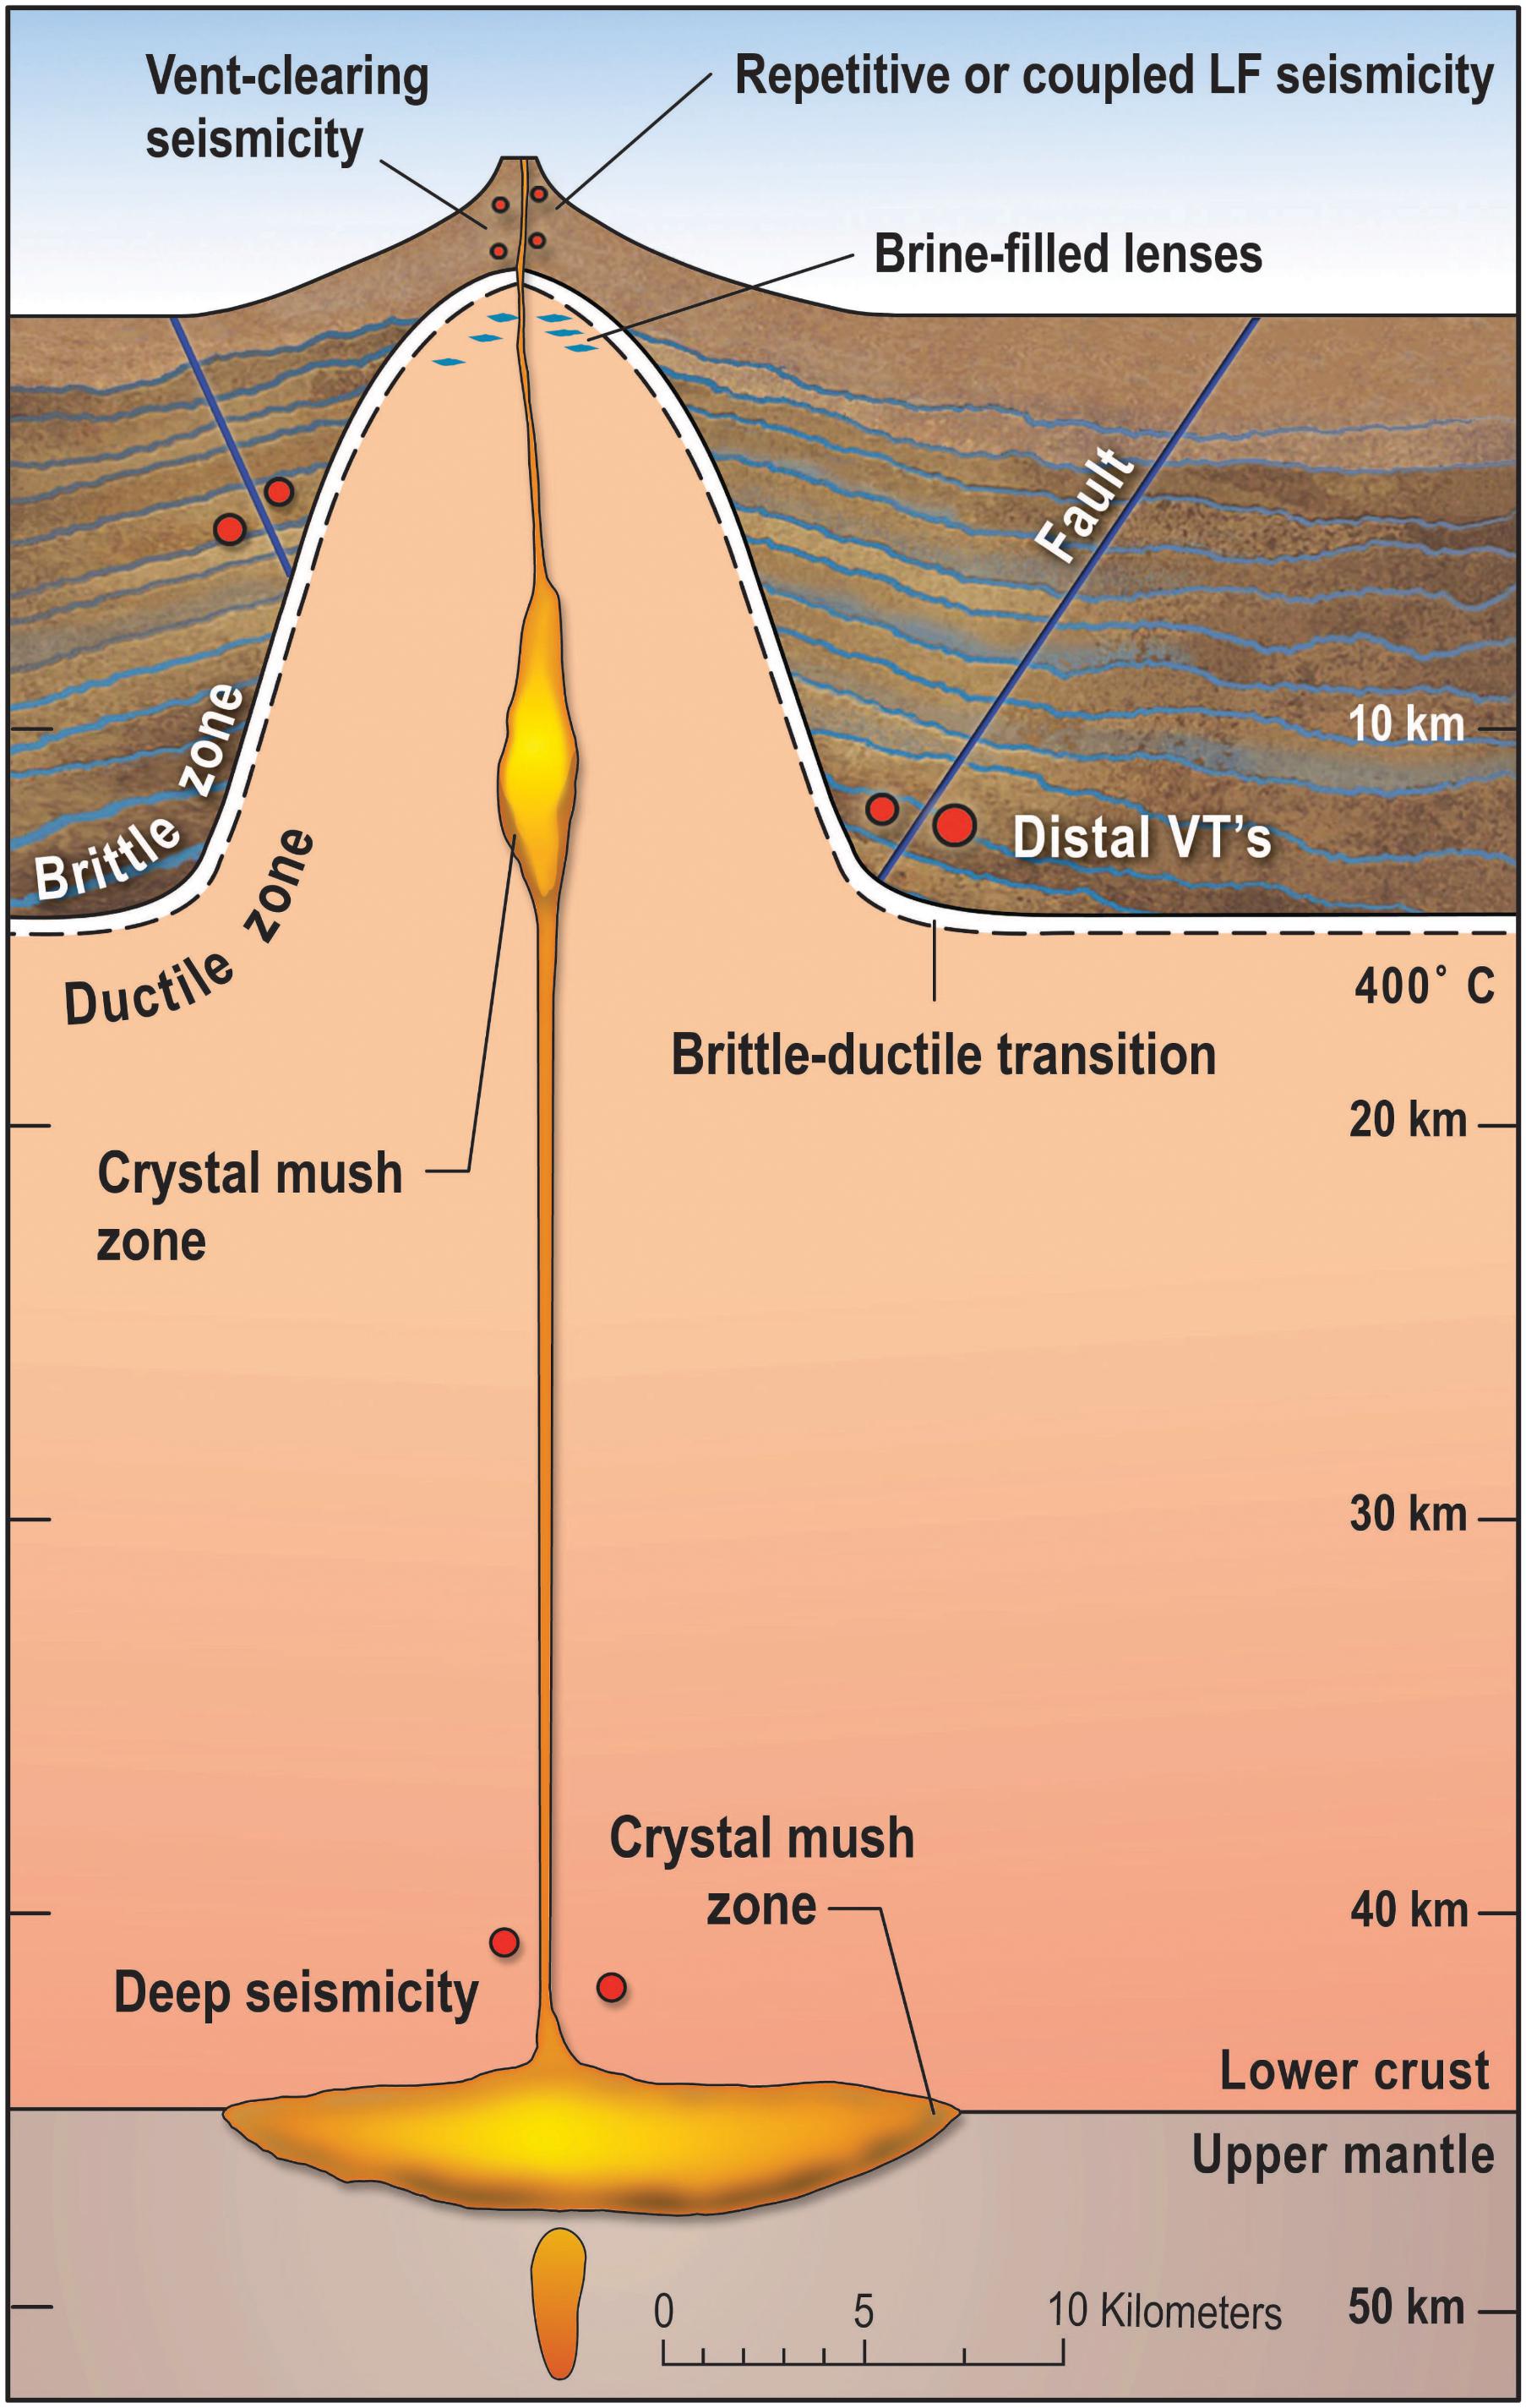
FIGURE 9. Conceptual volcano model reproduced from McCausland et al. (2017), modified from a three-dimensional depiction to a two-dimensional one, and with additional modifications based on the work of Bachmann and Huber (2016) and Cashman et al. (2017). The first study proposed a process-based model that explains observed similarities in pre-eruptive seismic patterns at many arc volcanoes; the latter two studies emphasized the prevalence and importance of crystal-rich mush zones beneath magmatic systems. Together these concepts provide a useful framework for this paper’s discussion of activity at Mount St. Helens since its reawakening in 1980.
Essential features of the model are: (1) a deep source of magma generation in the upper mantle/lower crust; (2) a primary magma reservoir in the mid-to-upper crust (7–14 km depth); (3) subsidiary magma storage above the primary reservoir along a conduit system to the surface; (4) a plastic zone surrounding the magmatic system and extending to within a few kilometers of the surface, which serves to mute both brittle-failure seismicity and surface deformation except at high strain rates or large, relatively sudden pressure changes; and (5) crystal mush zones in the magma column that have a similar mitigating effect on geophysical and geochemical signals (Blake, 1984; Tait et al., 1989; Woods and Cardoso, 1997).
Concurrent with the evolution of conceptual volcano models has been the development of physics-based models, most recently in a Bayesian framework (e.g., Anderson and Segall, 2011, and references therein). As the name implies, physics-based models apply physical principles and observational constraints to infer the behavior of magmatic systems (Figure 10). This approach has been applied to the 2004–2008 eruption at Mount St. Helens (Anderson and Segall, 2013; Wong et al., 2017) and to the 1983–present eruption at Kılauea Volcano, Hawai‘I (Anderson and Poland, 2016, 2017) with good success.
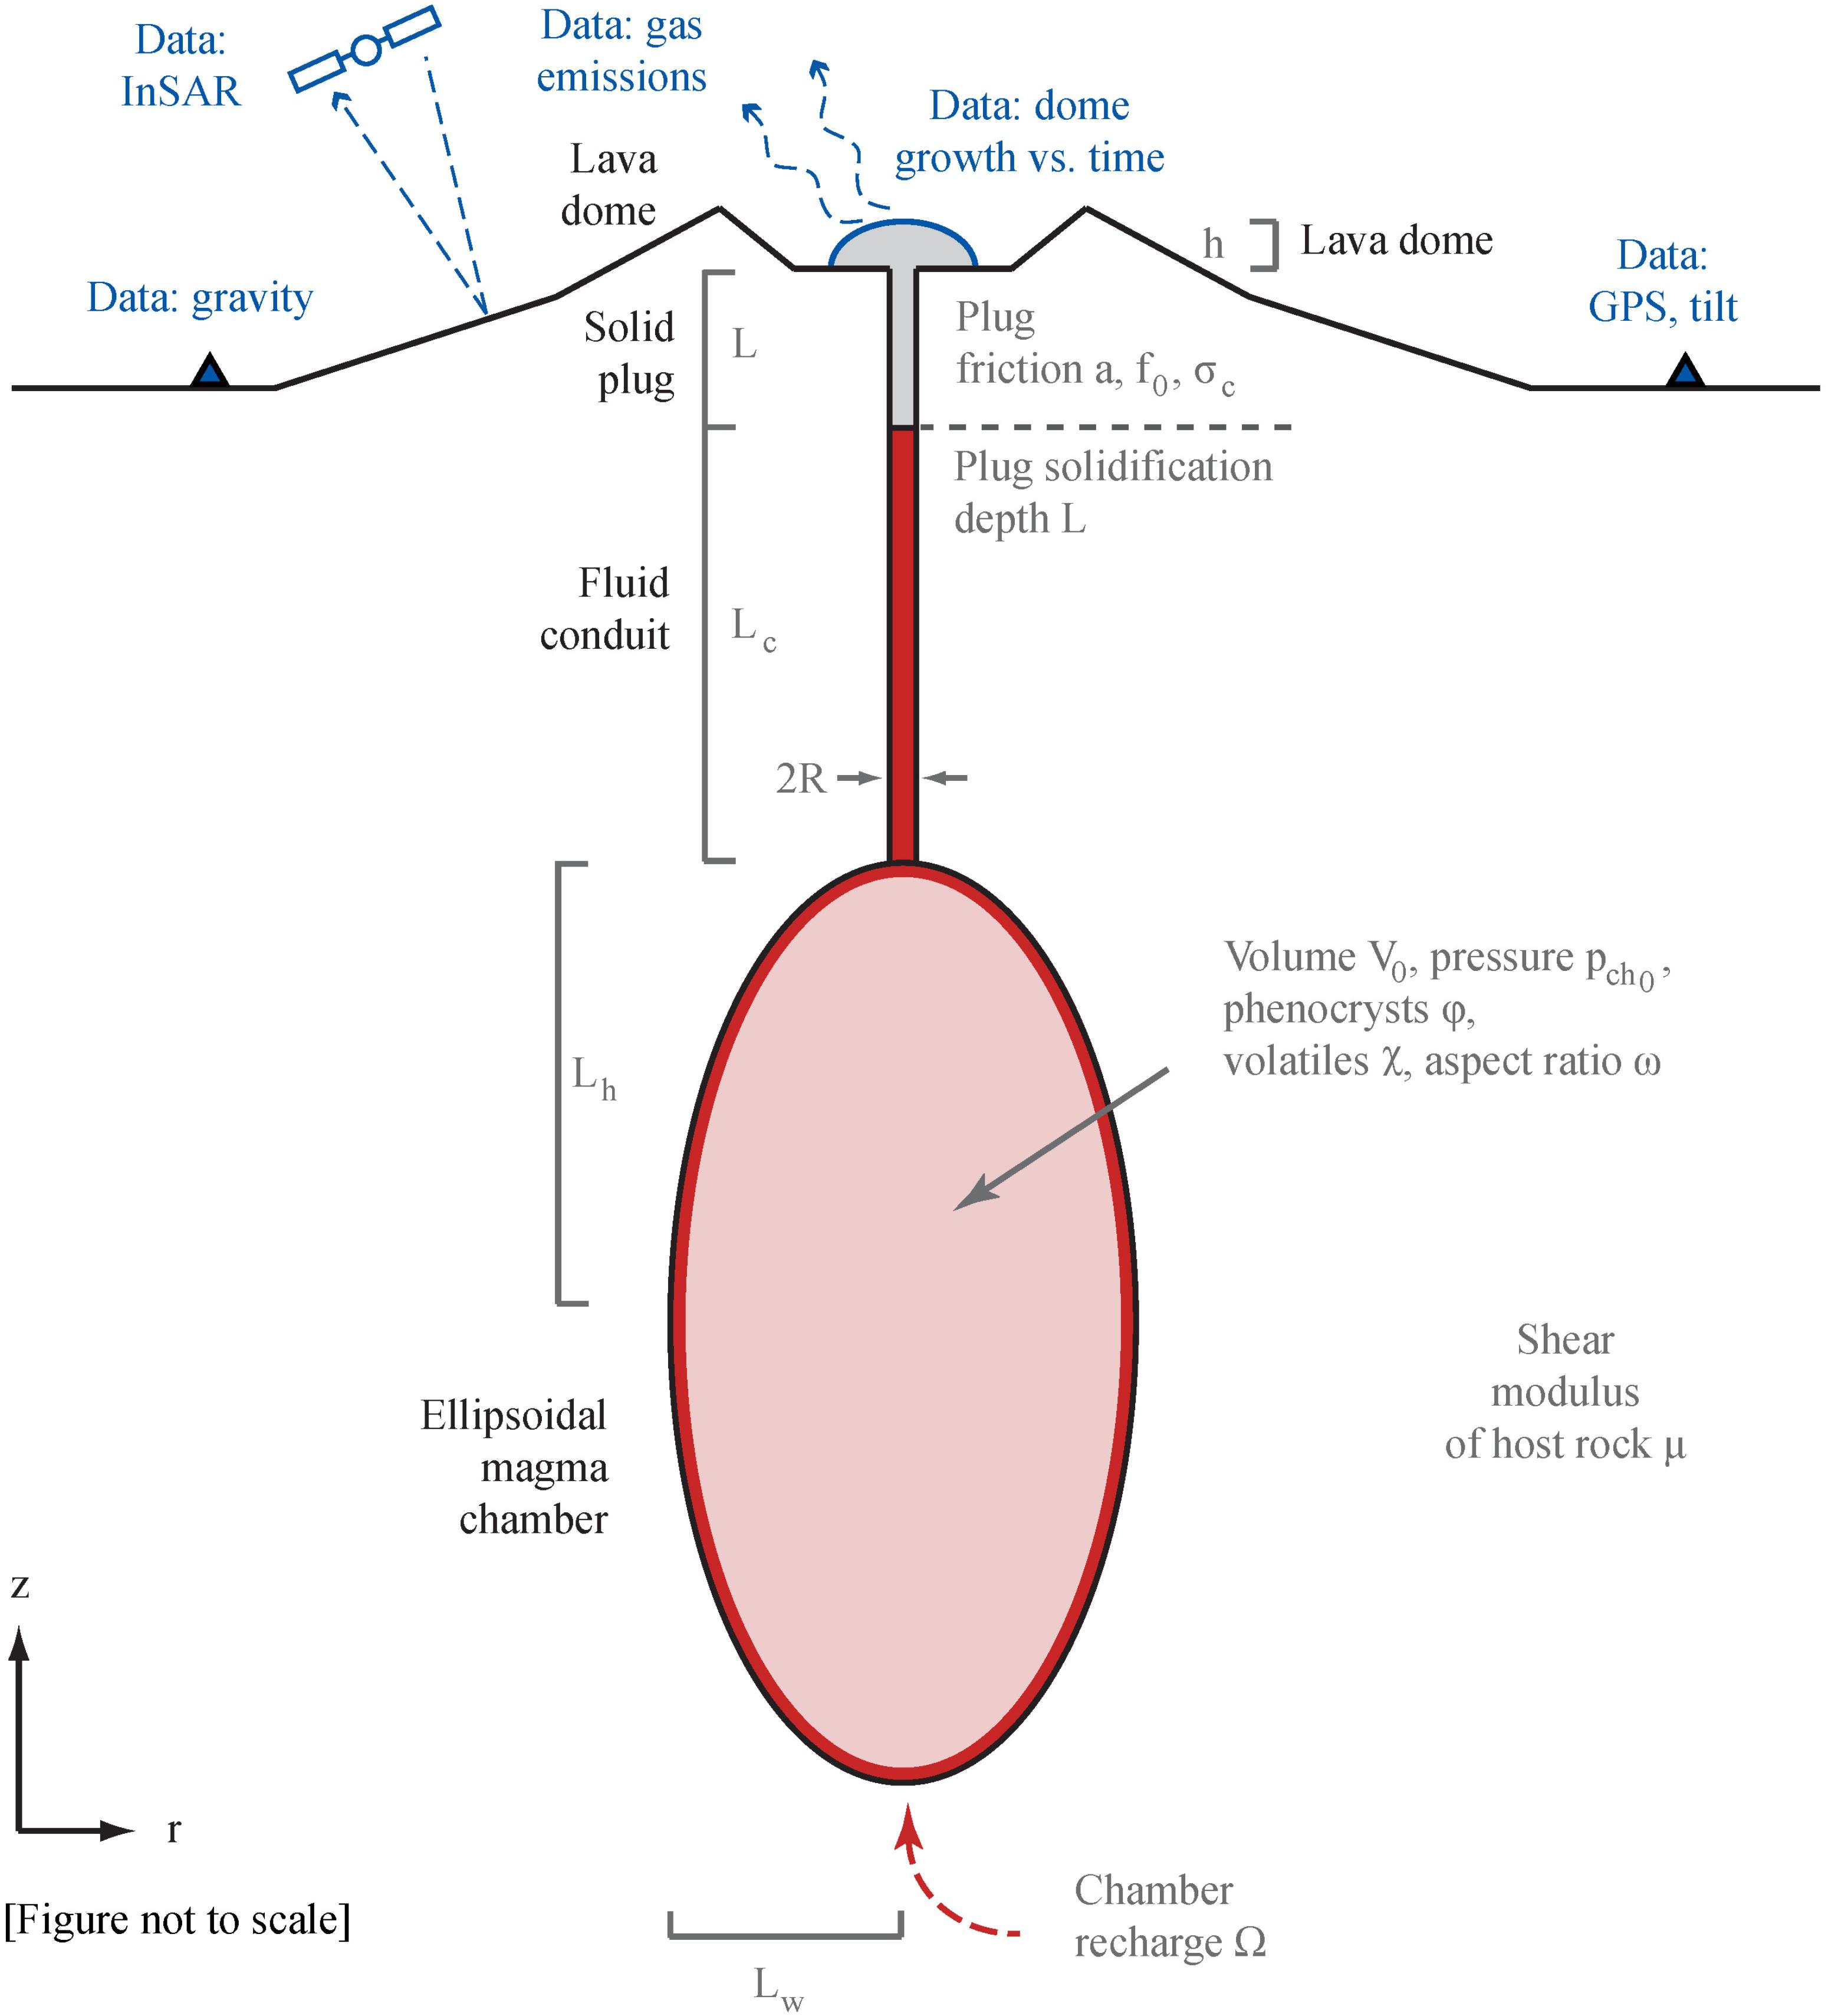
FIGURE 10. Physics-based model of the Mount St. Helens magmatic system, reproduced from Anderson and Segall (2011).
It would be useful to apply such a physics-based approach to eruption precursors in general and to some of the specific issues raised here. For example, it is plausible that there has been little or no input to Mount St. Helens’ primary magma storage reservoir since Kalama time, and all subsequent eruptions are part of a declining cycle that might have come to an end in 2008? What conditions in the subsurface are necessary for that scenario to be viable? Is it reasonable that gas-poor, near-solidus-temperature magma rose from ∼5 km depth to the surface without causing brittle-fracture earthquakes deeper than 2 km? What are the implications for the temperature structure and rheology in country rock near the conduit? What fracture permeability is required for circulation of meteoric water to have cooled the upper 2 km of the conduit from 1986 to 2004? Is there sufficient gas left in 1980 magma to initiate another dome-forming episode, or is additional fluid input required from below? How far into the future will additional dome-building be possible without tapping a new batch of more gas-rich magma? Such questions would be difficult to answer with any certainty, given limited knowledge about subsurface conditions and even about the physical processes involved. But the Bayesian framework is well-suited to such a challenge, and physics-based models have the potential to evaluate ad hoc explanations and thus to improve conceptual volcano models.
Concluding Statement
Mount St. Helens since 1980 has provided an opportunity to study the behavior of an arc volcano from reawakening through a climactic eruption and its decades-long aftermath. Many questions have arisen and answers have been proposed. Behaviors that seemed enigmatic at the time (e.g., 1980 bulge, 2004 welt, and general lack of long-term or deep-seated precursors) now have plausible explanations in the form of a conceptual model supported by extensive research and modeling. Understanding Mount St. Helens has been difficult: in some respects, the volcano has been more inscrutable than anticipated. But with nearly four decades of experience, remaining questions have come into better focus and the tools necessary to answer them are at hand. We end where we began, by asking questions. The answers to those questions are both a challenge and an opportunity future research.
Author Contributions
The author confirms being the sole contributor of this work and approved it for publication.
Funding
This research was supported by the USGS Volcano Hazards Program and USGS Volcano Science Center through the Cascades Volcano Observatory project WC00CKD.
Conflict of Interest Statement
The author declares that the research was conducted in the absence of any commercial or financial relationships that could be construed as a potential conflict of interest.
Acknowledgments
Volunteer Behnanz Hosseini used her considerable ingenuity and GIS skills to create Figures 1, 2, 6, 7, and 8. Mike Lisowski thoroughly analyzed the JRO1 time series data and produced Figure 5. Wes Thelen and Greg Waite provided original versions of Figures 3 and 4, respectively. John Pallister reviewed an early version of the manuscript, encouraged me to carry on, and managed to make petrology understandable to a geodesist. Thorough reviews by Raffaello Cioni and a reviewer improved the presentation considerably.
Footnotes
References
Alaska Volcano Observatory (2018a). Redoubt Reported Activity. Available at: https://www.avo.alaska.edu/volcanoes/volcact.php?volcname=Redoubt [accessed August 2018].
Alaska Volcano Observatory (2018b). Augustine Reported Activity. Availaable at: https://www.avo.alaska.edu/volcanoes/volcact.php?volcname=Augustine [accessed August 2018].
Anderson, K., and Segall, P. (2011). Physics-based models of ground deformation and extrusion rate at effusively erupting volcanoes. J. Geophys. Res. Solid Earth 116, 1–20. doi: 10.1029/2010JB007939
Anderson, K., and Segall, P. (2013). Bayesian inversion of data from effusive volcanic eruptions using physics-based models: application to Mount St. Helens 2004–2008. J. Geophys. Res. Solid Earth 118, 2017–2037. doi: 10.1002/jgrb.50169
Anderson, K. R., and Poland, M. P. (2016). Bayesian estimation of magma supply, storage, and eruption rates using a multiphysical volcano model: kîlauea volcano, 2000–2012. Earth Planet. Sci. Lett. 447, 161–171. doi: 10.1016/j.epsl.2016.04.029
Anderson, K. R., and Poland, M. P. (2017). Abundant carbon in the mantle beneath Hawai‘i. Nat. Geosci. 10, 704–708. doi: 10.1038/NGEO3007
Bachmann, O., and Huber, C. (2016). Silicic magma reservoirs in the Earth’s crust. Am. Mineral. 101, 2377–2404. doi: 10.2138/am-2016-5675
Barker, S. E., and Malone, S. D. (1991). Magmatic system geometry at Mount St. Helens modeled from the stress field associated with posteruptive earthquakes. J. Geophys. Res. Solid Earth 96, 11883–11894. doi: 10.1029/91JB00430
Battaglia, M., Lisowski, M., Dzurisin, D., Poland, M. P., Schilling, S., Diefenbach, A., et al. (2018). Mass addition at Mount St. Helens, Washington, inferred from repeated gravity surveys. J. Geophys. Res. Solid Earth 23:2, 1856–1874. doi: 10.1002/2017JB014990
Bergfeld, D., Evans, W. C., Spicer, K. R., Hunt, A. G., and Kelly, P. J. (2017). Evidence for degassing of fresh magma during the 2004–2008 eruption of Mount St. Helens; subtle signals from the hydrothermal system. J. Volcanol. Geotherm. Res. 343, 109–121. doi: 10.1016/j.jvolgeores.2017.06.020
Blake, S. J. (1984). Volatile oversaturation during the evolution of silicic magma chambers as an eruption trigger. J. Geophys. Res. Solid Earth 89, 8237–8244. doi: 10.1029/JB089iB10p08237
Brantley, S., and Myers, B. (2000). Mount St. Helens – From the 1980 Eruption to 2000, U.S. Geological Survey Fact Sheet 036-00. Washington, DC: U.S. Government Printing Office. 2. Available at: https://pubs.usgs.gov/fs/2000/fs036-00/
Bull, K. F., and Buurman, H. (2013). An overview of the 2009 eruption of redoubt volcano, Alaska. J. Volcanol. Geotherm. Res. 259, 2–15. doi: 10.1016/j.jvolgeores.2012.06.024
Carey, S., Sigurdsson, H., Gardner, J. E., and Criswell, W. (1990). Variations in column height and magma discharge during the May 18, 1980 eruption of Mount St Helens. J. Volcanol. Geotherm. Res. 43, 99–112. doi: 10.1016/0377-0273(90)90047-J
Cashman, K. V., Sparks, R. S. J., and Blundy, J. D. (2017). Vertically extensive and unstable magmatic systems: a unified view of igneous processes. Science 355:6331. doi: 10.1126/science.aag3055
Cervelli, P., Fournier, T., Freymueller, J., and Power, J. A. (2006). Ground deformation associated with the precursory unrest and early phases of the January 2006 eruption of Augustine Volcano, Alaska. Geophys. Res. Lett. 33:L18304. doi: 10.1029/2006GL027219
Cervelli, P. F., Fournier, T. J., Freymueller, J. T., Power, J. A., Lisowski, M., and Pauk, B. A. (2010). “Geodetic constraints on magma movement and withdrawal during the 2006 eruption of Augustine Volcano,” in The 2006 Eruption of Augustine Volcano, Alaska, U.S. Geological Survey Professional Paper 1769, Chap. 17, eds J. A. Power, M. L. Coombs, and J. T. Freymueller (Washington, DC: U.S. Government Printing Office), 427–452.
Christiansen, R. L., and Peterson, D. W. (1981). “Chronology of the 1980 eruptive activity,” in The 1980 Eruptions of Mount St. Helens, Washington, U.S. Geological Survey Professional Paper 1250, eds P. W. Lipman and D. R. Mullineaux (Washington, DC: U.S. Government Printing Office), 17–30.
Clynne, M. A., Ramsey, D. W., and Wolfe, E. W. (2005). Pre-1980 eruptive history of Mount St. Helens, Washington. U.S. Geol. Survey Fact Sheet 2005–3045. Washington, DC: U.S. Government Printing Office, 4.
Coombs, M. L., Sisson, T. W., Bleick, H. A., Henton, S. M., Nye, C. J., Payne, A. L., et al. (2013). Andesites of the 2009 eruption of Redoubt Volcano, Alaska. J. Volcanol. Geotherm. Res. 259, 349–372. doi: 10.1016/j.jvolgeores.2012.01.002
Dixon, J. P., Stihler, S. D., Power, J. A., and Searcy, C. K. (2010). Catalog of Earthquake Hypocenters at AlasKan Volcanoes: January 1 Through December 31, 2009: U.S. Geological Survey Data Series 531, 84. Available at: http://pubs.usgs.gov/ds/531/
Dvorak, J., Okamura, A., Mortensen, C., and Johnston, M. J. S. (1981). “Summary of electronic tilt studies at Mount St. Helens,” in The 1980 Eruptions of Mount St. Helens, Washington, U.S. Geological Survey Professional Paper 1250, eds P. W. Lipman and D. R. Mullineaux (Washington, DC: U.S. Government Printing Office), 169–174.
Dzurisin, D. (2000). Volcano geodesy: challenges and opportunities for the 21st century. Philos. Trans. R. Soc. London Ser. A 358, 1547–1566. doi: 10.1098/rsta.2000.0603
Dzurisin, D. (2007). Volcano Deformation; Geodetic Monitoring Techniques. Berlin: Springer-Praxis Books in Geophysical Sciences, 441.
Dzurisin, D., Lisowski, M., Poland, M. P., Sherrod, D. R., and LaHusen, R. G. (2008). “Constraints and conundrums resulting from ground-deformation measurements made during the 2004–2005 dome-building eruption of Mount St. Helens, Washington,” in A Volcano Rekindled; The Renewed Eruption of Mount St. Helens, 2004–2006, Chap. 14, eds D. R. Sherrod, W. E. Scott, and P. H. Stauffer (U.S. Geol. Survey Professional Paper 1750), 281–300. Available at: https://pubs.usgs.gov/pp/1750/chapters/pp2008-1750_chapter14.pdf
Dzurisin, D., Moran, S. C., Lisowski, M., Schilling, S. P., Anderson, K. R., and Werner, C. (2015). The 2004–2008 dome-building eruption at Mount St. Helens, Washington: epilogue. Bull. Volc. 77:17. doi: 10.1007/s00445-015-0973-4
Einarsson, P. (2018). Short-term seismic precursors to Icelandic eruptions 1973–2014. Front. Earth Sci. 6:45. doi: 10.3389/feart.2018.00045
Endo, E. T., Malone, S. D., Noson, L. L., and Weaver, C. S. (1981). “Locations, magnitudes, and statistics of the March 20–May 18 earthquake sequence,” in The 1980 Eruptions of Mount St. Helens, Washington, U.S. Geological Survey Professional Paper 1250, eds P. W. Lipman and D. R. Mullineaux (Washington, DC: U.S. Government Printing Office), 93–107.
Ewert, J. W., Guffanti, M., and Murray, T. L. (2005). An Assessment of Volcanic Threat and Monitoring Capabilities in the United States; Framework for a National Volcano Early Warning System, U.S. Geological Survey Open-File Report 2005-1164. Washington, DC: U.S. Government Printing Office, 62.
Ewert, J. W., Lockhart, A. B., Marcial, S., and Ambubuyog, G. (1996). “Ground deformation prior to the 1991 eruptions of Mount Pinatubo,” in Fire and Mud; Eruptions and Lahars of Mount Pinatubo, Philippines, eds C. G. Newhall and R. Punongbayan (Seattle: University of Washington Press), 329–338.
Gaunt, E., Sammonds, P., Meredith, P., Smith, R., and Pallister, J. (2014). Pathways for degassing during the lava dome eruption of Mount St. Helens 2004–2008. Geology 42, 947–950. doi: 10.1130/G35940.1
Gerlach, T. M., McGee, K. A., and Doukas, M. P. (2008). “Emission rates of CO2, SO2, and H2S, scrubbing, and preeruption excess volatiles at Mount St. Helens, 2004–2005,” in A Volcano Rekindled in The Renewed Eruption of Mount St. Helens, 2004–2006, U.S. Geological Survey Professional Paper 1750, Chap. 26, eds D. R. Sherrod, W. E. Scott, and P. H. Stauffer (Washington, DC: U.S. Government Printing Office), 543–571. Available at: https://pubs.usgs.gov/pp/1750/chapters/pp2008-1750_chapter26.pdf
Grapenthin, R., Freymueller, J. T., and Kaufman, A. M. (2013). Geodetic observations during the 2009 eruption of Redoubt Volcano, Alaska. J. Volcanol. Geotherm. Res. 259, 115–132. doi: 10.1016/j.jvolgeores.2012.04.021
Hoblitt, R. P., and Harmon, R. S. (1993). Bimodal density distribution of cryptodome dacite from the 1980 eruption of Mount St. Helens, Washington. Bull. Volc. 55, 421–437.
Hoblitt, R. P. Crandell, D. R., and Mullineaux, D. R. (1980). Mount St. Helens eruptive behavior during the past 1,500 years. Geology 8, 555–559. doi: 10.1130/0091-7613 (1980)8<555:MSHEBD>2.0.CO;2
Hoblitt, R. P., Miller, C. D., and Vallance, J. W. (1981). “Origin and stratigraphy of the deposit produced by the May 18 directed blast,” in The 1980 Eruptions of Mount St. Helens, Washington, U.S. Geological Survey Professional Paper 1250, eds P. W. Lipman and D. R. Mullineaux (Washington, DC: U.S. Government Printing Office), 401–419.
Inguaggiato, S., Diliberto, I. S., Federico, C., Paonita, A., and Vita, F. (2018). Review of the evolution of geochemical monitoring, networks and methodologies applied to the volcanoes of the Aeolian Arc (Italy). Earth Sci. Rev. 176, 241–276. doi: 10.1016/j.earscirev.2017.09.006
Jordan, R., and Kieffer, H. H. (1981). “Topographic changes at Mount St. Helens: large-scale photogrammetry and digital terrain models,” in The 1980 Eruptions of Mount St. Helens, Washington, U.S. Geological Survey Professional Paper 1250, eds P. W. Lipman and D. R. Mullineaux (Washington, DC: U.S. Government Printing Office), 135–141.
Kiser, E., Levander, A., Zelt, C., Schmandt, B., and Hansen, S. (2018). Focusing of melt near the top of the Mount St. Helens (USA) magma reservoir and its relationship to major volcanic eruptions. Geology 46, 775–778. doi: 10.1130/G45140.1
Kiser, E., Palomeras, I., Levander, A., Zelt, C., Harder, S., Schmandt, B., et al. (2016). Magma reservoirs from the upper crust to the Moho inferred from high-resolution Vp and Vs models beneath Mount St. Helens, Washington State, USA. Geology 44, 411–414. doi: 10.1130/G37591.1
Kushendratno., Pallister, J. S., Kristianto, Bina, F. R., McCausland, W., Carn, S., Haerani, N., et al. (2012). Recent explosive eruptions and volcano hazards at Soputan volcano—a basalt stratovolcano in north Sulawesi, Indonesia. Bull. Volc. 74, 1581–1609. doi: 10.1007/s00445-012-0620-2
LaHusen, R.G., Swinford, K.J., Logan, M., and Lisowski, M. (2008). Instrumentation in remote and dangerous settings; examples using data from GPS “spider” deployments during the 2004–2005 eruption of Mount St. Helens, Washington,” A Volcano Rekindled; The Renewed Eruption of Mount St. Helens, 2004–2006, U.S. Geological Survey Professional Paper 1750, Chap. 16, edS D. R. Sherrod, W. E. Scott, and P. H. Stauffer (Washington, DC: U.S. Government Printing Office), 335–345. Available at: https://pubs.usgs.gov/pp/1750/chapters/pp2008-1750_chapter16.pdf
Larsen, J.F., Nye, C.J., Coombs, M.L., Tilman, M., Izbekov, P., and Cameron, C. (2010). “Petrology and geochemistry of the 2006 eruption of Augustine Volcano,” in The 2006 Eruption of Augustine Volcano, Alaska, U.S. Geological Survey Professional Paper 1769, Chap. 15, eds J. A. Power, M. L. Coombs, and J.T. Freymueller (Washington, DC: U.S. Government Printing Office), 335–382. Available at: https://pubs.usgs.gov/pp/1769/chapters/p1769_chapter15.pdf
Lee, C.-W., Lu, Z., Jung, H.-S., Won, J.-S., and Dzurisin, D. (2010). “Surface deformation of Augustine Volcano, 1992–2005, from multiple-interferogram processing using a refined small baseline subset (SBAS) interferometric synthetic aperture radar (InSAR) approach,” in The 2006 Eruption of Augustine Volcano, Alaska, U.S. Geological Survey Professional Paper 1769, Chap. 18, eds J. A. Power, M. L. Coombs, and J. T. Freymueller (Washington, DC: U.S. Government Printing Office), 453–465. Available at: https://pubs.usgs.gov/pp/1769/chapters/p1769_chapter18.pdf
Lipman, P. W., Moore, J. G., and Swanson, D. A. (1981). “Bulging of the north flank before the May 18 eruption—geodetic data,” in The 1980 Eruptions of Mount St. Helens, Washington, U.S. Geological Survey Professional Paper 1250, eds P. W. Lipman and D. R. Mullineaux (Washington, DC: U.S. Government Printing Office), 143–155.
Lisowski, M., Dzurisin, D., Denlinger, R. P., Iwatsubo, E. Y. (2008). “Analysis of GPS-measured deformation associated with the 2004–2006 dome-building eruption of Mount St. Helens, Washington,” A Volcano Rekindled; The Renewed Eruption of Mount St. Helens, 2004–2006, U.S. Geological Survey Professional Paper 1750, Chap. 15, eds D. R. Sherrod, W. E. Scott, and P. H. Stauffer (Washington, DC: U.S. Government Printing Office), 301–333. Available at: https://pubs.usgs.gov/pp/1750/chapters/pp2008-1750_chapter15.pdf
Lockhart, A. B., Marcial, S., Ambubuyog, G., Laguerta, E. P., and Power, J. A. (1996). “Installation, operation, and technical specifications of the first Mount Pinatubo telemetered seismic network,” in Fire and Mud: Eruptions and Lahars of Mt. Pinatubo, Philippines, eds C. G. Newhall and R. S. Punongbayan (Quezon City: Philippine Institute of Volcanology and Seismology; Seattle: University of Washington Press), 215–223.
Malone, S. D., Endo, E. T., Weaver, C. S., and Ramey, J. W. (1981). “Seismic monitoring for eruption prediction,” in The 1980 Eruptions of Mount St. Helens, Washington, U.S. Geological Survey Professional Paper 1250, eds P. W. Lipman and D. R. Mullineaux (Washington, DC: U.S. Government Printing Office), 803–813.
Mastin, L. G. (1994). Explosive tephra emissions at Mount St. Helens, 1989–1991: the violent escape of magmatic gas following storms? Geol. Soc. Am. Bull. 106, 175–185. doi: 10.1130/0016-7606 (1994)106<0175:ETEAMS>2.3.CO;2
Mastin, L. G., Roeloffs, E., Beeler, N. M., and Quick, J. E. (2008). “Constraints on the size, overpressure, and volatile content of the Mount St. Helens magma system from geodetic and dome-growth measurements during the 2004–2006+ eruption,” in A Volcano Rekindled; The Renewed Eruption of Mount St. Helens, 2004–2006, U.S. Geological Survey Professional Paper 1750, Chap. 22, eds D. R. Sherrod, W. E. Scott, and P. H. Stauffer (Washington, DC: U.S. Government Printing Office), 461–488. Available at: https://pubs.usgs.gov/pp/1750/chapters/pp2008-1750_chapter22.pdf
McCausland, W. A. Gunawan, H., White, R. A., Indrastuti, N., Patria, C., Suparman, Y., Putra, A., et al. (2017). Using a process-based model of pre-eruptive seismic patterns to forecast evolving eruptive styles at Sinabung Volcano, Indonesia. J. Volcanol. Geotherm. Res. (in press). doi: 10.1016/j.jvolgeores.2017.04.004
Miller, T. P. (1994). “Dome growth and destruction during the 1989–1990 eruption of Redoubt Volcano,” in The 1989–1990 eruptions of Redoubt Volcano, Alaska, eds T. P. Miller and B. A. Chouet. J. Volcanol. Geotherm. Res. 62, 197–212. doi: 10.1016/0377-0273(94)90034-5
Miller, T. P., and Chouet, B. A. (1994). The 1989–1990 eruptions of Redoubt Volcano; an introduction, in The 1989–1990 eruptions of Redoubt Volcano, Alaska, ed. T. P. Miller and B. A. Chouet. J. Volcanol. Geotherm. Res. 62, 1–10. doi: 10.1016/0377-0273(94)90025-6
Moore, J. G., and Albee, W. C. (1981). “Topographic and structural changes, March–July 1980—photogrammetric data,” in The 1980 Eruptions of Mount St. Helens, Washington, U.S. Geological Survey Professional Paper 1250, eds P. W. Lipman and D. R. Mullineaux (Washington, DC: U.S. Government Printing Office), 123–134.
Moore, J. G., and Sisson, T. W. (1981). “Deposits and effects of the May 18 pyroclastic surge,” in The 1980 Eruptions of Mount St. Helens, Washington, U.S. Geological Survey Professional Paper 1250, eds P. W. Lipman and D. R. Mullineaux (Washington, DC: U.S. Government Printing Office),421–438.
Moran, S. C. (1994). Seismicity at Mount St. Helens, 1987-1992: evidence for repressurization of an active magmatic system. J. Geophys. Res. 99, 4341–4354. doi: 10.1029/93JB02993
Moran, S. C., and Lisowski, M. (2014). Evidence for ongoing magma recharge at Mount St. Helens, Washington (abstract). Seismol. Res. Lett.85:525.
Moran S. C., Malone, S. D., Qamar, A. I., Thelen, W. A., Wright, A. K., and Caplan-Auerbach, J. (2008a). “Seismicity associated with renewed dome building at Mount St. Helens, 2004–2005,” in A Volcano Rekindled; The Renewed Eruption of Mount St. Helens, 2004–2006, U.S. Geological Survey Professional Paper 1750, Chap. 2, eds D. R. Sherrod, W. E. Scott, and P. H. Stauffer (Washington, DC: U.S. Government Printing Office), 27–54. Available at: https://pubs.usgs.gov/pp/1750/chapters/pp2008-1750_chapter02.pdf
Moran, S. C., Freymueller, J. T., LaHusen, R. G., McGee, K. A., Poland, M. P., Power, J. A., et al. (2008b). Instrumentation recommendations for volcano monitoring at U.S. volcanoes under the National Volcano Early Warning System, U.S. Geological Survey Scientific Investigations Report 2008–5114, 47.
Mori, J., Eberhart-Phillips, D., and Harlow, D.H. (1996). “Three-dimensional velocity structure at Mount Pinatubo: resolving magma bodies and earthquake hypocenters,” in Fire and Mud; Eruptions and Lahars of Mount Pinatubo, Philippines, eds C. G. Newhall and R. Punongbayan (Seattle: University of Washington Press), 371–382.
Mullineaux, D. R. (1996). Pre-1980 Tephra-fall Deposits Erupted from Mount St. Helens, Washington. U.S. Geological Survey Professional Paper 1563,99.
Mullineaux, D. R., and Crandell, D. R. (1981). “The eruptive history of Mount St. Helens,” in The 1980 Eruptions of Mount St. Helens, Washington, U.S. Geological Survey Professional Paper 1250, eds P. W. Lipman and D. R. Mullineaux, 3–15.
Musumeci, C., Gresta, S., and Malone, S. D. (2002). Magma system recharge of Mount St. Helens from precise relative hypocenter location of microearthquakes. J. Geophys. Res. 107, ESE 16-1–ESE 16-9. doi: 10.1029/2001JB000629
Nathenson, M. (2017). Revised tephra volumes for Cascade Range volcanoes. J. Volcanol. Geotherm. Res. 341, 42–52. doi: 10.1016/j.jvolgeores.2017.04.021
Newhall, C. G., and Punongbayan, R. S. (1996). Fire and Mud; Eruptions and Lahars of Mount Pinatubo, Philippines. Seattle: University of Washington Press. Available at: https://pubs.usgs.gov/pinatubo/
Nichols, M. L., Malone, S. D., Moran, S. C., Thelen, W. A., and Vidale, J. E. (2011). Deep long-period earthquakes beneath Washington and Oregon volcanoes. J. Volcanol. Geotherm. Res. 200, 116–128. doi: 10.1016/j.jvolgeores.2010.12.005
Nye, C. J., Swanson, S. E., Avery, V. F., and Miller, T. P. (1994). Geochemistry of the 1989–1990 eruption of redoubt volcano: part I, whole-rock major- and trace-element chemistry. J. Volcanol. Geotherm. Res. 62, 429–452. doi: 10.1016/0377-0273(94)90046-9
Pallister, J. S., Hoblitt, R. P., Crandell, D. R., and Mullineaux, D. R. (1992). Mount St. Helens a decade after the 1980 eruptions: magmatic models, chemical cycles, and a revised hazards assessment. Bull. Volc. 54, 126–146. doi: 10.1007/BF00278003
Pallister, J. S., Hoblitt, R. P., Meeker, G. P., Knight, R. J., and Siems, D. F. (1996). “Magma mixing at Mount Pinatubo; petrographic and chemical evidence from the 1991 deposits,” in Fire and Mud; Eruptions and Lahars of Mount Pinatubo, Philippines, eds C. G. Newhall and R. Punongbayan (Seattle: University of Washington Press), 687–732.
Pallister, J. S., Thornber, C. R., Cashman, K. V., Clynne, M. A., Lowers, H. A., Mandeville, C. W., et al. (2008). “Petrology of the 2004–2006 Mount St. Helens lava dome—implications for magmatic plumbing and eruption triggering,” in A Volcano Rekindled; The Renewed Eruption of Mount St. Helens, 2004–2006, U.S. Geological Survey Professional Paper 1750, Chap. 30, eds D. R. Sherrod, W. E. Scott, and P. H. Stauffer (Washington, DC: U.S. Government Printing Office), 647–702. Available at: https://pubs.usgs.gov/pp/1750/chapters/pp2008-1750_chapter30.pdf
Parmigiani, A., Degruyter, W., Leclaire, S., Huber, C., and Bachmann, O. (2017). The mechanics of shallow magma reservoir outgassing. Geochem. Geophys. Geosyst. 18, 2887–2905. doi: 10.1002/2017GC006912
Pauk, B.A., Jackson, M., Feaux, K., Mencin, D., and Bohnenstiehl, K. (2010). “The plate boundary observatory permanent global positioning system network on augustine volcano before and after the 2006 eruption,” in The 2006 Eruption of Augustine Volcano, Alaska, U.S. Geological Survey Professional Paper 1769, Chap. 19, eds J. A. Power, M. L. Coombs, and J. T. Freymueller (Washington, DC: U.S. Government Printing Office), 467–477. Available at: https://pubs.usgs.gov/pp/1769/chapters/p1769_chapter19.pdf
Power, J. A., and Lalla, D. J. (2010). “Seismic observations of Augustine Volcano, 1970–2007,” in The 2006 Eruption of Augustine Volcano, U.S. Geological Survey Professional Paper 1769, eds J. A. Power, M. L. Coombs, and J. T. Freymueller, 3–40.
Power, J. A., Nye, C. J., Coombs, M. L., Wessels, R. L., Cervelli, P. F., Dehn, J., et al. (2006). The reawakening of Alaska’s Augustine Volcano: Eos Trans. Am. Geophys. 87, 373, 377.
Power, J. A., Stihler, S. D., Chouet, B. A., Haney, M. M., and Ketner, D. M. (2013). Seismic observations of Redoubt Volcano, Alaska—1989–2010 and a conceptual model of the Redoubt magmatic system. J. Volcanol. Geotherm. Res. 259, 31–44. doi: 10.1016/j.jvolgeores.2012.09.014
Rutherford, M. J. (1993). Experimental petrology applied to volcanic processes. Eos Trans. Am. Geophys. U. 74, 49, 55. doi: 10.1029/93EO00142
Rutherford, M. J., and Devine, J. D. III, (2008). “Magmatic conditions and processes in the storage zone of the 2004–2006 Mount St. Helens dacite,” in A Volcano Rekindled; The Renewed Eruption of Mount St. Helens, 2004–2006, U.S. Geological Survey Professional Paper 1750, eds D. R. Sherrod, W. E. Scott, and P. H. Stauffer (Washington, DC: U.S. Government Printing Office), 703–725. Available at: https://pubs.usgs.gov/pp/1750/chapters/pp2008-1750_chapter31.pdf
Scandone, R., and Malone, S. D. (1985). Magma supply, magma discharge and readjustment of the feeding system of Mount St. Helens during 1980. J. Volcanol. Geotherm. Res. 23, 239–262. doi: 10.1016/0377-0273(85)90036-8
Segall, P. (2016). Repressurization following eruption from a magma chamber with a viscoelastic aureole. J. Geophys. Res. Solid Earth 121:12, 8501–8522. doi: 10.1002/2016JB013597
Sherrod, D. R., Scott, W. E., and Stauffer, P. H. (eds). (2008). A Volcano Rekindled; The Renewed Eruption of Mount St. Helens, 2004-2006. U.S. Geological Survey Professional Paper 1750, DVD-ROM. Washington, DC: U.S. Government Printing Office, 856. Available at: https://pubs.usgs.gov/pp/1750/
Swanson, D. A., Dzurisin, D., Holcomb, R. T., Iwatsubo, E. Y., Chadwick, W. W. Jr., et al. (1987). “Growth of the lava dome at Mount St. Helens, Washington (USA), 1981–1983,” in Emplacement of Silicic Domes and Lava Flows, Geological Society of America Special Paper 212, ed. J. H. Fink (Boulder, CO: Geological Society of America), 1–16.
Swanson, D. A., and Holcomb, R. T. (1990). “Regularities in growth of the Mount St. Helens dacite dome, 1980-1986,” in Lava Flows and Domes, IAVCEI, Proceedings in Volcanology 2, eds J. H. Fink (Berlin, Heidelberg: Springer),3–24.
Syracuse, E. M., Thurber, C. H., and Power, J. A. (2011). The Augustine magmatic system as revealed by seismic tomography and relocated earthquake hypocenters from 1994 through 2009. J. Geophys. Res. Solid Earth 116:11. doi: 10.1029/2010JB008129
Tait, S., Jaupart, C., and Vergniolle, S. (1989). Pressure, gas content and eruption periodicity of a shallow, crystallising magma chamber. Earth Planet. Sci. Lett. 92, 107–123. doi: 10.1016/0012-821X(89)90025-3
Thornber, C., Pallister, J., Lowers, H., Rowe, M., Mandeville, C., and Meeker, G. (2008). “Chemistry, mineralogy, and petrology of amphibole in Mount St. Helens 2004–2006 dacite,” chapter 32 in A Volcano Rekindled; The Renewed Eruption of Mount St. Helens, 2004–2006, U.S. Geological Survey Professional Paper 1750, eds D. R. Sherrod, W. E. Scott, and P. H. Stauffer, 727–754. Available at: https://pubs.usgs.gov/pp/1750/chapters/pp2008-1750_chapter32.pdf
Till, A. B., Yount, M. E., and Bevier, M. L. (1994). The geologic history of Redoubt Volcano, Alaska. J. Volcanol. Geotherm. Res. 62, 11–30. doi: 10.1016/0377-0273(94)90026-4
Tilling, R. I. (2008). The critical role of volcano monitoring in risk reduction. Advances in Geophysics 14, 3–11. doi: 10.5194/adgeo-14-3-2008
Tilling, R. I., Topinka, L. J., and Swanson, D. A. (1990). Eruptions of Mount St. Helens: Past, Present, and Future, U.S. Geological Survey, Special Interest Publication. Available at: http://pubs.er.usgs.gov/publication/7000008.retrieved 02 August 2018.
Vallance, J. W., Schneider, D. J., and Schilling, S. P. (2008). “Growth of the 2004–2006 lava-dome complex at Mount St. Helens, Washington,” chapter 9 in A Volcano Rekindled; The Renewed Eruption of Mount St. Helens, 2004–2006, eds D. R. Sherrod, W. E. Scott, and P. H. Stauffer, U.S. Geological Survey Professional Paper 1750, 169–208. Available at: https://pubs.usgs.gov/pp/1750/chapters/pp2008-1750_chapter09.pdf
Voight, B., Glicken, H., Janda, R. J., and Douglass, P. M. (1981). “Catastrophic rockslide avalanche of May 18,” in The 1980 Eruptions of Mount St. Helens, Washington, U.S. Geological Survey Professional Paper 1250, eds P. W. Lipman and D. R. Mullineaux (Washington, DC: U.S. Government Printing Office) 347–377.
Waite, G. P., and Moran, S. C. (2009). VP structure of mount St. Helens, Washington, USA, imaged with local earthquake tomography. J. Volcanol. Geotherm. Res. 182, 113–122. doi: 10.1016/j.jvolgeores.2009.02.009
Waitt, R. B. Jr., Pierson, T. C., Macleod, N. S., Janda, R. J., Voight, B., et al. (1983). Eruption-triggered avalanche, flood, and lahar at Mount St. Helens—effects of winter snowpack. Science 221, 1394–1397. doi: 10.1126/science.221.4618.1394
Weaver, C. S., Zollweg, J. E., and Malone, S. D. (1983). Deep earthquakes beneath Mount St. Helens: evidence for magmatic gas transport. Science 221, 1391–1394. doi: 10.1126/science.221.4618.1391
Weaver, C. S., Grant, W. G., Malone, S. D., and Endo, E. T. (1981). “Post-May 18 seismicity; volcanic and tectonic implications,” in The 1980 Eruptions of Mount St. Helens, Washington, U.S. Geological Survey Professional Paper 1250, eds P. W. Lipman and D. R. Mullineaux, 109–121.
Werner, C., Kelly, P. J., Doukas, M., Lopez, T., Pfeffer, M., McGimsey, R., et al. (2013). Degassing of CO2, SO2, and H2S associated with the 2009 eruption of Redoubt Volcano, Alaska. J. Volcanol. Geotherm. Res. 259, 270–284. doi: 10.1016/j.jvolgeores.2012.04.012
White, R. A., and McCausland, W. A. (2018). A process-based model of pre-eruption seismicity patterns and its use for eruption forecasting at dormant stratovolcanoes. J. Volcanol. Geotherm. Res.
White, R. A. (1996). “Precursory deep long-period earthquakes at Mount Pinatubo; spatio-temporal link to basalt trigger,” in Fire and Mud; Eruptions and Lahars of Mount Pinatubo, Philippines, eds C. G. Newhall and R. Punongbayan (Seattle: University of Washington Press), 307–328.
Wong,Y-Q., Segall, P., Bradley, A., and Anderson, K. R. (2017). Constraining the magmatic system at Mount St. Helens (2004–2008) using Bayesian inversion with physics-based models including gas escape and crystallization. J. Geophys. Res. Solid Earth 122, 7789–7812. doi: 10.1002/2017JB014343
Keywords: Mount St. Helens, eruption forecasting, volcano monitoring, second boiling, magma reservoir, Pinatubo, Redoubt, Augustine
Citation: Dzurisin D (2018) Mount St. Helens Retrospective: Lessons Learned Since 1980 and Remaining Challenges. Front. Earth Sci. 6:142. doi: 10.3389/feart.2018.00142
Received: 01 May 2018; Accepted: 10 September 2018;
Published: 05 October 2018.
Edited by:
Nicolas Fournier, GNS Science, New ZealandReviewed by:
Olivier Bachmann, ETH Zürich, SwitzerlandRaffaello Cioni, Università degli Studi di Firenze, Italy
This work is authored by Daniel Dzurisin on behalf of the U.S. Government and, as regards Dr. Dzurisin and the U.S. Government, is not subject to copyright protection in the United States. Foreign and other copyrights may apply. This is an open-access article distributed under the terms of the Creative Commons Attribution License (CC BY). The use, distribution or reproduction in other forums is permitted, provided the original author(s) and the copyright owner(s) are credited and that the original publication in this journal is cited, in accordance with accepted academic practice. No use, distribution or reproduction is permitted which does not comply with these terms.
*Correspondence: Daniel Dzurisin, ZHp1cmlzaW5AdXNncy5nb3Y=