 Gaetana Ganci
 Annalisa Cappello
 Giuseppe Bilotta
 Alexis Herault1,2
 Vito Zago
 Ciro Del Negro
- 1Istituto Nazionale di Geofisica e Vulcanologia, Osservatorio Etneo, Catania, Italy
- 2Conservatoire National des Arts et Métiers, Paris, France
- 3Dipartimento di Ingegneria Elettrica Elettronica e Informatica, Università di Catania, Catania, Italy
Estimates of lava volumes provide important data on the lava flooding history and evolution of a volcano. For mapping volcanic deposits, including lava flows, the advancement of satellite remote sensing techniques offers a great potential. Here we characterize the eruptive events occurred at Mt Etna between January 2011 and December 2015 leading to the emplacement of numerous lava flows and to the formation of a new pyroclastic cone (NSEC) on the eastern flank of the South East Crater. The HOTSAT system is used to analyze remote sensing data acquired by the SEVIRI sensor in order to detect the thermal anomalies from active lava flows and calculate the associated radiative power. The time-series analysis of SEVIRI data provides an estimation of event magnitude and intensity of the effusive material erupted during each event. The cumulative volume estimated from SEVIRI images from 2011 to 2015 adds up to ~106 millions of cubic meters of lava, with a time-averaged rate of ~0.68 m3 s−1. This estimate is independently supported and bounded using a topographic approach, i.e., by subtracting the last topography of Etna updated to 2005 from a 2015 digital elevation model (DEM), produced using tri-stereo Pléiades satellite images acquired on December 18, 2015. The total volume of products erupted from 2005 to 2015, calculated from topography difference by integration of the thickness distribution over the area covered, is about 287 × 106 m3, of which ~55 × 106 m3 is the volume of the NSEC cone. This 10-year volume is below the typical erupted volumes on decadal scale at Mt Etna, interrupting its stable and resilient output trend.
Introduction
Mapping the volcanic deposits constitute a critical component for constraining magma supply, understanding magma plumbing system, and controlling lava flow morphological parameters, and represents an important indication of the amount of magma the volcanic system is capable of transporting during an eruptive event (Wadge et al., 1975; Stevens et al., 1999). In particular quantifying the emitted lava volumes gives insights into emplacement processes and may aid computer simulations of lava flow paths for hazard assessment studies, providing both input data for predictive lava flow modeling, and tools for iterative validation and/or refining of parameters (Del Negro et al., 2013; Cappello et al., 2016). However, the calculation of the amounts of lava erupted is still source of uncertainty, and problems occur when comparing volume values that are measured using different approaches (Harris et al., 2007).
Generally, volcanic products can be mapped following two different approaches. The simplest method is based on field measurements by multiplying the covered area, which can be determined with a good precision, by an estimated average thickness that remains the major source of uncertainty (Behncke et al., 2014). The second approach requires accurate mapping of the pre and post-eruption Digital Elevation Models (DEMs). This topographic approach is advantageous because deposit thickness is mapped throughout the flow field, resulting in detailed three-dimensional measurements of the morphology and yielding a highly accurate volume estimate. The method is limited by the availability of topographic data of the surface underneath the volcanic deposit of interest, and such measurements are difficult, if not impossible, to be made retrospectively (Del Negro et al., 2016).
The recent availability of satellite images gives new opportunities for mapping volcanic products. Indeed high spatial resolution data acquired in stereo or tri-stereo configuration (e.g., Pléiades) can be used to frequently update the topography in volcanic areas and thus provides a new tool for measuring volcanic deposits by differencing successive topographies. In addition, high temporal resolution data provided by geostationary infrared remote sensing (e.g., SEVIRI) allow to estimate mean eruptive rates associated to the lava flow and to compute the related volumes.
Here we employed both Pléiades data to map the eruptive products and SEVIRI data to characterize the eruptive episodes occurred at Mt Etna between January 11th, 2011 and December 8th, 2015.
Mt Etna is one of the most active volcanoes in the world, showing a persistent activity at the summit craters and frequent effusive eruptions from eruptive vents located on the volcano flanks (Cappello et al., 2013). Today five craters are active on the summit of Mt Etna (Neri et al., 2017): the North-East Crater (NEC), the Voragine (VOR), the Bocca Nuova (BN), the South-East Crater (SEC), and the New South-East Crater (NSEC). NEC, VOR, and BN formed inside the old Central Crater in 1911, 1945 and 1968, respectively. SEC, which has been the most active summit crater over recent decades, was built up during the 1971 eruption. Finally, the NSEC has formed in 2007 as a pit crater at the South-east base of the SEC (Acocella et al., 2016), but rapidly grew during the lava fountains occurred since January 2011 (Vicari et al., 2011). After the last flank eruption in 2008–2009 (Ganci et al., 2012b), the volcanic activity of Etna has shown a more explosive behavior, with an increasing number of paroxysmal events at the summit craters (Bonaccorso and Calvari, 2013; Cappello et al., 2013). Indeed, from 2011 to 2015, the SEC area has been the source of 53 eruptive episodes, most of them characterized by the emission of lava fountains, pyroclastic material, and short-lasting lava flows that mostly spread within the Valle del Bove (VdB).
In the following we estimated the effusion rate and hence the lava flow volume from SEVIRI data and computed some morphometric parameters (area, maximum length, thickness, and volume) from the three-dimensional distribution of the volcanic deposits obtained by DEM difference using a new 2015 digital topography of Mt Etna derived from Pléiades data. The volcanic deposits obtained from DEM difference provide an independent maximum bound to the SEVIRI-derived lava flow volume and possibly an estimate of loose materials.
Materials and Methods
Thermal-Infrared Satellite Data Sources and Analyses
Volcanic hotspots (i.e., high temperature areas or pixels) were detected and processed from SEVIRI images (sample time: 15 min, pixel resolution: 3 km at nadir) using the HOTSAT system for thermal monitoring of volcanoes (Ganci et al., 2011a,b). HOTSAT takes as input mid-infrared (MIR) and thermal infrared (TIR) channels acquired by the Spinning Enhanced Visible and Infrared Imager (SEVIRI), and provides cloud mask and thermal anomalies maps (if applicable). Since clouds can obscure thermal anomalies, we used an algorithm based on textons (Ganci et al., 2011a) to avoid underestimations in satellite-derived results. The detection of thermal anomalies associated to active lava flows is based on a contextual algorithm (Harris et al., 1995), which compares the “volcanic” area (where the thermal anomaly is expected) with a “non-volcanic” area (close to the volcano, where the thermal anomaly is not foreseen). The lava thermal flux is computed considering all those pixels classified as “hot” by using the mid-infrared radiance approach introduced by Wooster et al. (2003), which allows estimating the radiant heat flux radiated by a sub-portion of the thermally anomalous pixels approximating the Planck's radiation law to a fourth order power law. This approach is particularly efficient with low spatial resolution sensors, such as SEVIRI, or moderate spatial resolution sensors such as Moderate Resolution Imaging Spectroradiometer (MODIS), given that the extent of lava flow fields is often subpixel in size (Ganci et al., 2013). During an eruption, the system computes an estimation of the thermal flux radiated by lava for each image, giving as result a heat flux curve describing the event. This heat flux curve can be converted in time-averaged discharge rate (TADR in m3/s—the effusion rate averaged over a specified period) adopting a straightforward relationship between the radiant heat loss from an active lava flow and the effusion rate (e.g., Harris et al., 1997; Wright et al., 2001):
where Q is the total radiant heat loss obtained summing up the radiant heat flux computed for each hot spot pixel, ρ is the lava density, Cp is the specific heat capacity, ΔT is the eruption temperature minus temperature at which flow stops, CL is the latent heat of crystallization, and Δφ is the volume percent of crystals that form while cooling through ΔT. HOTSAT computes a minimum and maximum estimates for TADR by considering the respectively largest and smallest values that each lava parameter can take, resulting in a volume variation of ±25% (Ganci et al., 2016).
During short-lived paroxysmal events the volcanic hotspot is often affected by the tephra/ash column accompanying the climax, which can attenuate or obscure the thermal anomaly; vice-versa, when not obscured, due to the huge radiated power released, it can easily saturate the sensor. As a consequence, the TADR cannot always be calculated during the peak fountaining phase. Moreover conversion between radiant heat flux and TADR is possible only if a thermal steady state is reached (Garel et al., 2012) and this is not true for very short and transient events, like lava fountains at Mt Etna. A way to provide an estimation of the event magnitude, i.e., mass in kg or volume in m3, and intensity, i.e., mean output rate (MOR) in kg/s or m3/s, has been introduced by Ganci et al. (2012a) by modeling the plume- and saturation-free cooling curve apparent in the heat flux time series. In fact during short-lived eruptive events, the SEVIRI-derived heat flux curve is characterized by three phases: a slight increase in the heat fluxes (first phase), a rapid increase to higher heat fluxes during the main fountaining activity, often marked by a trough and/or scattered behavior, due to plume obscuration (second phase); a waning flux during the cooling of the emplaced lava (third phase). In this case, volumes are inferred by minimizing the difference between the modeled and the SEVIRI-derived cooling curve. By considering the R-squared index, we computed the uncertainties on the estimated volumes ranging within ±20% (Ganci et al., 2012a).
Here we applied the technique of Ganci et al. (2012a) to catalogue the short lived events occurred during the 2011–2013 period, for which the duration of the three phases is <2 days (Figure 1). For the longest effusive events occurred during 2014–2015 (Figure 2), we used the standard HOTSAT approach (Ganci et al., 2011b), and computed the total lava volumes by integrating the TADR curves. In this way we obtained the cumulated volume of lava emitted from 2011 to 2015.
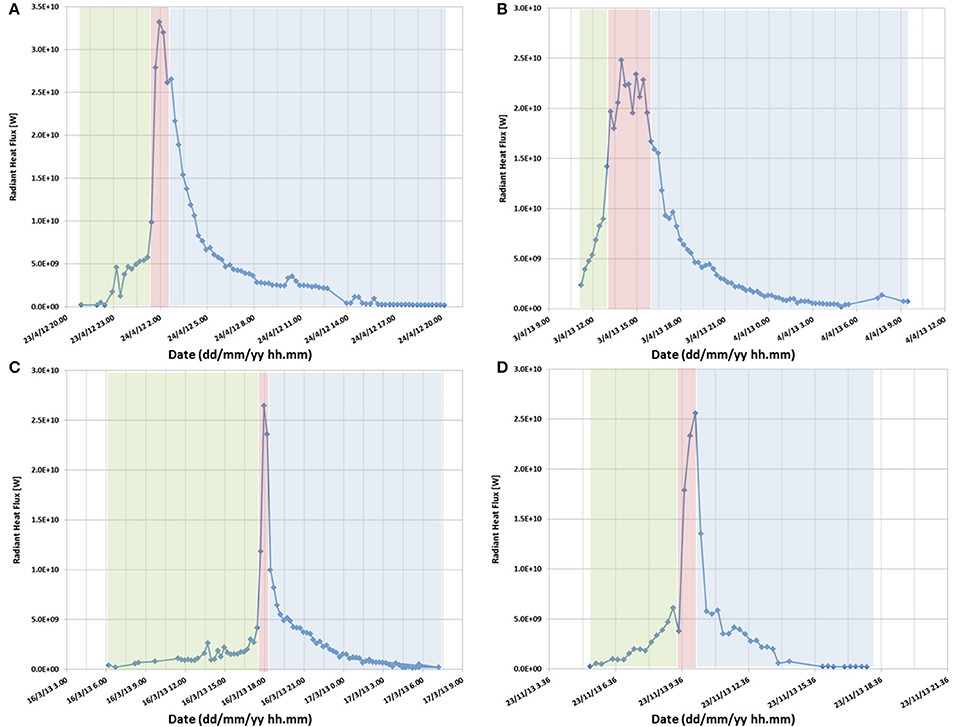
Figure 1. SEVIRI-derived radiant heat flux computed during the 24 April 2012 (A) and 3 April 2013 (B) Etna lava fountains, characterized by the three phases of slow increasing heat flux (green box), main fountaining activity (red box) and cooling (blue box). More peaked radiant heat flux curves computed on 16 March 2013 (C) and 23 November 2013 (D), characterized by a very rapid cooling possibly related to the cooling of pyroclastic material rather than lava.
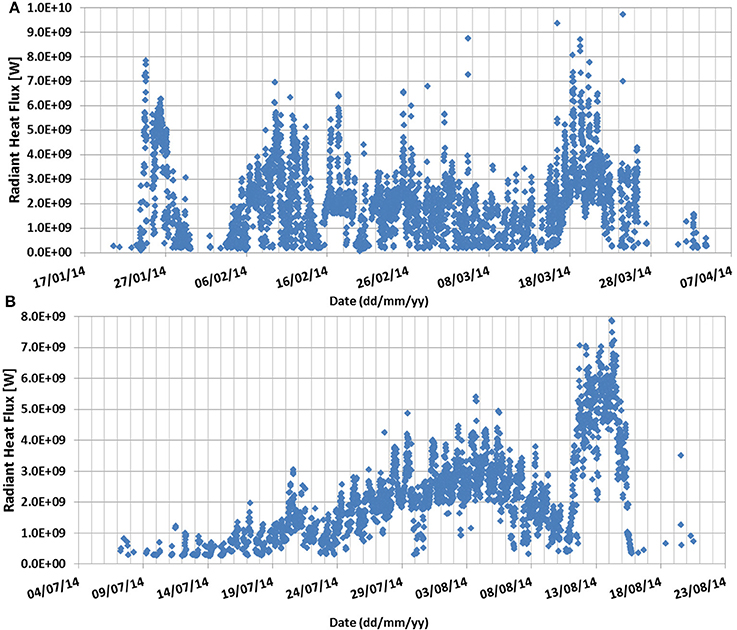
Figure 2. Radiant heat flux curves computed from SEVIRI data for the two long effusive events occurred between 22 January and 7 April 2014 (A) and from 7 July to 20 August 2014 (B).
Mapping of Lava Flows and Pyroclastic Deposits
To complement the SEVIRI-derived results, we analyzed the distribution of the 2011–2015 eruptive products thanks to the availability of pre-eruptive and post-eruptive DEMs of Etna volcano. For the pre-eruptive base, we used the last topography of Etna covering the whole deposits of the 2011–2015 eruptions, which goes back to 2005 (Gwinner et al., 2006). It is a DEM at 1 m spatial resolution resulted from a digital photogrammetric mapping, applying the airborne HRSC-AX sensor and photogrammetric processing system (Gwinner et al., 2006). After this, only local updates of the summit area have been derived from Light Detection And Ranging (LIDAR), digital photogrammetry and/or terrestrial laser scanning in 2007, 2010, 2012, 2014, and 2015 (Neri et al., 2008, 2017; Caracciolo D'Ajello et al., 2014; De Beni et al., 2015; Behncke et al., 2016). As post-eruptive base, we considered a topography produced using satellite images from the Pléiades constellation acquired on 18 December 2015.
The Pléiades constellation is composed of two optical satellites launched on December 2011 for Pléiades 1A and on December 2012 for Pléiades 1B, which provide images at 50 cm spatial resolution in stereo and tri-stereo mode. The 3D processing of the tri-stereo Pléiades 1A imagery was performed using the free and open source MicMac photogrammetric library (Rupnik et al., 2017; http://micmac.ensg.eu) developed by the French IGN (Institut Géographique National), and took advantage of field Ground Control Points (GCPs) placed on Mt Etna. MicMac is based on the principles of photogrammetry and consists of three main steps:
• Tie points recognition and matching between images;
• Calibration and orientation, recognizing relationships between viewpoints and objects;
• Correlation, producing dense matching for 3D scene reconstruction.
The best result obtained with the Pléiades images of 18 December 2015 is a 4-meter resolution DEM spanning an area of about 16 × 15 km, which covers the summit craters and a portion of the south-east flank of the volcano, including the upper part of the Valle del Bove (Figure 3). According to our 2015 DEM, the highest point of 3,367 m is on the south-west rim of the NEC, while the SEC and NSEC reach an elevation of 3,336 and 3,325 m, respectively. By subtracting the 2005 DEM from the 2015 one, we obtained the topographic changes due to the volcanic deposits emplaced during the eruptive activity of Etna occurred between 2006 and 2015.
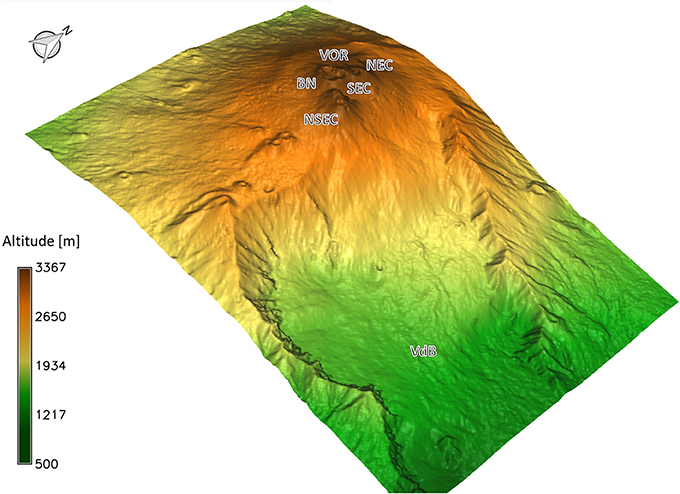
Figure 3. Digital Elevation Model (DEM) of Mount Etna, covering the summit craters and a small portion of the south-east flank of the volcano, obtained by processing tri-stereo Pléiades images acquired on December 18, 2015. NEC, North-East Crater; VOR, Voragine; BN, Bocca Nuova; SEC, South-East Crater; NSEC, New South-East Crater; VdB; Valle del Bove.
Results
Analyzing the thermal activity, we were able to characterize 46 of 53 eruptive events occurred at Etna between 2011 and 2015. Table 1 reports event number (En), date of the first thermal anomaly detected by HOTSAT, duration, maximum value of the radiative power, MOR and lava volume for each event. In spite of the ash interference and/or cloudy conditions that affected 14 events (gray rows in Table 1), volume estimations were computed for 6 of them. Eventually only 7 events were not characterized at all (En: 2, 14, 29, 30, 32, 40, 50), while duration and maximum value of the radiative power were retrieved for the event occurred on 2 December 2013 (En: 44).
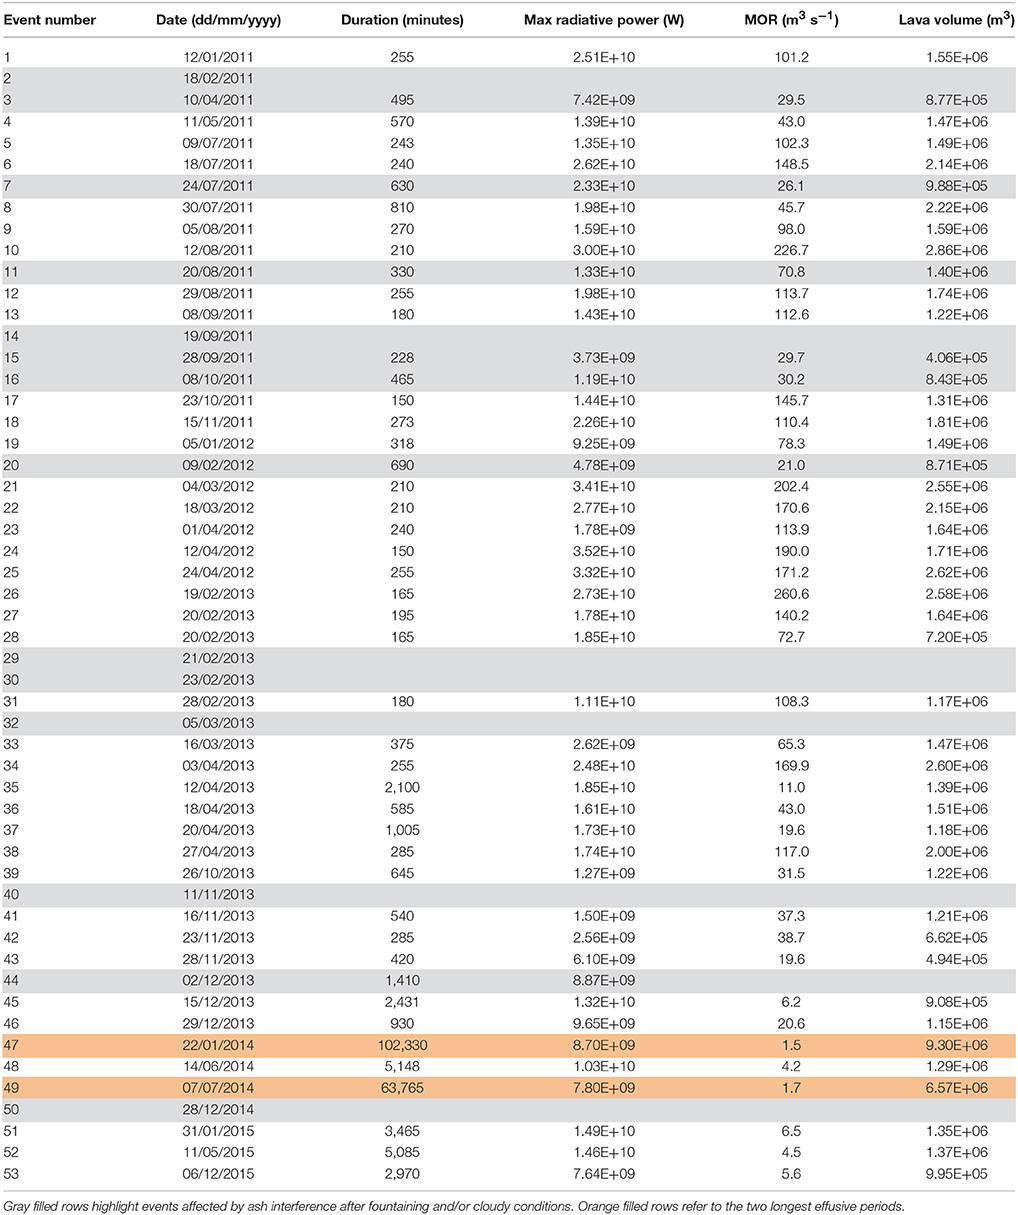
Table 1. Event number (En), date, duration, maximum value of the radiative power, Mean Output Rate (MOR) and lava volume of eruptive events at Mt Etna from January 2011 to December 2015 as retrieved from SEVIRI data.
We observed that 38 of the 39 events detected between 2011 and 2013 follow the typical waveform associated with lava fountains, characterized by three phases (Figures 1A,B). In particular, during 2013 we noticed an increase in explosive behavior visible in the shape of the radiant heat flux curve of some of the events (Figures 1C,D), more peaked with a shorter climax and a very rapid cooling, with a loss of more than 10 GW in 15 min, possibly related to the cooling of pyroclastic material rather than lava. From December 15th, 2013 the general radiative heat flux waveform changes, the duration of the events increases and the cooling phase is not as easy to isolate (Figure 4).
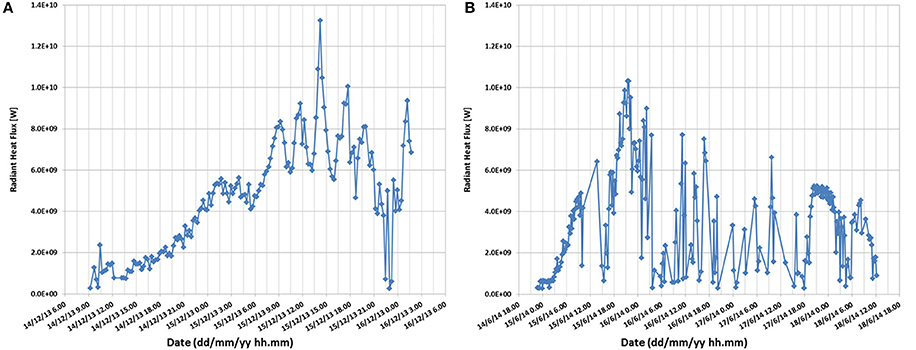
Figure 4. Radiant heat flux curves of the eruptive episodes occurred on 15 December 2013 (A) and 16 June 2014 (B). It is noteworthy the change in the radiant heat flux waveform, characterized by an increase of the event duration and a lack of the cooling phase, possibly related to a Strombolian activity.
Volumes, durations and MOR of the events occurred between 2011 and 2015, excluding the two long-lasting effusive periods of 2014, are reported in Figure 5. Considering only cloud-free events, erupted lava volumes (Figure 5A) vary between a minimum volume of 0.49 × 10⁶ m3 (erupted on 28 November 2013, En: 43) and a maximum of 2.86 × 10⁶ m3 (erupted on 12 August 2011, En: 10). The median and standard deviation are respectively 1.4 × 10⁶ and 0.6 × 10⁶ m3, for a total volume expressed as dense-rock equivalent (DRE) of 64 × 106 m3 erupted during 43 events. Durations range from 2.5 h occurred on 23 October 2011 (En: 17) and 12 April 2012 (En: 24) to 3.5 days occurred on 14 June 2014 (En: 48), while MOR (Figure 5B) varies between 4.2 (on 14 June 2014, En: 48) and 260 m3 s−1 (on 19 February 2013, En: 26). MOR for each event was obtained by dividing the total volume by the event duration, where the latter was computed by analyzing the radiant heat flux curves from the first thermal anomaly to the beginning of the cooling phase. To highlight the presence of trends or patterns characterizing the temporal distribution of eruption intensities, we calculated the moving average of the MOR time series with a window size set to 5 (orange line in Figure 5B).
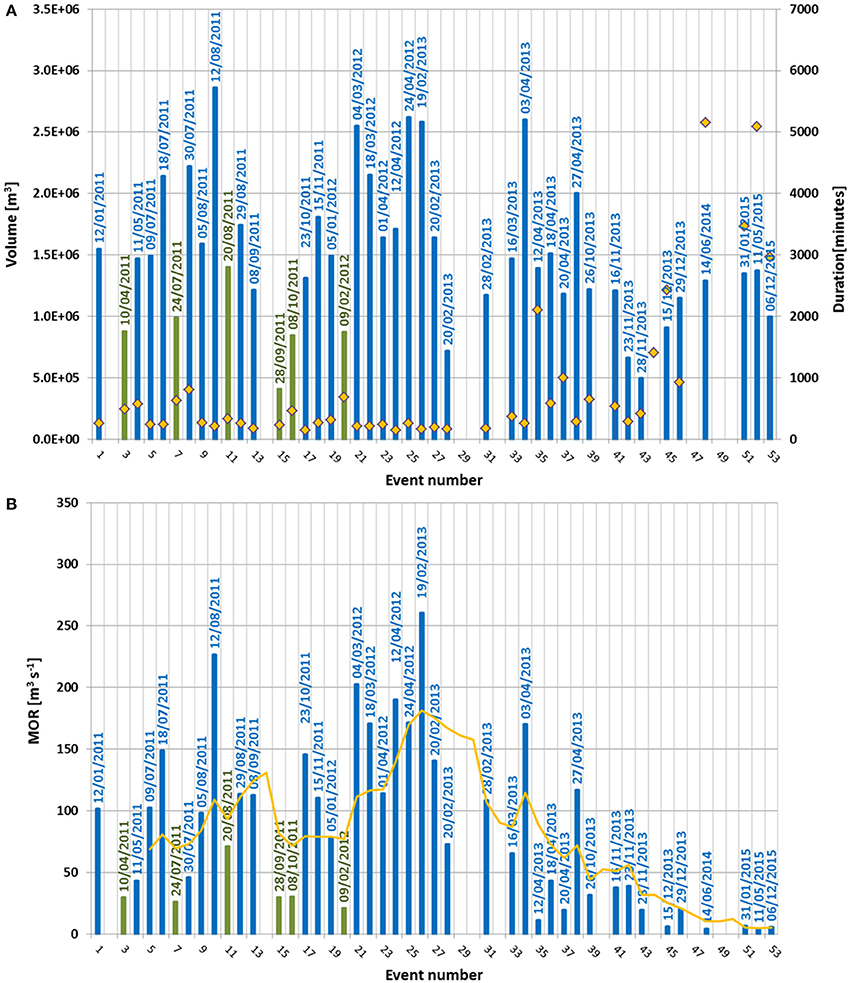
Figure 5. Volumes (blue bars for cloud-free events, green bars for cloud-contaminated events) and durations (orange diamonds) of the events occurred between 2011 and 2015, excluding the two long-lasting effusive periods of 2014 (A). The MOR (blue bars for cloud-free events, green bars for cloud-contaminated events) and 5-period moving average of the MOR time series (orange line) show the temporal non-stationarity of eruption intensity, mainly decreasing from February 2013, and reaching the minimum values since 2014 (B).
In order to compute the total volume, we assumed that the eight missing events (En: 2, 14, 29, 30, 32, 40, 44, 50) had median volumes (1.4 × 10⁶ m3) obtaining an estimate of 75 × 106 m3 over 51 events. Applying a correction of 20% for vesicles (according to Behncke et al., 2014) and including the two effusive periods, the cumulative volume, from January 2011 to December 2015, reaches ~106 ± 22 million of cubic meters (Figure 6). Of these, 50.6 ± 4 million of cubic meters, emitted between May 2012 and October 2014, are well in agreement with the 56.4 million of cubic meters derived from DEM difference (De Beni et al., 2015). Comparing the SEVIRI-derived results with field data (Behncke et al., 2014; De Beni et al., 2015), we found a good fit, generally within the measurement error, with the volume difference ranging from 0.12 × 10⁶ m3 (En: 35) and 1.49 × 10⁶ m3 (En: 36) with an average difference in the volumes of 0.62 × 10⁶ m3.
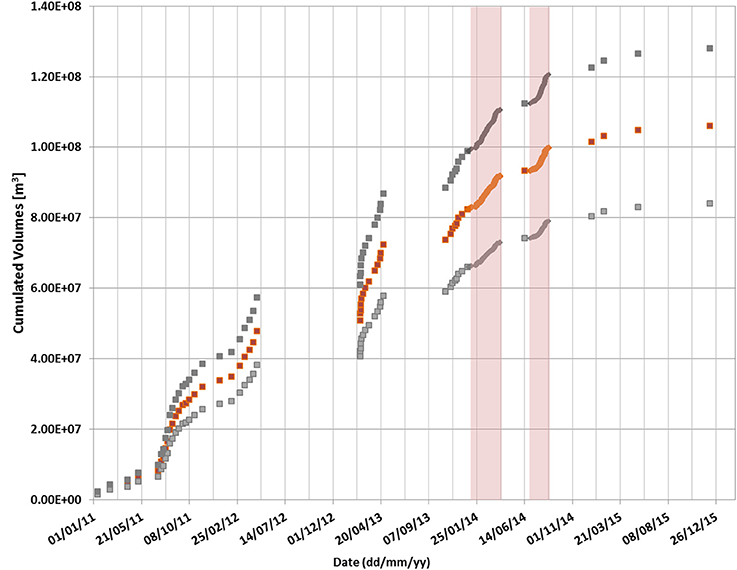
Figure 6. SEVIRI-derived cumulative volume (orange square dots) with the minimum and maximum estimates (gray square dots) computed from January 2011 to December 2015. The red bars highlight the two long-lasting effusive periods of 2014.
We also explored the chance to provide an upper bound to the SEVIRI-derived cumulative volume by using a topographic approach, i.e., by subtracting the 2005 DEM from the 2015 one. In this way we estimated the distribution and volume of volcanic deposits emitted between 2006 and 2015. To minimize the errors introduced by the fact that the two DEMs were derived from different data sources, we first resampled the 2005 DEM to the same spatial resolution of the 2015 DEM (4 m) and improved their coregistration so that the histogram of the elevation differences was centered on zero (Figure 7). Positive values of the bar chart represent the cells where the volcanic deposits emplaced.
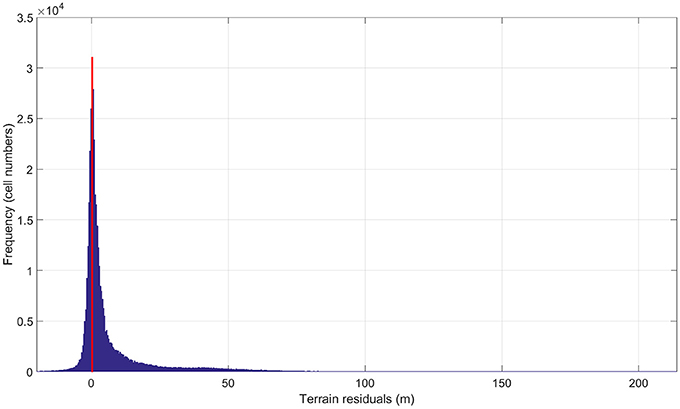
Figure 7. Histogram plot of change in elevation obtained by differencing the 2015 and 2005 DEMs after improvement of the coregistration. The peak centered on zero proves their accurate alignment.
The volcanic deposits emplaced between 2006 and 2015 cover an area of ~12.6 × 10⁶ m2, with a maximum length of ~6.8 km due to the lava flow emplacement of the 2008–2009 flank eruption (Figure 8). The minimum, median, and average thicknesses, computed from DEMs difference, are 1.01, 13.62, and 22.84 m, respectively. The maximum thickness of 214 m is obtained at the NSEC cone.
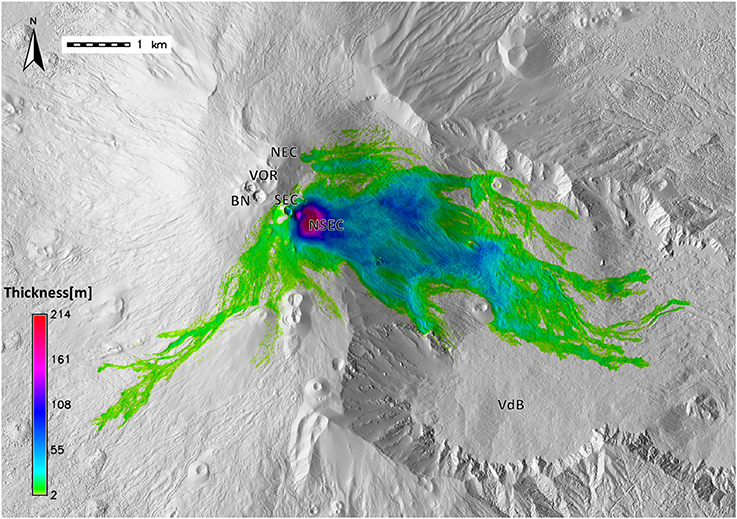
Figure 8. Topographic changes due to the volcanic deposits emplaced during the eruptive activity of Etna occurred between 2006 and 2015. The colors indicate flow thickness. The total area covered is ~12.6 × 10⁶ m2; the maximum thickness of 214 m is obtained in correspondence of the NSEC cone. The base map is the shaded relief of the 2005 DEM. NEC, North-East Crater; VOR, Voragine; BN, Bocca Nuova; SEC, South-East Crater; NSEC, New South-East Crater; VdB, Valle del Bove.
The total volume of products, calculated by integration of the thickness distribution over the area covered, is 287 × 106 m3, with an uncertainty of ~37 × 106 m3, corresponding to 13% of the entire volume. The uncertainty was computed by multiplying the area (~12.6 × 10⁶ m2) by the residual vertical accuracy outside the margins of the deposits, i.e., the standard deviation (~2.95 m) of the height difference between the DEMs in the area not covered by deposits. The NSEC cone covers an area of ~0.53 × 10⁶ m2 with a volume of 55 ± 1.5 × 10⁶ m3.
Discussion and Conclusions
The 5 years spanning from January 2011 to December 2015 at Etna were analyzed through SEVIRI images. Thanks the frequent revisit time, i.e., 15 min, SEVIRI represents the unique space sensor able to detect and characterize the short-lived activity (a few hours for each event) as that occurred at Etna during 2011–2013.
Radiant heat flux curves apparent in SEVIRI images permitted to compute durations, volumes, and intensities, cataloguing almost all the events (46 of 53) and to discriminate among fountaining activity (e.g., Figures 1A,B) with an information about the degree of explosivity (e.g., Figures 1C,D), Strombolian activity (e.g., Figure 4) and long effusive periods (Figure 2). A statistical analysis on SEVIRI-derived results, excluding the two longest effusive events of 2014, shows a Gaussian distribution slightly right skewed of the estimated volumes peaked on 1.4 million of cubic meters (Figure 9A), while the durations follow the typical features of a Pareto distribution with a large portion of events (76%) lasting around 500 min (Figure 9B). Distribution of MOR underlines the temporal non-stationarity of eruption intensity, mainly decreasing from February 2013, and reaching the minimum values since 2014 (Figure 5B). This highlights that eruptive events occurred with a higher intensity in the first period (2011–2012) than in the following 3 years of activity (2013–2015). It should be noted that our analysis does not take into account the eruptive events occurred on 28 December 2014 (because of the presence of a thick layer of clouds that prevented the observation from satellite) and the eruptive activity occurred at the VOR crater on 3–5 December 2015 (Bonaccorso and Calvari, 2017).
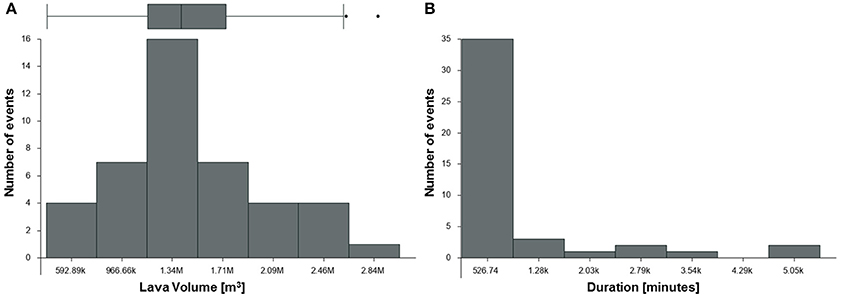
Figure 9. Statistical analysis on SEVIRI-derived results, excluding the two longer effusive events of 2014. The distribution of lava volumes against the number of events is a skewed Gaussian peaked on 1.34 millions of cubic meters, with quartiles 1.15 × 10⁶ m3 (25%), 1.4 × 10⁶ m3 (50%), 1.73 × 10⁶ m3 (75%) and outlier fences at 0.28 × 10⁶ m3 and 2.6 × 10⁶ m3 as illustrated in the box plot (A). The durations follow a Pareto distribution with 76% of events lasting around 500 min (B).
By differencing the 2005 and 2015 DEMs and excluding the volume of the NSEC cone, we obtained a 10-year volume of ~232 × 106 m3, which is below the recent erupted volumes on decadal scale at Mt Etna (~300 × 106 m3 from Harris et al., 2011), interrupting its stable and resilient output trend. By further subtracting published products retrieved from LIDAR analysis in 2007 and 2010 (Neri et al., 2008; Behncke et al., 2016), we found ~131 million of cubic meters of eruptive products emitted since 2011, which is still about ~25 × 106 m3 higher than the volumes derived by SEVIRI. This difference, ranging between 10 and 30% of the total volume, is most likely due to loose materials as the pyroclastic fallout deposits in the same area where the lavas were emplaced and/or to the presence of tephra-covered snow.
Our study revealed a decreasing trend in eruption intensity (according to the volume of erupted products) beginning from 2013 and reaching lower values (around 5 m3 s−1) in 2014 and 2015. This trend was confirmed also in the growth of the NSEC cone that gained only 5 million of cubic meters from December 2014 to December 2015, against 50 × 106 m3 observed from January 2011 to October 2014 (De Beni et al., 2015). In particular, the plot of cumulative volume (Figure 6) allows us to identify five different phases in the observed period: (i) an initial phase, from 12 January to 9 July 2011, with a low TADR (0.41 ± 0.08 m3 s−1); (ii) a growth phase, from 18 July 2011 to 24 April 2012, with a TADR of 1.53 ± 0.31 m3 s−1; (iii) a peak phase, from 19 February 2013 to 27 April 2013, with a TADR of 3.68 ± 0.74 m3 s−1; (iv) a waning phase, from 26 October 2013 to 7 July 2014, with a TADR of 1.00 ± 0.20 m3 s−1; (v) a final phase, from 28 December 2014 to 8 December 2015, with an extremely low TADR (0.15 ± 0.03 m3 s−1).
In terms of long-term output, we find that 106 ± 22 × 106 m3 of lava was erupted in almost 5 years, which results in a time-averaged rate of 0.68 ± 0.14 m3 s−1. This estimate falls within the range between 0.6 and 0.9 m3 s−1 that characterizes the high eruption rate phase of Etna beginning in 1971 (Harris et al., 2011). However it interrupts the steady state output rate of 0.9 m3 s−1 started in 2000 (Harris et al., 2011; Ganci et al., 2012a).
Author Contributions
GG and AC mainly wrote the manuscript with contributions from all authors. GG processed SEVIRI data and extracted the topography from Pléiades images. AC computed DEM differences and performed statistics on it. GB performed the statistical analysis on SEVIRI-derived results with the contribution of AH and VZ. CD coordinated the research. All authors contributed ideas and input to the research of the paper.
Conflict of Interest Statement
The authors declare that the research was conducted in the absence of any commercial or financial relationships that could be construed as a potential conflict of interest.
Acknowledgments
Thanks are due to the European Organisation for the Exploitation of Meteorological Satellites (EUMETSAT) for Spinning Enhanced Visible and InfraRed Imager (SEVIRI) data (www.eumetsat.int). Pléiades data were available through the Space Volcano Observatory with Pléiades (SVOP) project coordinated by Pierre Briole (http://volcano.iterre.fr/svo_projects). We are grateful to Olivier Galland, Luc Girod and Christopher Nuth for their assistance with the use of the MicMac software. The editor Clive Oppenheimer, the chief editor Valerio Acocella and the three reviewers are acknowledged for their constructive and supportive comments that helped us to improve the manuscript. This work was developed within the framework of TecnoLab, the Laboratory for Technological Advance in Volcano Geophysics of the INGV in Catania (Italy) and was partially supported from the DPC-INGV 2012–2021 Agreement.
References
Acocella, V., Neri, M., Behncke, B., Bonforte, A., Del Negro, C., and Ganci, G. (2016). Why does a mature volcano need new vents? the case of the new southeast crater at etna. Front. Earth Sci. 4:67. doi: 10.3389/feart.2016.00067
Behncke, B. A., Fornaciai, M., Neri, M., Favalli, M., Ganci, G., and Mazzarini, F. (2016). Lidar surveys reveal eruptive volumes and rates at Etna 2007–2010, Geophys. Res. Lett. 43, 4270–4278. doi: 10.1002/2016GL068495
Behncke, B., Branca, S., Corsaro, R. A., De Beni, E., Miraglia, L., and Proietti, C. (2014). The 2011–2012 summit activity of Mount Etna: Birth, growth and products of the new SE crater. J. Volcanol. Geother. Res. 270, 10–21. doi: 10.1016/j.jvolgeores.2013.11.012
Bonaccorso, A., and Calvari, S. (2013). Major effusive eruptions and recent lava fountains: balance between expected and erupted magma volumes at Etna volcano. Geophys. Res. Lett. 40, 6069–6073. doi: 10.1002/2013GL058291
Bonaccorso, A., and Calvari, S. (2017). A new approach to investigate an eruptive paroxysmal sequence using camera and strainmeter networks: lessons from the 3-5 December 2015 activity at Etna volcano. Earth Planet. Sci. Lett. 475, 231–241. doi: 10.1016/j.epsl.2017.07.020
Cappello, A., Bilotta, G., Neri, M., and Del Negro, C. (2013). Probabilistic modelling of future volcanic eruptions at Mount Etna. J. Geophys. Res. Solid Earth 118, 1925–1935. doi: 10.1002/jgrb.50190
Cappello, A., Ganci, G., Calvari, S., Pérez, N. M., Hernández, P. A., Silva, S. V., et al. (2016). Lava flow hazard modeling during the 2014-2015 Fogo eruption, Cape Verde. J. Geophys. Res. Solid Earth 121, 2290–2303. doi: 10.1002/2015JB012666
Caracciolo D'Ajello, F., Nicolosi, I., Carluccio, R., Chiappini, S., De Ritis, R., Giuntini, A., et al. (2014). High resolution aeromagnetic anomaly map of Mount Etna volcano, Southern Italy. Volcanol. Geotherm. Res. 277, 36–40. doi: 10.1016/j.jvolgeores.2014.03.008
De Beni, E., Behncke, B., Branca, S., Nicolosi, I., Carluccio, R., D'Ajello Caracciolo, F., et al. (2015). The continuing story of Etna's New Southeast Crater (2012-2014): evolution and volume calculations based on field surveys and aerophotogrammetry. J. Volcanol. Geoth. Res. 303, 175–186. doi: 10.1016/j.jvolgeores.2015.07.021
Del Negro, C., Cappello, A., and Ganci, G. (2016). Quantifying lava flow hazards in response to effusive eruption. Geol. Soc. Am. Bull. 128, 752–763. doi: 10.1130/B31364.1
Del Negro, C., Cappello, A., Neri, M., Bilotta, G., Hérault, A., and Ganci, G. (2013). Lava flow hazards at Mount Etna: constraints imposed by eruptive history and numerical simulations. Sci. Rep. 3:3493. doi: 10.1038/srep03493
Ganci, G., Bilotta, G., Cappello, A., Hérault, A., and Del Negro, C. (2016). “HOTSAT: a multiplatform system for the satellite thermal monitoring of volcanic activity,” in Detecting Modelling and Responding to Effusive Eruptions, eds A. Harris, T. De Groeve, F. Garel, and S. A. Carn (London: Geological Society), 426.
Ganci, G., Harris, A. J. L., Del Negro, C., Guehenneux, Y., Cappello, A., Labazuy, P., et al. (2012a). A year of lava fountaining at Etna: volumes from SEVIRI. Geophys. Res. Lett. 39:L06305. doi: 10.1029/2012GL051026
Ganci, G., James, M. R., Calvari, S., and Del Negro, C. (2013). Separating the thermal fingerprints of lava flows and simultaneous lava fountaining using ground-based thermal camera and SEVIRI measurements. Geophys. Res. Lett. 40, 5058–5063. doi: 10.1002/grl.50983
Ganci, G., Vicari, A., Bonfiglio, S., Gallo, G., and Del Negro, C. (2011a). A texton-based cloud detection algorithm for MSG-SEVIRI multispectral images. Geomat. Nat. Hazard Risk 2, 1947–5705. doi: 10.1080/19475705.2011.578263
Ganci, G., Vicari, A., Cappello, A., and Del Negro, C. (2012b). An emergent strategy for volcano hazard assessment: from thermal satellite monitoring to lava flow modeling. Remote. Sens. Environ. 119, 197–207. doi: 10.1016/j.rse.2011.12.021
Ganci, G., Vicari, A., Fortuna, L., and Del Negro, C. (2011b). The HOTSAT volcano monitoring system based on a combined use of SEVIRI and MODIS multispectral data. Ann. Geophys. 54:2011. doi: 10.4401/ag-5338
Garel, F., Kaminski, E., Tait, S., and Limare, A. (2012). An experimental study of the surface thermal signature of hot subaerial isoviscous gravity currents: implications for thermal monitoring of lava flows and domes. J. Geophys. Res. 117:B02205. doi: 10.1029/2011JB008698
Gwinner, K. M., Coltelli, J., Flohrera, R., Jaumanna, K. D., Matza, M., Marsella, T., et al. (2006). “The HRSC-AX Mt. Etna project: high-resolution orthoimages and 1 m DEM at regional scale,” in Proceedings ISPRS Archives - Volume XXXVI Part 1, 2006, From Sensors to Imagery (Paris), T05-23.
Harris, A. J. L., Blake, S., Rothery, D., and Stevens, N. (1997). A chronology of the 1991 to 1993 Mount Etna eruption using advanced very high resolution radiometer data: implications for real-time thermal volcano monitoring. J. Geophys. Res. 102, 7985–8003.
Harris, A. J. L., Dehn, J., and Calvari, S. (2007). Lava effusion rate definition and measurement: a review. Bull. Volcanol. 70:1. doi: 10.1007/s00445-007-0120-y
Harris, A. J. L., Steffke, A., Calvari, S., and Spampinato, L. (2011). Thirty years of satellite-derived lava discharge rates at Etna: implications for steady volumetric output. J. Geophys. Res. 116:B08204. doi: 10.1029/2011JB008237
Harris, A. J. L., Vaughan, R. A., and Rothery, D. A. (1995). Volcano detection and monitoring using AVHRR data: the Krafla eruption,1984. Int. J. Remote Sens. 16, 1001–1020.
Neri, M., De Maio, M., Crepaldi, S., Suozzi, E., Lavy, M., Marchionatti, F., et al. (2017). Topographic maps of mount etna's summit craters, updated to december 2015. J. Maps 13, 674–683. doi: 10.1080/17445647.2017.1352041
Neri, M., Mazzarini, F., Tarquini, S., Bisson, M., Isola, I., Behncke, B., et al. (2008). The changing face of Mount Etna's summit area documented with Lidar technology. Geophys. Res. Lett. 35:L09305. doi: 10.1029/2008GL033740
Rupnik, E., Daakir, M., and Pierrot Deseilligny, M. (2017). MicMac – a free, open-source solution for photogrammetry. Open Geospatial Data 2:14. doi: 10.1186/s40965-017-0027-2
Stevens, N. F., Wadge, G., and Murray, J. B. (1999). Lava flow volume and morphology from digitised contour maps: a case study at Mount Etna, Sicily. Geomorphology 28, 251–261. doi: 10.1016/S0169-555X(98)00115-9
Vicari, A., Ganci, G., Behncke, B., Cappello, A., Neri, M., and Del Negro, C. (2011). Near-real-time forecasting of lava flow hazards during the 12–13 January 2011 Etna eruption. Geophys. Res. Lett. 38:L13317. doi: 10.1029/2011GL047545
Wadge, G., Walker, G. P. L., and Guest, J. E. (1975). The output of the Etna volcano. Nature 255, 385–387.
Wooster, M., Zhukov, B., and Oertel, D. (2003). Fire radiative energy release for quantitative study of biomass burning: derivation from the BIRD experimental satellite and comparison to MODIS fire products. Remote Sens. Environ. 86, 83–107. doi: 10.1016/S0034-4257(03)00070-1
Keywords: Etna volcano, satellite remote sensing, SEVIRI, Pléiades imagery, digital elevation model
Citation: Ganci G, Cappello A, Bilotta G, Herault A, Zago V and Del Negro C (2018) Mapping Volcanic Deposits of the 2011–2015 Etna Eruptive Events Using Satellite Remote Sensing. Front. Earth Sci. 6:83. doi: 10.3389/feart.2018.00083
Received: 14 March 2018; Accepted: 04 June 2018;
Published: 21 June 2018.
Edited by:
Clive Oppenheimer, University of Cambridge, United KingdomReviewed by:
Diego Coppola, Università degli Studi di Torino, ItalyKlemen Zaksek, Universität Hamburg, Germany
Laura Becerril Carretero, Instituto de Ciencias de la Tierra Jaume Almera (ICTJA), Spain
Copyright © 2018 Ganci, Cappello, Bilotta, Herault, Zago and Del Negro. This is an open-access article distributed under the terms of the Creative Commons Attribution License (CC BY). The use, distribution or reproduction in other forums is permitted, provided the original author(s) and the copyright owner are credited and that the original publication in this journal is cited, in accordance with accepted academic practice. No use, distribution or reproduction is permitted which does not comply with these terms.
*Correspondence: Gaetana Ganci, Z2FldGFuYS5nYW5jaUBpbmd2Lml0