
94% of researchers rate our articles as excellent or good
Learn more about the work of our research integrity team to safeguard the quality of each article we publish.
Find out more
METHODS article
Front. Earth Sci., 07 February 2017
Sec. Geomagnetism and Paleomagnetism
Volume 5 - 2017 | https://doi.org/10.3389/feart.2017.00008
We introduce a method and software to process demagnetization data for a rapid and integrative estimation of characteristic remanent magnetization (ChRM) components. The virtual directions (VIDI) of a paleomagnetic site are “all” possible directions that can be calculated from a given demagnetization routine of “n” steps (being m the number of specimens in the site). If the ChRM can be defined for a site, it will be represented in the VIDI set. Directions can be calculated for successive steps using principal component analysis, both anchored to the origin (resultant virtual directions RVD; m * (n2+n)/2) and not anchored (difference virtual directions DVD; m * (n2−n)/2). The number of directions per specimen (n2) is very large and will enhance all ChRM components with noisy regions where two components were fitted together (mixing their unblocking intervals). In the same way, resultant and difference virtual circles (RVC, DVC) are calculated. Virtual directions and circles are a global and objective approach to unravel different natural remanent magnetization (NRM) components for a paleomagnetic site without any assumption. To better constrain the stable components, some filters can be applied, such as establishing an upper boundary to the MAD, removing samples with anomalous intensities, or stating a minimum number of demagnetization steps (objective filters) or selecting a given unblocking interval (subjective but based on the expertise). On the other hand, the VPD program also allows the application of standard approaches (classic PCA fitting of directions a circles) and other ancillary methods (stacking routine, linearity spectrum analysis) giving an objective, global and robust idea of the demagnetization structure with minimal assumptions. Application of the VIDI method to natural cases (outcrops in the Pyrenees and u-channel data from a Roman dam infill in northern Spain) and their comparison to other approaches (classic end-point, demagnetization circle analysis, stacking routine and linearity spectrum analysis) allows validation of this technique. The VIDI is a global approach and it is especially useful for large data sets and rapid estimation of the NRM components.
Calculation of a characteristic remanent magnetization (ChRM) is a key step during paleomagnetic data processing. ChRMs are stable directions that can be effectively isolated from a given demagnetization procedure; subsequent application of stability tests is necessary to provide information on their geological significance. “Ideally, analytical methods (…) should be based on as much of the original magnetic information as possible, with minimal assumptions” (Kirschvink, 1980).
The most common technique used to separate different paleomagnetic components is to eye-ball select the relevant demagnetization interval observed in an orthogonal projection of demagnetization data (Zijderveld, 1967). Once the demagnetization interval has been selected for each specimen, directions are fitted by principal component analysis (PCA) (Kirschvink, 1980) although other approaches have been recently proposed (Heslop and Roberts, 2016a). PCA estimates the collinearity or coplanarity of the data. Collinear points indicate the progressive removal of one magnetic vector and determine the paleomagnetic direction. Coplanar points exist when two simultaneous components define a demagnetization circle (DC) (a plane defines a great circle on an equal area projection) (Jones et al., 1975; Halls, 1976; McFadden, 1977). When a demagnetization routine completely demagnetizes a sample, it is possible to include the origin of the orthogonal diagram anchoring the direction to calculate the resultant direction (R), while the other possibility is to calculate the difference direction (D) excluding the origin (Roy and Park, 1974; Hoffman and Day, 1978). If a direction addresses the origin (ideal case), both difference and resultant directions will yield similar results. Working with DCs, the paleomagnetic vector will be the intersection point between the demagnetization circles derived from different samples (Jones et al., 1975; McFadden, 1977; Bailey and Halls, 1984). When multiple samples are analyzed, and where some samples provide clear end-point magnetizations and others give rise to DCs, some studies have focused on the problem of combining direct observations and intersections of demagnetization circles (McFadden and McElhinny, 1988; Bailey and McFadden, 1990). After obtaining an individual ChRM for each specimen, the Fisher (1953), Bingham (1974) or bootstrap (Tauxe et al., 1991) statistics are applied to determine the paleomagnetic mean vector of the site and its precision. Other preliminary or auxiliary methods such as the Stacking Routine (SR) (Scheepers and Zijderveld, 1992) are more objective and automatic and may give a global idea of the demagnetization behavior. In the SR approach, an individual mean is calculated from specimen vectors for each demagnetization step for a given site and builds a “stacked” demagnetization diagram for the site. Other approaches have been used to automatically fit the ChRM; linearity spectrum analysis (LSA) (Schmidt, 1982) seeks to objectively establish the demagnetization interval by means of the quality of the directions (linearity is related to the maximum angular deviation [MAD] from PCA). On the other hand, the Line Find method (Kent et al., 1983) is a statistical analysis of linearity and planarity that takes into account measurement errors.
Most commonly used techniques and software packages to aid finding the ChRM are mainly based on eye-ball inspection of demagnetization diagrams and thus, strongly dependent upon the expertise and experience of the paleomagnetist. If we seek accuracy for determining e.g., paleopoles or tectonic rotations we should determine paleomagnetic directions as objectively as possible. In this paper, we propose the Virtual Directions (VIDI) method, designed as a global approach to tackle the demagnetization data that can be used as an auxiliary and efficient technique to find the ChRM. A software (Virtual Paleomagnetic Directions: VPD software. http://www.igme.es/zaragoza/aplicaInfor.htm) implementing this method as well as some classic approaches (PCA, DC, SR, LSA) is also introduced. The VIDI method and the VPD software are especially useful and rapid when dealing with large data sets (i.e., u-channel data or large collections of sites). Examples from northern Spain are used to illustrate this technique and their results have been compared to other methods (classic PCA fitting, SR, LSA) to validate its potentiality and reliability. The goal of the VIDI method and VPD software is not to substitute the expertise of paleomagnetic researchers, but to provide them with a tool to identify and calculate ChRM directions using a global and multifaceted approach to the demagnetization data.
In this method all possible directions (or vectors) and circles (or planes) are calculated between all possible demagnetization intervals for each specimen from a site (Pueyo, 2000; Ramón and Pueyo, 2008; Ramón, 2013). The rationale behind this approach is that any stable component identified as a result of the demagnetization process, including the ChRM, will stand out above the scattered directions. Thus, if the ChRM can be defined in that site, it will be included in the VIDI data set. Directions and circles are calculated without including the origin (difference directions) and including it anchoring the direction to it (resultant directions). This method necessarily implies several assumptions that are otherwise applicable to all methods proposed for calculating ChRM directions (although only in exceptional cases are completely fulfilled):
- a ChRM can be isolated with the selected demagnetization process;
- directions are continuous, all valid steps within a given demagnetization interval are included to calculate any direction;
- a magnetization component can be identified with a sufficient number of demagnetization steps; and
- the site must be lithologically homogeneous (e.g., similar magnetic mineralogy) and have the same structural location.
We should remember that the stepwise demagnetization process is expected to be homogeneous, demagnetization step increments are recommended to be similar. In the same way, steps are successively integrated in the estimation; skips are not allowed and double measurements must be first removed.
Let us suppose that there is a site with m specimens that are demagnetized following a homogeneous procedure of n steps. For each specimen all possible directions are calculated. Each direction is calculated using PCA (Kirschvink, 1980). The number of difference virtual directions (DVD) for one specimen is: . To calculate the resultant virtual directions (RVD), the process is the same but anchoring to the origin, being the number of RVD . In this case there are n more possible directions because only one step is needed to form a direction that includes the origin. Therefore, a total of n2 directions (difference + resultant) are automatically calculated for each sample, which results in m * n2 total directions for that site (Figure 1).
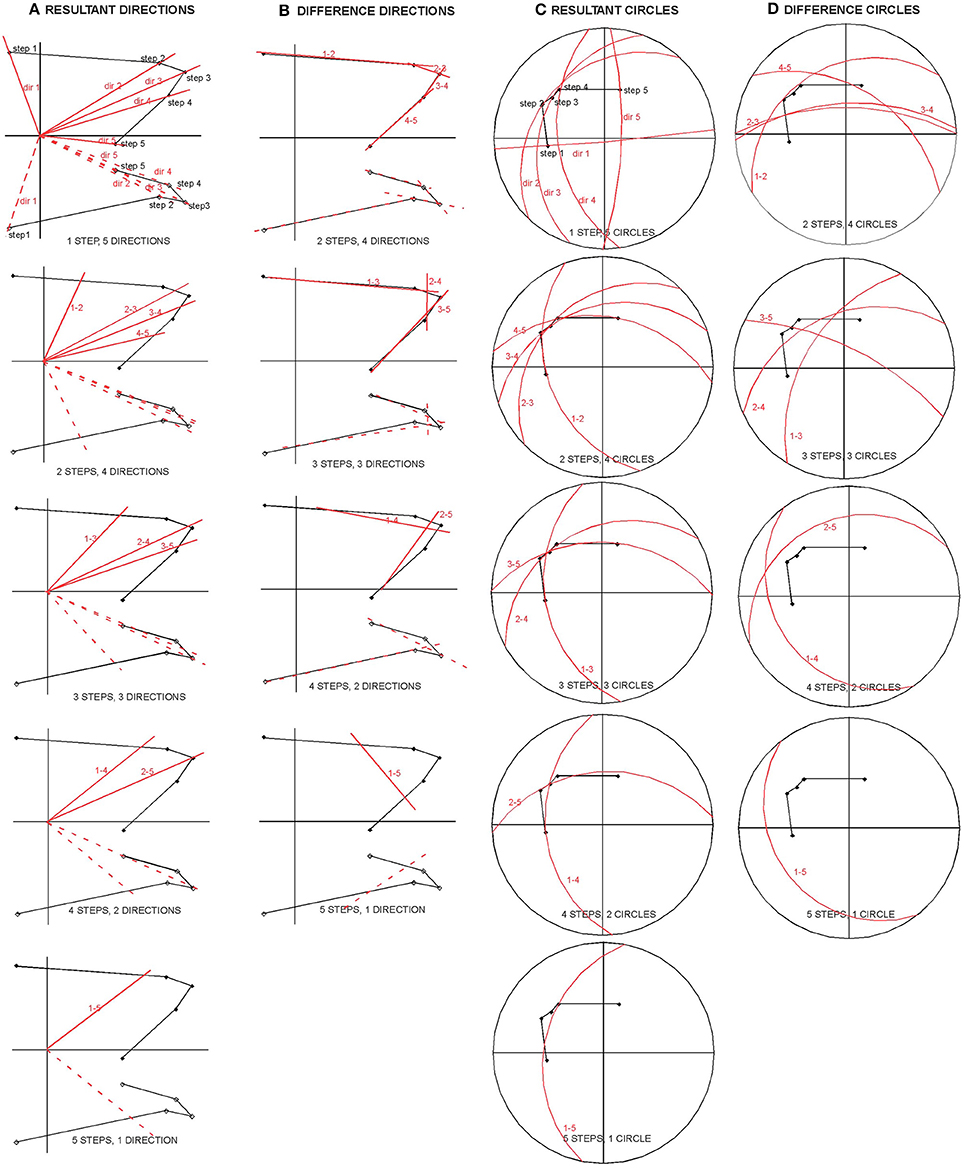
Figure 1. Illustration of the virtual directions concept. Demagnetized sample with n = 5 demagnetization steps. (A) Resultant virtual directions (RVD). With only one step there are n directions, n-1 directions with 2 steps and so on until 1 direction with n steps. (B) Difference virtual directions (DVD). The minimum number of steps required to calculate a direction is two. (C) Resultant virtual circles (RVC). (D) Difference virtual circles (DVC).
The RVD data set represents mainly the directions that trend to the origin of the orthogonal demagnetization plot because their signal is amplified when the unblocking interval for that component is reached, although there is a background noise caused by other directions that are not addressed to the origin. On the other hand, the DVD data set will represent any direction contained in the studied site. Difference directions are a better choice to fit paleomagnetic directions than anchored (Heslop and Roberts, 2016b). Difference vectors avoid instrumental spurious components (residual fields in the oven, magnetometer, etc.). Besides, if a paleomagnetic component addresses the origin, there is not any difference in the fitting for both methods (resultant or difference). To characterize the VIDI data set, Fisher (1953) and Bingham (1974) statistics are calculated. However, these parameters are not equivalent with those calculated with the PCA method, since in this case we have more than one direction for a single specimen. If we wanted to compare results, VIDI need to be filtered so that only one direction remains for each site. The maximum eigenvector (e1) of the orientation matrix (Scheidegger, 1965; Bingham, 1974) should be closer to the Fisher (1953) mean and represents the ChRM provided it is well defined.
In the same way and with similar meaning, the virtual demagnetization circles can be calculated from two different sources of vectors (resultant and difference) which gives two new data sets: difference virtual circles (DVC) and resultant virtual circles (RVC). The result must be checked by observing the areas where denser intersections of circles are located. The poles of demagnetization planes plotted in the stereographic projection tend to form a girdle whose pole, in turn, corresponds with the main intersection of all circles. The minimum eigenvector (e3) of the Bingham (1974) statistics of this distribution of poles should be closer to the ChRM in this case.
Visualization of all virtual directions and calculation of its mean direction can be inappropriate for noisy data or for sites with more than one representative component. Therefore, post-processing, as objective as possible, becomes necessary. With this aim, we propose the filtering of the data.
Several criteria can be used to filter the virtual directions and circles data sets: some can be considered more objective (number of steps, MAD, intensity) and some others are based on the experience and expertise of the researcher (interval of demagnetization) (Figure 2). The criteria that we have used are as follows.
a) Minimum number of steps. A difference direction can be defined with two steps and a resultant direction with only one step (including the origin of the demagnetization diagram); nonetheless, a representative component should be defined using as much as possible steps (this depends upon the magnetic complexity and the efficiency of the demagnetization) and, in any case, establishing a lower threshold of demagnetization steps (3 for directions and 4 for circles after Kirschvink, 1980). Therefore, a minimum number of steps can be set to extract only those directions that are stable and reliable.
b) Maximum and minimum intensities. This filter is useful to remove instrumental noise (background intensities), laboratory errors (intensity truncation steps after Kirschvink, 1980), or anomalous samples (e.g., shock magnetized, lighting). Moreover, the application of maximum threshold intensity could be very useful, for example, to differentiate bimodal distributions along u-channels (i.e., cyclic sequences).
c) Minimum and maximum error (MAD). Low MAD values (<10–15°) guarantee linearity for a direction and planarity for a circle, thus filtering with a maximum MAD is useful to remove poorly characterized directions and circles (for example those estimated in mixed unblocking intervals). Selection of a minimum MAD of 0.1° will avoid inclusion of resultant vectors characterized by only one step as well as difference vectors characterized by 2 steps (e.g., raw demagnetization information).
d) Interval of demagnetization (unblocking window). This method is really meaningful when a fixed demagnetization interval is found for all specimens in the studied site and particularly necessary when there is more than one component. Selection of minimum and maximum demagnetization steps can accurately constrain the virtual data set within the selected unblocking window. Although, this is the least objective filter (based on the expertise and experience of the paleomagnetist), it can be very useful to quickly characterize the ChRM providing a clear definition of the demagnetization interval. Besides, the evaluation of the collinearity or coplanarity from the LSA method (Schmidt, 1982) or by the automatic estimation of the unblocking windows (Ramón and Pueyo, 2012) can objectively support the selection of the demagnetization interval.
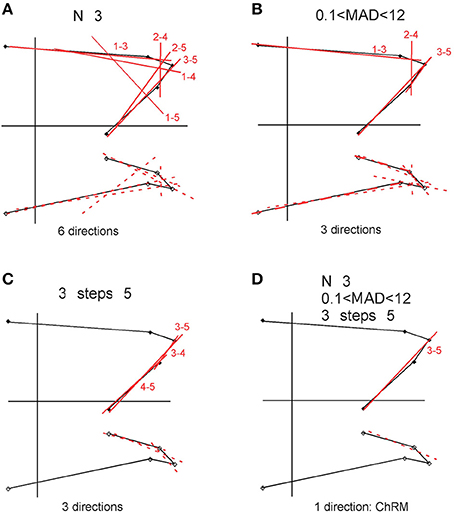
Figure 2. Illustration of the filtering concept (example from sample of Figure 1). (A) Minimum number of steps filter (n ≤ 3). (B) MAD filter (<12°). (C) Demagnetization interval/unblocking window filter. (D) The final filter with multiple criteria yields a single direction.
The Woodcock (1977) diagram may be useful to discriminate the goodness of the filtering. This diagram helps to quantify the shape and anisotropy of the orientation matrix of any population of vectors in the spherical space (Scheidegger, 1965). Using the ratios of its normalized eigenvalues (S1, S2, S3) in a way similar to the Flinn diagram (Flinn, 1962) is useful for determining anisotropies of orientation matrixes. After an appropriate filtering, the S1/S2 clustering ratio and the total anisotropy of the orientation matrix (S1/S3) are expected to be enhanced for well-defined ChRM directions. VC will show an enhancement of the girdling ratio (S2/S3) and the total eccentricity of the tensor (S1/S3) (Figure 3).
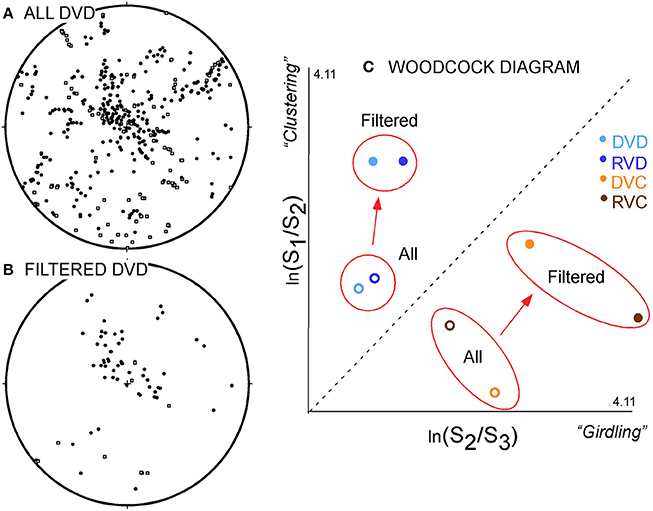
Figure 3. (A) DVD data set for site AR02 (raw dataset). (B) Filtered DVD (objective criteria for filtering: n ≥ 3, MAD < 15°, demagnetization interval ≥ 100°C). (C) Evaluation of the orientation matrix in the Woodcock (1977) diagram (logarithmic axis). Open symbols: all data; solid symbols: filtered data. Filtering increases the eccentricity and produces a sharper distribution. Directions become more clustered and demagnetization circles more girdled.
The VDP program includes a filtering window with all these criteria. Moreover, some useful graphics, including the Woodcock (1977) diagram, the distribution histograms of MAD, intensities and the unblocking spectrum, are displayed in this menu to help decide the correct filtering parameters.
In this section, we demonstrate the potential and trustability of the VIDI method in three real cases involving standard paleomagnetic sites: (i) a multi-component NRM and (ii) a poorly defined ChRM. iii) A third case involving a large data set (e.g., obtained from u-channels) has been also considered. Results are compared to those from other techniques (visual inspection of demagnetization directions [PCA], demagnetization circles [DC], the stacking routine [SR] and the linearity spectrum analysis [LSA]).
Results for a paleomagnetic site (ASN3) from the Internal Sierras in the Southern Pyrenees, Spain, with three components are presented here. This Cenomanian-Santonian site is affected by the Larra-Monte Perdido thrust system and the later Gavarnie thrust sheet. Apart from a secondary high-temperature complex direction (Izquierdo-Lavall et al., 2015), an intermediate-temperature and post-folding (Eocene) reverse polarity remagnetization is also present. The components have been isolated with standard eye-ball PCA fitting and using the stacking, LSA and VIDI routines of the VPD software. Results obtained with PCA for the intermediate and high unblocking temperature components were previously published by Oliva-Urcia and Pueyo (2007). Apart from a variable and low-temperature component, two stable components were defined during the thermal demagnetization procedure at the site scale: an intermediate temperature (between 250 and 460°C; six or seven steps; D&I = 207°, −32°; α95 = 10°; k = 23) and a high temperature component (between 500 and 560°C; three steps, D&I = 189°, 24°, α95 = 11°, k = 19).
The ChRM directions for a stacked sample (made of 10 specimens) is calculated rapidly after the PCA fitting of the demagnetization intervals from 100 to 460°C and from 500° to 560°C. Intensity truncation steps (mostly laboratory errors) were already removed before further analysis. This helps to achieve a global idea of the paleomagnetic directions for the site. The unblocking windows for the three components are clearly recognizable from the SR sample (Figure 4A) and there is a good similarity with results from the PCA analyses of the stacking routine and the eye-ball fitting because of the good quality of the sample.
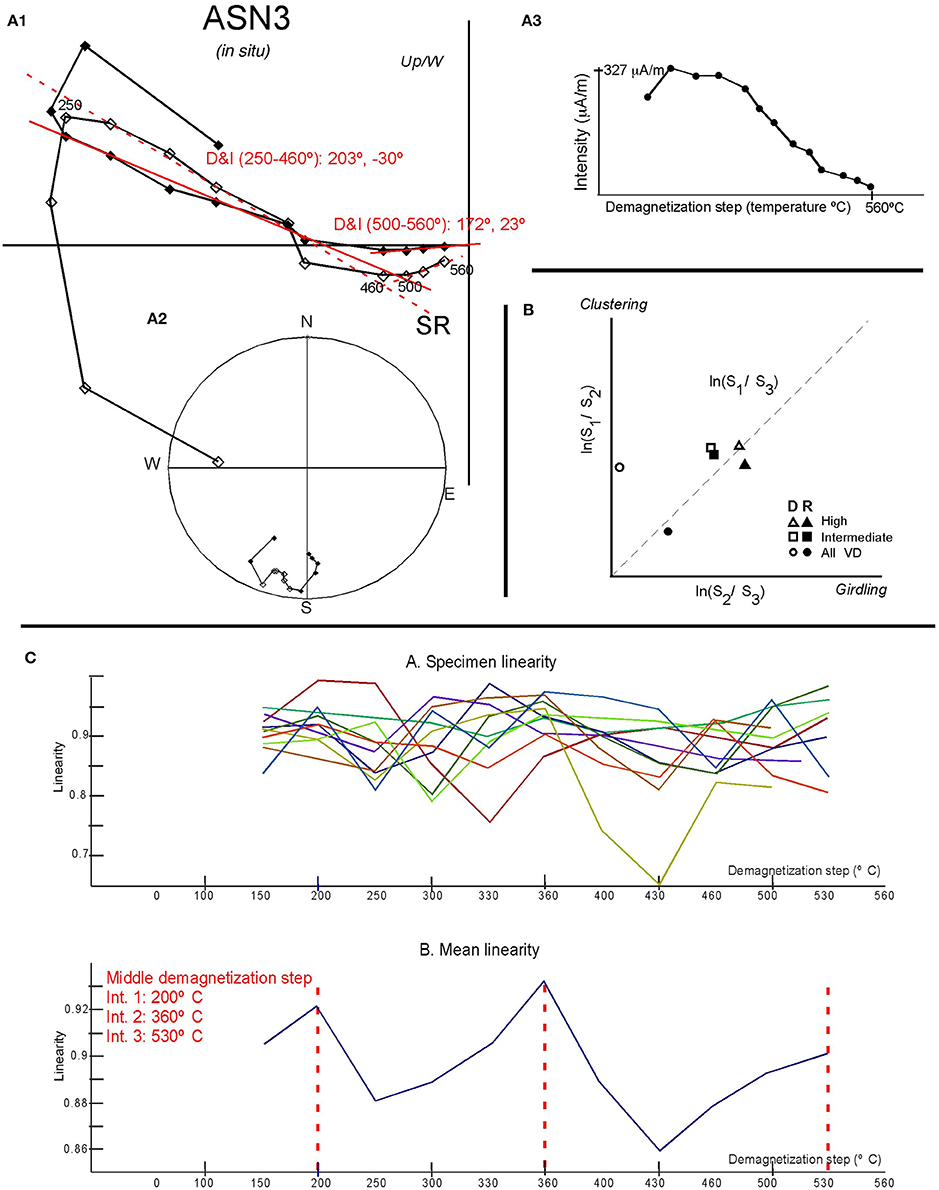
Figure 4. (A) Stacking routine (SR) for samples from site ASN3. The stacked sample calculates the mean direction for each demagnetization step from all samples of a site. (A1) Orthogonal projection. (A2) Equal area stereographic projection. (A3) Intensity decay diagram. (B) Woodcock (1977) diagram (logarithmic axis). Open symbols, DVD; solid symbols, RVD. Circles, squares and triangles represent the entire VIDI dataset, the intermediate and the high-temperature components respectively. (C) Determination of the demagnetization intervals for paleomagnetic data from site ASN3 using the spectrum of linearity (Schmidt, 1982). (Upper row) Specimen linearity (each color is a sample from the site). (Lower row) Mean linearity for all specimens of a site. Peaks of maximum linearity determine the mean demagnetization step of the intervals.
The demagnetization intervals can be also calculated with LSA method (Schmidt, 1982). Three intervals can be determined from the site mean-linearity diagram (Figure 4C); a low temperature component up to 250°C, an intermediate unblocking temperature is defined between 250 and 430°C and, finally, the high temperature component up to 560°C. These ranges may slightly change within the individual samples.
All virtual directions are calculated (983) and filtered: a minimum of 3 steps is needed to define a direction, a maximum error (MAD) of 15° is allowed, and only demagnetization steps from 100 to 560°C are considered (according to the stacking routine) (439 directions remain). However, in this case (multi-component NRM) there are too many directions to draw a conclusion. It is therefore essential to choose the correct demagnetization interval observed for the two main directions. To calculate the component in the intermediate unblocking window, only difference directions are taken into consideration (there are 126 DVD in this interval), while to calculate the high temperature component only resultant directions are considered (there are only 8 RVD defined with 3 steps in this interval). The application of filters to narrow both components increases the anisotropy of the orientation matrix (Figure 4B) as deduced from the Woodcock (1977) diagram and helps validating the results.
For a well-defined component (e.g., the intermediate unblocking temperature component), the VIDI increases slightly the concentration of vectors with respect to the standard eyed-ball PCA fitting (Figure 5, Table 1). In any case, a common true mean direction (CTMD) in terms of McFadden and Lowes (1981) is found independently of the used method. However, the α95 value of the PCA and DVD solutions is not comparable because the number of directions used to determine the mean is not the same. When the component is defined with fewer steps (e.g., the high unblocking temperature component), SR and RVD shares a CTMD but SR and PCA seems to be significantly different.
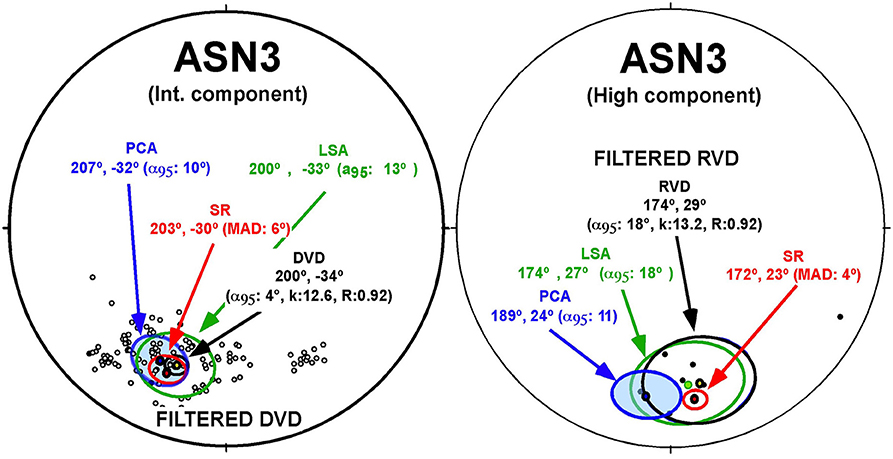
Figure 5. VIDI and paleomagnetic means from site ASN3 plotted on equal area stereographic projections. (Left) Intermediate temperature component. DVD and means calculated by PCA, SR, LSA and DVD (filtering criteria; n ≥3, MAD < 15, interval: 250–460°C). (Right) High temperature component. RVD and means calculated by PCA, SR, LSA, and RVD (n = 3, MAD < 15, interval: 500–560°C).
In conclusion, the VIDI method enables reliable determination of paleomagnetic means for this site. Angular differences associated with means derived from other methods (PCA, SR) do not exceed 5.9° (angle between PCA and DVD mean directions) for the well-defined intermediate unblocking temperature. Besides, the VPD software allows getting a global idea of the magnetization behavior based on four different and independent approaches.
Two sites from the External Sierras in the Southern Pyrenees, Spain, are useful to illustrate the potential of the VIDI method for recovering information when the magnetic signal is weak. These sites, AR02 and AR03, are located in the Arguis Fm (Upper Eocene) in the Fachar anticline in the westernmost sector of the Pyrenean sole thrust. Specimens were thermally demagnetized with special emphasis on the 300–400°C interval (steps every 20–30°C), over which the ChRM is defined in this lithology (Pueyo et al., 2003). Despite the large number of demagnetizations (18 and 14 respectively), standard eye-ball inspection and PCA fitting yields intermediate to low quality means (α95 ≈ 15°). Demagnetization circles were also fitted with PCA to support these data. Site AR02 presents statistically indistinguishable results between DC and PCA results (CTMD) while site AR03 shows an angular difference of 13° between the mean directions calculated with both techniques.
The optimal demagnetization interval may be identified using the stacking routine (Figure 6A). It is clear for the stacked sample from site AR03 (300–400°C) and is similar to that for the site AR02, although this latter site is more difficult to characterize (250–380°C). It is worth mentioning that we have removed directions starting at ≈ 400°C that are linked to laboratory-induced viscous components (witnessed by the increasing of susceptibility). For the poorest AR02 site, LSA seems to fail to accurately determine the demagnetization interval; the demagnetization steps with minimum linearity are 200°C in both examples and also 300°C in AR03, which are not the middle step of the observed unblocking window (Figure 6B). Nevertheless, resultant directions calculated around this step are not far from the expected (CTMD in case of AR03 between LSA, SR, and PCA methods).
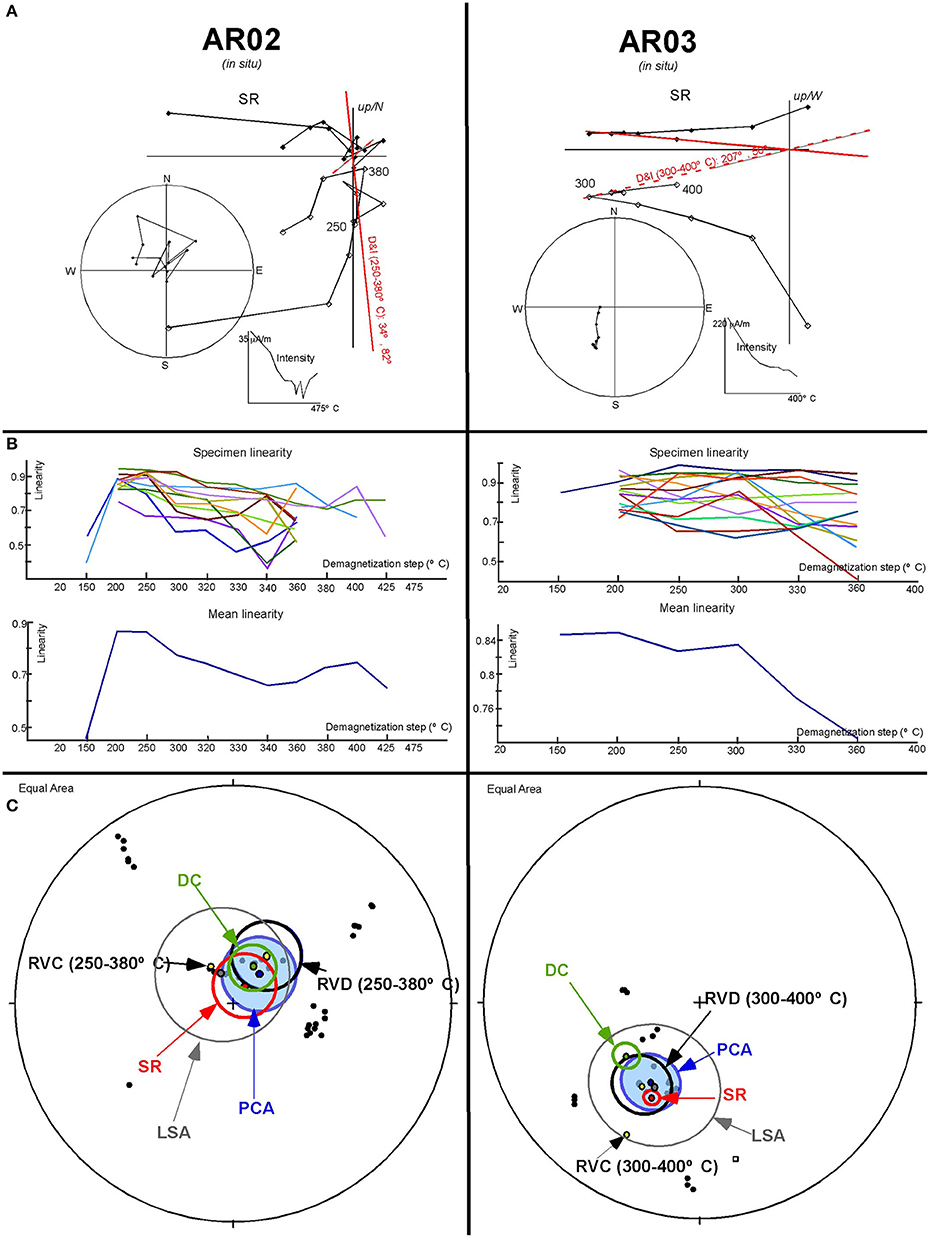
Figure 6. Paleomagnetic data from sites AR02 & AR03 (External Sierras of the Pyrenees). (A) Stacked samples (orthogonal projection, stereographic projection and intensity decay diagram). (B) Linearity spectrum analysis. Calculated middle demagnetization step (maximum peaks of the mean linearity function) does not strictly correspond with the observed demagnetization interval. (C) Means calculated by different methods: PCA, SR, DC, resultant virtual directions (RVD) and resultant virtual circles (RVC). Virtual directions are filtered (n ≥ 3, MAD < 15, interval AR02: 250–380°C, interval AR03: 300–400°C).
As in the preceding example, all virtual directions are calculated and two levels of filtering are applied. In this case only resultant directions are taken into account since directions appear to be directed to the origin in the stacked samples (especially AR03). The first and more objective filter removes low quality directions with MAD >15° as well as poorly represented directions, by requiring at least 3 demagnetization steps (n ≥ 3). The second filter sets the demagnetization interval defined by the stacking routine. The ChRM is the mean of this final set.
In both examples, SR and RVD means fall within the 95% confidence region obtained with the PCA technique (Figure 6C, Table 2). This helps to validate the VIDI method as an auxiliary estimation of the ChRM. Besides; the similarity of the different means helps supporting the medium-quality observations made by standard methods (PCA). However, the mean of the virtual circles (RVC) in these examples does not fall in the PCA confidence region because their poles do not define a girdle in a stereographic projection.
At the beginning of the 1st century AD, the largest dam (35 m) in the western world until the 16th century was built by the Romans in the vicinity of Cesaraugusta, now known as Zaragoza (NE Spain). The Almonacid de la Cuba reservoir completely overflowed at the end of the 2nd century to give a total infill thickness of 25 m, 5 m of which is exposed by present-day river incision.
Several standard paleomagnetic samples (both cores and plastic boxes) were taken (a sample every 5 cm) to search for a continuous record of secular variation throughout this period. Two u-channel samples (1.5 m length and 2 × 2 cm cross-section) were also collected from the studied outcrop (Figure 7) and were measured at 1 cm stratigraphic intervals. IRM acquisition curves indicate the existence of low coercivity minerals and thermomagnetic curves provide evidence for the occurrence of magnetite (dominant), iron sulfides (occasional) and hematite (rare) as magnetic remanence carriers (Pueyo et al., 2002). Results from stepwise demagnetization (both thermal and AF) of discrete samples allow us to differentiate two components: (1) an overprint due to both the present geomagnetic field (PGF) and sampling-induced components that is identified up to 10 mT and (2) a stable ChRM that is identified from 100 to 350°C and from 20 to 60 mT. The SR run under the VPD of the lower u-channel sample (with stepwise AF at 150 demagnetizations stratigraphic levels) confirms these as the optimal demagnetization intervals, that were helpful for design the filters to a large data set with an apparently homogeneous demagnetization routine.
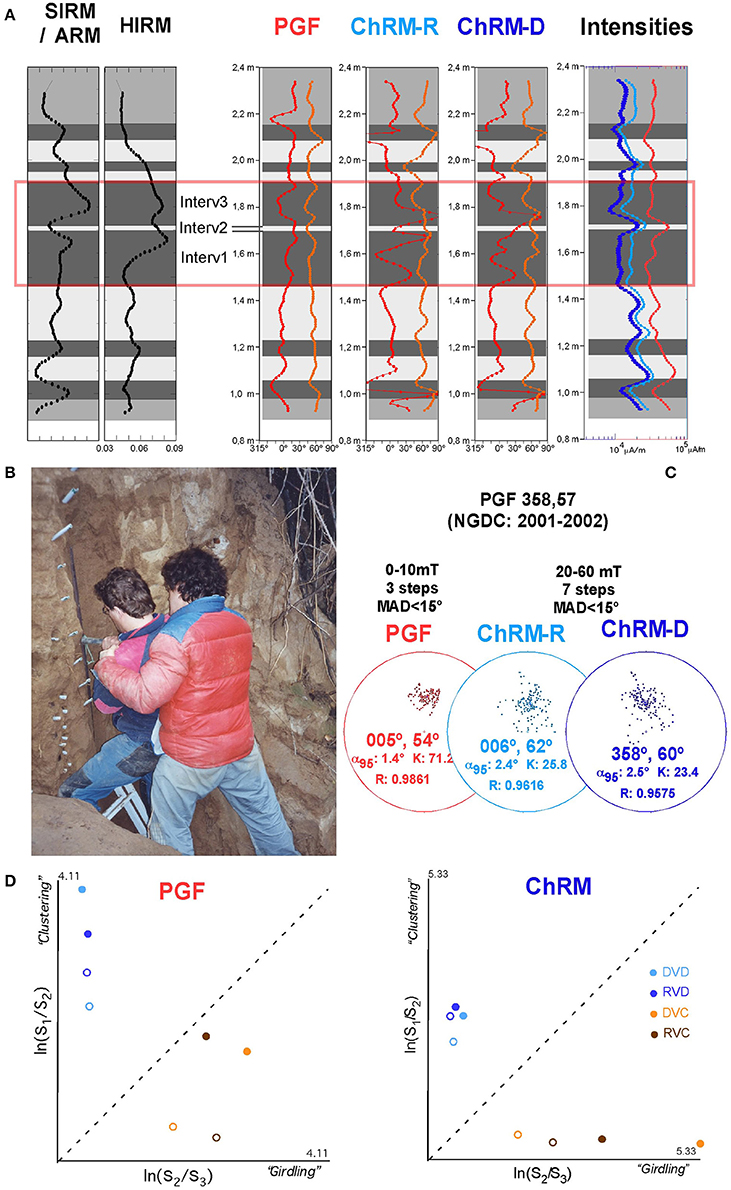
Figure 7. Paleomagnetic data from a u-channel sample in the Almonacid de la Cuba sediments (Roman dam in northern Spain). Virtual directions filtered by interval: PGF from 0 to 10 mT (3 steps) and ChRM from 20 to 60 mT (7 steps) and MAD < 15°. (A) Declination in red and inclination in orange. Interval used in this figure is highlighted. (B) Sampling u-channels in a vertical outcrop. (C) Equal area stereographic projection with the virtual directions for paleomagnetic data. (D) The Woodcock (1977) diagram for the PGF and ChRMs components. Open symbols, all data; solid symbols, filtered data.
In this case VPD helps to quickly estimate both components after applying the correct filters (Figure 7). Only directions with MAD < 15° are considered. The first component (PGF) is set between 0 and 10 mT; if we select 3 steps, only two directions (resultant and difference) per measured stratigraphic interval will result from the filtering. Since intermediate components are not necessarily directed toward the origin of the demagnetization plot, only the difference vectors have been considered. In any case, both VIDI sets have increases in the clustering ratios (Woodcock, 1977) (Figure 7C). The mean is well characterized (D&I = 005°, 54°; α95 = 1.4°; k = 71) and seems to be a slightly noisy record of the PGF, as deduced from the National Geophysical Data Center (NGDC) for the sampling site (D&I = 358°, 57°). The second filter between 20 and 60 mT includes 7 demagnetization steps and gives a slightly different mean for the resultant and difference vectors (Figure 7B). This is likely caused by and incomplete demagnetization that bias the resultant vectors. This ChRM drifts around the “expected” mean for the Roman period in the Iberian Peninsula (Pavon-Carrasco et al., 2009).
Different magnetic properties are cyclically observed in this site, this has been deduced by rock magnetism ratios (HIRM and SIRM/ARM) and are represented by light and dark gray strips (Figure 7A). If we zoom in the interval from 1.46 to 1.91 m three subintervals can be observed and display important intensity variations within the calculated directions; the second subinterval (light gray) displays maximum intensities and a distinct NE and very clustered orientation. In this case the virtual direction method has been useful to recognize this pattern. Besides, a filter of minimum intensity can isolate the directions of this second subinterval. This filtering allows us to calculate the ChRM of this subinterval with different magnetic properties that varies from the mean direction of the whole interval (Figure 8).
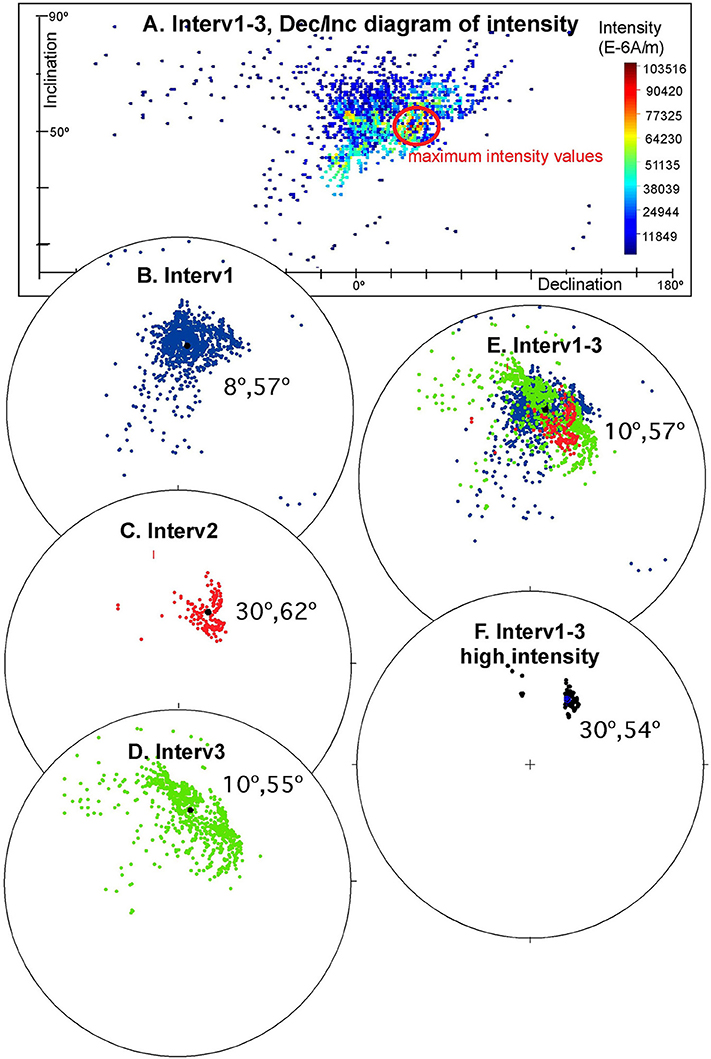
Figure 8. Selected stratigraphic interval (highlighted in Figure 7) from the u-channel sample from Almonacid de la Cuba sediments. Declination/Inclination diagram and stereographic projections of the difference virtual directions objectively filtered (n ≥ 3, MAD < 15). (A) Dec/Inc diagram of intensity of interval 1–3. There is a group of directions with high intensity on the right of the main group mean. (B) DVD of the subinterval 1: 1.46–1.69 m. (C) DVD of the subinterval 2: 1.7–1.72 m. (D) DVD of the whole interval 3: 1.73–1.91 m. Subinterval 2 has minimum influence in the calculus of the mean direction. (E) DVD of the whole interval 1–3: 1.46–1.91 m. (F) DVD filtered by minimum intensity of the interval 1–3. The mean direction is close to the one observed for the subinterval 2.
The virtual directions (VIDI) method is a useful technique for obtaining a global and objective view of the paleomagnetic behavior within a large and/or noisy data set. The entire VIDI set allows researchers to obtain a rapid understanding of the magnetic behavior. VIDI can be also used as an automatic technique to rapidly calculate a preliminary ChRM. Objective filters (minimum number of steps needed to define a direction and maximum error allowed) together with selection of the optimal demagnetization interval are applied to filter the VIDI set and to estimate the ChRM. The unblocking window selection is the most subjective parameter during filtering. Inspection of the stacking routine (Scheepers and Zijderveld, 1992), the automatic estimation of the unblocking windows (Ramón and Pueyo, 2012) can help selecting the interval and the linearity spectrum analysis (Schmidt, 1982) may be used as an additional tool to support the choosing of these intervals.
The VIDI method has been tested for multicomponent character and for weak quality data. The results are compared with other methods (PCA, DC, SR, LSA) and are similar and statistically indistinguishable in most cases (sharing a CTMD). The VIDI method is especially useful when dealing with relatively homogeneous and large data sets. The ability to rapidly obtain large paleomagnetic data sets represents a growing problem for post-laboratory data processing. Large data sets (thousands of measurements), such as those derived from automatic instruments like the 2-G Enterprises SQUID magnetometer designed for u-channel samples, can be rapidly generated. Results from two u-channel samples from a Roman dam deposit (NE Spain) reveal consistent declination and inclination trends along the profile and proper filters help recognizing cycles in the record.
Finally, the VPD software allows visualization of demagnetization data and allows conventional ChRM estimation approaches (eye-ball fitting by PCA of both directions and circles, stacking routine and linearity spectrum analysis) as well as the VIDI method with application of filters. The software package, with versatile output/input formats, allows rapid and reliable processing of large data sets (see Supplementary Material).
MR: Software and concept development; EP: Concept development and paper design. BO: case study; JL: case study.
MINECO (CGL2014-54118-C2). Research funding was provided by the Pmag3Drest (CGL2014-54118-C2) and DR3AM (CGL2014- -54118) projects from the Spanish Ministry of Science and the 3DR3 & GeoPyrDatabases (PI165/09 & CTPP01/07) from the Aragonian Government. MR acknowledge the contract PTA2007-0282.
The authors declare that the research was conducted in the absence of any commercial or financial relationships that could be construed as a potential conflict of interest.
Stereographic projections were made using the “Stereonet” program (6.3.2) by Richard Allmendinger to whom we are very grateful (http://www.geo.cornell.edu/geology/faculty/RWA). Constructive reviews by Peter Aaron Selkin and Nicholas L. Swanson-Hysel and the editor, Joshua M. Feinberg, are kindly acknowledged.
The Supplementary Material for this article can be found online at: http://journal.frontiersin.org/article/10.3389/feart.2017.00008/full#supplementary-material
Bailey, R. C., and Halls, H. C. (1984). Estimate of confidence in paleomagnetic directions derived from mixed remagnetization circle and direct observational data. J. Geophys. 54, 174–182.
Bailey, R. C., and McFadden, P. L. (1990). The combined analysis of remagnetization circles and direct observations in paleomagnetism; [discussion and reply], earth planet. Sci. Lett. 101, 125–128.
Bingham, C. (1974). An antipodally symmetric distribution on the sphere. Ann. Statist. 2, 1201–1225.
Fisher, R. A. (1953). Dispersion on a sphere. Proc. R. Soc. A. 217, 295–305. doi: 10.1098/rspa.1953.0064
Flinn, D. (1962). On folding during three-dimensional progressive deformation. Quart. J. Geo. Soc. Lond. 118, 385–433.
Halls, H. C. (1976). A least squared method to find a remanence direction from converging remagnetization circles. Geophys. J. R. Astron. Soc. 45, 297–304. doi: 10.1002/2016JB013387
Heslop, D., and Roberts, A. P. (2016a). Analyzing paleomagnetic data: to anchor or not to anchor?. J. Geophys. Res. Solid Earth 121, 7742–7753.
Heslop, D., and Roberts, A. P. (2016b). Estimation and propagation of uncertainties associated with paleomagnetic directions. J. Geophys. Res. Solid Earth 121, 2274–2289. doi: 10.1002/2015jb012544
Hoffman, K. A., and Day, R. (1978). Separation of multi-component NRM: a general method. Earth Planet. Sci. Lett. 40, 433–438. doi: 10.1016/0012-821X(79)90215-2
Izquierdo-Lavall, E., Casas-Sainz, A. M., Oliva-Urcia, B., Burtmester, R., Pueyo, E. L., and Housen, B. (2015). Multi-episodic remagnetization related to diachronous thrusting in the Pyrenean internal Sierras. Geophys. J. Int. 201, 891–914. doi: 10.1093/gji/ggv042
Jones, D. L., Robertson, I. D. M., and McFadden, P. L. (1975). A palaeomagnetic study of the Precambrian dyke swarms associated with the great Dyke of Rhodesia. Trans. Geol. Soc. Sth. Afr. 78, 57–65.
Kent, J. T., Briden, J. C., and Mardia, K. V. (1983). Linear and planar structure in ordered multivariate data as applied to progresive demagnetization of paleomagnetic remanence. Geophys. J. R. Astron. Soc. 62, 699–718. doi: 10.1111/j.1365-246X.1983.tb05001.x
Kirschvink, J. L. (1980). The least-squares line and plane and the analysis of the paleomagnetic data. Geophys. J. R. Astron. Soc. 62, 699–718. doi: 10.1111/j.1365-246X.1980.tb02601.x
McFadden, P. L. (1977). Comments on “A least-squares method to find a remanence direction from converging remagnetization circles” by H. C Halls. Geophys. J. R. Astr. Soc. 48, 549–550.
McFadden, P. L., and Lowes, F. J. (1981). The discrimination of mean directions drawn from Fisher distributions. Geophy. J. R. Astron. Soc. 67, 19–33. doi: 10.1111/j.1365-246X.1981.tb02729.x
McFadden, P. L., and McElhinny, M. W. (1988). The combined analysis of remagnetization circles and direct observations in paleomagnetism, earth planet. Sci. Lett. 87, 161–342.
Oliva-Urcia, B., and Pueyo, E. L. (2007). Rotational basament kinematics deduced from remagnetized cover rocks (Internal Sierras, southwestern Pyrenees), Tectonics. 26, TC4014. doi: 10.1029/2006TC001955
Pavon-Carrasco, F. J., Osete, M. L., Torta, J. M., and Gaya-Pique, L. R. (2009). A regional archeomagnetic model for Europe for the last 3000 years, SCHA.DIF.3K; Applications to archeomagnetic dating. Geochem. Geophys. Geosyst. 10:Q03013. doi: 10.1029/2008GC002244
Pueyo, E. L. (2000). Rotaciones Paleomagnéticas En Sistemas De Pliegues Y Cabalgamientos. Tipos, Causas, Significado Y Aplicaciones (Ejemplos Del Pirineo Aragonés). PhD. thesis, Department Earth Sciences, Universidad Zaragoza, Spain.
Pueyo, E. L., Larrasoa-a, J. C., Mauritsch, H. J., Valero, B., González, P., Pocoví, A., et al. (2002). “Preliminary paleomagnetic results from the filling of a Roman dam (Almonacid de la Cuba): archeomagnetic and environmental implications,” New trends in Geo-, Paleo-, Rock-, and Enviromental Magnetism VIII Castle Meeting Proceedings, 49.
Pueyo, E. L., Parés, J. M., Millán, H., and Pocoví, A. (2003). Conical folds and apparent rotations in paleomagnetism (a case study in the Southern Pyrenees), Tectonophysics 362, 345–366. doi: 10.1016/S0040-1951(02)00645-5
Ramón, M. J. (2013). Flexural Unfolding of Complex Geometries in Fold and Thrust Belts Using Paleomagnetic Vectors. Ph.D. University of Zaragoza.
Ramón, M. J., and Pueyo, E. L. (2008). Cálculo de direcciones y planos virtuales paleomagnéticas: Ejemplos y comparación con otros métodos, Geotemas 10, 1203–1206.
Ramón, M. J., and Pueyo, E. L. (2012). Automatic calculation of demagnetization intervals; a new approach based on the virtual directions method and comparison with the linearity spectrum análisis. Geotemas, 13, 1080–1083.
Roy, J. L., and Park, J. K. (1974). The magnetization process of certain redbeds: vector analysis of chemical and thermal results. Can. J. Earth Sci. 11, 437–471. doi: 10.1139/e74-040
Scheepers, P. J. J., and Zijderveld, J. D. A. (1992). Stacking in Paleomagnetism: application to marine sediments with weak NRM. Geophys. Res. Lett. 1914, 1519–1522. doi: 10.1029/92GL01454
Scheidegger, A. M. (1965). On the statistics of the orientation of bedding planes, grain axes, and similar sedimentological data, US Geological survey professional. Papers 525C, 164–167.
Schmidt, P. W. (1982). Linearity spectrum analysis of multicomponent magnetizations and its application to some igneous rocks from south-eastern Australia. Geophys. J. R. Astron. Soc. 70, 647–665. doi: 10.1111/j.1365-246X.1982.tb05978.x
Tauxe, L., Kylstra, N., and Constable, C. (1991). Bootstrap statistics for paleomagnetic data, J. Geophys. Res. 96, 11723–11740. doi: 10.1029/91jb00572
Keywords: ChRM analysis, principal component analysis, demagnetization circles, Pyrenees, u-channel
Citation: Ramón MJ, Pueyo EL, Oliva-Urcia B and Larrasoaña JC (2017) Virtual Directions in Paleomagnetism: A Global and Rapid Approach to Evaluate the NRM Components. Front. Earth Sci. 5:8. doi: 10.3389/feart.2017.00008
Received: 10 October 2016; Accepted: 19 January 2017;
Published: 07 February 2017.
Edited by:
Joshua M. Feinberg, University of Minnesota, USAReviewed by:
Peter Aaron Selkin, University of Washington Tacoma, USACopyright © 2017 Ramón, Pueyo, Oliva-Urcia and Larrasoaña. This is an open-access article distributed under the terms of the Creative Commons Attribution License (CC BY). The use, distribution or reproduction in other forums is permitted, provided the original author(s) or licensor are credited and that the original publication in this journal is cited, in accordance with accepted academic practice. No use, distribution or reproduction is permitted which does not comply with these terms.
*Correspondence: Emilio L. Pueyo, dW5haW1AaWdtZS5lcw==
Disclaimer: All claims expressed in this article are solely those of the authors and do not necessarily represent those of their affiliated organizations, or those of the publisher, the editors and the reviewers. Any product that may be evaluated in this article or claim that may be made by its manufacturer is not guaranteed or endorsed by the publisher.
Research integrity at Frontiers

Learn more about the work of our research integrity team to safeguard the quality of each article we publish.