 Georgios Balasis
 Stelios M. Potirakis
 Mioara Mandea3
- 1Institute for Astronomy, Astrophysics, Space Applications and Remote Sensing, National Observatory of Athens, Athens, Greece
- 2Department of Electronics Engineering, Piraeus University of Applied Sciences (TEI of Piraeus), Athens, Greece
- 3Centre National d'Etudes Spatiale, Paris, France
Recently, many novel concepts originated in dynamical systems or information theory have been developed, partly motivated by specific research questions linked to geosciences, and found a variety of different applications. This continuously extending toolbox of non-linear time series analysis highlights the importance of the dynamical complexity to understand the behavior of the complex Earth's system and its components. Here, we propose to apply such new approaches, mainly a series of entropy methods to the time series of the geomagnetic field. Two datasets provided by Chambon la Foret (France) and Niemegk (Germany) observatories are considered for analysis to detect dynamical complexity changes associated with geomagnetic jerks, the abrupt changes in the first temporal derivative of the Earth's magnetic field. The results clearly demonstrate the ability of Shannon and Tsallis entropies as well as Fisher information to detect events in a regional manner having identified complexities lower than the background in time intervals when geomagnetic jerks have already been reported in the literature. Additionally, these information measures are directly applicable to the original data without having to derive the secular variation or acceleration from the observatory monthly means. The strength of the proposed analysis to reveal dynamical complexity features associated with geomagnetic jerks can be utilized for analyzing not only ground measurements, but also satellite data, as those provided by the current magnetic field mission of Swarm.
1. Introduction
A geomagnetic jerk can be defined as a sudden change (a V-shape like change) in the slope of the geomagnetic secular variation, i.e., the first time derivative of the Earth's magnetic field (Mandea et al., 2010). Geomagnetic jerks were first reported by Courtillot et al. (1978). Various techniques have been applied in order to detect these events in geomagnetic field time series (Mandea et al., 2010). Usually, geomagnetic jerks are particularly visible in the eastward (Y) component of the geomagnetic field, which is supposed to be the less affected by external fields (Qamili et al., 2013). Although the phenomenon has been studied for many years, its origin is not yet fully explained. These phenomena are difficult to be studied, because of their small amplitudes and the overlap of their frequency range with the effect of solar-dependent external variations. Recently, Brown et al. (2013) analysing geomagnetic observatory data from 1957 to 2008, suggested that jerk amplitudes present some possible periodic trends across Europe and North America. This behavior may be related to the 6-yr periods detected independently in the secular variation and length-of-day (Gillet et al., 2010; Holme and de Viron, 2013).
Geomagnetic jerks have been detected around 1900, 1901, 1913, 1915, 1925, 1932, 1949, 1969, 1971, 1978, 1979, 1980, 1986, 1991, 1992, 1999, 2003, 2005, 2007 (Brown et al., 2013, and references therein). These established global and regional jerk epochs reported in different studies do not fully characterize the observations, as until recently only magnetic observatory data have been available, with a very sparse data set for even the best observed events. This is crucial when assessing the potential occurrence of global events. The new magnetic satellite data offer a new way to investigate these events, on global scale (Mandea and Olsen, 2006). Since the beginning of this century, more regional geomagnetic jerks are proposed, the last one for 2014 (Torta et al., 2015).
A number of methods originated in (non-equilibrium) statistical mechanics and information theory exist that have recently found successful applications to quantitatively studying complexity in various components of the complex system Earth (Balasis et al., 2013). For instance, entropy techniques provide convenience for detecting and capturing useful information of geophysical time series having the advantages of simplicity, extremely fast calculation, and antinoise ability (Balasis et al., 2009; Vallianatos, 2011; Vallianatos and Telesca, 2012). In particular, entropy measures have been proven their character as versatile tools to detect dynamical complexity in geomagnetic activity indices (Balasis et al., 2008, 2009, 2013). Herein, entropy measures have been applied to monthly means of geomagnetic observatory data to detect dynamical complexity signatures associated with geomagnetic jerks.
2. Data Processing
In order to apply the methods proposed in the following and to demonstrate their applicability to characterize geomagnetic jerks, we have considered data from two geomagnetic observatories: Chambon La Foret (CLF), and Niemegk (NGK). This choice is motivated twofold. Firstly, we take advantage of our intimate knowledge of both observatory data (including changes in base-lines). Secondly, these observatories are situated close enough to record the same changes in the geomagnetic field, but still far enough (of the order of 1000 km) to record specific tiny changes, if any.
The considered time series represent the temporal variation of the geomagnetic field recorded for more than a century (1890–2013). For our analysis, we have used the monthly means of the Y component of the geomagnetic field, which is the one less affected by external fields (Qamili et al., 2013). Figure 1A shows the evolution of the monthly means for both observatories, as well as their first and second derivatives (Figures 1B,C), respectively, estimated by convolution with the derivative of a 33 points Gaussian kernel with σ = 5, encompassing a 32 points window of the time series within ±3σ. The quality of data is not the same from the beginning of observations to the very recent ones, due to changes in instrumentation, measurements methodologies, sites etc. The same general trend is observed in both observatories, however, with a different secular variation rate over the considered interval.
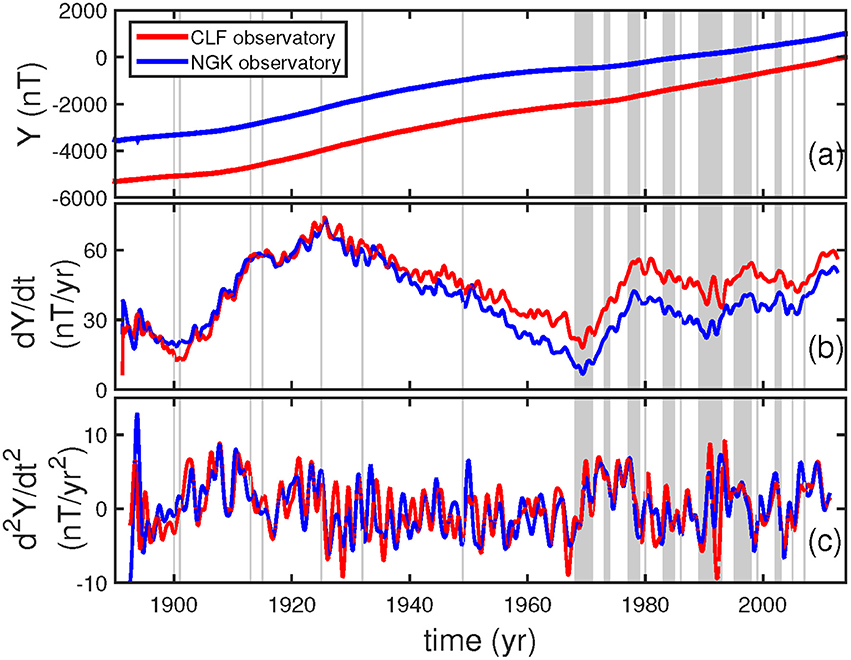
Figure 1. From top to bottom, (A) the evolution of the monthly means of the Y component of the geomagnetic field at CLF and NGK observatories (1890–2013) (B) the corresponding first time derivative of the Y component and (C) the corresponding second time derivative of the Y component, respectively. Single lines denote single jerk events while shaded areas denote time intervals that global jerks are centered following the jerk events identification by Brown et al. (2013).
3. Analysis Methods
Different complexity measures have been proposed during the growth of the scientific field of complex systems. Either as Boltzmann-Gibbs entropy, in physics, or as Shannon entropy, in information engineering, Boltzmann-Gibbs-Shannon entropy has long been considered as the main tool for the analysis of the complexity characteristics of a wide variety of systems and signals. However, during the last years, a growing interest for information has arisen in theoretical physics and interdisciplinary system/signal analysis leading to the definition of many different information / entropy metrics. We focus here on three quite popular complexity measures; namely, Boltzmann-Gibbs-Shannon entropy, Tsallis entropy and Fisher information. Entropy and information are considered complementary quantities, in the sense that lower complexity (indicating higher information content, higher order, lower ambiguity, lower randomness, etc.) corresponds to decrease of entropy and accordingly increase of information. In the following, basic theory and formulas concerning the employed complexity measures are briefly presented.
3.1. Boltzmann-Gibbs-Shannon Entropy
Let sk = s(tk) be a discrete measured variable, with tk = kT, k = 1, 2, …, K, and T being the sampling period. One can then define a set of N disjoint but adjacent intervals (bins) spanning the observed range of values of the time series {sk}, denoted as {xn}, n = 1, 2, …, N. Let also P = {p(x1), p(x2), …, p(xN)} be a finite discrete probability distribution, with , that describes the probabilities for the samples of the time series to belong to each one of these N bins; the probability for a sample of the time series to belong to the n − th bin can be denoted as p(xn). The informational content of the normalized probability distribution P is given by Shannon's information measure as Shannon (1948):
where Ksh, is a positive constant (it merely amounts to a choice of a unit of measure, however it is usually set to 1). The choice of a logarithmic base corresponds to the choice of a unit for measuring information (Shannon, 1948). Hsh has been forwarded by Shannon as a measure of information, choice and uncertainty.
This is often referred to as the Boltzmann-Gibbs-Shannon entropy, since the degree of disorder of a thermodynamic system is measured by the Boltzmann-Gibbs entropy, , where kB is the Boltzmann constant and pi stands for the probability for the system to be in its i − th microstate, that is the i − th cell of its phase space; W is the total number of possible microstates of the system (Shannon, 1948; Pathria, 1972; Lin and Ou, 2012). However, for brevity we will use the term “Shannon entropy” in the rest of the paper. The decrease in Shannon entropy is attributed to increase of the information content, of the order, or equivalently to decrease of complexity. Shannon entropy is recognized as a basic tool for the description of information behavior and complexity of physical, sociological, economic, technological, etc. systems and their observables, like time series of measurable quantities characterizing them.
3.2. Non-extensive Tsallis Entropy
Long-range spatial interactions or long-range memory effects may be observed in a vast variety of complex systems influencing their behavior. A very interesting class of such systems is formed by those characterized by non-extensive statistics. These systems share a very subtle property: they violate the main hypothesis of Boltzmann-Gibbs (B-G) statistics, i.e., ergodicity. Inspired by multifractals concepts, Tsallis (Tsallis, 1988, 1998, 2009; Abe and Okamoto, 2001) has proposed a generalization of the B-G statistical mechanics, which covers systems that violate ergodicity, systems the microscopic configurations of which cannot be considered as (nearly) independent. This generalization is based on non-additive entropies, Sq, characterized by an index q which leads to a non-extensive statistics (Tsallis, 2012),
where p(xi) are the probabilities associated with the value bins xi, as defined in Section 3.1, N is their total number and q is a real number. The value of q is a measure of the non-extensivity of the system. Notice, that in the limit q → 1 non-extensive statistics converges to the standard, extensive, B-G statistics (Abe and Okamoto, 2001).
The entropic index q characterizes the degree of non-extensivity reflected in the following pseudo-additivity rule, where A and B are statistically independent subsystems:
For subsystems that have special probability correlations, additivity
is not valid for SB−G, but may Equation (3) occur for Sq with a particular value of the index q. Such systems are referred to as non-extensive (Tsallis, 1998, 2009). Note also that, although Rényi entropy (Rényi, 1961) and Tsallis entropy seem to be connected by a simple transformation, they should not be confused since they correspond to different physics and are derived from different principles. Characteristically, Rényi entropy is an additive complexity measure like Shannon entropy in contrast to Tsallis entropy (Abe, 2002).
We clarify that the parameter q itself is not a measure of the complexity of the system but measures the degree of non-extensivity of the system. The value of q represents the strength of the long-range correlations governing the dynamics of the system (Lin and Ou, 2012). On the other hand, the time variations of the Tsallis entropy, Sq, for a given q quantify the dynamic changes of the complexity of the system. Lower Sq values characterize signals with lower complexity.
The cases q > 1 and q < 1, correspond to sub-extensivity, or super-extensivity, respectively. We may think of q as a bias-parameter: q < 1 privileges rare events, while q > 1 privileges prominent events (Zunino et al., 2008). In the case of noisy time series, the value of q is often selected such that the signal is better discriminated from the noise and this value of the entropic index is considered to be related to the (multi)fractal structure of the signal(s) under study, which in turn reflects the deep microscopic or mesoscopic (generically non-linear) dynamics in the phase space of the underlying system (Tsallis, 1998). However, if possible, the appropriate value of q should be selected by other independent means, like the best fit to models or distributions expressing the dynamics of the underlying system (Tsallis and de Albuquerque, 2000; Minadakis et al., 2012a,b; Potirakis et al., 2013; Vallianatos, 2013; Efstathiou et al., 2016; Michas et al., 2016).
3.3. Fisher Information
Fisher information was first introduced as a representation of the amount of information that can be extracted from a set of measurements (or the “quality” of the measurements) (Fisher, 1925; Mayer et al., 2006). Fisher information is also a powerful tool to investigate complex and non-stationary signals (Martin et al., 1999; Telesca et al., 2011), permitting the detection of significant changes in the behavior of non-linear dynamical systems and the characterization of complex signals generated by these systems (Martin et al., 1999, 2001; Vignat and Bercher, 2003).
Considering, here too, a finite discrete probability distribution defined for the real values of a time series (c.f. Section 2), the so called Fisher Information Measure (FIM) in its discrete form is most often (e.g., Martin et al., 1999, 2001; Humeau et al., 2008; Cabezas and Karunanithi, 2008) expressed as:
where p(xi) are the probabilities associated with the value bins xi, as defined in Section 3.1, N is their total number, while p(xn) and p(xn+1) are the probabilities corresponding to two successive bins.
FIM has been used as a measure of the state of disorder of a system or phenomenon, behaving inversely to entropy, that is when order increases, entropy decreases, while Fisher information increases (Mayer et al., 2006; Potirakis et al., 2011, 2012). Furthermore, Fisher information presents the so called “locality” property in contrast to the “globality” of entropy, referring to the sensitivity of FIM in changes in the shape of the probability distribution corresponding to the measured variable, not presented by entropy (Fath and Cabezas, 2004; Frieden, 2004; Mayer et al., 2006).
4. Results
The dynamics of complex signals are often revealed by locally estimating a complexity measure on a short time-window running along the whole length of the time series. The time series of the monthly means of the Y component of the geomagnetic field were studied by sliding time-windows of different lengths, specifically of 32, 64, and 128 consecutive data points, with a step of 1 data point. Note that the probability density function of each time-window of the processed time series, necessary for the complexity measures calculations, was approximated by a discrete probability distribution through binning (normalized histogram). Specifically, the simple linear binning was adopted; a fixed number of bins equispaced across the dynamic range of the processed data window, i.e., between the minimum and maximum values of the analyzed data excerpt, was used. Note that if empty bins exist, these are excluded renormalizing the frequency of appearance for the remaining number of bins. The optimum number of bins, for all three cases of 32/64/128 value time-windows and both time series was determined to be equal to 12 (Scott, 1979, 2015; Freedman and Diaconis, 1981). In estimating Tsallis entropy, the entropic index was considered to be equal to 1.8 (Balasis et al., 2011a,b). Note that the specific entropic index value provides an optimum discrimination of the analyzed magnetic time series from possible noise contamination in the sense that entropy changes are more clearly revealed. Moreover, it has been found that it might be a universal choice not only for the non-extensive study of geomagnetic data but in general for geophysics, space and solar physics, since it has been found to best fit the non-extensive study of magnetic storms, solar flares, earthquakes and pre-earthquake electromagnetic emissions (Balasis et al., 2011a,b). The results for the CLF and NGK datasets, covering the time period from January of 1890 to December of 2013, are presented in Figures 2–4 for the various sliding windows.
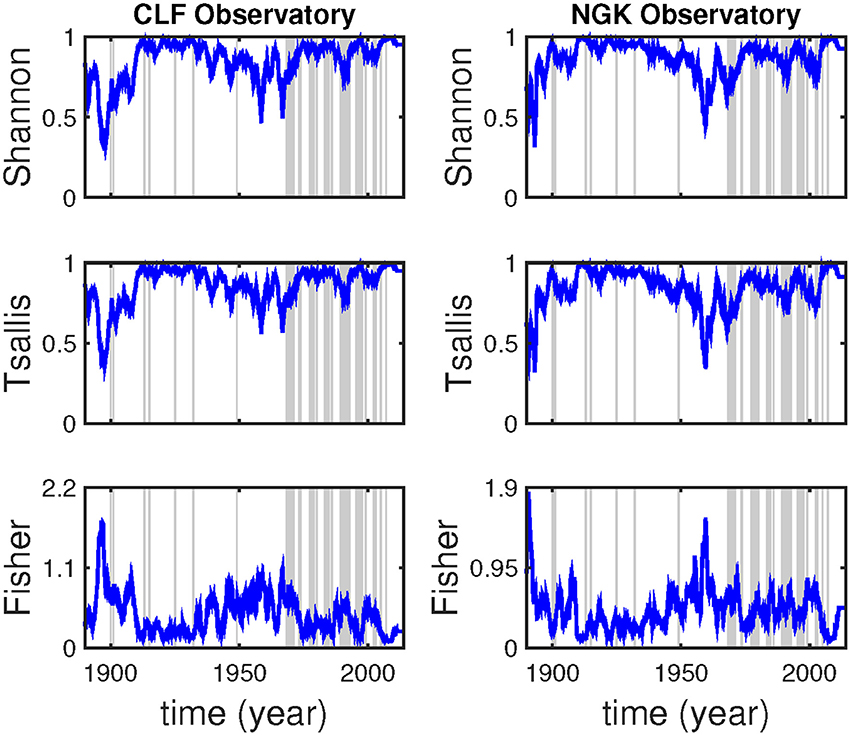
Figure 2. From top to bottom, Shannon entropy, Tsallis entropy and Fisher information for the monthly means of the Y component at CLF (left column) and NGK (right column) observatories using a sliding window of 32 points. Single lines denote single jerk events while shaded areas denote time intervals that global jerks are centered following the jerk events identification by Brown et al. (2013).
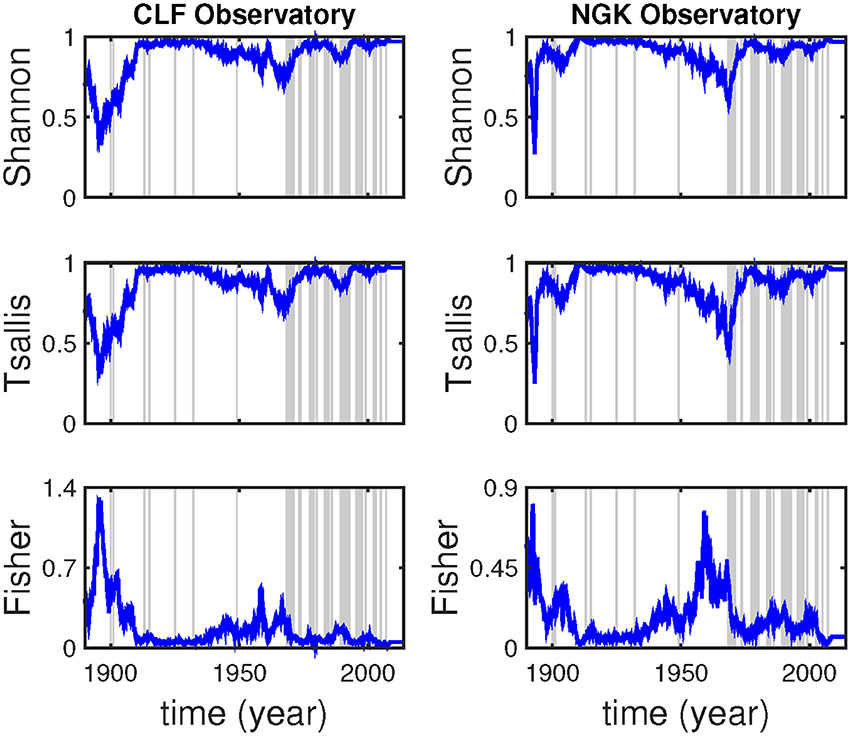
Figure 3. From top to bottom, Shannon entropy, Tsallis entropy and Fisher information for the monthly means of the Y component at CLF (left column) and NGK (right column) observatories using a sliding window of 64 points. Single lines denote single jerk events while shaded areas denote time intervals that global jerks are centered following the jerk events identification by Brown et al. (2013).
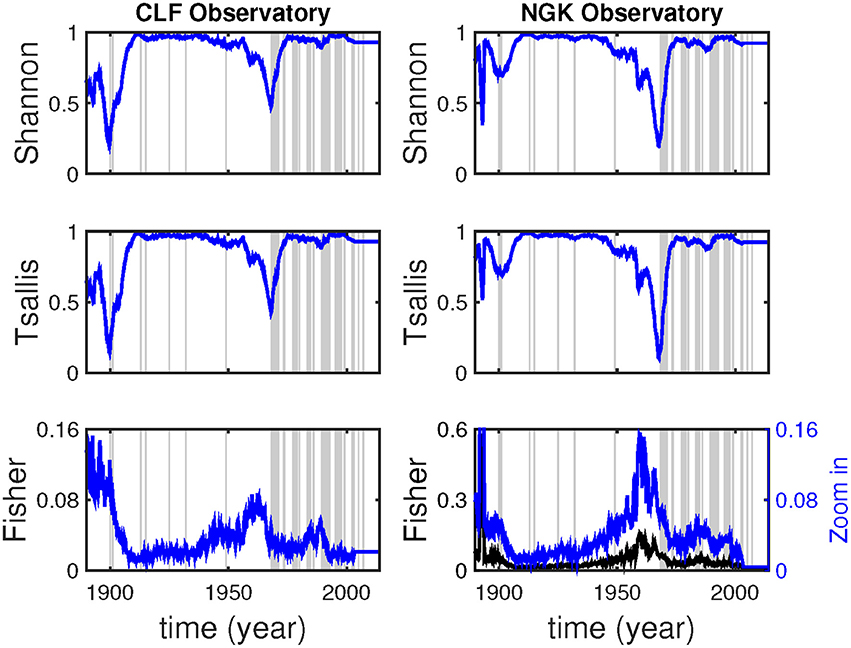
Figure 4. From top to bottom, Shannon entropy, Tsallis entropy and Fisher information for the monthly means of the Y component at CLF (left column) and NGK (right column) observatories using a sliding window of 128 points. Single lines denote single jerk events while shaded areas denote time intervals that global jerks are centered following the jerk events identification by Brown et al. (2013).
Brown et al. (2013) found relative peaks in the global number of jerk occurrences in 1968–1971, 1973–1974, 1977–1979, 1983–1985, 1989–1993, 1995–1998, and 2002–2003 with the suggestion of further poorly sampled events in the early 1960s and late 2000s. Moreover, they have identified a number of single geomagnetic jerks in 1900, 1901, 1913, 1915, 1925, 1932, 1949, 1969, 1971, 1978, 1979, 1980, 1986, 1991, 1992, 1999, 2003, 2005, 2007 based on a literature search (Table 1 of Brown et al., 2013). Building on the specific findings by Brown et al. (2013), we examine whether these events could be revealed by the complexity measures used in this study.
In Figure 2, where the results for the window of 32 months are presented, we note five prominent peaks after 1950 (minimums in both Shannon and Tsallis entropies and maximums in Fisher information) seen both at CLF and NGK around 1958 and in the time interval of 1968–1971 as well as in the intervals of 1989–1993, 1999–2000, and 2002–2003. The four time intervals identified here as candidates for jerk occurrences were also provided as global events identifiers in the study of Brown et al. (2013), while year 1958 was invoked only by a very few studies in the literature (e.g., Golovkov et al., 1989). We also observe four more noticeable common low complexity/ high information peaks in the time period from the start of our analysis period until 1950. These are found over the intervals 1896–1898, 1901–1902 and in 1908 and 1947; note that a global jerk in 1901 is mentioned in Brown et al. (2013). Apart from the shared standing out low complexity / high information peaks, the 32 months window analysis yields some further main peaks different between the two observatories, while the CLF shows less than the NGK. All the peaks which clearly discriminate from the background are summarized in Table 1. Note that, for almost all cases, minor low complexity / high information peaks are found in each observatory's analysis results in the place of the unary major peaks of the other one. Moreover, some minor peaks can be identified at epochs different of those mentioned in Table 1; some of them coincide with times when a geomagnetic jerk has been eventually denoted.
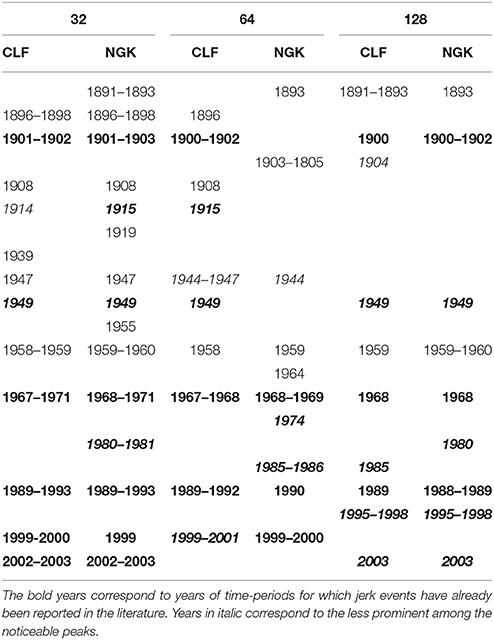
Table 1. Magnetic jerks revealed through Shannon entropy (Hsh), Tsallis entropy (Sq) and Fisher information (FIM) by analysing the CLF and NGK Y-component datasets for different lengths of sliding windows.
The temporal evolution of the complexity measures values shown in Figure 3, for an analysis window of 64 months, confirms the findings of Figure 2 at both observatories for the intervals of 1893–1896, 1900–1902, 1958–1959, 1967–1969, 1989–1992 and 1999–2000. The entropy results for the longest time-window used in this study (128 months) are depicted in Figure 4 and they are in good agreement with the peaks identified in Figure 2; note that, due to the length of the time-window we cannot make any inferences after 2003 for the 128 months window analysis.
The roughness of the complexity measures, as expected, is reduced for wider analysis windows (64 and 128 months long). As a result, fewer minor peaks are identifiable, while major peaks become more prominent. Furthermore, the change in the window length leads, in some of the cases, to slight temporal shift of the observed low complexity / high information regions. It is worth noting that, in several cases of already reported jerk occurrences the complexity calculated for the corresponding time periods is found to be lower than the background. However, lower complexity is also observed in years when no events have been reported in the literature. Interestingly, some of these complexity lows, like the 1958–1960, the 1891–1893 and the 1896–1898 ones, seem to be systematically revealed by the performed analyses, either in both (the 1958–1960 one) or in NGK observatory (the 1891–1893 and the 1896–1898 ones). It is worth mentioning that the 128 months window analysis of the NGK data reveals a strong singularity in 1893, which leads to an extremely high peak of the Fisher information measure, so high that almost masks all other high information peaks.
5. Conclusions and Discussion
The detection of dynamical complexity in time series originated from various complex systems is one of the foremost problems in science (including the disciplines of physics, medicine, and economics). In geophysics and in particular in the field of geomagnetism, accurate detection of the dissimilarity of complexity between normal and abnormal geomagnetic states (e.g., pre-jerk activity and magnetic jerks) could shed light on the origin and mechanisms associated with these events. In this paper, we analyze monthly means of the Y component of Earth's magnetic field at CLF and NGK observatories from 1890 to 2013 by introducing a variety of information measures in the search of appropriate and effective entropic quantities to study the complex character of the dynamics of the geomagnetic field. Shannon entropy, non-extensive Tsallis entropy and Fisher information sensitively show the complexity dissimilarity among different “physiological” (normal) and “pathological” (magnetic jerks) states. They imply the emergence of two distinct patterns: (1) a pattern associated with geomagnetic jerks, which is characterized by a higher degree of organization or lower complexity, and (2) a pattern associated with normal periods, which is characterized by a lower degree of organization or higher complexity.
The information measures used here have the ability to be directly applicable to the time series of the monthly geomagnetic observatory means without the need to calculate either their corresponding secular variation or acceleration. These information measures are not quantifiers of the intensity of the geomagnetic jerks but they actually reveal the dynamical complexity associated with the events, i.e., how the complexity or the degree of organization of the system Earth varies with time. Moreover, by analysing data from the two observatories we could claim that (a) some of the jerk occurrences have a more widespread character than others, since they have been observed at both places and (b) some events are associated with a far more ordered system than others, since their corresponding entropy variations attain extremely low values (c.f. the event identified just before the interval of 1968–1971). This fine characterization of the geomagnetic field can bring new elements in interpretation of its temporal variations, as geomagnetic jerks or rapid secular variation fluctuations (Mandea and Olsen, 2009).
Recent studies, Korte et al. (2009) and Qamili et al. (2013) investigate the second time derivative for characterizing geomagnetic jerks. We can invoke two specific issues linked to the use of the geomagnetic field second time derivative. Firstly, the second derivative, depending on the algorithm used to calculate it, may produce values characterized by large, fast variations, which mask the internal signal. Therefore, particular attention should be paid in selecting an appropriate algorithm in order to minimize these large variations side effect. Secondly, the second derivative is particularly susceptible to random instrumentation noise, especially if compared to dynamical complexity measures. Note that the observatory time series used in this study are characterized by different instrumentation noise over the considered period, with a clear progressing improvement with time (e.g., after the 50' s, the proton magnetometer was introduced for measuring the field intensity, while in the 80' s the DI-flux was also included in standard geomagnetic observatory practice for measuring the absolute values of declination and inclination), which may render the results of the second time derivative less reliable than the results of the complexity measures.
Methods for detection and characterization of geomagnetic jerks divide broadly into two categories, the fitting of piecewise polynomials (particularly straight line fits) and the application of wavelet analysis techniques. To obtain a more robust and unbiased detection and characterization of such events, wavelet analysis has been proposed, improved and applied (for details see Mandea et al., 2010). Wavelets are very useful to detect and date a jerk, without a priori information, and with high accuracy (within a couple of months, when series of monthly means are investigated). Here, we introduce another class of techniques for jerk detection based on entropy measures. The proposed method presents indeed the advantage to detect jerks with at least the same accuracy as the wavelet transforms. Besides, entropies offer the advantage to infer more robust analysis results in comparison to wavelets when dealing with unevenly spaced or gappy time series, since the scalogram representation suffers from edge effects mainly influencing the longer time scales (Torrence and Compo, 1998).
Future work will involve analysis of geomagnetic field data derived from observatories around the world using similar statistic quantifiers in order to assess the global character of jerk events. Moreover, magnetic satellite data will be considered from ESA's Swarm mission. Together with previous satellite data (Oersted, SAC-C, CHAMP) continuous models over the recent space magnetic missions will be proposed by different teams. We aim to investigate these models (e.g., CHAOS series—Finlay et al., 2015) and the potential of the various complexity measures to reveal magnetic jerk signatures in these long space observations. The proposed “magnetic virtual observatory” (Mandea and Olsen, 2006) will be again considered with an improvement in processing of the data (Saturnino et al., 2015).
Author Contributions
GB contributed to the development of the research idea, data processing, interpretation of the results and drafting the manuscript. SP contributed to the analysis of the data, interpretation of the results and drafting the manuscript. MM contributed to interpretation of the results and drafting the manuscript. All authors have approved the final version of the manuscript and take responsibility for all aspects of the work.
Funding
GB acknowledges support from the PROTEAS project within GSRT's KRIPIS action, funded by Greece and the European Regional Development Fund of the European Union under the O.P. Competitiveness and Entrepreneurship, NSRF 2007–2013 and the Regional Operational Program of Attica and from the European Union Seventh Framework Programme (FP7-REGPOT-2012-2013-1) under grant agreement no. 316 210 (BEYOND Building Capacity for a Centre of Excellence for EO-based monitoring of Natural Disasters).
Conflict of Interest Statement
The authors declare that the research was conducted in the absence of any commercial or financial relationships that could be construed as a potential conflict of interest.
Acknowledgments
The results presented here rely on data collected at magnetic observatories. We thank Institut de Physique du Globe de Paris (IPGP) and Bureau Central de Magnétisme Terrestre (BCMT) in France as well as Helmholtz-Centre Potsdam - GFZ German Research Centre for Geosciences (GFZ Potsdam) that operate and support CLF and NGK observatories, respectively. Additionally, we thank Achim Morschauser at GFZ Potsdam for providing NGK data used in this study.
References
Abe, S. (2002). Stability of Tsallis entropy and instabilities of Rényi and normalized Tsallis entropies: a basis for q-exponential distributions. Phys. Rev. E 66:046134. doi: 10.1103/PhysRevE.66.046134
Abe, S., and Okamoto, Y. (eds.). (2001). Nonextensive Statistical Mechanics and its Applications. Heidelberg: Springer-Verlag.
Balasis, G., Daglis, I. A., Anastasiadis, A., Papadimitriou, C., Mandea, M., and Eftaxias, K. (2011b). Universality in solar are, magnetic storm and earthquake dynamics using Tsallis statistical mechanics. Physica A 390, 341346. doi: 10.1016/j.physa.2010.09.029
Balasis, G., Daglis, I. A., Papadimitriou, C., Anastasiadis, A., Sandberg, I., and Eftaxias, K. (2011a). Quantifying dynamical complexity of magnetic storms and solar flares via nonextensive Tsallis entropy. Entropy 13, 1865–1881. doi: 10.3390/e13101865
Balasis, G., Daglis, I. A., Papadimitriou, C., Kalimeri, M., Anastasiadis, A., and Eftaxias, K. (2008). Dynamical complexity in Dst time series using non-extensive Tsallis entropy. Geophys. Res. Lett. 35, L14102. doi: 10.1029/2008GL034743
Balasis, G., Daglis, I. A., Papadimitriou, C., Kalimeri, M., Anastasiadis, A., and Eftaxias, K. (2009). Investigating dynamical complexity in the magnetosphere using various entropy measures. J. Geophys. Res. 114, A00D06. doi: 10.1029/2008ja014035
Balasis, G., Donner, R. V., Potirakis, S. M., Runge, J., Papadimitriou, C., and Daglis, I. A. (2013). Statistical mechanics and information-theoretic perspectives on complexity in the Earth system. Entropy 15, 4844–4888. doi: 10.3390/e15114844
Brown, W. J., Mound, J. E., and Livermore, P. W. (2013). Jerks abound: an analysis of geomagnetic observatory data from 1957 to 2008. Phys. Earth Planet. Inter. 223, 62–76. doi: 10.1016/j.pepi.2013.06.001
Cabezas, H., and Karunanithi, A. T. (2008). Fisher information, entropy, and the second and third laws of thermodynamics. Ind. Eng. Chem. Res. 47, 5243–5249. doi: 10.1021/ie7017756
Courtillot, V., Ducruix, J., and Le Moul, J. L. (1978). Sur une acclration rcente de la variationsculaire du champ magntique terrestre. C. R. Acad. Sci. Paris D 287, 1095–1098.
Efstathiou, A., Tzanis, A., and Vallianatos, F. (2016). Evidence of non extensivity in the evolution of seismicity along the San Andreas Fault, California, USA: an approach based on Tsallis statistical physics. Phys. Chem. Earth 85–86, 56–68. doi: 10.1016/j.pce.2015.02.013
Fath, R. D., and Cabezas, H. (2004). Exergy and Fisher information as ecological indices. Ecol. Modell. 174, 25–35. doi: 10.1016/j.ecolmodel.2003.12.045
Finlay, C. C., Olsen, N., and Toeffner-Clausen, L. (2015). DTU candidate field models for IGRF-12 and the CHAOS-5 geomagnetic field model. Earth Planets Space 67, 114. doi: 10.1186/s40623-015-0274-3
Fisher, R. A. (1925). Theory of statistical estimation. Math. Proc. Camb. Philos. Soc. 22, 700–725. doi: 10.1017/S0305004100009580
Freedman, D., and Diaconis, P. (1981). On the histogram as a density estimator: L2 theory. Probab. Theory Relat. Fields 57, 453–476.
Frieden, B. R. (2004). Cambridge, UK: Science from Fisher Information: A Unification. Cambridge University Press.
Gillet, N., Jault, D., Canet, E., and Fournier, A. (2010). Fast torsional waves and strong magnetic field within the earth's core. Nature 465, 74–77. doi: 10.1038/nature09010
Golovkov, V. P., Zvereva, T. I., and Simonyan, A. O. (1989). Common features and differences between “jerks” of 1947, 1958 and 1969. Geophys. Astrophys. Fluid Dyn. 49, 81–96. doi: 10.1080/03091928908243465
Holme, R., and de Viron, O. (2013). Characterization and implications of intradecadal variations in length of day. Nature 499, 202–204. doi: 10.1038/nature12282
Humeau, A., Trzepizur, W., Rousseau, D., Chapeau-Blondeau, F., and Abraham, P. (2008). Fisher information and Shannon entropy for on-line detection of transient signal high-values in laser Doppler flowmetry signals of healthy subjects. Phys. Med. Biol. 53, 5061–5076. doi: 10.1088/0031-9155/53/18/014
Korte, M., Mandea, M., and Matzka, J. (2009). A historical declination curve for Munich from different data sources. Phys. Earth Planet. Int. 177, 161–172. doi: 10.1016/j.pepi.2009.08.005
Lin, Q., and Ou, C. (2012). Tsallis entropy and the long-range correlation in image thresholding. Signal Process. 92, 2931–2939. doi: 10.1016/j.sigpro.2012.05.025
Mandea, M., Holme, R., Pais, A., Pinheiro, K., Jackson, A., and Verbanac, G. (2010). Geomagnetic jerks: rapid core field variations and core dynamics. Space Sci. Rev. 155, 147–175. doi: 10.1007/s11214-010-9663-x
Mandea, M., and Olsen, N. (2006). A new approach to directly determine the secular variation from magnetic satellite observations. Geophys. Res. Lett. 33, L15306. doi: 10.1029/2006GL026616
Mandea, M., and Olsen, N. (2009). Geomagnetic and archeomagnetic jerks: where do we stand? EOS Trans. AGU 90, 24. doi: 10.1029/2009EO240004
Martin, M. T., Pennini, F., and Plastino, A. (1999). Fishers information and the analysis of complex signals. Phys. Lett. A 256, 173–180.
Martin, M. T., Pereza, J., and Plastino, A. (2001). Fisher information and nonlinear dynamics. Physica A 291, 523–532. doi: 10.1016/S0378-4371(00)00531-8
Mayer, A. L., Pawlowski, C. W., and Cabezas, H. (2006). Fisher information and dynamic regime changes in ecological systems Ecol. Modell. 195, 72–82. doi: 10.1016/j.ecolmodel.2005.11.011
Michas, G., Vallianatos, F., and Sammonds, P. (2016). Statistical mechanics and scaling of fault population with increasing strain in the Corinth Rift. Earth Planet. Sci. Lett. 431, 150–163. doi: 10.1016/j.epsl.2015.09.014
Minadakis, G., Potirakis, S. M., Nomicos, C., and Eftaxias, K. (2012a). Linking electromagnetic precursors with earthquake dynamics: an approach based on nonextensive fragment and self-affine asperity models. Physica A 391, 2232–2244. doi: 10.1016/j.physa.2011.11.049
Minadakis, G., Potirakis, S. M., Stonham, J., Nomicos, C., and Eftaxias, K. (2012b). The role of propagating stress waves in geophysical scale: evidence in terms of nonextensivity. Physica A 391, 5648–5657. doi: 10.1016/j.physa.2012.04.030
Potirakis, S. M., Minadakis, G., and Eftaxias, K. (2012). Analysis of electromagnetic pre-seismic emissions using Fisher information and Tsallis entropy. Physica A 391, 300–306. doi: 10.1016/j.physa.2011.08.003
Potirakis, S. M., Minadakis, G., Nomicos, C., and Eftaxias, K. (2011). A multidisciplinary analysis for traces of the last state of earthquake generation in preseismic electromagnetic emissions. Nat. Hazards Earth Syst. Sci. 11, 2859–2879. doi: 10.5194/nhess-11-2859-2011
Potirakis, S. M., Zitis, P. I., and Eftaxias, K. (2013). Dynamical analogy between economical crisis and earth quake dynamics within the nonextensive statistical mechanics framework. Physica A 392, 2940–2954. doi: 10.1016/j.physa.2013.03.006
Qamili, E., De Santis, A., Isac, A., Mandea, M., Duka, B., and Simonyan, A. (2013). Geomagnetic jerks as chaotic fluctuations of the Earths magnetic field. Geochem. Geophys. Geosyst. 14, 839–850. doi: 10.1029/2012GC004398
Rényi, A. (1961). “On measures of information and entropy,” in Proceedings of the Fourth Berkeley Symposium on Mathematics, Statistics and Probability, (Berkeley, CA) 547–561.
Saturnino, D., Langlais, B., Civet, F., Th'ebault, E., and Mandea, M. (2015). Main field and secular variation candidate models for the 12th IGRF generation after 10 months of Swarm measurements. Earth Planets Space 67:96. doi: 10.1186/s40623-015-0262-7
Scott, D. W. (1979). On optimal and data-based histograms. Biometrika 66, 605–610. doi: 10.1093/biomet/66.3.605
Scott, D. W. (2015). Multivariate Density Estimation: Theory, Practice, and Visualization, 2nd Edn. Hoboken, NJ: John Willey & Sons.
Shannon, C. E. (1948). A mathematical theory of communication. Bell Syst. Tech. J. 27, 379–423, 623–656. doi: 10.1002/j.1538-7305.1948.tb01338.x
Telesca, L., Lovallo, M., Hsuc, H.-L., and Chenc, C.-C. (2011). Analysis of dynamics in magnetotelluric data by using the FisherShannon method. Physica A 390, 1350–1355. doi: 10.1016/j.physa.2010.12.005
Torrence, C., and Compo, G. P. (1998). A practical guide to wavelet analysis. Bull. Am. Meteorol. Soc. 79, 61–78. doi: 10.1175/1520-0477(1998)079<0061:apgtwa>2.0.co;2
Torta, J. M., Pavn-Carrasco, F. J., Marsal, S., and Finlay, C. C. (2015). Evidence for a new geomagnetic jerk in 2014. Geophys. Res. Lett. 42, 7933–7940. doi: 10.1002/2015GL065501
Tsallis, C. (1988). Possible generalization of Boltzmann-Gibbs statistics. J. Stat. Phys. 52, 479–487. doi: 10.1007/BF01016429
Tsallis, C. (1998). Generalized entropy-based criterion for consistent testing. Phys. Rev. E, 58, 1442–1445. doi: 10.1103/PhysRevE.58.1442
Tsallis, C. (2009). Introduction to Nonextensive Statistical Mechanics, Approaching a Complex World. New York, NY: Springer.
Tsallis, C. (2012). Nonadditive entropy Sq and nonextensive statistical mechanics: applications in geophysics and elsewhere. Acta Geophys. 60, 502–525. doi: 10.2478/s11600-012-0005-0
Tsallis, C., and de Albuquerque, M.P. (2000). Are citations of scientific papers a case of nonextensivity? Eur. Phys. J. B13, 777–780. doi: 10.1007/s100510050097
Vallianatos, F. (2011). A non extensive statistical physics approach to the polarity reversals of the geomagnetic field. Phys. A Stat. Mech. Appl. 390, 1773–1778. doi: 10.1016/j.physa.2010.12.040
Vallianatos, F. (2013). On the statistical physics of rockfalls: a non-extensive view. Eur. Phys. Lett. 101:10007. doi: 10.1209/0295-5075/101/10007
Vallianatos, F., and Telesca, L. (2012). Statistical mechanics in earth physics and natural hazards (editorial). Acta Geophys. 60, 499–501. doi: 10.2478/s11600-012-0037-5
Vignat, C., and Bercher, J.-F. (2003). Analysis of signals in the FisherShannon information plane. Phys. Lett. A 312, 27–33. doi: 10.1016/S0375-9601(03)00570-X
Keywords: Earth's magnetic field, geomagnetic observatories, geomagnetic jerks, dynamical complexity, information measures, Shannon entropy, non-extensive Tsallis entropy, Fisher information
Citation: Balasis G, Potirakis SM and Mandea M (2016) Investigating Dynamical Complexity of Geomagnetic Jerks Using Various Entropy Measures. Front. Earth Sci. 4:71. doi: 10.3389/feart.2016.00071
Received: 26 January 2016; Accepted: 15 June 2016;
Published: 30 June 2016.
Edited by:
F. Javier Pavón-Carrasco, Universidad Complutense de Madrid, SpainReviewed by:
Filippos Vallianatos, Technological Educational Institute of Crete, GreeceRamon Egli, Central Institute for Meteorology and Geodynamics, Austria
Vincenzo Lapenna, National Research Council of Italy - Institute of Methodologies for Environmental Analysis, Italy
Copyright © 2016 Balasis, Potirakis and Mandea. This is an open-access article distributed under the terms of the Creative Commons Attribution License (CC BY). The use, distribution or reproduction in other forums is permitted, provided the original author(s) or licensor are credited and that the original publication in this journal is cited, in accordance with accepted academic practice. No use, distribution or reproduction is permitted which does not comply with these terms.
*Correspondence: Georgios Balasis, Z2JhbGFzaXNAbm9hLmdy