
94% of researchers rate our articles as excellent or good
Learn more about the work of our research integrity team to safeguard the quality of each article we publish.
Find out more
ORIGINAL RESEARCH article
Front. Earth Sci. , 09 June 2016
Sec. Earth and Planetary Materials
Volume 4 - 2016 | https://doi.org/10.3389/feart.2016.00064
The monazite-type solid solution of LaPO4 and EuPO4 has been studied by X-ray diffraction, infrared (IR) and Raman spectroscopic techniques. A substantial excess molar volume has been derived from the X-ray data, and the Raman and IR spectra show band broadening typical for mixing of cations of different size on the cation sublattice. The IR spectra were interpreted by the autocorrelation method and the excess autocorrelation parameter Δcorrex shows clear deviation from ideal solution behavior, similar to the observed broadening of the Raman bands. The results can be interpreted in terms of local lattice strains resulting from the ion size effects of substitution of La3+ by Eu3+, and correlate very well with calorimetric measurements of the excess enthalpy that was previously measured.
Three type of materials are generally studied for the immobilization of nuclear waste: glasses, polyphase ceramics, and monophase ceramics (Ewing and Lutze, 1991). The first two are considered for the treatment of high-level waste such as multi-isotope solutions. The latter are aimed at specific conditioning of separated radioactive elements for which further treatment or use in the nuclear fuel cycle, such as, for example, the destruction by transmutation, is not suited. Mineral-based phases such as pyrochlore and zirconolite are considered for the immobilization of actinides like plutonium, americium, and curium (Ewing, 2005). Monazite, a well known naturally occurring rare-earth orthophosphate, is also a very promising host phase for the immobilization of actinides (McCarthy et al., 1978). Natural monazite was found to be very stable against radiation damage from the alpha decay of the incorporated actinides. Therefore, natural monazites are seldom found in a metamict state (Boatner and Sales, 1988; Ewing and Wang, 2002). Monazite compounds are also very stable against attack by aqueous solutions, in particular more stable than nuclear waste silicate glasses, which has been confirmed by laboratory corrosion tests in aqueous solutions (Sales et al., 1983; Boatner et al., 1984).
The idealized chemical formula of monazite is LnPO4, where Ln represents the trivalent lanthanide ions from La to Gd (Ni et al., 1995; Clavier et al., 2011). Monazite crystallizes in the monoclinic space group P21/n with four formula units per unit cell. The atomic arrangement is based on a nine-fold coordination of the lanthanide atom and is usually described as an equatorial pentagon that is formed by five oxygen atoms belonging to the monodentate tetrahedra. The pentagon is interpenetrated by a tetrahedron that is built by four oxygen atoms belonging to two bidentate tetrahedra. The PO4 tetrahedra located out of the equatorial plane could then be envisaged as a link between the LnO9 polyhedra, leading to the formation of infinite chains along the [001] direction. Also the orthophosphates of the trivalent actinides adopt the monazite structure (Bjorklund, 1958; Popa et al., 2015) and therefore plutonium, americium, and curium could be incorporated in a monazite host. These transuranium elements exhibit spontaneous fission and therefore addition of a neutron poisson is desirable. A monazite-based nuclear waste host phase could thus be considered as a ternary mixture of three end members of a (Ln, Ln*,An)PO4 solid solution series: the actinide component (An), e.g., PuPO4, AmPO4 or CmPO4, a neutron poisson (Ln*), generally GdPO4 as gadolinium has an extremely high neutron capture cross section, and the matrix component (Ln), likely one of the early lanthanides.
Little is known about the physical and thermodynamic properties of such monazite solid solutions, even for simple compositions containing only trivalent lanthanide ions. Although it is not unlikely that such solid solutions will exhibit close to ideal behavior (no excess enthalpy, only configurational entropy), the wide range of ionic radii in the trivalent lanthanide and actinide series could lead to deviations. This is the result of the mismatch of the size of the substituting ions, which is believed to be a cause for a non-ideal behavior of regular solid solutions. The size mismatch will result in local elastic lattice strain that is accompanied by an energetic penalty (positive excess enthalpy), which will also affect the stability of a monazite waste form in aqueous solutions. However, apart from the kinetic effect resulting from cation disorder at the mineral surface, the thermodynamic properties of a monazite solid solution govern its solubility in aqueous solutions and thus the equilibration path of a monazite solid solution (such as those containing radioactive elements) in contact with an aqueous solution. Experimental data is also needed to test simulation codes for modeling the thermodynamic properties of solid solutions. Simulation codes are important for studying complex systems that are difficult to investigate experimentally, as for example discussed by Li et al. (2014).
X-ray diffraction analyses can yield information on molar volumetric properties of solid solutions (Kerrick and Darken, 1975), but it is not easy to derive information on lattice strain in polycrystalline materials with this technique. Since the length scale of the strain fields overlaps with that of phonons, lattice stain effects can be studied very well by vibrational spectroscopy and can be related to thermodynamic and elastic properties of solid solutions (Boffa Ballaran et al., 1999; Geisler et al., 2005). In the present paper we report the results of infrared and (IR) Raman spectroscopic as well as X-ray analyses of the (La1−x Eux) PO4 solid solution series with 0 < x < 1, which exhibit almost the largest mismatch in the rare earth monazite series. Only gadolinium would have had a larger effects, but during several synthesis trials we observed that traces of a xenotime phase, typical for the heavy rare-earth orthophosphates, are always present in samples of that compound, making its study difficult. We therefore concentrated our investigations in the beginning on the (La1−x Eux) PO4 solid solution series for which thermodynamic data, indicating an excess energy of mixing, are already available (Popa et al., 2006b).
The end members as well as nine compositions of the solid solution were prepared by sol-gel reaction (Popa and Konings, 2006; Popa et al., 2006b). Eu2O3 (Merck, 99.99%) and La(NO3)3·6H2O (Alfa Aesar, 99.9%) were used as starting materials, respectively. For the solid solutions Eu2O3 was dissolved in excess of HNO3 and subsequently a defined amount of La (NO3)3· 6H2O was added. An excess of H3PO4 (Merck, 85%) ((Eu3+ + La3+)/ 1–1.2) was added dropwise under continuous heating (70°C) and stirring; this initiated the precipitation of a white gel. After 1 h a concentrated ammonia solution was added till pH = 5, at which point (La1−xEux) PO4 formed. The gels were filtered (Robu Glass no. 5 filtering crucibles) and the white precipitates were washed several times. After drying in air, the powders were calcined at 1100°C for 16 h under air in alumina crucibles.
The solid solution compounds were characterized at room temperature by X-ray powder diffraction (XRD) at the Institute for Transuranium Elements, Germany, using a Bruker D8 diffractometer mounted in a Bragg-Brentano configuration with a curved Ge (1, 1, 1) monochromator, a ceramic copper tube (40 kV, 40 mA) equipped with a LinxEye position sensitive detector. The data were collected by step scanning in the angle range 10° ≤ 2Θ ≤ 120° at a 2Θ step size of 0.02°. For the measurement, the powder was deposited on a silicon wafer to minimize the background and dispersed on the surface with several drops of isopropanol. To obtain the lattice parameter, thirty five diffraction peaks were individually fitted using Voigt functions along with a constant background. After indexing the diffraction peaks based on a monoclinic cell, the lattice parameters were refined on the basis of a triclinic cell using the least-squares method of Holland and Redfern (1997) that is implemented in the program UnitCell (http://www.esc.cam.ac.uk/research/research-groups/holland/unitcell). The zero shift of the spectrometer was also included in the refinement procedure. Between 25 and 35 reflections were used in the final refinement procedure after the detailed regression diagnostics of the UnitCell program was used to identify the most deleterious or influential diffraction peak positions affecting the overall fit. In all cases the alpha and gamma angle was 90° within the limit of their errors, as expected for a monoclinic cell (Table 1). Furthemore, the lattice parameter agree very well with the median of literature values (Figure 1; Table 1), evidencing a good accuracy of our data.

Table 1. The lattice parameters of the (La1−xEux)PO4 solid solution determined in this study in comparison with the median values obtained from literature data for the end members.
Raman spectroscopy measurements were conducted with a high-resolution LabRam HR800 Raman system at the University of Münster, Germany, and at the Steinmann Institute of the University of Bonn, Germany, using a solid state Nd:YAG (532 nm) and a He-Ne (632 nm) laser. However, all measurements presented here were obtained with the 632 nm excitation at room temperature, since the 532 nm excitation yielded severe fluoresence signals in the measured frequency range between 50 and 1150 cm−1 for Eu-bearing compounds. Although of less intensity, laser-induced fluorescence bands are also visible in spectra excited by the 632 nm laser. They were identified by the comparison with the spectra excited with 532 nm laser (not shown here). The sample powder was pressed into a small sample container and measured with a 10 times objective with a numerical aperture of 0.4. Five measurements were made on each sample. The scattered Raman light was collected in backscattering geometry and dispersed by a grating of 1800 grooves/mm after having passed a 100 μm entrance slit, resulting in a spectral resolution of better than 2 cm−1 in the frequency range of interest. The scattered light was then detected with a charged-couple device (CCD) detector. The spectrometer was calibrated against the Rayleigh line and the silicon band at 520.7 cm−1. The individual bands were fitted using Gauss-Lorentz functions. The error of the band maxima and the full width at half maximum (Γ) from the least-squares fit was usually significantly smaller than 0.5 and 1.0 cm−1, respectively.
The conventional pellet technique was used to measure the far infrared (FIR) and mid infrared (MIR) absorption of the solid solution series. For this, one part of the powder was thoroughly mixed for 5 min in a agate motar with 300 parts of dry and pure CsI or KBr for measurements in the MIR and FIR region, respectively. 300 mg of this mixture were then used to press 13 mm disc-shaped pellets under vacuum and room temperature. All pellets, including the blank reference CsI and KBr pellets, were prepared, stored, and measured under identical conditions to ensure high spectrum quality. The KBr and CsI pellets were measured for FIR and MIR absorption with a Bruker IFS 66v spectrometer at the University of Münster, Germany, within 12 h (stored in an exicator) after their creation. A DTGS detector, coupled with a KBr beam splitter and a Globar source, was used to record the spectra between 450 and 4500 cm−1, whereas a DTGS detector with a polyethylene window, coupled with a mercury lamp and a 3.5 μm Mylar beam splitter, was used for the frequency region between 130 and 700 cm−1. Each spectrum was calculated by Fourier transformation of 512 interferometer scans and recorded as absorbance. The spectral resolution was 2 cm−1.
The results of the X-ray diffraction measurements of the end-members and the intermediate compositions of the (La1−x Eux)PO4 solid solution are summarized in Table 1. As shown in Figure 1 the lattice parameters a, b, c, and β vary regularly, though not linearly with the composition of the solid solution. The molar volume derived from the determined lattice parameters is also plotted in Figure 1 as a function of the molar composition together with the excess volume calculated from the difference between the experimental values and those obtained by linear interpolation between the end-members. The results show a slight, but systematic excess volume Vexs with a maximum close to x = 0.5. Therefore, the regular solid solution model of the form
where W is the volume excess parameter and x the mole percent of EuPO4, has been fitted to the data using the inverse of the square root of the experimental errors as weighting factors (red curve in Figure 1D), yielding a W value of (1.98±0.45) × 104(2σ). Our results are in good agreement with the result of George et al. (2014), who found a very similar variation of the lattice parameters, and hence of the molar volume. However, their overall excess molar volume is slightly larger than that determined in this work. Moreover, Babelot (2013) reported the lattice parameters of the (La1−xEux)PO4 solid solution, which also clearly indicate a positive excess molar volume. A weighted fit of the regular solid solution equation to all data from this study and those of Babelot (2013) and George et al. (2014) yields W = (2.88±0.65) × 104(2σ) (green curve in Figure 1D). In this case, however, since the large scatter is clearly in excess of the pure experimental error, we iteratively estimated the individual weighting factors used in the least-squares fit by computing the inverse of the squared deviates between the measured and the iteratively estimated Vexs. Such procedure assumes that the error of the composition is neclectible. However, it has the advantage that far outlying Vexs values have less influence on the fit. The value of (2.88±0.65) × 104 can therfore be considered as the currently best estimate for the volume excess parameter W of the (La1−xEux)PO4 solid solution series.
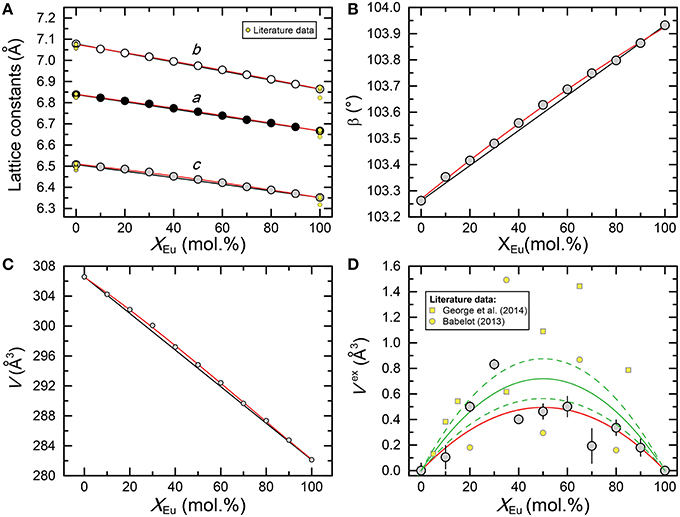
Figure 1. Plot of (A) the lattice parameters (a, b, and c), (B) the beta angle, (C) the molar volume (V), and (D) excess molar volume (Vex) of the (La1−xEux)PO4 solid solution series as a function of composition xEu. Black lines in (A–C) connect end member values, whereas the red curves represent parabolic least-squares fits to the data. In agreement with data from Babelot (2013) and George et al. (2014), the data clearly indicate an excess volume with respect to the volume of a physical mixture. The red curve in (D) represents a least-squares fit of the regular solid solution model (Equation 1) to the data determined in this study, whereas the solid and stippled green curves represent a least-squares fit of Equation 1 to all data points including the data from Babelot (2013) and George et al. (2014) and its 95% confidence interval, respectively. See text for more details about how the least-squares fits were performed.
In the monoclinic monazite structure oxygen and phosphorus form a isolated PO4 tetrahedra which are connected by polyhedra of Ln3+ ions in a ninefold oxygen coordination. As discussed by Begun et al. (1981), Silva et al. (2006), and more recently by Ruschel et al. (2012), the bands for the pure monoclinic lanthanide orthophosphates can be assigned to the fundamental modes of the PO4 units and the lattice modes. A free tetrahedron has a Td symmetry resulting in four normal degenerate fundamentals (ν1 to ν4) with nine vibration degrees of freedom, all being Raman active. In the monazite structure, however, the local site symmetry of phosphorus is reduced to C2h and the number of active internal modes increases. Factor group analysis yields following species of the optical modes for monazite structure: Γ = 18Ag + 17Au + 18Bg + 16Bu. Thus, a total of 36 Raman-active modes (Ag + Bg) is expected in the Raman spectrum, whereas 33 modes (Au + Bu) are predicted to occur in the IR spectrum. The assignment of individual Raman and IR bands of monazite compounds to specific vibrational modes of distinct symmetry is still somewhat controversial and discussed in more detail in Hezel and Ross (1966), Begun et al. (1981), Silva et al. (2006), and Ruschel et al. (2012). In the present work, however, we are mainly concerned with the effect of the substitution of La by Eu on the dumping of the fundamental Raman vibrations.
The Raman spectra of (La1−x Eux) PO4 in the 50–1100 cm−1 range are shown in Figure 2. From the predicted 36 modes, 27 Raman modes could be detected between 50 and 1100 cm−1 (Table 2) from which 17 modes could be followed throughout the solid solution series (Figure 2; Table 2). The Raman band maxima (frequencies) and the band broadening, Γ, given as full width at half maximum, was determined by fitting Gauss-Lorentz functions along with a linear background to the individual bands or closely clustering bands within suitable wavenumber regions of the Raman spectra. The present results are in excellent agreement with those of Silva et al. (2006) and Begun et al. (1981) for LaPO4 and EuPO4 single crystals (Table 2). We observe the ν4(PO4) asymmetric bending modes, the ν3 asymmetric P–O stretching modes, the symmetric ν2(PO4) bending modes, and the most intense symmetric ν1(PO4) stretching mode between 967 and 988 cm−1, as well as the lattice modes below 420 cm−1. In the (La1−xEux)PO4 solid solution these bands show a small, though regular shift toward higher frequency with increasing EuPO4 content of the solid solution (Figure 3), reflecting the shortening of the mean Ln-O bond distance and increasing force constant, resulting from the shorter ionic radius of Eu3+ compared to La3+. However, the intermediate compounds show significant stronger line broadening than the end members. For that reason we plotted the band width, expressed as the full width at half maximum (Γ), of all observed Raman modes that can confidently be traced throughout the (La1−xEux)PO4 solid solution series as a function of x (Figure 4). The broadening for both internal PO4 and the lattice modes exhibit a clear maximum close to x = 0.5. In Figure 4D we plotted the excess broadening as a function of the mode frequency, which clearly shows that most lattice modes exhibit significantly larger excess broadening than the internal PO4 modes. Among the internal PO4 modes, the stretching modes exhibit stronger broadening than the bending modes. Some bending modes are not significantly broadened at all. It is noteworthy that we do not observe different broadening between modes of the two symmetry species Ag and Bg.
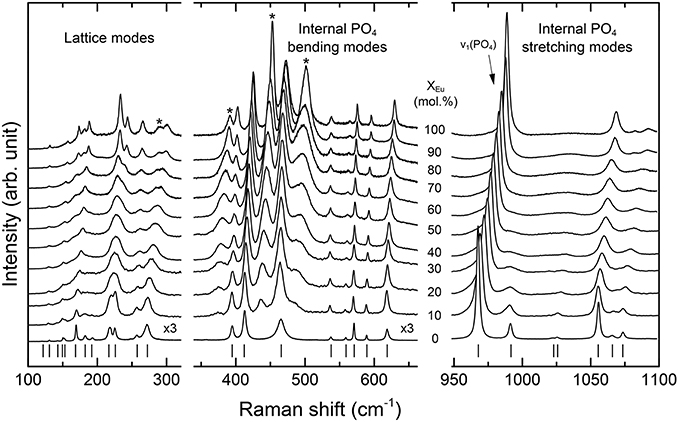
Figure 2. Raman spectra of the (La1−xEux)PO4 solid solution series. Note that the intensity of the low frequency spectra (100–600 cm−1) is multiplied by a factor of three. Laser-induced fluorescence bands are marked with a star.
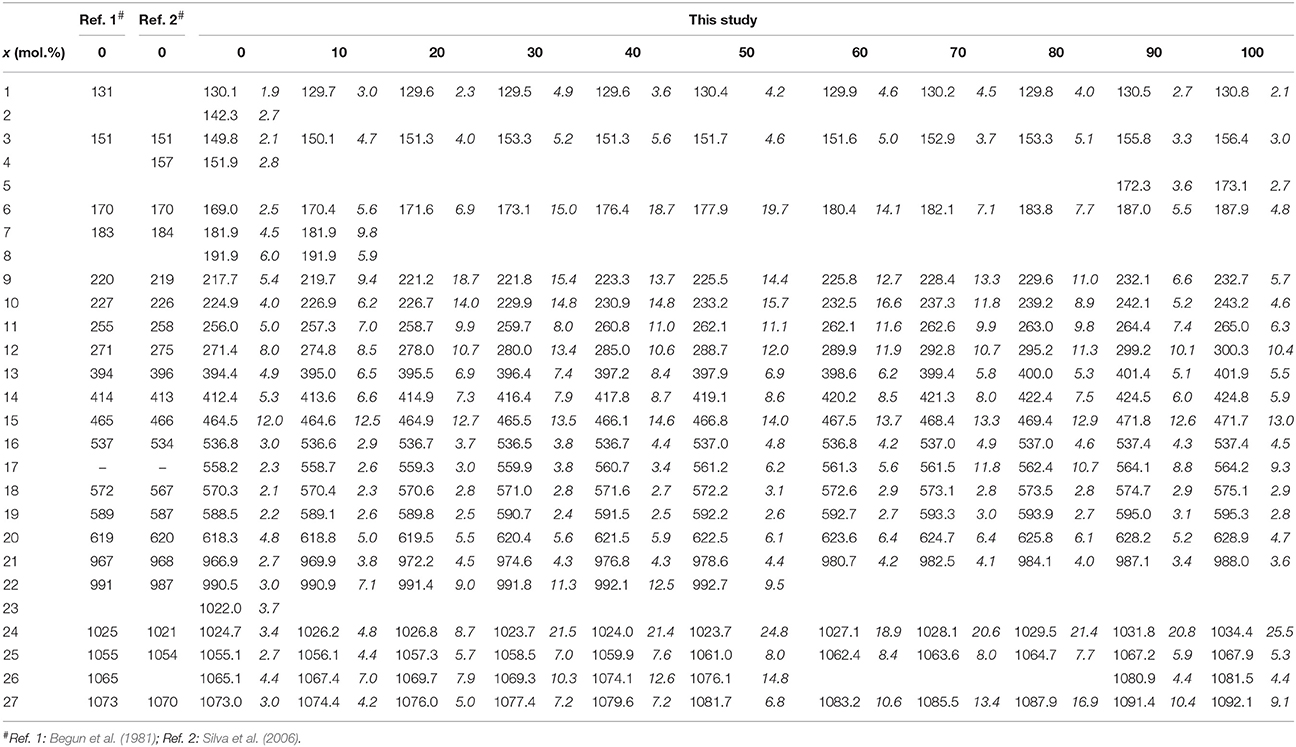
Table 2. The observed frequencies and widths (in italic) of the Raman bands of the (La1−xEux)PO4 solid solution (in cm−1).
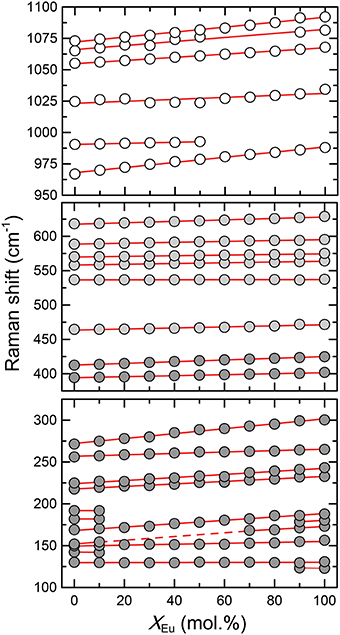
Figure 3. The relationship between the Raman mode frequencies and the composition (xEu) of the (La1−xEux)PO4 solid solution series. Dark gray, light gray, and white shaded circles represent the lattice modes, internal PO4 bending, and internal PO4 stretching modes, respectively. Red lines represent linear least-squares fit to the data.
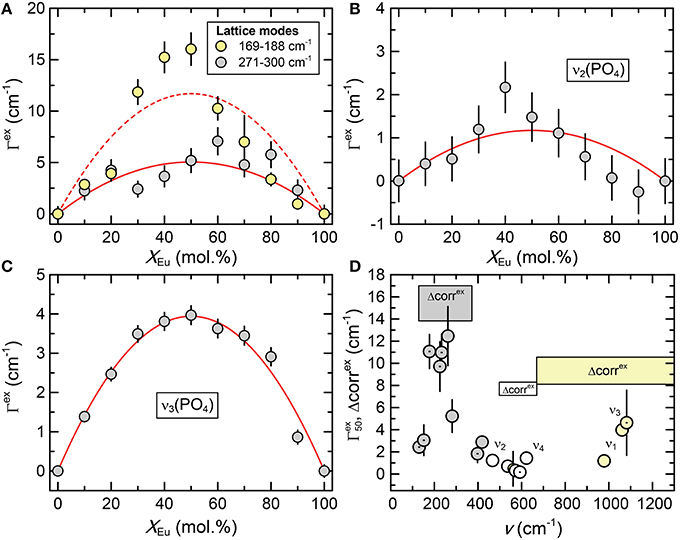
Figure 4. (A–C) The excess broadening (Γex) of Raman bands of the (La1−xEux)PO4 solid solution series as a function of composition (xEu). Dark gray, light gray, and white shaded circles represent the lattice modes, internal PO4 bending, and internal PO4 stretching modes respectively. The red curves represent least-squares fits of Equation 1 to the data. (D) The excess broadening at x = 50 mol.% () for all Raman bands as a function of mode frequency. The dotted and undotted symbols mark modes with Bg and Ag symmetry, respectively. The results of the autocorrelation analysis (parameter Δcorrex) of the IR spectra are also shown for comparison, revealing a similar trend with a minimum for the frequency range of the PO4 bending modes.
In addition to Raman modes, four new bands can be identified in the Raman spectrum in the 350-550 cm−1 range in those solid solutions containing Eu (marked by stars in Figure 2). The intensity increases with increasing EuPO4 content. These observations along with the observation that they are not recorded in the Raman spectra excited with a 532 nm laser (not shown here) confirm that they are related to laser-induced excitation of the Eu3+ ground state to higher levels of the 4f-manifold, i.e., electronic 4f transitions. They also exhibit an excess broadening when plotted against composition with a maximum close to x = 0.5. However, a discussion of the luminescence features is beyond the scope of this contribution.
The infrared spectra of the (La1−xEux)PO4 solid solution in the 370-1500 cm−1 range are shown in Figure 5. The spectra are characterized by broad and overlapping bands between 130 and 370, 500 and 670, and between 900 and 1200 cm−1, comprising the lattice modes, the internal PO4 bending modes, and the PO4 stretching modes, respectively. The results are in good agreement with previous infrared spectroscopic study of Hezel and Ross (1966) (Table 3). We observed 17 band maxima from which 14 can be traced through the solid solution series (Figure 6). The band maxima were identified with an error in the order of ±0.5 cm−1 by calculating the first derivative of the measured spectra. With the exception of the ν4(PO4) band near 622 cm−1 (LaPO4 end member), the traceable infrared bands show, as the Raman frequencies, a regular linear shift to higher wavenumbers with increasing EuPO4 content of the solid solution. The frequency of the ν4(PO4) band maximum, however, remains almost constant until 60 mol.% EuPO4 is incorporated in LaPO4 from where the band maximum starts to increase to ~ 632 cm−1 in the EuPO4 end member. This trend is also clearly visible in the IR spectra (see red line in Figure 5) and is thus not an artifact of the data analysis. However, in the EuPO4 end member this band clearly shows a small shoulder (Sh in Figures 5, 6), suggesting that it is composed of at least two bands of similar intensity that strongly overlap.
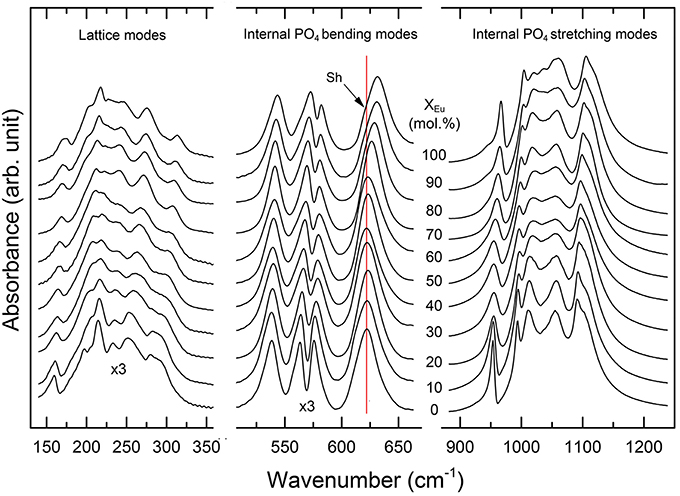
Figure 5. Infrared spectra of the (La1−xEux)PO4 solid solution series. Note that the absorption of the low frequency spectra (100–600 cm−1) is multiplied by a factor of three. The red line marks the position of the ν4(PO4) band near 622 cm−1 in the spectra of the LaPO4 end member. A splitting of the 622 cm−1 band is observed for compounds with xEu > 60 mol%, as indicated by the formation of a shoulder (sh) at the low wavenumber side.
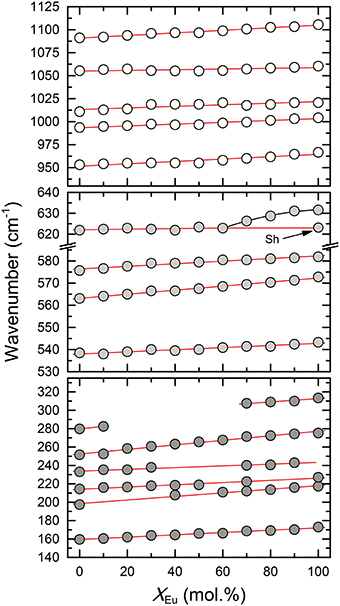
Figure 6. The relationship between the IR mode frequencies and composition (xEu) of the (La1−xEux)PO4 solid solution series. Dark gray, light gray, and white shaded circles represent the lattice modes, internal PO4 bending, and internal PO4 stretching modes, respectively. Sh marks the position of a shoulder of the 622 cm−1 band (cf. Figure 5). Red lines represent linear least-squares fit to the data.
The broadening of infrared bands cannot be determined precisely by least-squares fitting due to strong overlapping of partly asymmetric bands. For that reason we have determined the band width variation across the (La1−xEux)PO4 solid solution by autocorrelation analysis (Salje et al., 2000) of the three frequency regions: 130–370 cm−1, 500–670 cm−1, and 670–1300 cm−1. These regions were chosen for autocorrelation analysis, because a linear background could be readily fitted and because they exclusively involve the lattice modes, the internal PO4 bending modes, and the PO4 stretching modes, respectively. The autocorrelation method is based on extracting the extent of band broadening in IR spectra that are often asymmetric and overlapping, and provides information on phase transitions, cation mixing in solid solutions, and atomic order-disorder (Salje et al., 2000; Tarantino et al., 2002; Boffa Ballaran and Carpenter, 2003; Etzel and Benisek, 2008; Koch-Müller et al., 2012) and provides a symmetric rendering of complex infrared spectra from which an average band width is determined. It correlates a spectrum with itself, but offset in successive frequency increments over the frequency range of interest. The parameter of interest, Δcorr, is the width of the autocorrelation function at the limit of zero frequency shift, i.e., at its maximum. It can be considered as average broadening of IR bands within the given frequency range. A detailed discussion and useful examples of the autocorrelation method can be found in Salje et al. (2000). In this study it is used as an independent method of studying the effect of mixing in the(La1−xEux)PO4 solid solution series on broadening of the IR modes.
As shown in Figure 7 the autocorrelation analysis also yields a strong non-linear variation of the autocorrelation parameter Δcorr, with a maximum around x = 0.5, similar to the Raman results. The excess autocorrelation parameter Δcorrex is of the same magnitude for the internal PO4 bending and stretching modes, but is about twice as high for the lattice modes around the Ln metal. A comparison of the infrared broadening with the broadening of the Raman modes reveals a similar trend for both Raman and infrared modes (Figure 4D). The larger broadening of the lattice mode is expected as the accommodation of the crystal lattice to the ion substitution is in the first place taking place in the LnO9 units, and is transferred to the PO4 tetrahedra via the Ln-O-P bonds.
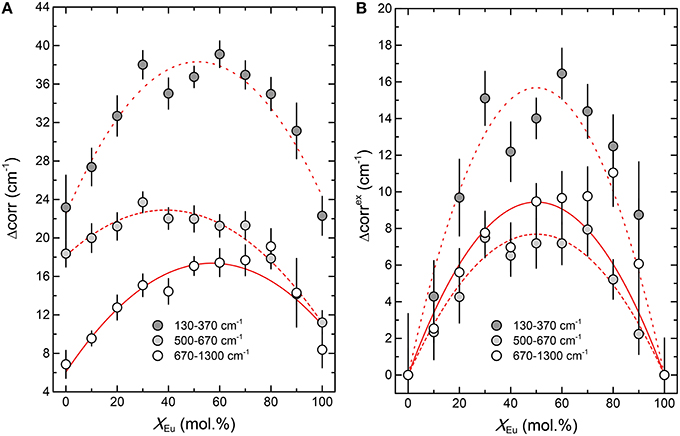
Figure 7. The result of the autocorrelation analysis of the infrared spectra of the (La1−xEux)PO4 solid solution. (A) The absolute value of the autocorrelation parameter Δcorr. (B) The excess autocorrelation parameter Δcorrex as a function of composition (xEu). The red curves in (A) represent parabolic least-squares fits, whereas those in (B) are fits of the regular solid solution model (Equation 1) to the data.
As can be seen in Table 1 the molar volumes of the end members of the (La1−xEux)PO4 solid solution differ by almost 9%, which is the results of the difference in the ionic radii of La3+ (121.6 pm) and Eu3+ (112 pm). This difference results in average structural distortions that are reflected by the observed systematic shifts of the vibrational frequencies. Infrared band broadening has been proposed to correlate with the enthalpy of mixing behavior if the enthalpy of mixing is mainly due to local elastic strain energies (Boffa Ballaran et al., 1999; Tarantino et al., 2002, 2003; Boffa Ballaran and Carpenter, 2003). Because the length scale of a given phonon vibration should increase with decreasing wavenumber (Carpenter et al., 1999), it has been proposed that the far-infrared rather than the near- or mid-infrared range provides information on strain heterogeneities over distances of several unit cells (Boffa Ballaran and Carpenter, 2003). This has been confirmed by many studies, but the lower frequencies have shown the clearest correlation with the enthalpy of mixing measured by solution calorimetry (Tarantino et al., 2002, 2003; Boffa Ballaran and Carpenter, 2003). Line broadening of the vibrational bands of the investigated monazite solid solution is already observed when 10 mol.% of one end-member is substituted into the other (Figures 4, 7). This suggests that local structural heterogeneities and strain fields must have dimensions exceeding the distance to neighboring LnO9 polyhedra on the order of a few unit cells. In this respect, it is noteworthy that, based on the analysis of the broadening of Raman modes of different symmetry in the zircon (ZrSiO4)-coffinite (USiO4) solid solution, vibrational band broadening per mol fraction of U was found to be strongly anisotropic, which could be related to the strong anisotropy of the elastic properties of the zircon structure (Geisler et al., 2005).
Enthalpy increment measurements in the (La1−xEux)PO4 solid solution series at T = 1000 K revealed a significant excess enthalpy, which has been attributed mainly to local strain fields in the lattice due to the cationic mismatch (Popa et al., 2006a; Konings et al., 2008). Thust et al. (2015) measured the low-temperature heat capacity of the (La1−xEux)PO4 solid solution, but the variation observed was solely attributed to the difference in the electronic configuration and the concomitant Schottky effects. Li et al. (2014) derived mixing enthalpies for the (La1−xEux)PO4 solid solution from ab initio density functional theory (DFT) computations that very well agree with the drop calorimetric measurements of Popa et al. (2006a) and Konings et al. (2008). However, drop calorimetric measurements are non-reacting and thus do not yield a mixing enthalpy, as erroneously assumed by Li et al., but are mainly a measure for the vibrational (phonon) excess enthalpy. From the thermodynamic point of view the enthalpy of a system at temperature T is given by . The first term is the zero-point energy, resulting from the bond energies. The second part mainly contains the vibrational (phonon) energy that in solids may be related, e.g., to microstrain or defects, but also a non-bonding part that may be due to magnetic or crystal field effects. It follows that the bonding part of solids can only be measured by breaking the bonds, i.e., by solution calorimetry. The DFT results are based on the differences in the total energies of the used supercells compared to the end members. The agreement of the computed values with the drop calorimetric results must therefore be considered either as coincidence related to experimental or computational errors or the excess enthalpy of mixing in the (La1−xEux)PO4 solid solution is mainly related to the vibrational energy of mixing and only subordinate to bond energies and crystal field effects. The latter seems to be reasonable considering that the bonding properties among the rare earth elements are very similar, as they all have a ds2fn configuration, with the f orbitals not contributing to the bonding.
Figure 8 shows the correlation between the average IR band broadening in the low frequency range of lattice modes, represented by Δcorrex, with the vibrational excess enthalpy normalized by the molar volume that was derived from the X-ray diffraction measurements, . The data describe a linear relationship, and error-weighted least-squares analysis anchored at (0,0) yields a slop of (4.3 ± 1.6) J cm−2. This number may be compared to those obtained for other mineral phases for which Hex was obtained by solution calorimetry, specifically the relation between and the bulk modulus, which has been suggested by e.g., Tarantino et al. (2003) and Bromiley et al. (2007). The results for the (La1−xEux)PO4 solid solution fit very well in the trend between the bulk modulus and obtained for the silicate and carbonate solid solutions. Despite the scatter of the data, there is a general increase of with decreasing compressibility (increasing bulk modulus) of the structure, i.e., elastically stiff materials tend to have a larger energy change per unit of band broadening in IR spectra than those that are elastically soft and, therefore, relax more easily around substituting atoms than stiff materials.
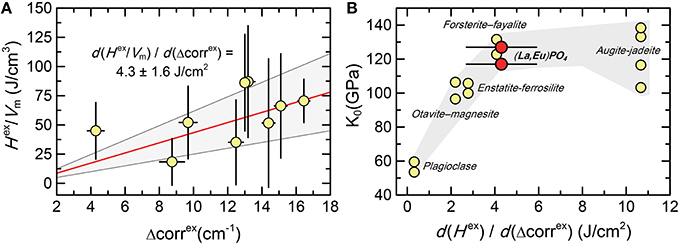
Figure 8. (A) The relationship between the excess autocorrelation parameter (Δcorrex) obtained from the low frequency range between 130 and 370 cm−1 and the ratio of the measured excess enthalpy and volume () of the (La1−xEux)PO4 solid solution series. The red line represents the least-squares regression line forced through (0,0). The gray field marks its 95% confidence interval. (B) The relation between and the bulk modulus (K0) for several mineral phases, showing that the current results are in agreement with the trend observed for other mineral phases (Bromiley et al., 2007, and references therein).
From the results presented in this work it is evident that substitution of La by Eu in the LnO9 polyhedron is causing substantial local microstrain in the lattice of the mixed crystal, i.e., non-ideality. The occurrence of microstrain is also accompanied by a substantial excess volume, as derived from powder XRD measurements. It thus appears that the empirical correlations between band broadening, excess enthalpy, and elastic properties may be valid also for phosphate structures. This would support the notion that local elastic strain fields are responsible for a substantial part of the excess enthalpy of mixing. In the monazite structure, the Ln-O lattice modes are the most affected, as they exhibit the largest excess broadening. They form intertwining dispersive phonon branches throughout the Brillouin zone (Silva et al., 2006) and have also the largest influences on the thermodynamic properties such as enthalpy and entropy (Kieffer, 1979a,b), and can thus explain very well the excess enthalpy that we observed for the (La1−xEux)PO4 solid solution (Popa et al., 2006a; Konings et al., 2008).
TG and RK initiated the research. KP synthesized the monazite samples and analyzed them by Raman spectroscopy and XRD. TG helped with the Raman measurements, performed the IR measurements, and analyzed and refined the XRD and spectroscopic data. All authors contributed to the interpretation of the data and to the final manuscript.
The authors declare that the research was conducted in the absence of any commercial or financial relationships that could be construed as a potential conflict of interest.
We would like to thank Dr. H.-W. Meyer and Mr. D. Bouexiëre for helping with the infrared measurements and for carrying out the X-ray diffraction measurements, respectively. We are also grateful to the reviewers, who helped to improve the final manuscript. Finally, we would like to thank Dr. F. Nestola for his editorial handling of this manuscript.
Babelot, C. (2013). Monazite-Type Ceramics for Conditioning of Minor Actinides: Structural Characterization and Properties. Ph.D. thesis, Rheinisch-Westfaelische Technische Hochschule (RWTH), Aachen, 129.
Begun, G. M., Beall, G. W., Boatner, L. A., and Gregor, W. J. (1981). Raman spectra of the rare earth orthphosphates. J. Raman Spectrosc. 11, 273–278. doi: 10.1002/jrs.1250110411
Bjorklund, C. W. (1958). The preparation of PuP2O7 and PuPO4. J. Am. Chem. Soc. 79, 6347–6350. doi: 10.1021/ja01581a001
Boatner, L. A., Abraham, M. M., and Sales, B. C. (1984). Lanthanide orthophosphate ceramics for the disposal of actinide-contaminated nuclear wastes. Inorg. Chim. Acta 94, 146–148. doi: 10.1016/S0020-1693(00)94610-3
Boatner, L. A., and Sales, B. C. (1988). “Radioactive waste forms for the future,” in Radioactive Waste Forms for the Future, eds W. Lutze and R. C. Ewing (Amsterdam: Elsevier Science Publishers), 495–564.
Boffa Ballaran, T., Carpenter, M., Geiger, C. A., and Koziol, A. (1999). Local structural heterogeneity in garnet solid solutions. Phys. Chem. Miner. 26, 554–569. doi: 10.1007/s002690050219
Boffa Ballaran, T., and Carpenter, M. A. (2003). Line broadening and enthalpy: some empirical calibrations of solid solution behaviour from IR spectra. Phase Transit. 76, 137–154. doi: 10.1080/0141159031000076101
Bromiley, F. A., Boffa Ballaran, T., and Zhang, M. (2007). An infrared investigation of the otavite-magnesite solid solution. Amer. Miner. 82, 837–843. doi: 10.2138/am.2007.2317
Carpenter, M. A., Boffa Ballaran, T., and Atkinson, A. J. (1999). Microscopic strain, local structural heterogeneity and the energetics of silicate solid solutions. Phase Transit. 69, 95–109. doi: 10.1080/01411599908208011
Clavier, N., Podor, R., and Dacheux, N. (2011). Crystal chemistry of the monazite structure. J. Eur. Ceram. Soc. 31, 941–976. doi: 10.1016/j.jeurceramsoc.2010.12.019
Etzel, K., and Benisek, A. (2008). Thermodynamic mixing behavior of synthetic Ca-Tschermak-diopside pyroxene solid solutions: III. An analysis of line broadening in IR spectra and heat of mixing behavior. Phys. Chem. Miner. 35, 399–407. doi: 10.1007/s00269-008-0234-6
Ewing, R. C. (2005). Plutonium and minor actinides: safe sequestration. Earth Planet. Sci. Lett. 229, 165–181. doi: 10.1016/j.epsl.2004.11.017
Ewing, R. C., and Lutze, W. (1991). High-level nuclear waste immobilization with ceramics. Ceram. Int. 17, 287–293. doi: 10.1016/0272-8842(91)90024-T
Ewing, R. C., and Wang, L. (2002). Phosphates as nuclear waste forms. Rev. Mineral. Geochem. 48, 673–699. doi: 10.2138/rmg.2002.48.18
Geisler, T., Burakov, B. E., Zirlin, V., Nikolaeva, L., and Pöml, P. (2005). Raman spectroscopic study of high-uranium zircon from the Chernobyl “lava.” Eur. J. Miner. 17, 883–894. doi: 10.1127/0935-1221/2005/0017-0883
George, J., Ryan, C., and Brow, R. K. (2014). Nanocrystalline rare earth phosphates from glass dissolution and precipitation reactions. J. Am. Ceram. Soc. 97, 2249–2255. doi: 10.1111/jace.12895
Hezel, A., and Ross, S. D. (1966). Forbidden transitions in the infra-red spectra of tetrahedral anions-III. Spectra-structure correlations in perchlorates, sulphates and phosphates of the formula MXO4. Spectrochim. Acta 22, 1949–1961. doi: 10.1016/0371-1951(66)80183-2
Holland, T. J. B., and Redfern, S. A. T. (1997). Unit cell refinement from powder diffraction data; the use of regression diagnostics. Miner. Mag. 61, 65–77. doi: 10.1180/minmag.1997.061.404.07
Kerrick, D. M., and Darken, L. S. (1975). Statistical thermodynamic models for ideal oxide and silicate solid solutions, with application to plagioclase. Geochim. Cosmochim. Acta 39, 1431–1442. doi: 10.1016/0016-7037(75)90122-2
Kieffer, S. W. (1979a). Thermodynamics and lattice vibrations of minerals I. Rev. Geophys. Space Phys. 17, 1–19.
Kieffer, S. W. (1979b). Thermodynamics and lattice vibrations of minerals II. Rev. Geophys. Space Phys. 17, 20–34.
Koch-Müller, M., Mrosko, M., Gottschalk, M., and Schade, U. (2012). Pressure-induced phase transitions in ilvaite studied by in situ micro-FTIR spectroscopy. Eur. J. Miner. 24, 831–838. doi: 10.1127/0935-1221/2012/0024-2197
Konings, R. J. M., Walter, M., and Popa, K. (2008). Excess properties of the (Ln2−2xCaxThx)(PO4)2 (Ln = La, Ce) solid solutions. J. Chem. Thermodyn. 40, 1305–1308. doi: 10.1016/j.jct.2008.03.009
Li, Y., Kowalski, P. M., Blanca-Romero, A., Vinograd, V., and Bosbach, D. (2014). Ab initio calculation of excess properties of La1−x(Ln,An)xPO4 solid solutions. J. Solid State Chem. 220, 137–141. doi: 10.1016/j.jssc.2014.08.005
McCarthy, G. J., White, W. B., and Pfoertsch, D. (1978). Synthesis of nuclear waste monazites, ideal actinide hosts for geologic disposal. Mater. Res. Bull. 13, 1239–1245. doi: 10.1016/0025-5408(78)90215-5
Ni, Y., Hughes, J. M., and Mariano, A. N. (1995). The crystal chemistry of monazite and xenotime. Am. Miner. 80, 21–26. doi: 10.2138/am-1995-1-203
Popa, K., and Konings, R. J. M. (2006). High-temperature heat capacities of EuPO4 and SmPO4 synthetic monazites. Thermochim. Acta 445, 49–52. doi: 10.1016/j.tca.2006.03.023
Popa, K., Konings, R. J. M., and Geisler, T. (2006a). High-temperature calorimetry of (La1−xLnx)PO4 solid solutions. J. Chem. Thermodyn. 39, 236–239. doi: 10.1016/j.jct.2006.07.010
Popa, K., Raison, P. E., Martel, L., Martin, P. M., Prieur, D., Solari, P. L., et al. (2015). Structural investigations of Pu III phosphate by X-ray diffraction, MAS-NMR and XANES spectroscopy. J. Solid State Chem. 230, 169–174. doi: 10.1016/j.jssc.2015.07.002
Popa, K., Sedmidubský, D., Beneš, O., Thiriet, C., and Konings, R. J. M. (2006b). The high-temperature heat capacity of LnPO4 (Ln = La, Ce, Gd) by drop calorimetry. J. Chem. Thermodyn. 38, 825–829. doi: 10.1016/j.jct.2005.08.019
Ruschel, K., Nasdala, L., Andreas, K., Hanchar, J. M., Többens, D. M., Škoda, R., et al. (2012). A Raman spectroscopic study on the structural disorder of monazite–(Ce). Miner. Petrol. 105, 41–55. doi: 10.1007/s00710-012-0197-7
Sales, B. C., White, C. W., and Boatner, L. A. (1983). A comparison of the corrosion characteristics of synthetic monazite and borosilicate glass containing simulated nuclear defense waste. Nucl. Chem. Waste Man. 4, 281–289. doi: 10.1016/0191-815X(83)90053-0
Salje, E. K. H., Carpenter, M. A., Malcherek, T., and Boffa Ballaran, T. (2000). Autocorrelation analysis of infrared spectra from minerals. Eur. J. Miner. 12, 503–519. doi: 10.1127/0935-1221/2000/0012-0503
Silva, E. N., Ayala, A. P., Guedes, I., Paschoal, C. W. A., Moreira, R. L., Loong, C. K., et al. (2006). Vibrational spectra of monazite-type rare earth orthophosphates. Opt. Mater. 29, 224–230. doi: 10.1016/j.optmat.2005.09.001
Tarantino, S. C., Balaran, T. B., Carpenter, M. A., Domeneghetti, M. C., and Tazzoli, V. (2002). Mixing properties of the enstatite-ferrosilite solid solution: II. A microscopic perspective. Eur. J. Miner. 14, 537–547. doi: 10.1127/0935-1221/2002/0014-0537
Tarantino, S. C., Carpenter, M. A., and Domeneghetti, M. (2003). Strain and local heterogeneity in the forsterite–fayalite solid solution. Phys. Chem. Miner. 30, 495–502. doi: 10.1007/s00269-003-0357-8
Keywords: monazite, lanthanide phosphates, lattice strain, excess volume, vibrational spectroscopy
Citation: Geisler T, Popa K and Konings RJM (2016) Evidence for Lattice Strain and Non-ideal Behavior in the (La1−xEux)PO4 Solid Solution from X-ray Diffraction and Vibrational Spectroscopy. Front. Earth Sci. 4:64. doi: 10.3389/feart.2016.00064
Received: 27 January 2016; Accepted: 19 May 2016;
Published: 09 June 2016.
Edited by:
Fabrizio Nestola, University of Padova, ItalyReviewed by:
Alexander F. Goncharov, Carnegie Institution of Washington, USACopyright © 2016 Geisler, Popa and Konings. This is an open-access article distributed under the terms of the Creative Commons Attribution License (CC BY). The use, distribution or reproduction in other forums is permitted, provided the original author(s) or licensor are credited and that the original publication in this journal is cited, in accordance with accepted academic practice. No use, distribution or reproduction is permitted which does not comply with these terms.
*Correspondence: Thorsten Geisler, dGdlaXNsZXJAdW5pLWJvbm4uZGU=
Disclaimer: All claims expressed in this article are solely those of the authors and do not necessarily represent those of their affiliated organizations, or those of the publisher, the editors and the reviewers. Any product that may be evaluated in this article or claim that may be made by its manufacturer is not guaranteed or endorsed by the publisher.
Research integrity at Frontiers

Learn more about the work of our research integrity team to safeguard the quality of each article we publish.