
95% of researchers rate our articles as excellent or good
Learn more about the work of our research integrity team to safeguard the quality of each article we publish.
Find out more
ORIGINAL RESEARCH article
Front. Earth Sci. , 28 April 2016
Sec. Geomagnetism and Paleomagnetism
Volume 4 - 2016 | https://doi.org/10.3389/feart.2016.00047
This article is part of the Research Topic Rock and Environmental Magnetism: New Techniques and Applications View all 11 articles
The level of chemical weathering is strongly affected by climate. We presented magnetic properties associated with element ratios from the northern part of the South China Sea to denote links between chemical weathering intensity and monsoon changes in the previous 90,000 years. The magnetic parameter IRMAF80mT/SIRM, representing the variations of high coercivity minerals in marine sediments accompanied with the Al2O3/TiO2 and the Chemical Index of Alteration (CIA), demonstrates strong chemical and physical weathering processes during the last 84–40 kyr when intensified Asian monsoon and warm climate occurred. High susceptibility, TiO2 content, and relatively coarser magnetic mineral grain (relatively low ARM/SIRM ratio) also suggest more terrigenous clastic flux resulting from intensified physical erosion and river transport ability. During the 40–15 kyr period, a low IRMAF80mT/SIRM as well as chemical proxies indicate weak weathering as the climate cooled and precipitation decreased.
Weathering intensity and continental erosion determine the geological progression in near-surface spaces, and these are related to tectonic uplift and climate change (Clift and Giosan, 2014; Zhao and Zheng, 2015). Most eroded terrigenous materials formed by the weathering process are eventually deposited in the oceans and these deposits reveal aspects of the weathering intensity and clastic flux sediments from rivers (Wei et al., 2006). Climate has typically been regarded as the primary determinant of weathering and erosion on a glacial-interglacial time scale. Faster chemical weathering and erosion correlates with more humid, warm climates whereas weaker weathering and less erosion correlates with drier climates (Clift, 2006; Clift et al., 2014; Zhao and Zheng, 2015). In South China, the Asian monsoon has played an important role in the weathering process and river inputs from land to marine after the Cenozoic era. Intense summer monsoons can increase chemical weathering (Derry and France-Lanord, 1996), as well as physical erosion rates. However, some researchers argue that strong physical erosion may be related to a cold climate owing to faster run-off in the absence of drainage capture (Clift et al., 2014). Major and trace elements taken from sediments of the South China Sea have been used to study links between weathering and monsoon paleo-intensity (Wei et al., 2004, 2006; Hu et al., 2012, 2013). However, these studies are inadequate to clarify the relationships between chemical weathering, physical erosion, and monsoon variations.
We used core sediments collected from the north part of the South China Sea to examine evidence for changes in physical erosion and chemical weathering in the last 90,000 years. Magnetic properties IRMAF80mT (Saturation Isothermal Remanent Magnetization after 80 mT alternation field demagnetization) associated with the element ratios Al2O3/TiO2 and the Chemical Index of Alteration (CIA) were used as the chemical weathering proxies while volume susceptibility, TiO2 content and ARM/SIRM represent clastic flux which was related to the physical erosion.
A core STD111 (latitude/longitude: 20.0193°N, 116.3596°E, water depth 1142 m) was collected with a gravity piston corer by the Guangzhou Marine Geological Survey in March 2012 during a geological survey of the north part of the South China Sea (SCS). The core was 410 cm long, and taken from the north-west in the continental margin of SCS about 135 km from the mouth of the Pear River (Figure 1). The sediments were segmented in five layers: 0–55 cm, composed mainly of clay silt, with an increase in fine particles toward the surface; silty fine sand layer (55–165 cm) is clearly coarser than the next 165–355 cm layer which consisted of clay silt; silty fine sand is the major sediment of the 355–395 cm layer and silts dominated components of the 395–410 cm layer.
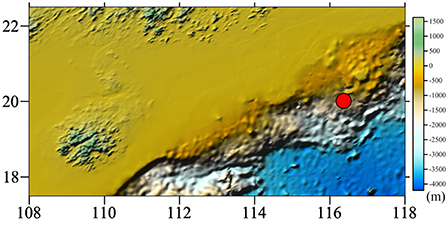
Figure 1. Geography location of the core in South China Sea (red circle). Color scale represents the water depth (m).
The core was split and one half was continuously sampled by pushing a pottery cube box (1*1*1 cm3) into the split face of the core section. A total of 278 samples were collected. Magnetic measurements on all discrete samples were performed at 2G-760 Enterprises high-resolution cryogenic magnetometer. Natural remanent magnetization (NRM) was measured and demagnetized stepwise using peak alternating fields (AF) 2, 5, 7.5, 10 mT and then in 5 mT steps up to a peak field of 60 mT and in 10 mT steps up to a peak field of 80 mT. Anhysteretic remanent magnetization (ARM), acquired in a 0.05 mT bias field and a 10–80 mT peaks AF in 10 mT steps respectively, was then subsequently demagnetized at peak fields of 20, 40, 60, and 80 mT. Isothermal remanent magnetization (IRM) was produced in a steady dc field of 100 mT and then AF demagnetized using the same field steps as for ARM demagnetization. Hysteresis measurements were performed in fields of up to 1 T using a MicroMag 2900 alternating field gradient force magnetometer. Magnetic fabric measurement for all samples was done using a Kappabridge KLY-3S. All the magnetic experiments were carried out at the Paleomagnetism Laboratory of the Institute of Earth Sciences, Chinese Academy of Science (CAS), Xian and the Paleomagnetism and Geochronology Laboratory of the Institute of Geology and Geophysics (IGG), CAS, Beijing (Hysteresis measurements).
The foraminifers were selected from the sediments of the upper 200 cm of sample to measure the radio-carbon age in Beta Analytic Inc. The foraminifers were first washed for 30–50 s, using an ultrasonic cleaner, and then we selected clean and unfilled samples of the same species. Delta-R 65 ± 47 was used to correct the local marine reservoir, and calendar years were calculated from the adjusted conventional ages referencing Marine09 curve. The geochemistry data of the oxygen isotope of G.ruber, and the content of TiO2 Al2O3 and CIA were obtained from a report by the Guangzhou Marine Geological Survey.
Reflectance spectra for several samples were analyzed in a Perkin-Elmer Lambda 950 spectrophotometer with a diffuse reflectance attachment (reflectance sphere) from 350–1000 μm in 1 nm steps at Sun Yat-Sen University. Sample preparation and analysis followed the procedures described in Balsam and Deaton (1991).
Temperature-dependent susceptibility curves detected magnetite, which rapidly decreased at around 580°C on all heating curves (Figure 2A; Dunlop and Özdemir, 1997; Deng et al., 2004). Minor decreases at ~450°C on the heating curves for 15, 95, and 350 cm samples suggest the presence of maghemite (Dunlop and Özdemir, 1997; Deng et al., 2000). All cooling curves are above heating curves, indicating enhanced magnetic susceptibility arising from the conversion of Fe-clay minerals to new magnetite during the heating process (Deng et al., 2000). The hysteresis parameters indicate that the low-coercivity minerals are predominant magnetic components (Figures 2B–D) (Day et al., 1977; Dunlop, 2002). The loops close above 300 mT (Figure 2B), and the coercivity of remanence (Bcr) is ~35 mT (Figure 2C). Hysteresis ratios seem to cluster tightly within the pseudo-single domain (PSD) grain size region (Figure 2D).
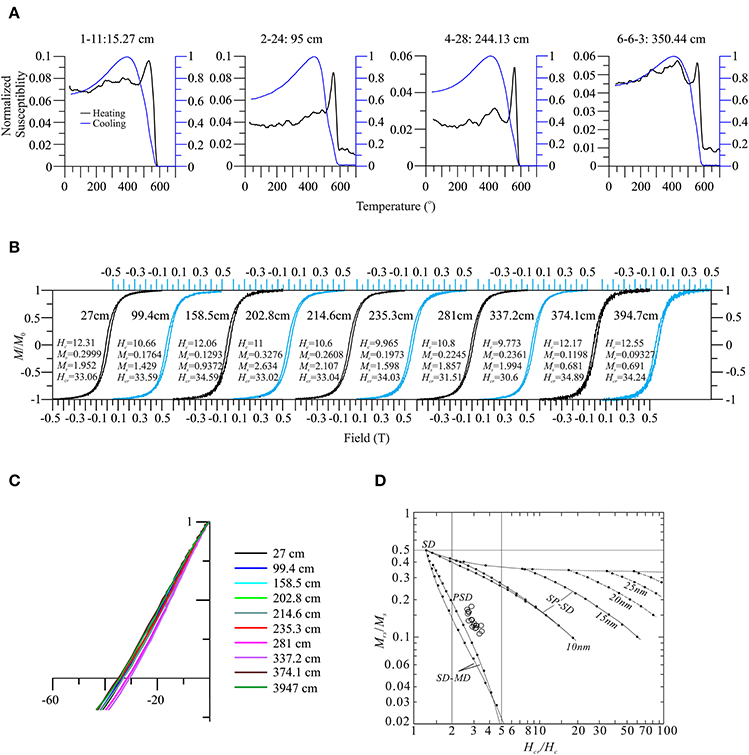
Figure 2. Rock magnetic properties for some represented samples. (A) Temperature-dependent susceptibility variations. 1–11:15.27 cm represents the samples number and the depth of sample respectively at core profile. (B) Hysteresis loops (corrected for paramagnetism), (C) back field curves of SIRM and magnetic grain size following Dunlop (2002). (D) SP-superparamagnetic; SD-single domain; PSD- pseudosingle domain and MD-multidomain.
Second derivative results of diffuse reflectance spectra exhibited minimum and maximum absorption bands between 420 and 460 nm, and between 550 and 570 nm respectively, which represent goethite and hematite (Torrent and Barron, 2002; Figure 3). However, the intensity of goethite and hematite for sample 2–24 was weaker than samples 4–48 and 6–6–3.
The grain size proxies of ARM(20–60mT)/SIRM(20–60mT), ARM/κ and SIRM/κ all show obvious variations down core (Figure 4). Their values display four segments: two lows from 0 to 50 cm and 170 to 360 cm suggest relative coarse magnetic grain while two high intervals from 50 to 170 cm and 360 to 410 cm show the relative fine grain (Liu et al., 2012). However, the magnetic grain sizes contrast to the whole sediments. While the magnetic grain is coarse, the sediments are characterized by the clay-silt particles. The coercivity proxies of IRMAF80mT/SIRM and S300 ratio have a similar pattern with grain size as well as the susceptibility, SIRM and ARM. However, the IRMAF80mT/SIRM is opposite the ARMAF60mT/ARM changes.
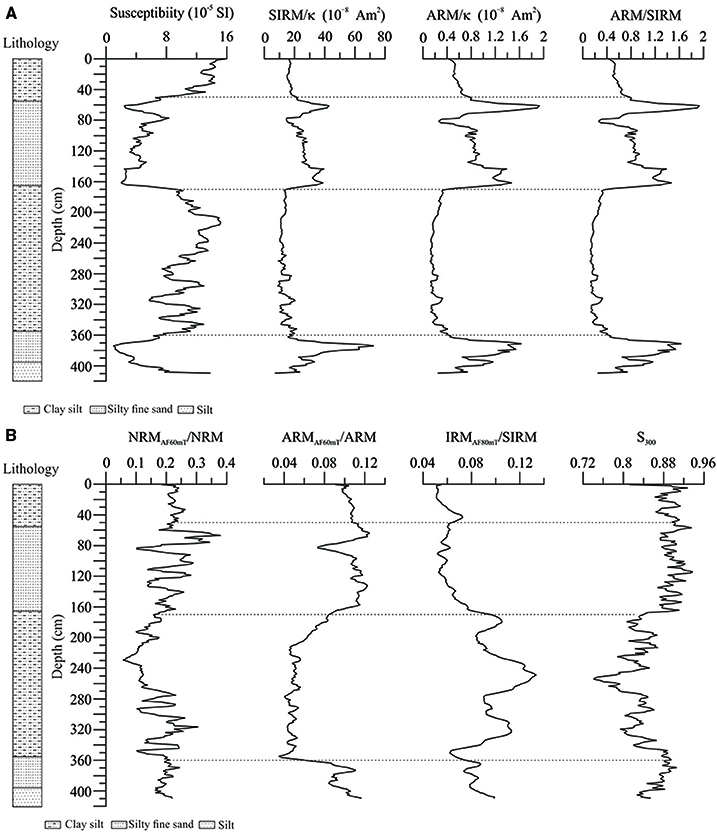
Figure 4. (A) Downcore variations in magnetic parameters of magnetic susceptibility, grain size proxies (SIRM/κ, ARM/κ, ARM/SIRM) and (B) relatively coercivity variations proxies (NRMAF60mT/NRM, ARMAF60mT/ARM, IRMAF60mT/SIRM, and S300 ratio). Dotted lines divided several significant staged variations of the magnetic properties of sediments. Lithology of the core was listed at left.
Magnetic lineation (L) for most of samples was weak (less than 1.08). Nevertheless, they displayed strong staged variations as well as anisotropy degree (P) and volume susceptibility (Figure 5), indicating that high susceptibility is consistent with weak L and P. Inclinations of the minimum susceptibility axes (Kmin) were shallow when P values were strong, suggesting a disturbance of the original sedimentary texture. However, most of samples with weak P had high Kmin closing to vertical. Declinations of the maximum susceptibility axes tend to fall along one direction. In order to discuss the alignment direction of magnetic minerals, declination of Kmax was corrected basing on the declination of NRM. We assume that the declination of NRM for top sediments should be consistent with the modern geomagnetic field. After correction, it shown that Kmax aligned around 310° direction.
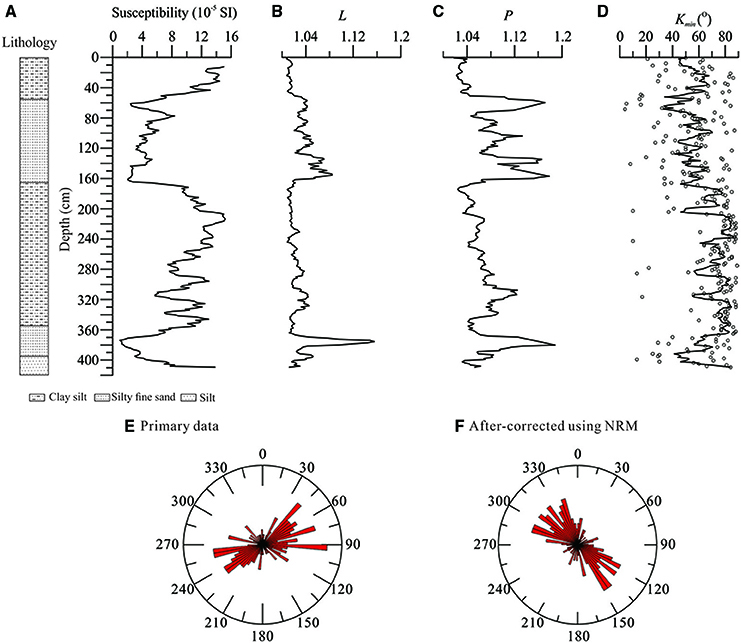
Figure 5. Downcore variations of magnetic fabric parameters (A–D) and the rose projection of the declinations of the maximum susceptibility axes in primary measured data (E) and after-corrected (F) using the NRM. Lithology of the core was listed at left.
All samples subjected to AF demagnetization were analyzed using principal component analysis (Kirschvink, 1980) (Figures 7A–D). Samples with shallow Kmin (less than 60°) were removed. Only 183 of the total 277 samples were used to analyze ChRM. The AF demagnetization results of selected samples are presented in Figure 6. The NRM median destructive field (MDF) varied between 10 and 35 mT for all samples, and NRM intensities for most of samples were almost completely demagnetized in fields of 80 mT. After 60 mT AF, the remanence of most samples was < 30%. The orthogonal demagnetization diagrams show that secondary magnetization components are either absent or easily removed by stepwise alternating field demagnetization between 5 and 10 mT. Further steps revealed a highly stable magnetization direction. The characteristic remanent magnetization (ChRM) has been derived using principle component analysis (Kirschvink, 1980). Inclinations and declinations of the profile were plotted as a function of depth (Figures 7B,C). Samples with MAD values > 6° were also removed (Figure 7D).
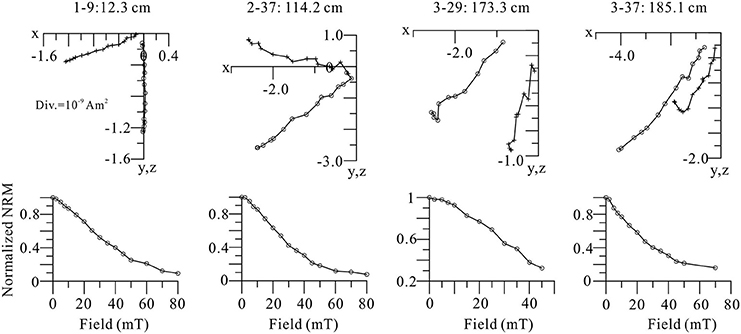
Figure 6. Representative NRM vector plots for typical samples. Open circles (cross) indicate projection onto the horizontal (vertical) plane (top).
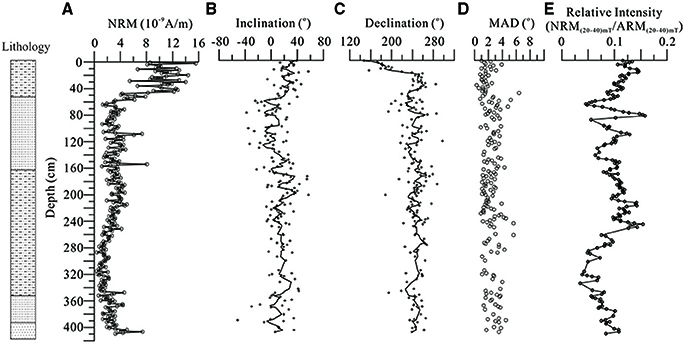
Figure 7. NRM properties as a function a core depth. NRM intensities (A), ChRM directions (B,C) and associated maximum angular deviation (MAD) (D), as well as the relative intensity proxy NRM(20–40mT)/ARM(20–40mT) (E).
Although hematite, goethite, and maghemite exist in the sediments, magnetite was the main contributor to NRM and ARM as suggested by several coercivity proxies. SIRM, ARM, volume susceptibility, and IRMAF80mT/SIRM of samples varied within one order of magnitude. These properties met the requirements for reconstructing relative paleointensity using the normalized NRM (King et al., 1983; Tauxe and Wu, 1990). The NRM AF pattern was similar to ARM but opposite that of SIRM, e.g., NRMAF60mT/NRM agree well with ARMAF60mT/ARM, suggesting ARM has remanence carriers similar to NRM. In order to reduce the influence of a mineral mixture with different coercivities to relative intensity, we used the remanence vector difference between 20 and 40 mT demagnetized field for NRM and ARM to reconstruct the relative paleointensity proxy, which was PRI = NRM(20–40mT)/ARM(20–40mT). The RPI curves as a function of core depth are shown in Figure 7E.
The radio-carbon ages of five foraminifer samples suggested the deposition ages of top 130 cm (Table 1). The oxygen isotope results of G. ruber provided a general chronology frame for the sediments relating to other oxygen isotope stratigraphy, such as ODP 1144 (Bühring et al., 2004) and SPECMAP curves (Imbrie and McIntyre, 2006; Figure 8A). However, a few samples introduced large uncertainties and reduced the ability to construct an accurate profile chronology. Fortunately, the relative paleo-intensity proxy can also serve to establish the correlation although some ambiguities remain. However, it is possible to integrate multi-proxies synchronously, such as radio-carbon ages, the oxygen isotope stratigraphy, and relative paleointensity (Laj et al., 2004; Yang et al., 2009; Figure 8A). We can correlate the pattern between our data and reference curves. The resulting ambiguities can be greatly reduced if both the isotope oxygen and relative paleointensity records can be correlated from different proxies simultaneously. The exact correlation strategy is shown in Figure 8. The age model of the reference ODP 1144 core was constructed on the oxygen isotopes of G. ruber and four AMS 14C dates on G. ruber and G. sacculifer mixtures by Bühring et al. (2004), which provided a reliable chronology. The reference paleointensity curve NH-PIS was presented by Yang et al. (2009).
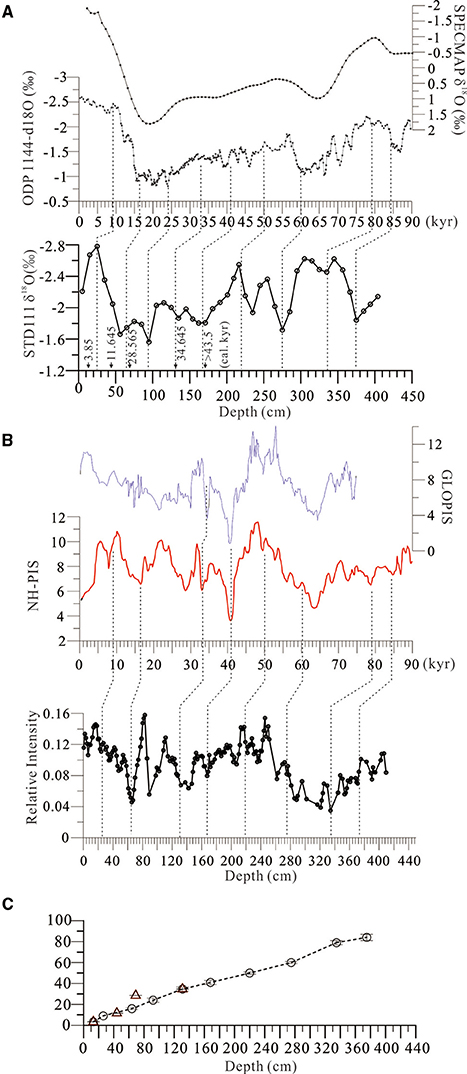
Figure 8. Oxygen isotope values correlation with SPECMAP (Imbrie and McIntyre, 2006) and oxygen isotope stratigraphy of ODP1144 site (Bühring et al., 2004). (A), Calibrated AMS14C ages were also listed along depth; In (B), the relative paleointensity variations was comparison with the standard curve GLOPIS-75 (Laj et al., 2004) and the stacked curve of the north of South China Sea (Yang et al., 2009). Red dotted lines indicate the tied points synchronous in relative intensity and oxygen isotope. In (C), the correlated age-depth model was listed referring to the oxygen and relative intensity. Triangles represent the AMS14C ages.
The chronology of our profile was constrained by eight tied points integrating three AMS14C ages, suggesting that the sediments in the ~410 cm long record the deposition of about 90 kyr. The AMS14C age 28.565 kyr clearly departs from the general deposition rate trend, so we omitted it when constructing the age-depth profile model. Constrained by this age-depth model, the deposition rate was generally consistent with a mean value 4.8 cm/kyr.
Marine terrigenous detrital sediments record information from chemical weathering of the continental crust, which is directly related to climate (Clift, 2006; Hu et al., 2012, 2013; Clift et al., 2014; Zhao and Zheng, 2015). The intensity of weathering can be represented by some chemical element ratios in the marine sediments, such as Al/Ti, Al/K (Kronberg et al., 1986; Wei et al., 2004; Clift et al., 2014; Zhao and Zheng, 2015). In South China, climate is influenced significantly by the Asian monsoon, hence the chemical intensity should correspond to monsoon changes. For instance, stronger summer monsoons may increase chemical weathering and the physical erosion rate (Derry and France-Lanord, 1996; Bookhagen et al., 2005; Clift, 2006). However, some data show that the winter monsoon is a major contributor to the general pattern of weathering and paleoclimate (Tamburini et al., 2003; Wei et al., 2004). Studies in Southern China have demonstrated that the wet and warm climate during the interglacial produced stronger chemical weathering, and the dry climate during the glacial period produced less chemical weathering. This indicates that the East Asian monsoon is a key for paleoclimate variation patterns (Wei et al., 2004; Hu et al., 2012; Clift et al., 2014).
On our profile, the diagram of maximum susceptibility axis direction was focused toward 310° (Figure 5F), indicating that the weathered material mainly came from this direction (Parés et al., 2007). Materials transported by the Pear River are main candidates. The terrigenous detritus therefore mostly originated in Southern China. The mineral assemblage, element ratio, and terrigenous flux are influenced by the climate conditions and then chemical weathering intensity.
Proxies listed as the function of age clearly show the staged variations, which were consistent with the climate variations (Figure 9). During a 84–40 kyr interval in which the oxygen isotope values of marine sediments (Bühring et al., 2004) and stalagmite (Wang et al., 2001) as well as the sea surface water temperature (SST; Wei et al., 2007) indicated a warm climate and strong Asian monsoon, high volume susceptibility and TiO2 content represented greater flux of terrigenous detritus which was consistent with the high ratio of IRMAF80mT/SIRM. The latter was characterized by some high coercivity minerals, such as hematite coeval with the maghemite derived from the strong chemical weathering. The high element ratios of Al2O3/TiO2 and Chemical Index of Alteration (CIA) are also evidence of the same weathering process (Clift and Giosan, 2014). During this period, magnetic mineral grain size is coarser (low ARM/SIRM), consistent with the high susceptibility values, exhibiting the intensified erosion, and strong flux from river transport.
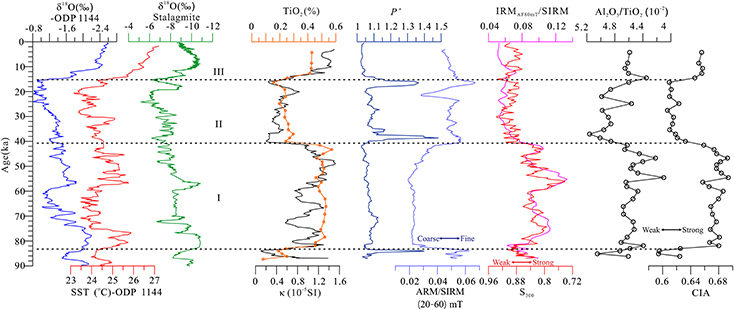
Figure 9. Environmental proxies (Susceptibility, TiO2 content, IRMAF80mT/SIRM, ARM/SIRM, P′) as well as the chemical weathering indices TiO2/Al2O3 and CIA were correlated to the climate proxies of δ18O and SST of ODP1144 site (Bühring et al., 2004; Wei et al., 2007), and stalagmite from Hulu cave (Wang et al., 2001). Dotted lines segment the two high (I, III) and one low (II) chemical weathering stages.
As the climate cooled gradually and had a weak monsoon stage from about 40 kyr to 15 kyr, susceptibility, and low TiO2 appeared, and the ratios of IRMAF80mT/SIRM, Al2O3/TiO2 decreased as well as the CIA proxy. These are all indicators of low terrigenous input and weak chemical weathering (Wei et al., 2004; Hu et al., 2012; Clift et al., 2014). High P values exhibit strong physical transport energy during this period.
Our results demonstrate that the chemical weathering intensity, intensified erosion, and clastic influx are closely linked to historic climate conditions. A strong monsoon, intensified chemical weathering and physical erosion led to more detritus being transported into marine deposits.
On the basis of the chronology of integrating the paleointensity and oxygen isotope, magnetic properties of marine sediments provide a good record of the chemical weathering intensity and clastic flux processes in Southern China. The high ratios of IRMAF80mT/SIRM and CIA and Al2O3/TiO2 suggest strong chemical weathering during the 84-40 kyr period while low ratios indicate weaker chemical weathering during 40–15 kyr period. This variation is closely correlated with changes in the Asian monsoon pattern.
All authors listed, have made substantial, direct, and intellectual contribution to the work, and approved it for publication.
This work was supported by the National Natural Science Foundation of China (grant no. 41072264, 41274072), the Fundamental Research Funds for the Central Universities and the Marine Geological Project (1212011220115).
The authors declare that the research was conducted in the absence of any commercial or financial relationships that could be construed as a potential conflict of interest.
Thanks Mrs. Mei Lu for her help during sampling and experiments. Thanks for good suggestions, to the two reviewers.
Bookhagen, B., Thiede, R. C., and Strecker, M. R. (2005). Abnormal monsoon years and their control on erosion and sediment flux in the high, arid Northwest Himalaya. Earth Planet. Sci. Lett. 231, 131–146. doi: 10.1016/j.epsl.2004.11.014
Balsam, W. L., and Deaton, B. C. (1991). Sediment dispersal in the Atlantic Ocean: evaluation by visible light spectra. Rev. Aquat. Sci. 4, 411–447.
Bühring, C., Sarnthein, M., and Erlenkeuser, H. (2004). “Toward a high-resolution stable isotope stratigraphy of the last 1.1 m.y.: Site 1144, South China Sea,” in Proc. ODP, Sci. Results, 184, eds W. L. Prell, P. Wang, P. Blum, D. K. Rea, and S. C. Clemens (College Station, TX: Ocean Drilling Program), 1–29. doi: 10.2973/odp.proc.sr.184.205.2004
Clift, P. D. (2006). Controls on the erosion of Cenozoic Asia and the flux of classic sediment to the ocean. Earth Planet. Sci. Lett. 241, 571–580. doi: 10.1016/j.epsl.2005.11.028
Clift, P. D., and Giosan, L. (2014). Sediment fluxes and buffering in the post-glacial Indus Basin. Basin Res. 26, 369–386. doi: 10.1111/bre.12038
Clift, P. D., Wan, S. M., and Blusztajn, J. (2014). Reconstructing chemical weathering, physical erosion and monsoon intensity since 25 Ma in the northern China Sea: a review of competing proxies. Earth Sci. Rev. 130, 86–102. doi: 10.1016/j.earscirev.2014.01.002
Day, R., Fuller, M., and Schmidt, V. A. (1977). Hysteresis properties of titanomagneties: grain-size and compositional dependence. Phys. Earth Planet. Interiors 13, 260–267. doi: 10.1016/0031-9201(77)90108-X
Deng, C. L., Zhu, R. X., Verosub, K. L., Singer, M. J., and Vidic, N. J. (2004). Mineral magnetic properties of loess/paleosol couplets of the central loess plateau of China over the last 1.2 Myr. J. Geophys. Res. 109, B01103. doi: 10.1029/2003jb002532
Deng, C. L., Zhu, R. X., Verosub, K. L., Singer, M. J., and Yuan, B. Y. (2000). Paleoclimatic significance of the temperature-dependent susceptibility of Holocene loess along a NW-SE transect in the Chinese loess plateau. Geophys. Res. Lett. 27, 3715–3718. doi: 10.1029/2000gl008462
Derry, L. A., and France-Lanord, C. (1996). Neogene Himalayan weathering history ad river 87Sr/86Sr, impact on the marine Sr record. Earth Planet. Sci. Lett. 142, 59–74. doi: 10.1016/0012-821X(96)00091-X
Dunlop, D. J., and Özdemir, Ö. (1997). Rock Magnetism: Fundamentals and Frontiers. New York, NY: Cambridge University Press.
Dunlop, D. J. (2002). Theory and application of the Day plot (Mrs/Ms versus Hcr/Hc): 1. Theoretical curves and tests using titanomagnetite data. J. Geophys. Res. 107:B3. doi: 10.1029/2001JB000486
Hu, D. K., Böning, P., Köhler, C. M., Hillier, S., Pressling, N., Wan, S., et al. (2012). Deep sea records of the continental weathering and erosion response to East Asian monsoon intensification since 14 ka in the South China Sea. Chem. Geol. 326–327, 1–18. doi: 10.1016/j.chemgeo.2012.07.024
Hu, D. K., Clift, P. D., Böning, P., Hannigan, R., Hillier, S., Blusztajn, J., et al. (2013). Holocene evolution in weathering and erosion patterns in the Pearl River delta. Geochem. Geophys. Geosyst. 14, 2349–2368. doi: 10.1002/ggge.20166
Imbrie, J. D., and McIntyre, A. (2006). SPECMAP time scale developed by Imbrie et al., 1984 based on normalized planktonic records (normalized O-18 vs time, specmap.017). doi: 10.1594/PANGAEA.441706. Available online at: https://doi.pangaea.de/10.1594/PANGAEA.441706
King, J. W., Banerjee, S. K., and Marvin, J. (1983). A new rock-magnetic approach to selecting sediments for geomagnetic paleointensity studies: application to paleointensity for the last 4000 years. J. Geophys. Res. 88, 5911–5921. doi: 10.1029/jb088ib07p05911
Kirschvink, J. L. (1980). The least-squares line and plane and the analysis of paleomagnetic data. Geophys. J. R. Astron. Soc. 62, 699–718. doi: 10.1111/j.1365-246X.1980.tb02601.x
Kronberg, B. I., Nesbitt, H. W., and Lam, W. W. (1986). Upper Pleistocene Amazon deep-sea fan muds reflect intense chemical weathering of their mountainous source land. Chem. Geol. 54, 283–294. doi: 10.1016/0009-2541(86)90143-9
Laj, C., Kissel, C., and Beer, J. (2004). High resolution global paleointensity stack since 75 kyr (GLOPIS-75) calibrated to absolute values. Geophys. Monogr. Ser. 145, 255–265. doi: 10.1029/145gm19
Liu, Q. S., Roberts, A. P., Larrasoana, J. C., Banerjee, S. K., Guyodo, Y., Tauxe, L., et al. (2012). Environmental magnetism: principles and applications. Rev. Geophys. 50:RG4002. doi: 10.1029/2012rg000393
Parés, J. M., Hassold, N. J. C., Rea, D. K., and van der Pluijm, B. A. (2007). Paleocurrent directions from paleomagnetic reorientation of magnetic fabrics in deep-sea sediments at the Antarctic Peninsula Pacific margin (ODP Sites 1095, 1101). Mar. Geol. 242, 261–269. doi: 10.1016/j.margeo.2007.04.002
Tamburini, F., Adattea, T., Föllmia, K., Bernasconib, S. M., and Steinmannet, P. (2003). Investigating the history of east Asian monsoon and climate during the last glacial-interglacial period (0–140,000 years): mineralogy and geochemistry of ODP Sites 1143 and 1144, South China Sea. Mar. Geol. 201, 147–168. doi: 10.1016/S0025-3227(03)00214-7
Tauxe, L., and Wu, G. (1990). Normalized remanence in sediments of the western equatorial Pacific: relative paleointensity of the geo-magnetic field? J. Geophys. Res. 95, 12337–12350. doi: 10.1029/JB095iB08p12337
Torrent, J., and Barron, V. (2002). “Diffuse reflectance spectroscopy of iron oxides,” in Encyclopedia of Surface and Colloid Science, ed A. T. Hubbard (New York, NY: Marcel Dekkar Inc.), 1438–1446.
Wang, Y. J., Cheng, H., Edwards, R. L., An, Z. S., Wu, J. Y., Shen, C.-C., et al. (2001). A high-resolution absolute-dated late pleistocene monsoon record from Hulu Cave, China. Science 294, 2345–2348. doi: 10.1126/science.1064618
Wei, G. J., Deng, W. F., Liu, Y., and Li, X. H. (2007). High-resolution sea surface temperature records derived from foraminiferal Mg/Ca ratios during the last 260 ka in the northern South China Sea. Palaeogeogr. Palaeoclimatol. Palaeoecol. 250, 126–138. doi: 10.1016/j.palaeo.2007.03.005
Wei, G. J., Liu, Y., Li, X. H., Shao, L., and Fang, D. Y. (2004). Major and trace element variations of the sediments at ODP Site 1144, South China Sea, during the last 230 ka ad their palaeoclimate implications. Palaeogeogr. Palaeoecol. 212, 331–342. doi: 10.1016/S0031-0182(04)00329-3
Wei, G. J., Li, X. H., Liu, Y., Shao, L., and Liang, X. R. (2006). Geochemical record of chemical weathering and monsoon climate change since the early Miocene in the South China Sea. Paleoceanography 21, PA4214. doi: 10.1029/2006PA001300
Yang, X. Q., Heller, F., Wu, N. Y., Yang, J., and Su, Z. H. (2009). Geomagnetic paleointensity dating of South China Sea sediments for the last 130 kyr. Earth Planet. Sci. Lett. 284, 258–266. doi: 10.1016/j.epsl.2009.04.035
Keywords: chemical weathering intensity, terrigenous flux, marine sediments, magnetic signals, late pleistocene
Citation: Yang X, Peng X, Qiang X, Li N, Zhou Q and Wang Y (2016) Chemical Weathering Intensity and Terrigenous Flux in South China during the Last 90,000 Years—Evidence from Magnetic Signals in Marine Sediments. Front. Earth Sci. 4:47. doi: 10.3389/feart.2016.00047
Received: 27 December 2015; Accepted: 08 April 2016;
Published: 28 April 2016.
Edited by:
Juan Cruz Larrasoaña, Instituto Geológico y Minero de España, SpainReviewed by:
Alexandra Abrajevitch, Institute of Tectonics and Geophysics, RussiaCopyright © 2016 Yang, Peng, Qiang, Li, Zhou and Wang. This is an open-access article distributed under the terms of the Creative Commons Attribution License (CC BY). The use, distribution or reproduction in other forums is permitted, provided the original author(s) or licensor are credited and that the original publication in this journal is cited, in accordance with accepted academic practice. No use, distribution or reproduction is permitted which does not comply with these terms.
*Correspondence: Xiaoqiang Yang, ZWVzeXhxQG1haWwuc3lzdS5lZHUuY24=
Disclaimer: All claims expressed in this article are solely those of the authors and do not necessarily represent those of their affiliated organizations, or those of the publisher, the editors and the reviewers. Any product that may be evaluated in this article or claim that may be made by its manufacturer is not guaranteed or endorsed by the publisher.
Research integrity at Frontiers

Learn more about the work of our research integrity team to safeguard the quality of each article we publish.