- 1Sea Ice Physics, Alfred-Wegener-Institut Helmholtz-Zentrum für Polar- und Meeresforschung, Bremerhaven, Germany
- 2Cold Regions Research and Engineering Laboratory, Hanover, NH, USA
Light measurements in the ocean provide crucial information about the energy fluxes in the climate and ecosystem. Currently radiative transfer problems are usually considered in horizontally homogeneous layers although it is known to be a crude assumption in many cases. In this paper, we examine the effects of a horizontally inhomogeneous sea ice layer on the light field in the water underneath. We implemented a three dimensional model, capable to simulate the light field underneath arbitrary surface geometries using ray optics. The results show clear effects of the measurement geometry on measured fluxes obtained with different sensor types, which need to be taken into account for the correct interpretation of the data. Radiance sensors are able to better sense the spatial variability of ice optical properties as compared to irradiance sensors. Furthermore, we show that the determination of the light extinction coefficient of water from vertical profiles is complicated under a horizontally inhomogeneous ice cover. This uncertainty in optical properties of the water, as well as the measurement geometry also limits the possibility to correct light measurements taken at depth for the influence of water in between the sea ice and the sensor.
Introduction
Light measurements using radiometers are an important tool in geosciences. They provide crucial input data for various disciplines. Inherent optical properties are often derived from vertical profiles across various disciplines from atmospheric shortwave radiation measurements (e.g., Ohmura et al., 1998) over rain forest ecology (e.g., Nicotra et al., 1999) to ocean optics (e.g., Antoine et al., 2014). In most of those cases the approach of horizontally infinite homogenous layers is a sufficiently good approximation of reality.
Light measurements above, in and underneath the sea ice are of particular interest due to their crucial role in the description of the surface energy budget of sea ice and the light conditions available to organisms associated to the ice (Perovich, 1996). In contrast to most other above named cases, the light field underneath sea ice exhibits a high spatial variability on length scales smaller or of similar size as the measurement footprint of the instruments (Perovich, 1990; Petrich et al., 2012b). Horizontal variability on those length scales is usually not considered in the interpretation of light measurements apart from a few exemptions—such as light focusing by waves at the ocean surface (Wijesekera et al., 2005).
The horizontal heterogeneity of Arctic sea ice is especially pronounced in the summer season when melting reshapes the surface and causes the formation of melt ponds (Fetterer and Untersteiner, 1998; Petrich et al., 2012a) and an increased number of floe edges due to breakup of the pack ice (Perovich and Jones, 2014). This surface looks similar to a jigsaw puzzle from the air and the complicated geometry heavily influences the light field underneath (Ehn et al., 2011; Frey et al., 2011). Typically geometric effects of the sea ice cover have not been taken into account during data interpretation.
The objective of this paper is to illustrate the various effects of measurement geometry to facilitate correct interpretation of future under ice light measurements. We discuss in particular the constraints for corrections of measurements not taken directly at the ice underside and the influence on retrieval of water properties—such as the extinction coefficient—by vertical light profiles in ice covered waters.
Methods
To evaluate the effects of measurement geometry on under ice light measurements, we developed a three dimensional model of geometric radiometry. It builds on previous models of the under ice light field. These models did not account for arbitrary surface variations by either only considering a two dimensional linear transect (Katlein et al., 2014) or strongly simplified surface geometries that allow for algebraic solutions (Frey et al., 2011). Here we present a three dimensional model, that can be used under arbitrary light conditions at the ice underside.
The goal of our model is to calculate the under ice light field as measured by different sensors under an arbitrary inhomogeneous ice cover in an efficient manner. The model is of purely geometric nature using only ray optics. It is not taking into account scattering within the medium—here sea-water—which is a very good approximation for the clear water found underneath sea ice in the central Arctic Ocean, except for strong bloom situations. We consider the ice to have a flat bottom and all distances are measured relative to the ice bottom. To be able to separate the effects caused by geometry from effects of ice topography and lateral transport of light in the ice by scattering, which has been investigated previously (Petrich et al., 2012b), the model calculates the under-ice light field geometry based on the light transmitted to the ice bottom.
Downwelling planar irradiance F is defined as the cosine weighted integral over downwelling radiance L(θ, ϕ) in the upper half space with the zenith angle θ and the azimuth angle ϕ.
Numerical integration of Equation 1 can be achieved in various ways. A computationally efficient way is a high order Lebedev-quadrature (Lebedev and Laikov, 1999), where the unit sphere is divided into up to 5810 similarly sized sub-segments according to certain symmetry criteria. Of those, 2861 segments represent the upward looking solid angles Ωi. The angular integration then reduces to a sum over all upward pointing light rays Li with weights ωi representing the respective solid angle covered by the segments:
For each single ray the radiance Li reaching the detector can then be determined by calculating the intersection point of the respective ray with the surface plane from the given zenith and azimuth angles and the depth of the detector z (Figure 1). The surface plane is represented by a sufficiently large matrix defining surface light values (sea ice transmittance or total flux). Light transmittance L was set to 0.04 for bare ice and 0.22 for melt ponds according to Nicolaus et al. (2012) for the sample calculations, but every other representation also of continuous light transmittance fields can be used for calculations. The surface matrix needs to be wide enough to cover enough grazing rays with large zenith angles. A horizontal extent of at least 10 times the investigated sensor depth ensures numerical stability and accuracy of better than 2% (10%) for planar (scalar) irradiance. However, the picked surface values cannot be inserted directly into Equation 2, but need to be corrected for both, the angular distribution of radiance emitted from the underside of the sea ice, and the angular sensitivity of the detector.
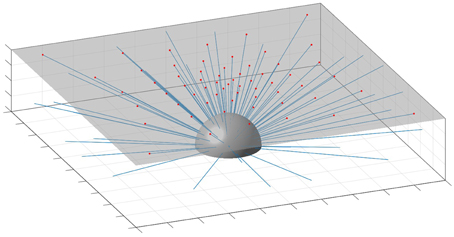
Figure 1. Geometry of the light model integrator. The half sphere represents the unit Lebedev sphere with blue rays pointing in the direction of each segment. Rays are intersecting the surface (gray transparent layer) in the location of the red dots. At these locations radiance values are taken from the inhomogenous surface matrix.
There are several versions of radiance distribution implemented in the model. In the fully isotropic case, the radiance is the same in any direction. As this is not the case under strongly scattering media, we only implemented it into the model for validation purposes, as the ratios of different sensor types are only trivially defined for a completely isotropic light field (Mobley, 1994). In realistic cases, the normalized angular radiance distribution is described by the exit function of an isotropically scattering medium presented by Kokhanovsky (2006)
or for cases of anisotropic scattering in sea ice
with the anisotropy parameter γ and θ in units of ° as presented by Katlein et al. (2014). Here we only present results for the case of isotropic scattering in ice being an upper bound, as a more downward peaked radiance distribution reduces geometric effects (Katlein et al., 2014). Due to the persistent low stratus clouds in the summer Arctic this radiance distribution is also a suitable approximation in the case of open water with scattered ice floes. The light conditions at the ice bottom are given as transmittances or fluxes of planar irradiance, so the surface values need to be divided by π, that the resulting computation yields irradiance values.
The second correction of the radiances Li is the sensor dependent weighting of different zenith angles θi. While for planar irradiance the radiance needs to be weighted with the cosine of the zenith angle θ, scalar irradiance is calculated without any further weighting. For calculation of radiance sensor readings, only rays with a zenith angle θ smaller than half the angle given by the sensors field of view are considered. The result is then divided by the solid angle covered by the cone of the sensors field of view. Due to the finite segments of solid angle represented in the Lebedev sphere, this calculation only provides stable results for sufficiently large field of view of the radiance sensor (10°).
Before final evaluation of the sum, all obtained and corrected radiances are scaled to account for water absorption with a radiance extinction coefficient using the respective pathlength d of the ray from the surface to the sensor and the radiance extinction coefficient κ. In summary, this leads to the following radiances from the respective directions of the Lebedev-Sphere:
For validation it was checked, that the model correctly reproduces the ratios between measurements with different sensor types and the exponential decay under a homogenous surface. In particular, the apparent extinction coefficient determined for all three sensor types matches the radiance extinction coefficient, as expected in the asymptotic limit. A MATLAB (version R2014b) implementation of the model can be downloaded from the MATLAB file exchange under http://www.mathworks.com/matlabcentral/fileexchange/50566-geometric-light-field-model.
Results
To evaluate the effect of surface geometry, we ran the model for four surface geometries depicted in Figure 2. They correspond to the following sea ice features: The semi-infinite obstruction with a linear edge (Figure 2A) is a first approach to investigating lateral effects. The geometry is applicable to any sharp large scale contrast in the ice optical properties, especially to edges of ice floes. A linear obstruction (Figure 2B) is similar to the geometry of pressure ridges. A single melt pond was approximated by a circular patch with higher light transmission (Figure 2C) and a part of a classified aerial image enabled for evaluation of a real melt pond geometry with a pond fraction of 12% (Figure 2D).
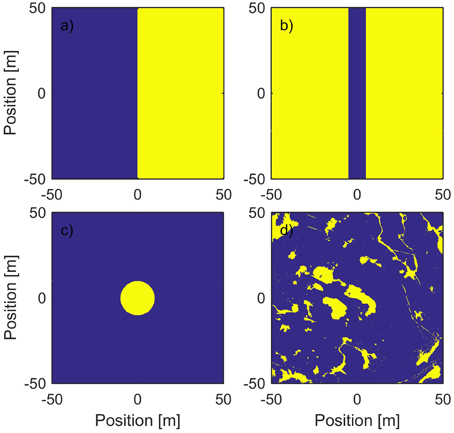
Figure 2. The different geometries used in this study. Yellow color depicts high light transmittance and blue color low light transmittance. The surface geometries resemble (A) a floe edge, (B) a pressure ridge, (C) a melt pond, and (D) a real geometry of melt pond covered sea ice extracted from photography.
Lateral Effects at a Linear Edge
The response of different light sensors on a transect crossing a linear edge is shown in Figure 3. This example comprises two zones of shortwave light transmittances (250–2500 nm) of 0.04 and 0.22 and a water extinction coefficient of κ = 0.1m−1, typical for Arctic first year ice in the summer (Nicolaus et al., 2012). While the narrow footprint of the radiance sensor (10°) reproduces the sharp contrast in light measurements even at greater depths, the measurements with the planar and scalar irradiance sensors are strongly influenced by geometric effects at the boundary. The contrast gets smoothed by the large footprint of the irradiance sensors. Light is propagating laterally into the darker area from the adjacent bright patch leading to irradiance levels higher than expected from a one dimensional model. Vice versa, measurements under the bright patch are influenced by the adjacent dark patch leading to lower light measurements than expected from a one dimensional model. At increasing depths, the contrast between both zones gets increasingly smeared out leaving only a weak contrast. The variability of the surface light field can thus only be captured appropriately, when using radiance sensors or limiting the distance of irradiance sensors to the sea ice. Scalar irradiance sensors show the strongest geometric effects.
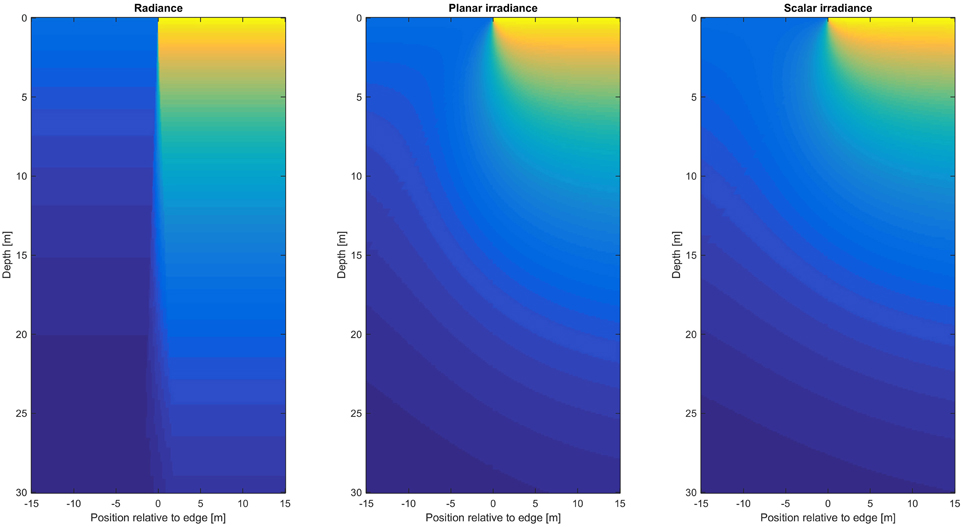
Figure 3. Under ice light transmittance across a semi-infinite boundary measured with radiance (left), planar irradiance (middle), and scalar irradiance (right) sensors. Colors represent normalized light measurements from bright (yellow) to dark (blue). The scenario uses ice transmittances of 0.22 (right of the edge) and 0.04 (left of the edge) and a depth independent water extinction coefficient of κ = 0.1 m−1.
From the different response of the three sensors to simple geometric variation, we can immediately deduct, that the ratios between radiance and planar or scalar irradiance are not constant in space under a spatially varying sea ice cover. While the ratio of different light sensor readings is often used to describe the optical properties of the water body in open ocean optics (Mobley, 1994), the geometric variation of the ice cover makes such an approach difficult in ice covered seas.
To allow for the application of the results to any combination of transmittance values, we normalized the calculated values in such way, that the range between the asymptotical light values far into each region is mapped to the interval from 0 to 1. When considering absorption to calculate the asymptotic values at a certain depth, the resulting relative light field geometry is independent of water absorption.
The calculated lateral transects are shown for three different depths in Figure 4. The radiance measurements follow a step curve, with a tapering section of a width given by the field of view of the sensor the distance to the surface.
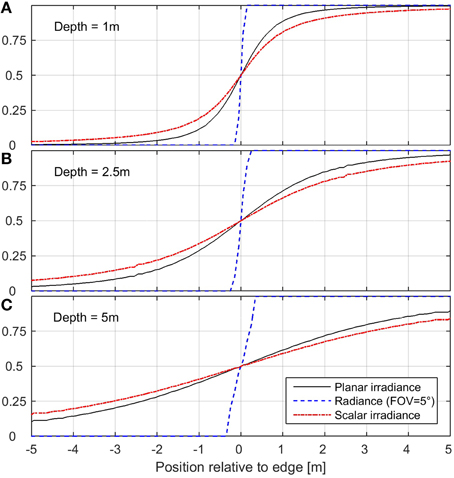
Figure 4. Lateral transect of light measurements across a semi-infinite boundary in 1 m (A), 2.5 m (B), and 5 m (C) depth below the ice water interface.
The irradiance sensors show a different characteristic response, a smooth transition between the asymptotic values. For a first estimation of the lateral extent of the geometric effects, we found that at the distance from the edge, that equals the distance of the sensor from the ice underside, the reading of planar (scalar) irradiance is about 12% (20%)—of the difference in light transmission between the zones—away from the asymptotic value. The distance at which the irradiance has reached a difference of less than 1/e of the difference in light transmission is linearly dependent on the distance between sensor and ice (Figure 5). Thus, the distance to the ice gives a first order approximation of the extent of geometric effects in the lateral dimensions.
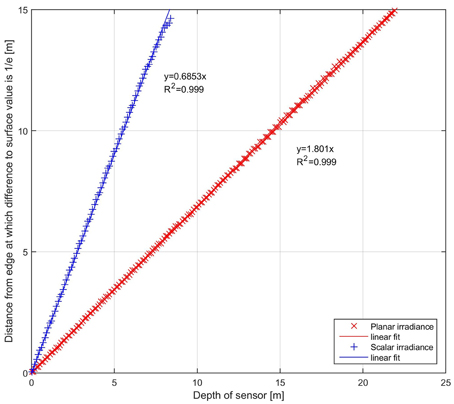
Figure 5. This plot shows the distance from the edge at which the difference of the sensor reading from the true asymptotical value has decreased to 1/e of the difference of light transmission across the edge (e-folding length).
The calculated transect of planar irradiance was fitted with a piecewise exponential function F adapted from Petrich et al. (2012b):
where the coefficient of the lateral exponential decay a is given by the distance of the sensor to the ice by a = 1.405d−1. The fitted equation matches the calculated curve very well with an adjusted R2 > 0.99. For scalar irradiance the same equation can be used with a different coefficient a = 0.811d−1. From now on we will focus on results regarding planar irradiance only, as the smoothing across light contrasts for spherical irradiance is very similar but somehow stronger.
We want to point out, that Equation 6 describes the pure geometric effect of a contrast in ice optical properties on the under ice light field. The absolute magnitude of the geometric effects is of course dependent on the contrast in light transmittance. Similar equations have been proposed by Petrich et al. (2012b) and Ehn et al. (2011) but in the context of lateral light propagation due to scattering within the ice.
Lateral Effects Associated with Sea Ice Features
The results from the linear semi-infinite obstruction can be qualitatively generalized to the more complex situation underneath melt ponds, pressure ridges, and leads in the ice cover. For pressure ridges and leads being mostly linear features, the results of the previous section can be used directly, if the ridge or lead is wider than two times the sensor depth. If the ridge or lead is narrower than this threshold, irradiance levels will not reach the asymptotic end value under the obstruction. The contrast in light transmittance then seems weaker than it actually is. This is similar for circular features such as melt ponds, but due to the circular geometry, the asymptotic end value underneath the pond will only be reached at a slightly greater distance from the pond edge as compared to a linear feature.
Vertical Effects Associated with Ridges and Melt Ponds
Figure 6 shows the calculated light field underneath a darker linear feature. It is clearly visible, that the surface geometry can distort the vertical profile away from an exponential decay. While under bright patches, the vertical profile follows an exponential decay monotonically decreasing with increasing depth, the irradiance maximum can be located at depth under dark patches. This is due to the fact that the adjacent brighter areas get into the large footprint of the irradiance sensor when getting to greater depth and has been observed before (Frey et al., 2011; Nicolaus and Katlein, 2013).
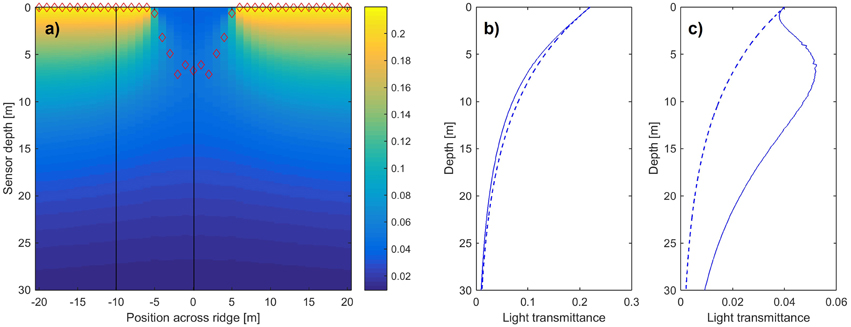
Figure 6. (A) Vertical depth profiles across a linear dark patch. Red diamonds mark the location of the maximal irradiance. (B) Vertical irradiance profile for the position shown by the black lines in a within the bright patch (C) and in the middle under the dark patch. Solid blue lines show the calculated irradiance profile while dashed lines are given by a one dimensional exponential decay model.
The depth of this deep irradiance maximum is dependent on several factors: The width of the dark area and the distance of the sensor to the boundaries. While the irradiance maximum is located at the surface under the bright patch, it quickly submerges to a typical depth of 5–10 m. If the dark patch is large enough, the magnitude of the deep irradiance maximum decreases. The larger the dark patch, the deeper the irradiance maximum is located. Contrary, a greater water extinction coefficient compensates the effect and reduces the maximum depth, as deep irradiance maxima then can only be found in a narrower zone close to the boundary between bright and dark patch. Additionally a downward peaked anisotropic radiance distribution causes deeper irradiance maxima, but further limits their lateral extent (Katlein et al., 2014).
Extraction of the extinction coefficient from the calculated light field under a circular melt pond of varying size revealed significant differences to the given radiance extinction coefficient (Figure 7). Even though the vertical profiles could be well fitted with an exponential decay law (R2 > 0.98), the apparent extinction coefficient differs from the actual one even under very large ponds. If the pond radius is equal to the maximum depth of the sensor during the profile, the retrieved apparent extinction coefficient is still deviating about 25% from the true value. Usually the pond radii are much smaller than the depth of the profile, making a robust retrieval of the extinction coefficient of sea water from vertical irradiance profiles difficult in ice covered waters. This shows, that the influence of geometric effects on the light field cannot be ruled out, even when the profiles seem to follow a perfect exponential decay.
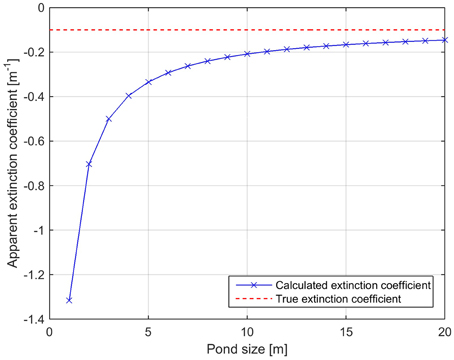
Figure 7. Extinction coefficients as retrieved from vertical depth profiles under the middle of a melt-pond of varying radius.
Combined Lateral and Vertical Effects in a Real Geometry
We calculated the irradiance field underneath a real surface geometry from a classified aerial image (Figure 8) obtained during a helicopter flight north of Greenland in July 2014 (http://epic.awi.de/37745/). Figure 8B shows how different the vertical profiles are when taken at different close lying points. The variability of the light field reduces with depth as can be seen by the sharpening of the main peak in the histograms (Figure 8C). Due to the binary representation of light transmittance, variability appears to increase in the first few meters underneath the ice—an artifact not present in the continuous representation of light transmission as presented in Figure 9C. To assess the abilities to extract water extinction coefficients, Analysis of all 2600 calculated vertical profiles under the real geometry revealed a mean extinction coefficient of when only considering fits where R2 > 0.9. While this result seems to show accuracy of extraction of the extinction coefficient underneath a spatially varying ice cover, we want to point to the fact, that only ~48% of the depth profiles could be fitted with a R2 > 0.9. Even within this limited selection of vertical profiles, the mean deviation () of the retrieved extinction coefficient κr from the true extinction coefficient κ is 28% with values of κr ranging between and . About 10% of the extracted extinction coefficients were overestimated by more than 120%. To obtain an extinction coefficient closer than 10% to the real one from averaging of several vertical profiles, one would need to consider over 200 randomly positioned not obviously contaminated profiles, which is not practicable. Estimates can in general be significantly improved to reduce the mean deviation from 27 to 7% by only considering the lower part (>15 m depth) of the vertical profile which is less affected by geometric effects. As the extinction coefficient might vary vertically, this estimate may though not represent the water layer close to the sea ice.
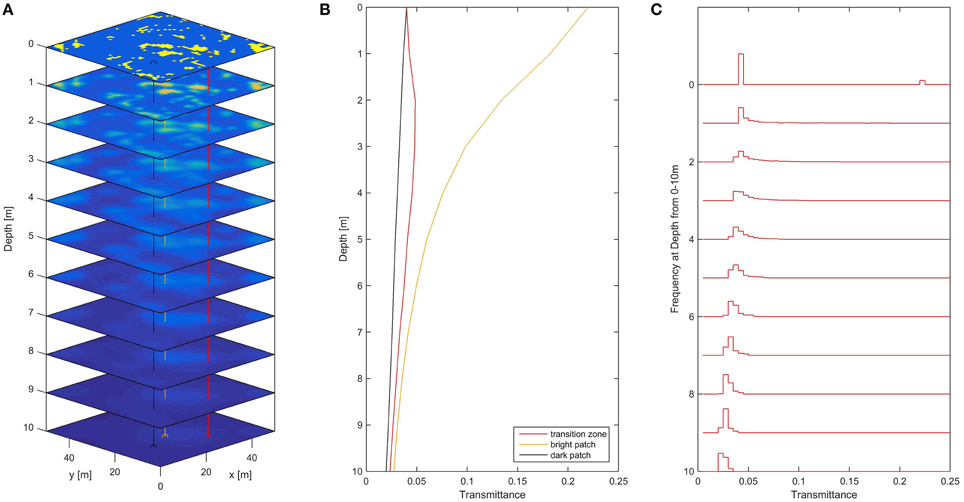
Figure 8. (A) Depth slices of the light field underneath a real surface geometry extracted from an aerial image and idealized by classification into two transmittance classes. Bright colors show high light transmittance. (B) Vertical irradiance profiles extracted at three different close lying locations indicated in (A). (C) Probability distributions of the under-ice light field as measured in depths from 0 to 10 m.
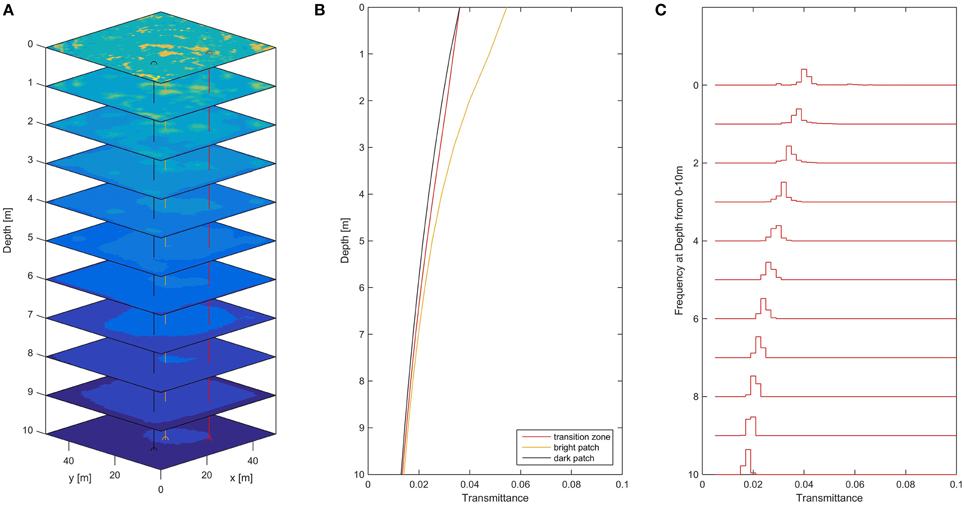
Figure 9. (A) Depth slices of the light field underneath a real surface geometry extracted from an aerial image. Transmittance values are obtained from a simplistic radiative transfer model. Bright colors show high light transmittance. (B) Vertical irradiance profiles extracted at three different close lying locations indicated in (A). (C) Probability distributions of the under-ice light field as measured in depths from 0 to 10 m.
We repeated the calculations for a continuous light-transmittance field T derived from a simple radiative transfer model T = (1−α) exp(−1.5zi) and field observations of ice thickness zi and albedo α (Figure 9) to contrast to the simplified case of two ice classes. While the main results stay unchanged, influence of geometric effects is less obvious. This is mainly due to the fact, that due to the comparably high ice thickness and high pond albedos measured in the field (Katlein et al., 2015), the contrasts in transmittance are lower than for the typical case of Arctic first-year sea ice used for the binary representation of light transmittance. The continuous representation also leads to softer spatial contrasts. In this more realistic case, the mean deviation of the extinction coefficient κr retrieved from relatively uncontaminated profiles (R2 > 0.9) from the true extinction coefficient κ is only 8% with values of κr ranging between and . This is a smaller deviation than in the idealized case, but still significant. If more contaminated profiles (R2 < 0.9) are included in the analysis, errors grow rapidly.
Furthermore, we evaluated the effect of lateral geometry on measured data to explore the advantages and disadvantages of correcting measurement data for the distance between sensor and the ice water interface. Using the true extinction coefficient for correction of planar irradiance (radiance) values assuming an exponential decay law, we determined mean deviations between calculated and true value of 45% (10%) at a depth of 5 m and 60%(35%) at a sensor depth of 30 m. When using an extinction coefficient deviating from the true one by the mean error in the retrieval from vertical profiles (27%), this deviation increases to 52% at 5 m and 81% at 30 m depth. Considering the worst case deviation of retrieved apparent extinction coefficient of in our case , a deviation of 440%, the mean error of the depth corrected data is significantly bigger than the mean error of uncorrected data for all sensor depths shallower than 3 m.
In spite of the errors when comparing specific points, depth correction successfully corrects the mean energy loss with depth. Contrary it cannot restore the variability of the light field present in the surface, which is better accomplished by radiance sensors (Figure 10).
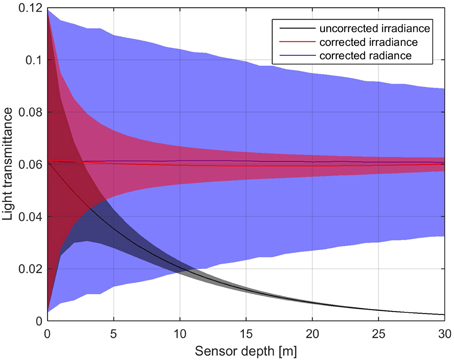
Figure 10. Mean (solid lines) and standard deviation (colored area) of light transmittance over sensor depth for uncorrected irradiance (black), depth corrected irradiance (red), and depth corrected radiance data (blue).
Discussion
Relevance of Geometric Effects
Our work shows, that geometric effects can play an important role in the interpretation of optical measurements under inhomogeneous sea ice. They certainly need to be taken into account for studies with a spatial resolution on the meter scale and in the case of typical melt-pond covered Arctic summer sea ice due to the strong contrasts of light transmittance through adjacent bare and ponded ice. If the sea ice does not exhibit strong contrasts in optical properties, such as in thicker multi-year sea ice or during the winter season, then geometric effects are limited to floe edges and fields of small broken floes. Geometric effects are strongest when high contrasts (>2:1) in light transmission can be found on length scales between 1 and 30 m. For longer spatial scales and weaker contrasts geometric effects are less important. Their significance can be further reduced by lateral smoothing of light transmittance contrasts by in ice scattering, as well as stronger absorption and especially scattering in the water column. A more downward-peaked anisotropic radiance distribution as below sea-ice further increases the magnitude of geometric effects.
In many cases, geometric effects can be neglected without significant loss of information, as the presented numbers provide upper bounds and they are averaged out in larger scale studies of the energy balance. Nevertheless, they need to be considered in the cases presented above to avoid wrong interpretation of measurement data. Thus, we want to highlight the necessity, to check during processing whether a dataset is contaminated by geometric effects and take the appropriate measures.
Retrieval of Extinction Coefficients
The retrieval of inherent optical properties from the observation of apparent optical properties is a main objective of ocean optics observations (Light et al., 2008; Antoine et al., 2014). Our results show, that the inhomogeneous ice cover increases the difficulties for the retrieval of inherent optical properties from vertical profiles dramatically. To obtain valid measurements of inherent optical properties, the surface needs to be homogenous in a radius much bigger than the maximum depth of the vertical profile around the vertical profile. This does not only apply to measurements from instruments lowered through a hole in the ice (Frey et al., 2011), but also to optical packages deployed in the vicinity of sea ice (Bélanger et al., 2013), for example in a pool of open water next to the ship used to lower instrumentation in the water column or generally in the vicinity of ships. Unfortunately contamination from geometric effects may not be detectable from the shape of the vertical profile. While these geometric effects would not be as severe in radiance sensors, it is very likely that imperfect horizontal positioning during vertical profiles due to lateral drift and sensor tilt can also reduce the quality of the retrieval of inherent optical properties. While these restrictions strictly apply for pan- or monochromatic sensor data, they could at least in principle be overcome by dedicated inversion of multi- or hyperspectral data.
Precise modeling of the light field under sea ice needs to take into account the complex geometry of the sea ice surface and cannot be achieved by multiple one dimensional models. Thus, light measurements under sea ice should be interpreted in the context of spatial datasets of ice geometry, such as aerial images and ice bottom topography (Williams et al., 2013). In particular, care should be taken to account for the measurement geometry when investigating any geometric aspect of the under ice light field, such as high resolution lateral transects.
Depth Correction of Sensor Data
Our results show, that the usefulness of correcting light measurements taken at depth to the level of the ice-water interface is strongly dependent on the ultimate goal of the data analysis. For studies interested in the spatial variability of the light field, we recommend to use radiance sensors and convert the readings to irradiance at the ice bottom according to Katlein et al. (2014). If only irradiance sensors are available, they should be operated with minimum distance to the ice. Discarding data with a distance of more than a certain limit to the ice bottom instead of applying a correction, avoids introducing undetermined errors due to unknown exact geometry and water absorption. Even when water absorption is precisely known from direct measurements using a transmissometer, the geometric errors of a measurement taken at depth cannot be corrected. For example, a one dimensional “correction” of a measurement taken under a dark patch would result in too high light values at the ice bottom.
On the other hand, even an imperfect estimate of light extinction in the water column can provide a reasonable way, to account for the water in between sensor and ice when investigating the large scale average of measurements for studies of the energy balance.
The geometric effects average out on larger scales and thus do not affect the energy transfer to depth. However, the measurement geometry influences the shape of histograms of measured light values such as those presented in Nicolaus et al. (2013). Thus, geometric effects should be considered when picking modal values from histograms for upscaling efforts (Arndt and Nicolaus, 2014). Here data that is potentially contaminated by geometric effects should be discarded from the analysis.
Sensitivity of Different Sensor Types
We mostly showed results for planar irradiance data, as this sensor type is most widely used throughout the physical community (Perovich, 1996; Eicken and Salganek, 2010; Nicolaus et al., 2010; Hudson et al., 2013). The footprint of these sensors is very large leading to strong effects of measurement geometry. Radiance sensors have a narrower field of view and thus suffer less from geometric effects and better represent the true variability of light conditions even in measurements taken at depth. While this is an advantage in lateral surveys, it can also impact the quality of vertical profiles under a spatially varying ice cover, when the profile deviates from being perfectly vertical.
Spherical irradiance sensors behave similar to planar irradiance sensors, but have an even larger effective field of view as the proportional contribution of lateral traveling light to the signal is even bigger. The effects of measurement geometry are thus even stronger for spherical sensors making them the least suitable sensor for studies on spatial variability. This disadvantage for studies of spatial variability is of course an advantage, when only the mean energy fluxes are of interest.
Conclusion
We developed and implemented a model of geometric radiometry underneath spatially inhomogeneous surfaces and investigated the effects of various simplified geometries on the light field underneath. The model code has been made accessible to the public. Results show that radiance sensors are least affected by the measurement geometry and spherical irradiance sensors are mostly unsuitable for studies of spatial variability.
The effect of the inhomogeneous surface hinders effective retrieval of the inherent optical properties of the water column from vertical profiles in the sea ice covered ocean and limits the possibilities of correcting data that was measured at depth, for the influence of light extinction in water. Such corrections for sensor depth as well as the interpretation of ratios between different sensors have to be conducted in awareness of the ice geometry, for example using the information from aerial images. Great care should be taken when interpreting measurements taken over lateral contrasts in the optical properties of the sea ice. Here the distance of the sensor to the ice significantly smoothens out the contrast and might easily mask the effects of lateral light transport in the ice by scattering.
Author Contributions
All authors listed, have made substantial, direct and intellectual contribution to the work, and approved it for publication.
Conflict of Interest Statement
The authors declare that the research was conducted in the absence of any commercial or financial relationships that could be construed as a potential conflict of interest.
Acknowledgments
CK thanks the graduate school POLMAR for granting an outgoing scholarship to visit DP which supported the writing of this manuscript. DP thanks the Office of Naval Research for their support. We thank R. Gerdes and two anonymous reviewers of an earlier version for comments on the manuscript. This study was funded by the Alfred-Wegener-Institut Helmholtz-Zentrum für Polar- und Meeresforschung. The MATLAB code of the model used in this study is available at http://www.mathworks.com/matlabcentral/fileexchange/50566-geometric-light-field-model.
References
Antoine, D., Babin, M., Berthon, J.-F., Bricaud, A., Gentili, B., Loisel, H., et al. (2014). Shedding light on the sea: André Morel's legacy to optical oceanography. Ann. Rev. Mar. Sci. 6, 1–21. doi: 10.1146/annurev-marine-010213-135135
Arndt, S., and Nicolaus, M. (2014). Seasonal cycle and long-term trend of solar energy fluxes through Arctic sea ice. Cryosphere 8, 2219–2233. doi: 10.5194/tc-8-2219-2014
Bélanger, S., Cizmeli, S. A., Ehn, J., Matsuoka, A., Doxaran, D., Hooker, S., et al. (2013). Light absorption and partitioning in Arctic Ocean surface waters: impact of multiyear ice melting. Biogeosciences 10, 6433–6452. doi: 10.5194/bg-10-6433-2013
Ehn, J. K., Mundy, C. J., Barber, D. G., Hop, H., Rossnagel, A., and Stewart, J. (2011). Impact of horizontal spreading on light propagation in melt pond covered seasonal sea ice in the Canadian Arctic. J. Geophys. Res. 116:C00G02. doi: 10.1029/2010JC006908
Eicken, H., and Salganek, M. (2010). Field Techniques for Sea-Ice Research. Fairbanks, AK: University of Alaska Press.
Fetterer, F., and Untersteiner, N. (1998). Observations of melt ponds on Arctic sea ice. J. Geophys. Res. Oceans 103, 24821–24835. doi: 10.1029/98JC02034
Frey, K. E., Perovich, D. K., and Light, B. (2011). The spatial distribution of solar radiation under a melting Arctic sea ice cover. Geophys. Res. Lett. 38, L22501. doi: 10.1029/2011GL049421
Hudson, S. R., Granskog, M. A., Sundfjord, A., Randelhoff, A., Renner, A. H. H., and Divine, D. V. (2013). Energy budget of first-year Arctic sea ice in advanced stages of melt. Geophys. Res. Lett. 40, 2679–2683. doi: 10.1002/grl.50517
Katlein, C., Arndt, S., Nicolaus, M., Perovich, D. K., Jakuba, M. V., Suman, S., et al. (2015). Influence of ice thickness and surface properties on light transmission through Arctic sea ice. J. Geophys. Res. Oceans 120, 5932–5944. doi: 10.1002/2015jc010914
Katlein, C., Nicolaus, M., and Petrich, C. (2014). The anisotropic scattering coefficient of sea ice. J. Geophys. Res. Oceans 119, 842–855. doi: 10.1002/2013JC009502
Lebedev, V. I., and Laikov, D. N. (1999). A quadrature formula for the sphere of the 131st algebraic order of accuracy. Doklady Math. 59, 477–481.
Light, B., Grenfell, T. C., and Perovich, D. K. (2008). Transmission and absorption of solar radiation by Arctic sea ice during the melt season. J. Geophys. Res. Oceans 113:C03023. doi: 10.1029/2006JC003977
Mobley, C. D. (1994). Light and Water: Radiative Transfer in Natural Waters. Cambridge, MA: Academic Press.
Nicolaus, M., Hudson, S. R., Gerland, S., and Munderloh, K. (2010). A modern concept for autonomous and continuous measurements of spectral albedo and transmittance of sea ice. Cold Reg. Sci. Technol. 62, 14–28. doi: 10.1016/j.coldregions.2010.03.001
Nicolaus, M., and Katlein, C. (2013). Mapping radiation transfer through sea ice using a remotely operated vehicle (ROV). Cryosphere 7, 763–777. doi: 10.5194/tc-7-763-2013
Nicolaus, M., Katlein, C., Maslanik, J., and Hendricks, S. (2012). Changes in Arctic sea ice result in increasing light transmittance and absorption. Geophys. Res. Lett. 39, L24501. doi: 10.1029/2012GL053738
Nicolaus, M., Petrich, C., Hudson, S. R., and Granskog, M. A. (2013). Variability of light transmission through Arctic land-fast sea ice during spring. Cryosphere 6, 4363–4385. doi: 10.5194/tcd-6-4363-2012
Nicotra, A. B., Chazdon, R. L., and Iriarte, S. V. B. (1999). Spatial heterogeneity of light and woody seedling regeneration in tropical wet forests. Ecology 80, 1908–1926. doi: 10.1890/0012-9658(1999)080[1908:SHOLAW]2.0.CO;2
Ohmura, A., Gilgen, H., Hegner, H., Müller, G., Wild, M., Dutton, E. G., et al. (1998). Baseline surface radiation network (BSRN/WCRP): new precision radiometry for climate research. Bull. Am. Meteorol. Soc. 79, 2115–2136.
Perovich, D. K. (1990). Theoretical estimates of light reflection and transmission by spatially complex and temporally varying sea ice covers. J. Geophys. Res. Oceans 95, 9557–9567. doi: 10.1029/JC095iC06p09557
Perovich, D. K., and Jones, K. F. (2014). The seasonal evolution of sea ice floe size distribution. J. Geophys. Res. Oceans 119, 8767–8777. doi: 10.1002/2014jc010136
Petrich, C., Eicken, H., Polashenski, C. M., Sturm, M., Harbeck, J. P., Perovich, D. K., et al. (2012a). Snow dunes: a controlling factor of melt pond distribution on Arctic sea ice. J. Geophys. Res. 117:C09029. doi: 10.1029/2012JC008192
Petrich, C., Nicolaus, M., and Gradinger, R. (2012b). Sensitivity of the light field under sea ice to spatially inhomogeneous optical properties and incident light assessed with three-dimensional Monte Carlo radiative transfer simulations. Cold Reg. Sci. Technol. 73, 1–11. doi: 10.1016/j.coldregions.2011.12.004
Wijesekera, H., Pegau, W. S., and Boyd, T. (2005). Effect of surface waves on the irradiance distribution in the upper ocean. Opt. Express 13, 9257–9264. doi: 10.1364/OPEX.13.009257
Keywords: optics, irradiance, inherent optical properties, spatial variability, extinction coefficient
Citation: Katlein C, Perovich DK and Nicolaus M (2016) Geometric Effects of an Inhomogeneous Sea Ice Cover on the under Ice Light Field. Front. Earth Sci. 4:6. doi: 10.3389/feart.2016.00006
Received: 13 July 2015; Accepted: 13 January 2016;
Published: 02 February 2016.
Edited by:
Michael Lehning, École Polytechnique Fédérale de Lausanne, SwitzerlandReviewed by:
Agnieszka Herman, University of Gdansk, PolandErnesto Trujillo, École Polytechnique Fédérale de Lausanne, Switzerland
Peter Gege, German Aerospace Center, Germany
Copyright © 2016 Katlein, Perovich and Nicolaus. This is an open-access article distributed under the terms of the Creative Commons Attribution License (CC BY). The use, distribution or reproduction in other forums is permitted, provided the original author(s) or licensor are credited and that the original publication in this journal is cited, in accordance with accepted academic practice. No use, distribution or reproduction is permitted which does not comply with these terms.
*Correspondence: Christian Katlein, Y2hyaXN0aWFuLmthdGxlaW5AYXdpLmRl
 Christian Katlein
 Donald K. Perovich2