 Edward H. Bair
 Jeff Dozier
 Robert E. Davis3
95% of researchers rate our articles as excellent or good
Learn more about the work of our research integrity team to safeguard the quality of each article we publish.
Find out more
TECHNOLOGY REPORT article
Front. Earth Sci. , 30 September 2015
Sec. Hydrosphere
Volume 3 - 2015 | https://doi.org/10.3389/feart.2015.00058
Accurate measurement and modeling of the snowpack energy balance are critical to understanding the terrestrial water cycle. Most of the water resources in the western US come from snowmelt, yet statistical runoff models that rely on the historical record are becoming less reliable because of a changing climate. For physically based snow melt models that do not depend on past conditions, ground based measurements of the energy balance components are imperative for verification. For this purpose, the US Army Corps of Engineers Cold Regions Research and Engineering Laboratory (CRREL) and the University of California, Santa Barbara (UCSB) established the “CUES” snow study site (CRREL/UCSB Energy Site, http://www.snow.ucsb.edu/) at 2940 m elevation on Mammoth Mountain, California. We describe CUES, provide an overview of research, share our experience with scientific measurements, and encourage future collaborative research. Snow measurements began near the current CUES site for ski area operations in 1969. In the 1970s, researchers began taking scientific measurements. Today, CUES benefits from year round gondola access and a fiber optic internet connection. Data loggers and computers automatically record and store over 100 measurements from more than 50 instruments each minute. CUES is one of only five high altitude mountain sites in the Western US where a full suite of energy balance components are measured. In addition to measuring snow on the ground at multiple locations, extensive radiometric and meteorological measurements are recorded. Some of the more novel measurements include scans by an automated terrestrial LiDAR, passive and active microwave imaging of snow stratigraphy, microscopic imaging of snow grains, snowflake imaging with a multi-angle camera, fluxes from upward and downward looking radiometers, snow water equivalent (SWE) from different types of snow pillows, snowmelt from lysimeters, and concentration of impurities in the snowpack. We give an example of terrain-corrected snow albedo measurements compared to several models and of sublimation measured from lysimeter and snow pillow melt. We conclude with some thoughts on the future of CUES.
The US Army Corps of Engineers Cold Regions Research and Engineering Laboratory (CRREL) and the University of California, Santa Barbara (UCSB) established a snow study site (CRREL-UCSB Energy Site, CUES) midway up Mammoth Mountain, California USA (37.643°N, 119.029°W, Figures 1, 2). Mammoth Mountain is a silica dome cluster (Hildreth, 2004) with a base elevation of 2424 m and a summit of 3369 m. It is one of North America's most visited ski areas and its gondola operates year-round. CUES is located at 2940 m, just below the tree line and is one of only five full energy balance sites in the Western US (Bales et al., 2006); the others are Reynolds Creek, ID; Niwot Ridge, CO; Senator Beck basin, CO; and Mt. Bigelow, AZ. Compared to these sites, CUES is unique for its combination of location, altitude, and ease of access. Approximately 65% of the water supply for Los Angeles comes from surface runoff in the eastern Sierra Nevada (City of Los Angeles Department of Water and Power, 2015), so accurate measurement of the water in the snowpack at Mammoth Mountain and other sites is important for downstream water demands and needs of mountain ecosystems.
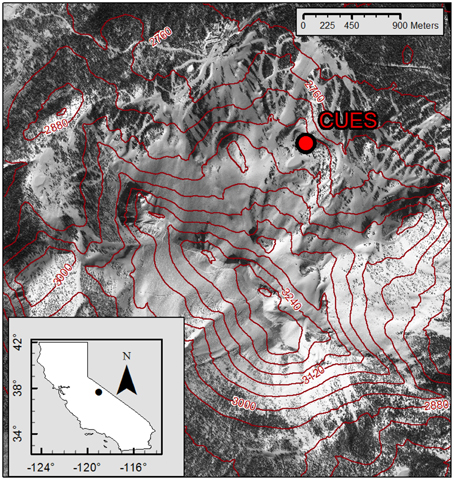
Figure 1. CUES and Mammoth Mountain, CA USA. Elevation contours are drawn in red, the interval is 60 m.
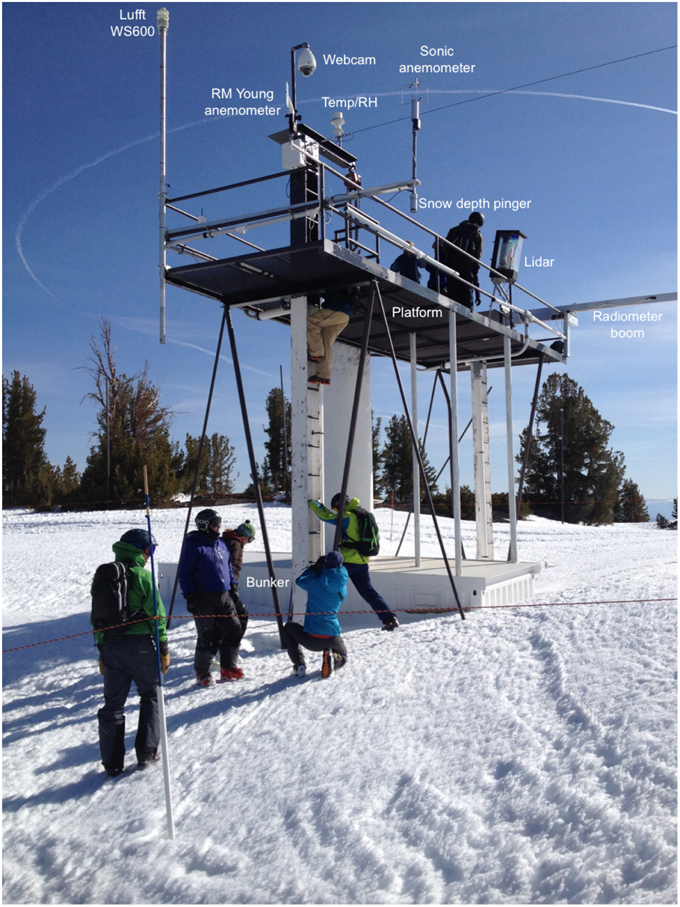
Figure 2. Students exploring CUES. Visible instruments are labeled. Photo courtesy of Chris Heckman.
Snowfall records at Mammoth Mountain date back to 1928, when the first snow course measurement was recorded at Mammoth Pass by the Los Angeles Department of Water and Power. Measurements near the current CUES site began in November 1968, as part of the USDA Forest Service Snow Ranger Program. Snow Rangers took manual precipitation and other meteorological measurements near the gondola mid station, now called McCoy station. In the 1970s, researchers began taking scientific measurements at a site 200 m from the current CUES location. These measurements focused on energy and mass balance of the snowpack (Davis and Marks, 1980; Davis et al., 1984), but also on snow textural properties and their relevance for remote sensing, hydrology, and avalanches (Davis and Dozier, 1984, 1989; Davis et al., 1985, 1987; Dozier et al., 1987).
In 1987, the CUES site was moved to its current location because Mammoth Mountain Ski Area planned to install a new chair lift that would have compromised the original location. Although the proposed chair lift was never built, the ski area generously erected a new platform at the current site (Figure 2). In 1991, a steel cargo container replaced the wooden “Santa Shack” that had previously housed data loggers and laboratory equipment on the ground (Painter et al., 2000).
In the late 1980s and 1990s, research from measurements taken at CUES and the nearby Sierra Nevada Aquatic Research Laboratory (SNARL) concentrated on snow chemistry, specifically ion elution (Bales et al., 1989), processes removing soluble tracers from snow (Bales et al., 1993), and theory of the chemical behavior of these trace species (Harrington and Bales, 1998). The latter work was integrated into the widely used snowpack evolution model SNTHERM (Jordan, 1991; Frankenstein et al., 2008). Studies during this time used newly built snowmelt lysimeters, which measure liquid water drainage from the snowpack. Other research at CUES focused on ground verification for remotely-sensed snow properties including the spectral reflectance of snow (Davis et al., 1993), coupled grain size and fractional snow covered area (Nolin and Dozier, 1993; Nolin et al., 1993; Painter et al., 1998), and liquid water in snow (Davis et al., 1985; Green et al., 2006).
In the 2000s, research on remotely-sensed snow properties continued at and around CUES (Painter et al., 2003; Painter and Dozier, 2004; Dozier et al., 2009), as well as snow depth mapping using a Frequency Modulated Continuous Wave (FMCW) radar (Yankielun et al., 2004), and high resolution snow temperature mapping (Tyler et al., 2008). In addition, studies on snow metamorphism and the role of impurities (Rosenthal et al., 2007; Bair et al., 2009) were conducted, as were studies on snow avalanches (Rosenthal et al., 2002; Rosenthal and Elder, 2003; Bair et al., 2008).
From 2010 to present, there has been ongoing research into snow avalanches (Bair et al., 2010, 2012b; Bair, 2013), a study on black carbon and dust concentrations in the snowpack (Sterle et al., 2013), and a study on using an auto-scanning LiDAR and snowflake camera to estimate mass flux (Bair et al., 2012a). During this period, CUES benefitted from networking improvements, including the Digital395 project (http://digital395.com/) and networked lift terminals.
The majority of the instruments at CUES are mounted on a 7.0 m platform, and are thus 7.0–9.0 m above the ground (Figure 2). Given the potential for deep snow accumulation at the site, the height of the instruments above the snow surface varies substantially throughout the year and between years. Below the platform, an enclosed cargo container contains data loggers, computing and networking equipment. Typically, cables connected from the data loggers to the instruments run through conduit up to the platform. For some instruments, such as the Multi-Angle Snowflake Camera (MASC), these cable runs are too long and cause signal degradation. Thus, the MASC computer, mounted directly below it on the platform inside a cooled and weather-proof housing, records its measurements.
In the ground to the north and south of the site are lysimeters, soil moisture and temperature probes, and snow pillows. Mounted to a boom extending out from the platform about 3.0 m are downlooking clear and near-infrared radiometers as well as ultrasonic snow depth range finders. These downlooking radiometers allow measurement of reflected solar radiation for albedo computation.
Radiometers and anemometers are generally calibrated annually by the manufacturer. Snow pillows are calibrated with manual pits annually. Other instruments such as temperature probes are calibrated as needed according to the manufacturers specifications. Typically maintenance occurs during the second week of September, the only planned interruption to year-round measurements.
Today, two computers and three Campbell Scientific CR3000 data loggers automatically record and store over 100 measurements from more than 50 instruments each minute. Some of the novel instruments and measurements currently include: a remotely operated LiDAR that scans the snow surface every 15 min (Figures 2, 3, and Supplementary Video Material); a MASC that images snowflakes as they fall (Figure 4); perforated solid state snow pillows that allow water drainage through the pillow; and a triangular reflector for aerial and satellite-based active radar snow depth measurement.
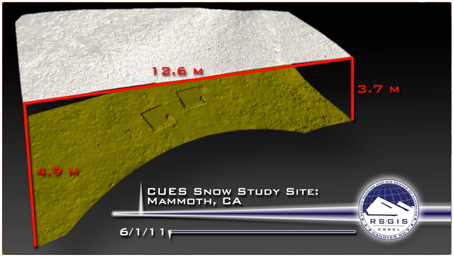
Figure 3. Still image from video of snowmelt, measured daily in 2011 by a LiDAR at CUES. Snow is shown in white and bare ground is shown in green. The video was created by compositing snow free and snow covered daily LiDAR scans during the melt season in 2011. The boxes in the ground are lysimeters. The video is available as supplementary material or at: http://www.snow.ucsb.edu/data/2011/lidar/.
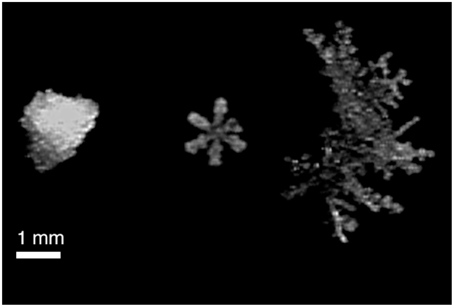
Figure 4. Snowflake images from CUES. Images were recorded by the Multi Angle Snowflake Camera in 2015.
We have several long term (10 years or longer at hourly or finer sampling) automated measurement groups from CUES (summarized in Table 1). Some of the instruments have changed over the years. The current instruments (Table 2) are state of the art and have been procured based on our collective experience with scientific monitoring in this harsh mountain environment.
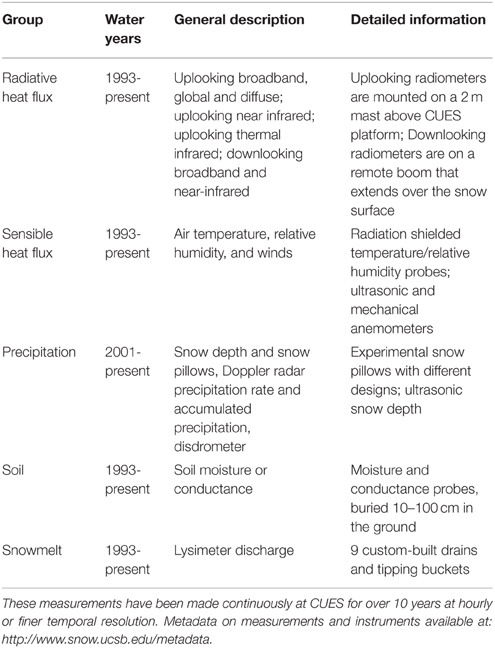
Table 1. Summary of long term measurements at CUES.
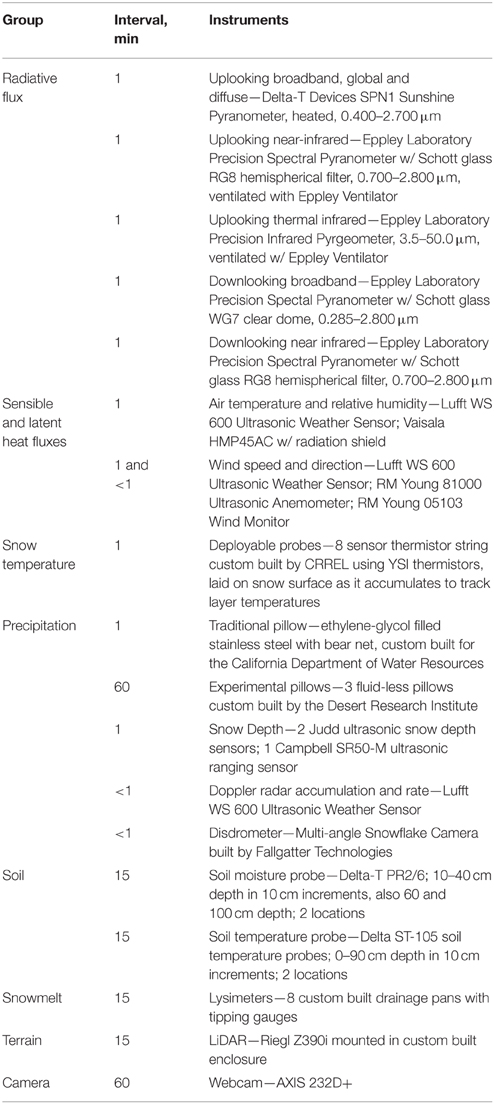
Table 2. Summary of current instruments at CUES as of May 2015.
Snowfall on Mammoth Mountain is generally heavy, but with high interannual variability. Since 2001, maximum seasonal snow depth at CUES (Figure 5) has averaged 3.6 m, but exceeded 6 m in 2006 when depth sensors were buried, and never got above 1.3 m in 2015. Continuous snow cover typically exists from the beginning of November to the end of May. Maximum snow water equivalent (SWE), measured at the nearby snow pillow on Mammoth Pass averages 1.21 m, but has been as low as 0.18 m (in 2015) and as high as 2.10 m (in 1986). A manually measured peak SWE of 2.20 m occurred on April 1st 1969, but given the potential for oversampling manual SWE cores (Farnes et al., 1982), possibly this measurement overestimates SWE by about 10%. November-April snowfall, measured at a ski patrol study plot near CUES at 2743 m, shows an average new snow density of 120 kg m−3.
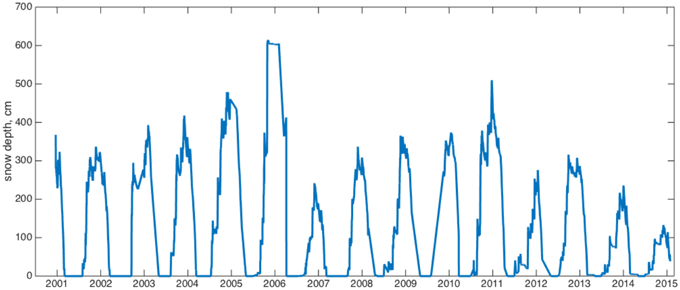
Figure 5. Snow depth at CUES. April 1, 2001–2015 is marked on the horizontal axis. The plateau in 2006 is a result of the depth sensor being buried.
Mammoth Mountain is exceptionally windy. Mean wind speeds at the top of Mammoth Mountain are 12 m s−1 and gusts as high as 80 m s−1 have been reliably measured. Winds speeds at CUES are lower (average 3 m s−1, Figure 6) but still create highly variable snow depths typical of sub-alpine locations that characterize much of the Southern Sierra Nevada. Wind directions from the southwest predominate.
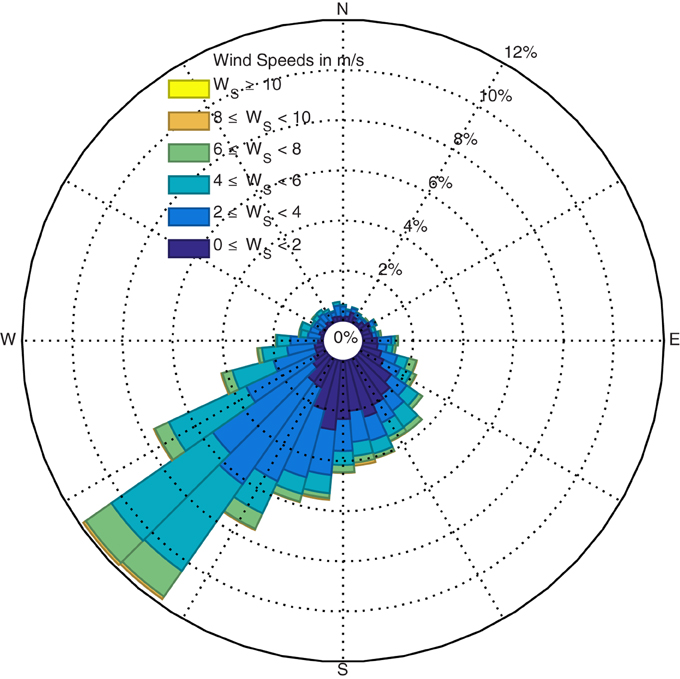
Figure 6. Wind rose for CUES 2002–2015. The colors correspond to wind speeds while the polar plot shows both the direction and the frequency of the binned wind speed/direction vectors.
The mean annual temperature at CUES is 4.2°C. The highest temperature recorded since 1992 is 26.7°C on 1998-7-14; the lowest is −24.4°C on 2007-1-12 (Figure 7). The December to March mean temperature of −2.7°C is slightly colder than the −2.0°C mean for coastal ski areas in the US (Mock and Birkeland, 2000). The colder temperatures result from the higher elevation of Mammoth Mountain and CUES (2940 m) compared to the average study plot elevation for the other ski areas (1753 m). Mammoth's higher elevation, associated with colder temperatures and absence of rain compared to most coastal ski areas, led Mock and Birkeland (2000) to classify its snow avalanche climatology as “intermountain” in about one third of the years and “coastal” in about two thirds.
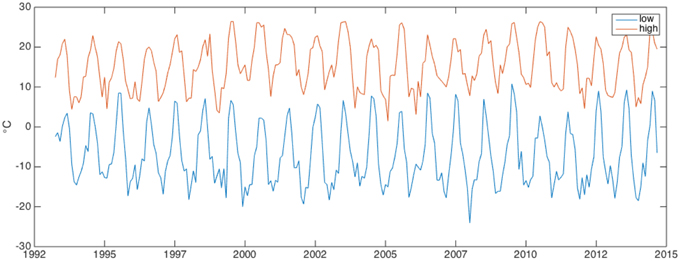
Figure 7. Monthly high and low temps at CUES 1992–2014. Missing values were filled with data from nearby sensors at similar elevations.
Daily solar radiation at CUES peaks at almost 1100 W m−2 under clear skies near the summer solstice (Figure 8), similar to other high altitude sites near this latitude (e.g., Landry et al., 2014). From November through April, manually recorded weather observations from the Mammoth Ski Patrol over 30 seasons show clear or mostly clear conditions 50% of days; party cloudy conditions 11% of days; and mostly cloudy or cloudy conditions 39% of days.
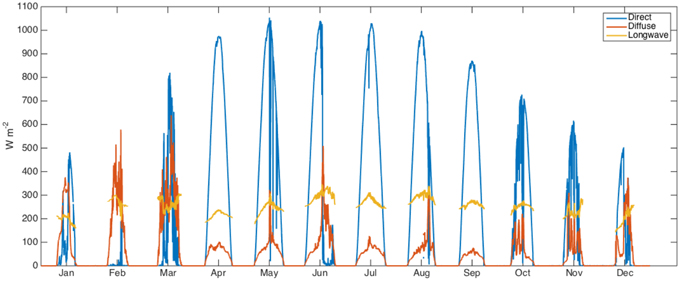
Figure 8. Solar radiation at CUES. Mid month incoming solar radiation for calendar year 2012. The curves show the measured incoming radiation on the 15th day of each month. The horizontal axis is truncated between each day. Direct and diffuse are measured over the solar spectrum. Longwave is measured over the thermal infrared spectrum.
The automated measurements are partitioned into three levels: level 0—raw output from data loggers; level 1—normalized (Codd, 2000) with limited filtering for errors; level 2—fully filtered for errors. Level 1 filtering elides measurements outside acceptable ranges for measurement times and values. Level 2 filtering omits measurements based on more advanced filters, such as spikes or drops, spurious zero values, and radiation measurements inconsistent with the known solar geometry (occasionally at sun angles near the horizon). Level 0-2 CUES measurements are stored in a relational MySQL database (http://www.mysql.com/), along with measurement and instrument metadata. Level 0 data are read into the database using Bash (http://www.gnu.org/software/bash/manual/bashref.html) shell scripts and formatted with Linux text stream editing tools, such as sed.
In addition, mappings from the level 0 to level 1 data are also stored. These mappings allow the database logger tables, which are similar to a common spreadsheet format—with many columns for each measurement date time—to be transformed into a normalized transaction table. In the transaction table, each measurement value, its date time, and foreign keys for instrument and measurement identifiers are stored as separate rows.
The transaction table is far more flexible than the logger table format. For instance, unlike the logger table, the format of the transaction table does not change if a measurement is added or removed. Above all, the normalized table makes tasks such as multi-year queries, where logger tables may have changed format several times, more efficient. Other benefits of database normalization at CUES include the ability for complex relational queries for data exploration, efficient updates for multi-year datasets when errors are corrected, tractable changes in measurements and instrumentation, and optimized indexing for large queries. CUES tables and queries are available freely and in real-time at http://www.snow.ucsb.edu/.
For the Level 3 data, we sometimes use nearby weather and snow measurement station data to fill-in gaps. The source of the fill-in data is recorded in the metadata. In cases where nearby measurements are not available, e.g., for downlooking radiometer measurements, we interpolate measurements when reasonable, noting interpolated measurements in the metadata.
CUES has proven useful for verifying incoming and outgoing radiation (e.g., Dozier et al., 2009), which have been shown to be dominant energy balance terms in a similar location in the Sierra (Marks and Dozier, 1992). As a case study, we show how radiometric measurements and snow albedo measured at CUES compare to several models. The amount of melt generated by a snowmelt model is highly sensitive to the snow albedo, because for bright surfaces (albedo in the range 0.7–0.9), a small error in albedo causes a larger relative error in absorption. Snow albedo is difficult to measure, perhaps because of poor cosine response in radiometers, sensitivity to illumination angle, and spatially varying impurities on the surface within the field of view of the downlooking instrument (Warren and Wiscombe, 1980a,b). Additionally, snow albedo measurements may need to be corrected for topography, since the snow surface is often not flat, but incoming solar measurements are taken on a level plane. The LiDAR scans at CUES, performed automatically every 15 min, provide an ideal method for correcting albedo measurements. Point clouds from the scans can be used to create local slope and aspect measurements for the area of snow under the downlooking radiometers. Using this highly local topographic information, we computed a correction factor c for the incoming solar radiation using illumination angles for the sloped snow surface (Painter et al., 2012a):
θ is the local illumination angle and θ0 is the illumination angle on a flat surface. These angles were computed using equations for solar geometry (Dozier and Frew, 1990). Then, the broadband snow albedo α was computed as
D↑ is the reflected global radiation, and B↓ and D↓ are the direct and diffuse downwelling global radiation. Using Equations (1) and (2), we computed α at CUES near the overpass time of the Moderate Resolution Imaging Spectrometer (MODIS) aboard the Terra satellite for five dates in 2011. We then compared these snow albedo measurements at CUES with those from four models: MODSCAG/MODDRFS using Gardner-Sharp, BATS, and a simple aging model (model acronyms are defined below and shown in Figure 9). The MODIS overpass time was used since it is the time of acquisition for the MODIS Snow Covered Area and Grain Size (MODSCAG, Painter et al., 2009) and MODIS Dust and Radiative Forcing in snow (MODDRFS, Painter et al., 2012b) grain size estimates for the CUES pixel. These grain size estimates and the local illumination angle θ were then used in another model (Gardner and Sharp, 2010) to arrive at a clean-snow albedo estimate aclean. Finally, half of the λvis term from MODDRFS was subtracted from the clean-snow albedo to account for albedo degradation from light absorbing impurities at the surface of the snowpack.
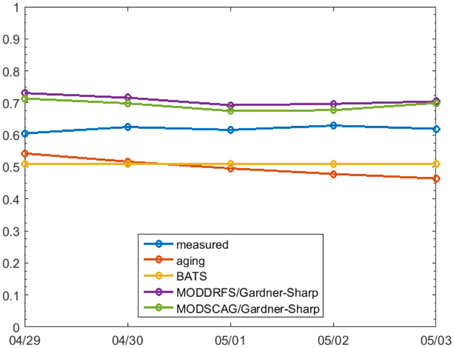
Figure 9. Terrain corrected albedo at CUES in 2011. Measured (terrain corrected) and modeled snow albedo at CUES for four dates during the melt season in 2011. See Section Snow Albedo Case Study for further explanation.
The term λvis is an estimate of the difference between the dirty and the clean snow albedo in the visible spectrum (0.350–0.876 μm), which is where light absorbing impurities have the greatest impact for snow. Since is a is a broadband albedo and about half of the sun's energy is in the visible spectrum, we used half of the λvis estimate.
The local illumination angle θ was also used in the Biosphere-Atmosphere Transfer Scheme (BATS, Yang et al., 1997) albedo model, along with the time t since the last snowfall. Last, a simple albedo aging model (Riley et al., 1969) was used, with t as the sole parameter.
As expected, none of the three models match the measured albedo precisely. These errors highlight a need for improved snow albedo models and continued careful ground measurement from sites like CUES. During the time period show in Figure 9, the mean absolute error in albedo of all the models compared to the measurements is ae = 0.10. Given an average daily incoming broadband solar ration S↓ = 365 Wm−2 during that time period and a radiation to melt factor b = 0.26 mmW−1 m2 day−1, the potential error in estimated melt is Me = ae × S↓ × b = 9.5 mm day−1.
In the Sierra Nevada, losses from evapotranspiration and sublimation are 20–60% of total SWE (Kattelmann and Elder, 1991; Hunsaker et al., 2012). These losses are probably a substantial component of the water balance at CUES, but they have not been measured before, although they have been estimated from the energy balance (Stewart, 1982). Using a snow pillow that was installed at CUES by the California Department of Water Resources in September 2012 and three lysimeters located within a few m of the pillow, we estimate losses due to sublimation, since there is no evapotranspiration from snow.
To estimate cumulative melt Mp from the pillow, we sum the daily decreases in SWE rounded to the nearest centimeter when △SWE is negative
To estimate cumulative melt that reaches the lysimeters Ml, we sum the daily tips T and multiply by the volume of the tipping buckets v = 0.08 L.
Since the lysimeter pans are 1 m2, we convert to cm by dividing by 10 since
and round Ml to the nearest cm. Spatial variation in snow accumulation and drainage characteristics (Kattelmann and Dozier, 1999) are pronounced in wind affected areas like CUES. Therefore, we compute high and low values for Ml using the range of measurements from the three lysimeters nearest the snow pillow. To estimate sublimation E we sum Mp during periods where Ml = 0,
assuming that melt from the pillow that does not reach the lysimeters sublimates. We compute a low estimate of E by specifying that Ml = 0 for all lysimeters and a high estimate by specifying that Ml = 0 for any lysimeter. Our results (Figure 10) show that, for totals from 2012 to 2015, E is 100–186 cm, or 31–57% of total Mp = 325 cm. The mean sublimation value E = 143 is 44% of total Mp. These values are within the 20–60% range measured or estimated in previous studies (Stewart, 1982; Kattelmann and Elder, 1991; Hunsaker et al., 2012) and confirm that a substantial portion of the water in the snowpack is lost to sublimation.
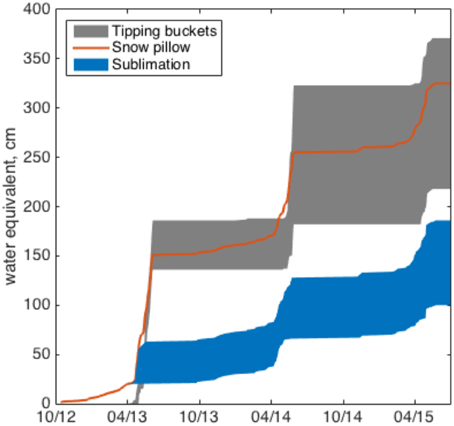
Figure 10. Sublimation measured from lysimeter and snow pillow melt. The range of cumulative tipping bucket melt from three lysimeters is shown in gray. The cumulative snow pillow melt is shown in orange. Sublimation is shown in blue.
Over its four decades of existence, CUES has led to scientific advances in the understanding and modeling of the alpine snowpack and energy balance. The sensing infrastructure at CUES has also provided the basis for contextual comparison of new approaches to measuring snow mass budget in a windy environment. The persistence of snowpack in the mountains of California and elsewhere provides a storage capacity that greatly exceeds the available surface water storage. For the Sierra Nevada, Molotch and Meromy (2014) used regression tree models to show that that elevation was the most important explanatory variable regarding snow cover persistence over the last decade, ranking first in the hierarchical models in 10 out of 13 watersheds studied. The paper also brought to light the importance of other variables that factor into the transitional nature of a subalpine environment, from the forested broad slopes at low elevations to the exposed bare terrain in the alpine zone. As climate warms, the interplay among snow energy and mass transfer processes in the subalpine region will figure prominently in manifesting trends. CUES will continue to serve two primary roles: first, to serve as a robust snow cover laboratory from which to test new measurement techniques and, seconds, to make observations supporting modeling and diagnostics for studies to increase our understanding of mountain snow.
The ongoing drought, currently in its fourth year, is unprecedented in California's modern history. Unprecedented events and a rapidly warming climate make statistical models, which have been used to predict snowpack runoff for decades by water managers, unreliable. Knowledge about the physical processes that drive snow accumulation and melt is now more valuable than ever. Because most of California's water comes from snowmelt, high-altitude mountain sites such as CUES will become more important for monitoring and studying the water cycle, in much the same way that long-term CO2 monitoring has affected our view of climate (Keeling, 2008).
The CRREL/UCSB Energy Site (CUES) has been a working site for snow study since the late 1970s. Snow research ranging from remote sensing, to snow chemistry, to avalanche studies have been performed there. Long term measurements (more than 10 years) at CUES include incident and reflected solar radiation, snow depth, air temperatures, wind speed and direction, and lysimeter discharge. Experimental measurement devices currently include a MASC, fluid-free snow pillows, and an automatically operated scanning terrestrial LiDAR.
CUES epitomizes information-sharing based science. All measurements and associated metadata are freely available at http://www.snow.ucsb.edu/. The website's backend is powered by a relational database that allows multi-year queries (despite instrument changes) and other advanced features. The location, networking and computing facilities, buried bunker, and ease of access to CUES make it a unique high altitude snow research site. We welcome and encourage future collaborative projects at CUES from other research groups that pertain to snow study.
The authors declare that the research was conducted in the absence of any commercial or financial relationships that could be construed as a potential conflict of interest.
The first author was partly supported by a US Army Corps of Engineers Cold Regions Research and Engineering fellowship administered by ORISE/ORAU. We thank US Army Project Program Element (PE) 0602784A for its support of CUES, in terms of equipment, maintenance, and specific research studies on snow physics, terrain-atmosphere interactions, and instrument development. Both NASA and NGA have supported efforts to improve analysis of snow. We thank Mammoth Mountain Ski Area for their generous support of CUES, including networking and computing, transportation, and construction and maintenance of the platform and site perimeter. Finally, we thank the many researchers who have used CUES over the years to conduct snow research.
The Supplementary Material for this article can be found online at: http://journal.frontiersin.org/article/10.3389/feart.2015.00058
Bair, E. H. (2013). Forecasting artificially-triggered avalanches in storm snow at a large ski area. Cold Reg. Sci. Technol. 85, 261–269. doi: 10.1016/j.coldregions.2012.10.003
Bair, E. H., Birkeland, K. W., and Dozier, J. (2010). In situ and photographic measurements of avalanche crown transects. Cold Reg. Sci. Technol. 64, 174–181. doi: 10.1016/j.coldregions.2010.08.004
Bair, E. H., Davis, R. E., Finnegan, D. C., LeWinter, A. L., Guttmann, E., and Dozier, J. (2012a). “Can we estimate precipitation rate during snowfall using a scanning terrestrial LiDAR?,” in Proceedings, 2012 International Snow Science Workshop (Anchorage, AK). Available online at: http://arc.lib.montana.edu/snow-science/item/1671
Bair, E. H., Dozier, J., and Birkeland, K. W. (2008). Avalanche crown-depth distributions. Geophys. Res. Lett. 35, L23502. doi: 10.1029/2008GL035788
Bair, E. H., Dozier, J., Davis, R. E., Kaempfer, T., Colee, M., Mielke, R., et al. (2009). “Observations of two seasons of sintering in a mountain snowpack,” in Proceedings, 2009 International Snow Science Workshop (Davos), 115–119. Available online at: http://arc.lib.montana.edu/snow-science/item/207
Bair, E. H., Simenhois, R., Birkeland, K., and Dozier, J. (2012b). A field study on failure of storm snow slab avalanches. Cold Reg. Sci. Technol. 79–80, 20–28. doi: 10.1016/j.coldregions.2012.02.007
Bales, R. C., Davis, R. E., and Stanley, D. A. (1989). Ion elution through shallow homogeneous snow. Water Resour. Res. 25, 1869–1877. doi: 10.1029/WR025i008p01869
Bales, R. C., Davis, R. E., and Williams, M. W. (1993). Tracer release in melting snow - diurnal and seasonal patterns. Hydrol. Process. 7, 389–401. doi: 10.1002/hyp.3360070405
Bales, R. C., Molotch, N. P., Painter, T. H., Dettinger, M. D., Rice, R., and Dozier, J. (2006). Mountain hydrology of the western United States. Water Resour. Res. 42, W08432. doi: 10.1029/2005WR004387
City of Los Angeles Department of Water and Power. (2015). Snow Surveys Provide Water Supply Forecasting Data [Online]. Available online at: http://wsoweb.ladwp.com/Aqueduct/snow/snowsurveys.htm (Accessed May 29, 2015).
Codd, E. F. (2000). The Relational Model for Database Management: Version 2. Boston, MA: Addison-Wesley.
Davis, R. E., and Dozier, J. (1984). Snow wetness measurement by fluorescent dye dilution. J. Glaciol. 30, 362–363.
Davis, R. E., and Dozier, J. (1989). Stereological characterization of dry alpine snow for microwave remote sensing. Adv. Space Res. 9, 245–251. doi: 10.1016/0273-1177(89)90492-4
Davis, R. E., Dozier, J., and Chang, A. T. C. (1987). Snow property measurements correlative to microwave emission at 35 GHz. IEEE Trans. Geosci. Remote Sens. 25, 751–757. doi: 10.1109/TGRS.1987.289745
Davis, R. E., Dozier, J., LaChapelle, E. R., and Perla, R. (1985). Field and laboratory measurements of snow liquid water by dilution. Water Resour. Res. 21, 1415–1420. doi: 10.1029/WR021i009p01415
Davis, R. E., Dozier, J., and Marks, D. (1984). “Micrometeorological measurements and instrumentation in support of remote sensing observations of an alpine snow cover,” in Proceedings of the Western Snow Conference, Vol. 52 (Sun Valley, ID), 161–164. Available online at: http://westernsnowconference.org/node/966
Davis, R. E., and Marks, D. (1980). “Undisturbed measurement of the energy and mass balance of a deep alpine snowcover,” in Proceedings of the Western Snow Conference, Vol. 48 (Laramie, WY), 62–67. Available online at: http://westernsnowconference.org/node/883
Davis, R. E., Nolin, A. W., Jordan, R., and Dozier, J. (1993). Towards predicting temporal changes of the spectral signature of snow in visible and near-infrared wavelengths. Ann. Glaciol. 17, 143–148.
Dozier, J., Davis, R. E., and Perla, R. (1987). “On the objective analysis of snow microstructure,” in Avalanche Formation, Movement and Effects, eds B. Salm and H. Gubler (Wallingford: IAHS Publication), 49–59.
Dozier, J., and Frew, J. (1990). Rapid calculation of terrain parameters for radiation modeling from digital elevation data. IEEE Trans. Geosci. Remote Sens. 28, 963–969. doi: 10.1109/36.58986
Dozier, J., Green, R. O., Nolin, A. W., and Painter, T. H. (2009). Interpretation of snow properties from imaging spectrometry. Remote Sens. Environ. 113, S25–S37. doi: 10.1016/j.rse.2007.07.029
Farnes, P. E., Peterson, N. R., Goodison, B. E., and Richards, R. P. (1982). “Metrication of manual snow sampling equipment by western snow conference metrication committee,” in Proceedings of the Western Snow Conference, Vol. 50 (Reno, NV), 120–132. Available online at: http://westernsnowconference.org/node/918
Frankenstein, S., Sawyer, A., and Koeberle, J. (2008). Comparison of FASST and SNTHERM in three snow accumulation regimes. J. Hydrometeorol. 9, 1443–1463. doi: 10.1175/2008JHM865.1
Gardner, A. S., and Sharp, M. J. (2010). A review of snow and ice albedo and the development of a new physically based broadband albedo parameterization. J. Geophys. Res. 115, F01009. doi: 10.1029/2009JF001444
Green, R. O., Painter, T. H., Roberts, D. A., and Dozier, J. (2006). Measuring the expressed abundance of the three phases of water with an imaging spectrometer over melting snow. Water Resour. Res. 42, W10402. doi: 10.1029/2005WR004509
Harrington, R., and Bales, R. C. (1998). Interannual, seasonal, and spatial patterns of meltwater and solute fluxes in a seasonal snowpack. Water Resour. Res. 34, 823–831. doi: 10.1029/97WR03469
Hildreth, W. (2004). Volcanological perspectives on Long Valley, Mammoth Mountain, and Mono Craters: Several contiguous but discrete systems. J. Volcanol. Geotherm. Res. 136, 169–198. doi: 10.1016/j.jvolgeores.2004.05.019
Hunsaker, C. T., Whitaker, T. W., and Bales, R. C. (2012). Snowmelt runoff and water yield along elevation and temperature gradients in California's Southern Sierra Nevada. J. Am. Water Resour. Assoc. 48, 667–678. doi: 10.1111/j.1752-1688.2012.00641.x
Jordan, R. (1991). A One-dimensional Temperature Model for a Snow Cover: Technical Documentation for SNTHERM.89. Special Report 91-16, U. S. Army Cold Regions Research and Engineering Laboratory, Hanover, NH, 49.
Kattelmann, R., and Dozier, J. (1999). Observations of snowpack ripening in the Sierra Nevada, California, USA. J. Glaciol. 45, 409–416.
Kattelmann, R., and Elder, K. (1991). Hydrologic characteristics and water balance of an alpine basin in the Sierra Nevada. Water Resour. Res. 27, 1553–1562. doi: 10.1029/90WR02771
Keeling, R. F. (2008). Recording Earth's vital signs. Science 319, 1771–1772. doi: 10.1126/science.1156761
Landry, C. C., Buck, K. A., Raleigh, M. S., and Clark, M. P. (2014). Mountain system monitoring at Senator Beck Basin, San Juan Mountains, Colorado: A new integrative data source to develop and evaluate models of snow and hydrologic processes. Water Resour. Res. 50, 1773–1788. doi: 10.1002/2013WR013711
Marks, D., and Dozier, J. (1992). Climate and energy exchange at the snow surface in the alpine region of the Sierra Nevada: 2. Snow cover energy balance. Water Resour. Res. 28, 3043–3054. doi: 10.1029/92WR01483
Mock, C. J., and Birkeland, K. W. (2000). Snow avalanche climatology of the western United States mountain ranges. Bull. Am. Meteorol. Soc. 81, 2367–2367. doi: 10.1175/1520-0477(2000)081 < 2367:SACOTW>2.3.CO;2
Molotch, N. P., and Meromy, L. (2014). Physiographic and climatic controls on snow cover persistence in the Sierra Nevada Mountains. Hydrol. Process. 28, 4573–4586. doi: 10.1002/hyp.10254
Nolin, A. W., and Dozier, J. (1993). Estimating snow grain size using AVIRIS data. Remote Sens. Environ. 44, 231–238. doi: 10.1016/0034-4257(93)90018-S
Nolin, A. W., Dozier, J., and Mertes, L. A. K. (1993). Mapping alpine snow using a spectral mixture modeling technique. Ann. Glaciol. 17, 121–124.
Painter, T., Donahue, D., Dozier, J., Li, W., Kattlemann, R., Dawson, D., et al. (2000). “The Mammoth Mountain cooperative snow study site: Data Acquisition, management, and dissemination,”in Proceedings, 2000 International Snow Science Workshop (Big Sky, MT), 448–451. Available online at: http://arc.lib.montana.edu/snow-science/item/772
Painter, T. H., Bryant, A. C., and Skiles, S. M. (2012b). Radiative forcing by light absorbing impurities in snow from MODIS surface reflectance data. Geophys. Res. Lett. 39, L17502. doi: 10.1029/2012GL052457
Painter, T. H., and Dozier, J. (2004). Measurements of the hemispherical-directional reflectance of snow at fine spectral and angular resolution. J. Geophys. Res. 109, D18115. doi: 10.1029/2003JD004458
Painter, T. H., Dozier, J., Roberts, D. A., Davis, R. E., and Green, R. O. (2003). Retrieval of subpixel snow-covered area and grain size from imaging spectrometer data. Remote Sens. Environ. 85, 64–77. doi: 10.1016/S0034-4257(02)00187-6
Painter, T. H., Rittger, K., McKenzie, C., Slaughter, P., Davis, R. E., and Dozier, J. (2009). Retrieval of subpixel snow-covered area, grain size, and albedo from MODIS. Remote Sens. Environ. 113, 868–879. doi: 10.1016/j.rse.2009.01.001
Painter, T. H., Roberts, D. A., Green, R. O., and Dozier, J. (1998). The effect of grain size on spectral mixture analysis of snow-covered area from AVIRIS data. Remote Sens. Environ. 65, 320–332. doi: 10.1016/S0034-4257(98)00041-8
Painter, T. H., Skiles, S. M., Deems, J. S., Bryant, A. C., and Landry, C. C. (2012a). Dust radiative forcing in snow of the Upper Colorado River Basin: 1. A 6 year record of energy balance, radiation, and dust concentrations. Water Resour. Res. 48, W07521. doi: 10.1029/2012WR011985
Riley, J. P., Chadwick, D. G., and Eggleston, K. O. (1969). Snowmelt Simulation. UWRL Report 122, Utah Water Research Laboratory, Logan, UT. Available online at: http://digitalcommons.usu.edu/water_rep/122
Rosenthal, W., and Elder, K. (2003). Evidence of chaos in slab avalanching. Cold Reg. Sci. Technol. 37, 243–253. doi: 10.1016/S0165-232X(03)00068-5
Rosenthal, W., Elder, K., and Davis, R. E. (2002). “Operational decision tree avalanche forecasting,” in Proceedings, 2002 International Snow Science Workshop (Penticton, BC), 13–18. Available online at: http://arc.lib.montana.edu/snow-science/item/824
Rosenthal, W., Saleta, J., and Dozier, J. (2007). Scanning electron microscopy of impurity structures in snow. Cold Reg. Sci. Technol. 47, 80–89. doi: 10.1016/j.coldregions.2006.08.006
Sterle, K. M., McConnell, J. R., Dozier, J., Edwards, R., and Flanner, M. G. (2013). Retention and radiative forcing of black carbon in eastern Sierra Nevada snow. Cryosphere 7, 365–374. doi: 10.5194/tc-7-365-2013
Stewart, B. J. (1982). Sensitivity and Significance of Turbulent Energy Exchange over an Alpine Snow Surface. M. A. thesis, University of California, Santa Barbara, CA.
Tyler, S. W., Burak, S. A., McNamara, J. P., Selker, J. S., and Dozier, J. (2008). Spatially distributed temperatures at the base of two mountain snowpacks measured with fiber optic sensors. J. Glaciol. 54, 673–679. doi: 10.3189/002214308786570827
Warren, S., and Wiscombe, W. (1980a). A model for the spectral albedo of snow, I, Pure snow. J. Atmos. Sci. 37, 2712–2733. doi: 10.1175/1520-0469(1980)037 < 2712:AMFTSA>2.0.CO;2
Warren, S., and Wiscombe, W. (1980b). A model for the spectral albedo of snow, II, Snow containing atmospheric aerosols. J. Atmos. Sci. 37, 2734–2745. doi: 10.1175/1520-0469(1980)037 < 2734:AMFTSA>2.0.CO;2
Yang, Z.-L., Dickinson, R. E., Robock, A., and Vinnikov, K. Y. (1997). Validation of the snow submodel of the Biosphere-Atmosphere Transfer Scheme with Russian snow cover and meteorological observational data. J. Clim. 10, 353–373.
Keywords: snow, energy balance, snowmelt, radiation, meteorology
Citation: Bair EH, Dozier J, Davis RE, Colee MT and Claffey KJ (2015) CUES—a study site for measuring snowpack energy balance in the Sierra Nevada. Front. Earth Sci. 3:58. doi: 10.3389/feart.2015.00058
Received: 03 June 2015; Accepted: 11 September 2015;
Published: 30 September 2015.
Edited by:
Massimo Menenti, Delft University of Technology, NetherlandsReviewed by:
Neil McIntyre, The University of Queensland, AustraliaCopyright © 2015 Bair, Dozier, Davis, Colee and Claffey. This is an open-access article distributed under the terms of the Creative Commons Attribution License (CC BY). The use, distribution or reproduction in other forums is permitted, provided the original author(s) or licensor are credited and that the original publication in this journal is cited, in accordance with accepted academic practice. No use, distribution or reproduction is permitted which does not comply with these terms.
*Correspondence: Edward H. Bair, Earth Research Institute, University of California, 6832 Ellison Hall, Santa Barbara, CA 93106-3060, USA,bmJhaXJAZXJpLnVjc2IuZWR1
Disclaimer: All claims expressed in this article are solely those of the authors and do not necessarily represent those of their affiliated organizations, or those of the publisher, the editors and the reviewers. Any product that may be evaluated in this article or claim that may be made by its manufacturer is not guaranteed or endorsed by the publisher.
Research integrity at Frontiers
Learn more about the work of our research integrity team to safeguard the quality of each article we publish.