 Gary E. Stinchcomb
 Daniel J. Peppe
- 1Terrestrial Paleoclimatology Research Group, Department of Geology, Baylor University, Waco, TX, USA
- 2Department of Geosciences, Watershed Studies Institute, Murray State University, Murray, KY, USA
Magnetic susceptibility of soils is a common proxy for rainfall, but other factors can contribute to magnetic enhancement in soils. Here we explore influence of century- to millennial-scale duration of soil formation on periglacial and alluvial soil magnetic properties by assessing three terraces with surface and buried soils ranging in exposure ages from <0.01 to ~16 kyrs along the Delaware River in northeastern USA. The A and B soil horizons have higher Xlf, Ms, and S-ratios compared to parent material, and these values increase in a non-linear fashion with increasing duration of soil formation. Magnetic remanence measurements show a mixed low- and high-coercivity mineral assemblage likely consisting of goethite, hematite, and maghemite and/or magnetite that contributes to the magnetic enhancement of the soil. Room-temperature and low-temperature field-cooled and zero field-cooled remanence curves confirm the presence of goethite and magnetite and/or maghemite and show an increase in magnetization with increasing soil age. These data suggest that as the Delaware alluvial soils weather, the concentration of secondary ferrimagnetic minerals increase in the A and B soil horizons. We then compared the time-dependent Xlf from several age-constrained buried alluvial soils with known climate data for the region during the Quaternary. Contradictory to most studies that suggest a link between increases in magnetic susceptibility and high moisture, increased magnetic enhancement of Delaware alluvial soils coincides with dry climate intervals. Early Holocene enhanced soil Xlf (9.5–8.5 ka) corresponds with a well-documented cool-dry climate episode. This relationship is probably related to less frequent flooding during dry intervals allowing more time for low-coercive pedogenic magnetic minerals to form and accumulate, which resulted in increased Xlf. Middle Holocene enhanced Xlf (6.1–4.3 ka) corresponds with a wet to dry transitional phase and a previously documented incision event along the valley bottom. In this case the incision and terrace development resulted in prolonged surface exposure and more time for the accumulation of secondary ferrimagnetic minerals, enhancing Xlf. The results of this study agree with previous modeling efforts, and show that in Quaternary (and possibly pre-Quaternary) periglacial and alluvial soils and paleosols that weathered for 101–104 years, duration of pedogenesis, rather than climate, is an important control on magnetic enhancement.
Introduction
Increased magnetic susceptibility within soil horizons is a widespread observable phenomenon that has been a longstanding subject of pedologic, rock magnetic, and paleoenvironmental research (e.g., Le Borgne, 1955; Mullins, 1977; Maher, 1986; Geiss and Zanner, 2006). The origins of the increased soil magnetic susceptibility have often been attributed to the biotic or abiotic weathering and alteration of hydrous ferric oxides into fine-grained magnetite and maghemite (e.g., Dearing et al., 1996b; Singer et al., 1996; Boyle et al., 2010), or generation of magnetite or maghemite from burning (e.g., Le Borgne, 1960; Thompson and Oldfield, 1986; Kletetschka and Banerjee, 1995; Oldfield and Crowther, 2007). These fine-grained magnetic minerals can be subjected to complex pedogenic pathways, including physical concentration, dissolution, leaching, or further chemical alteration and may result in more coercive magnetic minerals such as goethite and/or hematite (Singer et al., 1996; Dunlop and Özdemir, 1997; France and Oldfield, 2000).
Because soils form as a function of five primary factors (Jenny, 1941), studies have shown that the mechanism(s) responsible for pedogenic magnetic enhancement are related to climate, organisms, relief, parent material and time. Several paleoenvironmental studies link soil magnetic enhancement with climate in the Quaternary (e.g., Kukla et al., 1988; Maher and Thompson, 1995; Maher, 1998; Maher et al., 2002, 2003; Geiss et al., 2008; Balsam et al., 2011) and pre-Quaternary rock record (e.g., Soreghan et al., 1997; Cogoini et al., 2001). Other magnetic studies have examined the relationship between soil magnetic properties and soil age or duration of soil formation (Singer et al., 1992; Vidic et al., 2004; Torrent et al., 2010). Despite advances in paleoenvironmental and paleoclimatic reconstruction, much of the magnetic research has been performed on successions of buried soils forming on loess parent materials, possibly limiting its application to a specific depositional environment.
Alluvial soils are a potentially rich resource for paleoenvironmental reconstruction when applying an environmental magnetic approach in both Quaternary and pre-Quaternary settings. Although alluvial soils are subject to burial, erosion, and pedofacies evolution, recent research demonstrates that the rock magnetic properties of an alluvial Vertisol forming in central Texas is interpretable in a similar manner as loessal soils (Lindquist et al., 2011). Lindquist et al. (2011) also noted that magnetic enhancement can mature over centuries. The implications of this work are that magnetic properties of soils can be used to estimate duration of soil formation for buried soils at a much higher resolution than previously studied (Singer and Fine, 1989; Singer et al., 1992; Vidic et al., 2004).
This study explores the influence of century- to millennial-scale duration of soil formation on periglacial and alluvial soil magnetic properties using a river terrace sequence approach along the Delaware River valley. Pathways of magnetic enhancement are discussed along with an application toward Holocene paleoenvironment interpretation for the northeastern USA.
Materials and Methods
Study Area
The study area is located within the Delaware River basin, eastern United States (Figure 1). The middle Delaware River valley is a partly-confined river valley containing relict glacial and periglacial landforms and alluvial landforms that include alluvial fill terraces, floodplains, islands, and gravel bars (Stewart et al., 1991; Witte, 2001, 2012; Witte and Epstein, 2005; Stinchcomb et al., 2012).
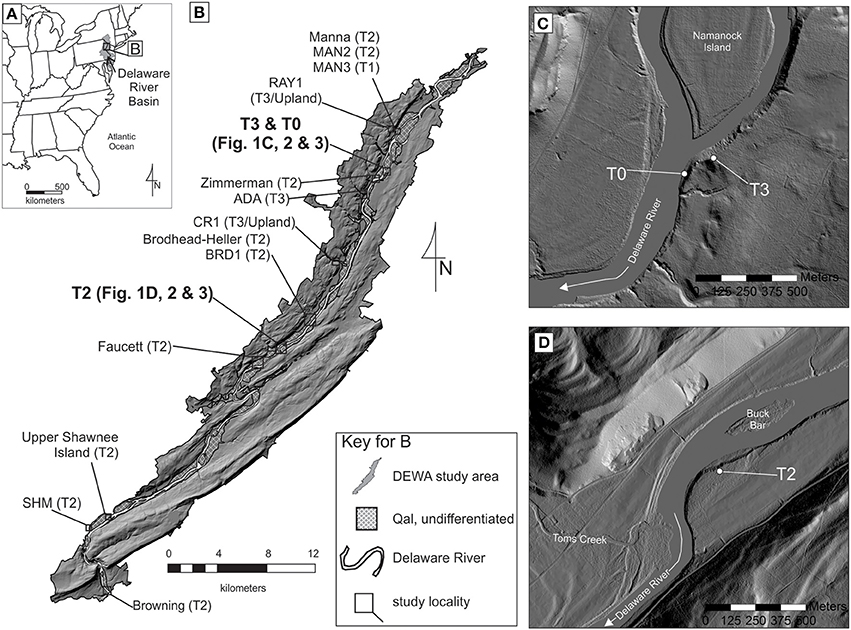
Figure 1. Study area. (A) Inset map of eastern North America showing the Delaware River Basin (gray) (modified from Stinchcomb et al., 2013). (B) The Delaware Water Gap National Recreation Area showing profile locations (T3, T2, and T0) mentioned in text (modified from Stinchcomb et al., 2012). The environmental magnetic properties of these three profiles were examined in detail here and span three unique geomorphic surfaces: a modern T0 active floodplain surface (C), a Holocene T2 alluvial terrace (D), and a late Pleistocene T3 periglacial meltwater terrace (C). The additional profiles noted in B were used to constrain the weathering duration of buried soils along the T2 (Table 1) and analyzed for their Xlf (Supplementary Table 5).
This section of the Delaware River valley has a unique glacial and post-glacial history, making it an ideal location to study magnetic effects on the duration of soil formation for soils forming from 102–104 years. During the Last Glacial Maximum (~18 ka), this portion of the Delaware River valley was completely glaciated with the southernmost glacial extent ~24 km downstream from the Browning site (Figure 1) (Witte, 2001). Glacial recession occurred ~16 ka, which led to periglacial deposition, followed by alluvial deposition around 12.8 ka (Stewart et al., 1991; Witte, 2001). Late Pleistocene incision, a 6–5 ka incision event and floodplain and terrace reworking for the past 6000 years resulted in discontinuous alluvial terrace development throughout the reach (Stinchcomb et al., 2012; Witte, 2012). This 16–12 ka history of periglacial and alluvial deposition, and channel incision resulted in terrace sequences that are no older than 16 ka. And thus, the maximum duration of soil formation for all soils is ≤16 ka and alluvial terraces record weathering intervals that range from 101–103 years (Table 1, Figure 2).
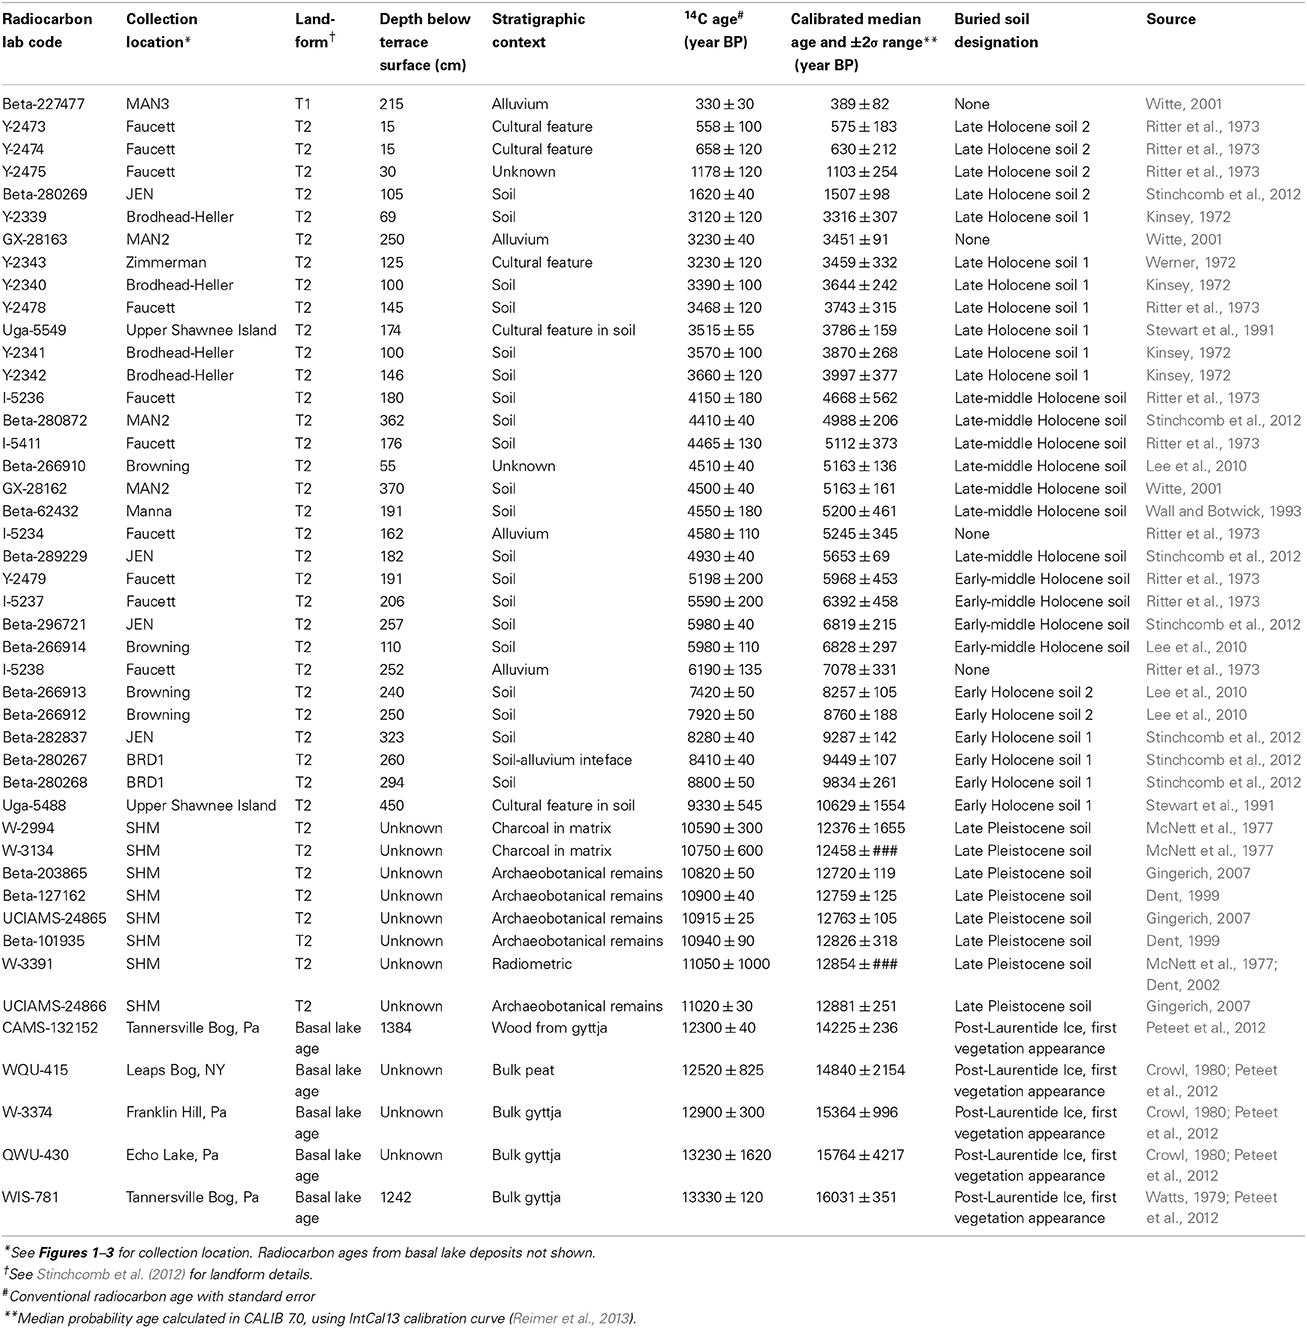
Table 1. Delaware River Valley radiocarbon data compiled from previous work.
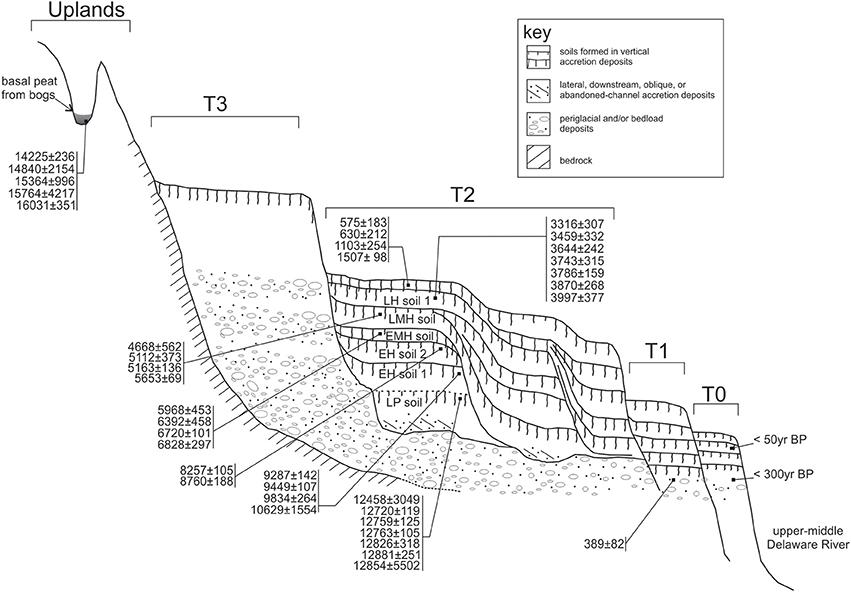
Figure 2. Conceptual soil stratigraphic model for the Delaware River valley study area based on previous work (Witte, 2001, 2012; Witte and Epstein, 2005; Stinchcomb et al., 2012). The calibrated radiocarbon age ranges shown document the range of potential surface and buried soil weathering. Calibrated ages from upland peat bogs document the first appearance of vegetation after Laurentide Ice Sheet recession based on basal lake ages (Peteet et al., 2012) (Table 1). Note that weathering duration estimates for the T3 soils (max − min age = weathering duration) are ~16 kyrs, based on a ~16 ka first appearance of vegetation in the region (Peteet et al., 2012). Weathering duration estimates for T2 soils range from 0.01 to 3.0 kyrs. Weathering duration estimates for T0 soils range from 0.01 to 0.3 kyrs.
Site Selection, Soil Description, and Sample Selection
Three profiles occurring along a river floodplain-terrace sequence form the basis of testing the influence of time on soil magnetic properties along the Delaware River valley, USA. These profiles were measured along, a T3, meltwater terrace, a T2, alluvial fill terrace, and a T0, active floodplain (Figure 1).
Surface and buried soils were described using U.S. Department of Agriculture (USDA) soil nomenclature (Schoeneberger et al., 2002) with modifications (see Holliday, 2004, supplementary material). Bulk samples were collected from each profile for rock magnetic analyses. Oriented samples were collected from the T2 for thin-section analysis. Soil micromorphology of thin-section samples were examined and described to determine the relative degree of soil development within T2 alluvial buried soils (Stoops, 2003).
Environmental Magnetic Measurements
The mass-dependent magnetic susceptibility (X) of dried soil and sediment samples was measured using a Bartington MS2B magnetic susceptibility meter at Baylor University. Visible root and plant matter was removed prior to analysis; however, this material is a negligible portion of the samples. Gravels were not removed from gravelly horizons. The mass-dependent low-frequency (Xlf, 450 Hz) and high-frequency (Xhf, 4.5 kHz) measurements were used to calculate the frequency-dependent susceptibility (Xfd) in percent using the formula:
Additional environmental magnetic characterization experiments were conducted at the University of Minnesota's Institute of Rock Magnetism (IRM) lab. Anhysteretic remanent magnetization (ARM) and isothermal remanent magnetization (IRM) acquisition and demagnetization were performed using the 2G Enterprises superconducting rock magnetometer with an in-line alternating field (AF) demagnetizer. Both ARM and IRM were acquired in 8 increasing AF steps: 1, 10, 20, 35, 50, 70, 100, and 120 mT. Room-temperature hysteresis parameters: saturation magnetization (Ms), remanence magnetization (Mr), coercivity (Hc), and backfield remanence (IRM) and coercivity of remanence (Hcr) were obtained using a Princeton Measurements Corporation MicroMag Vibrating Sample Magnetometer (VSM). Hysteresis loops were performed in a maximum applied field of 1 T. Isothermal remanence magnetization was measured by saturating the sample to 1 T then applying a backfield IRM in 50 steps from −0.2 * 10−5 to −1 T.
Temperature-dependent remanence properties were measured using a Quantum Design Magnetic Properties Measurement System (MPMS). A field cooled (FC), zero-field cooled (ZFC), low temperature (LT) and room temperature (RT) saturation isothermal remanent magnetization (SIRM) sequence was performed on representative samples from the three terraces. The FC-ZFC-LTSIRM-RTSIRM low temperature demagnetization sequence begins with a sustained 2.5 T DC field applied to the samples as they are cooled to 20 K, upon which the field is switched off and FC remanence was measured in 5 K steps upon warming to 300 K. The samples were then cooled back to 20 K in zero-field, and ZFC remanence data were measured in 5 K steps upon warming to 300 K. The final cycle in the measurement sequence for each sample consisted of measuring the RT-SIRM upon cooling to 20 K and warming to 300 K in 5 K steps. This measurement sequence is useful for identifying goethite, evaluating magnetite grain size and the oxidation state of Fe in minerals (Özdemir and Dunlop, 2010; Bilardello and Jackson, 2013).
Radiocarbon Dating
Radiocarbon ages from previous work were compiled and used to delineate the weathering duration for the buried and surface soils described and sampled (Table 1). The radiocarbon ages were calibrated using Calib 7.0 (Reimer et al., 2013). The calibrated ages and their associated contexts (e.g., soil, alluvium, and cultural feature) were used to construct a conceptual soil-stratigraphic model for the study area. This model was used to estimate late Pleistocene and Holocene pedogenic duration for the soils examined. The low-field magnetic susceptibility was measured along previously studied T2 profiles (Stinchcomb et al., 2012, 2013) and their reported age models (Stinchcomb et al., 2013) were used to create a magnetic susceptibility time series ranging from ~11 to 2 ka.
Results
Soil Description and Ages
The T3 surface is ~26 m above river base flow and contains late Pleistocene glacial-meltwater deposits (Witte, 2012). This landform documents post-glacial deposition within the river valley. Vegetation first appeared on this landscape at 16–15 cal. kyrs (Peteet et al., 2012), and incision of the landscape to create the existing terrace feature likely occurred ~12.8 cal kyrs, based on previous morphostratigraphic research (Witte, 2001; Witte and Epstein, 2005) (Figure 2). Based on the maximum age constraints of the glacial retreat and the basal-peat radiocarbon ages, the T3 has been a stable land surface and actively weathering for ~16 ka.
The weathering profile along the T3 surface is mapped by the United State Department of Agriculture (USDA) as the Hoosic series, a Sandy-skeletal, mixed, mesic, Typic Dystrudept formed on glacial outwash. The T3 profile description is more developed than the USDA mapped soil and has a sandy loam to sandy clay loam texture with an Oa-A-E-Bt1-Bt2-BC-Bw3-BC-C horizon scheme (Figure 3; Supplementary Table 1). The Bt subsoil is a strong brown (7.5YR 5/6) sandy clay loam that has a distinct increase in reddening and clay concentration than the overlying A and E horizons.
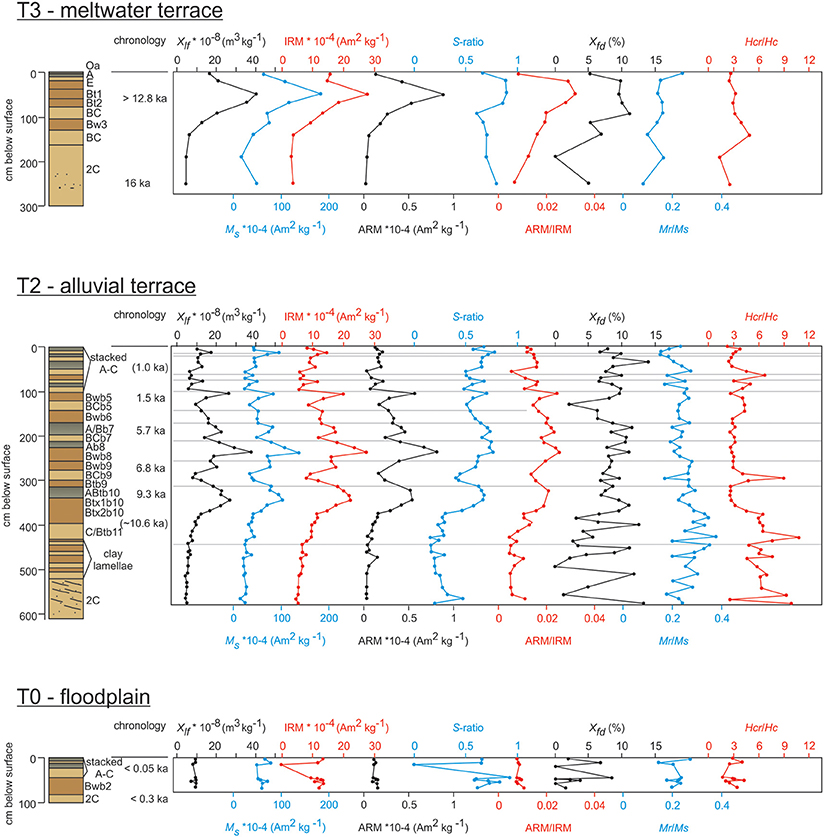
Figure 3. Magnetic characterization results for the T3, T2, and T0 profiles. The T3 soil began forming after 16 kyrs BP, but before 12.8 kyrs BP based on a late Pleistocene buried soil recorded at the base of some T2 profiles (Gingerich, 2013). The 10.6 ka age from the base of the T2 profile is inferred from downstream at the Upper Shawnee Island site (Stewart et al., 1991). The 1.0 ka age from the top of the T2 profile is inferred from diagnostic late Holocene pottery.
The T2 alluvial fill terrace surface is 5–11 m above river base flow and contains late Pleistocene- and Holocene-age alluvial deposits (Stinchcomb et al., 2012; Witte, 2012). The T2 contains mostly vertical accretion (i.e., overbank flood) deposits that were subsequently weathered into discrete soils. The weathering duration of each buried and surface soils vary from ~0.01 kyrs to 3.0 kyrs based on radiocarbon age-bracketing and temporally diagnostic artifacts (Table 1, Figure 2) (Stinchcomb et al., 2012).
The T2 weathering profile is mapped by the USDA as a Colonie series soil, a mixed, mesic Lamellic Udipsamment formed on reworked fluvio-glacial material (alluvium). However, this USDA soil series designation only describes the upper ~2 m. Unlike the T3, the T2 is a multi-story profile >5 m thick and contains ~11 buried soils that range from loamy sand to silt loam in texture, which have been the focus of previous investigations (Stinchcomb et al., 2012, 2013, in press) (Figure 3; Supplementary Table 2). The buried soils range from weakly-developed Entisol-like soils with no subsoil development (stacked A-C horizons) at the surface to moderately developed soils with ped structure and clay illuviation along pores and ped faces >2 m depth (Figure 4, Supplementary Table 2). This vertical succession of pedogenic development does not hold for every T2 profile as floodplain and terrace reworking can remove portions of the T2 (Stinchcomb et al., 2012). This reworking results in discontinuous profile development across the valley bottom (Figure 2, see lateral variation T2).
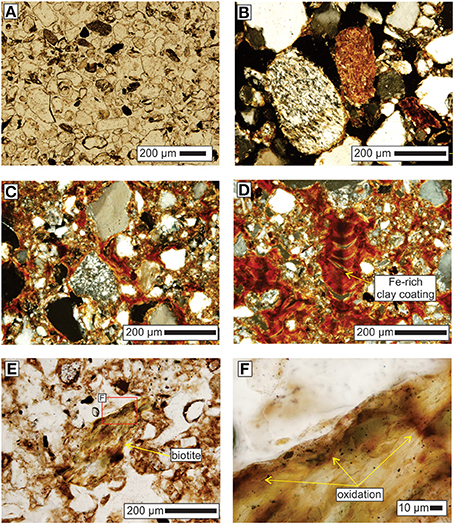
Figure 4. Photomicrographs from T2 alluvial soils showing range of development. All images are oriented with vertical up toward the image top. XPL, cross-polarized light; PPL, plane-polarized light. (A) parent material from base of T2 showing quartz, mica, and rock fragments (PPL). (B) Sand grains in a porous matrix with little to no illuviated clay; from Ab horizon, ~76 cm below surface (XPL). (C) Fe-rich clay coatings along sand grains in Bwb horizon, ~236 cm below surface (XPL). (D) Fe-rich clay coating along channel pore in Btb horizon, ~380 cm below surface (XPL). (E) Weathered biotite grain with oxidized zones (oxidized magnetite, maghemite?) (PPL). (F) Magnified view of C showing evidence of oxidation of Fe(II) to Fe(III), possibly maghemite (PPL).
The T0 active floodplain surface lies 1–3 m above river base flow and frequently floods. Based on a 0.4 ka radiocarbon age from a basal deposit along a T1, the T0 likely began forming no later than 0.3 ka. Plastic wrappings are commonly observed interbedded in the sediments that compose upper portion of the T0. This suggests that the landform and the near-surface soils weathering within it formed anywhere from a period of <50–300 years.
The T0 weathering profile is mapped as the Hoosic series, yet it clearly shows overall less soil development than the mapped Hoosic series on the T3 terrace surface (Figure 3; Supplementary Table 3). This is likely a product of the coarse USDA mapping resolution. Rather, this profile is similar to Udifluvents mapped immediately flanking the Delaware River channel. The soils underlying the T0 surface consist of stacked A–C flood deposits and flood drapes with little evidence of weathering and in some portions the T0 shows unaltered flood drapes (see Stinchcomb et al., 2012). A buried Bw horizon (Bwb2) is present toward the base of the profile.
Soil Micromorphology
Results from the T2 soil micromorphology show a parent material composed of a mixed mineralogy that is dominated by quartz (Figure 4A). Similar field-based observations were made for the T3 and T0 profiles (Supplementary Tables 1–3). The parent material horizons show less secondary Fe-oxidation and clay illuviation than the A and B horizons. Soil horizons from the upper portion of the T2 have less illuviated clay and oxidation (Figure 4B) than underlying buried soils (Figures 4C,D). Some unweathered rock fragments in the parent material contain red Fe2O3 (likely hematite), likely sourced from upstream exposures of terrestrial “red bed” rocks from the late Devonian. Evidence of weathering in the soil horizons includes Fe-oxidation in biotite, chlorite schist and rock fragments (Figure 4B) and production and translocation of secondary Fe-rich clay minerals (Figure 4C). Magnetite grains may also be embedded in the glacially-transported biotite sourced from Grenville gneiss (Dunlop et al., 2006). Oxidation of Fe(II) is prevalent along chlorite mica and biotite grains. Because the soils show no evidence of gleying we presume they are well-drained and therefore aerated. The dissolution of Fe(II) from the framework of phyllosilicates would experience rapid oxidation in a soil-forming environment not limited in O2.
Magnetic Susceptibility
Low frequency magnetic susceptibility (Xlf) is typically controlled by the concentration and grain size of magnetic minerals within a sample. Low-frequency magnetic susceptibility values for surface and buried soils in the Delaware River valley forming along T3 and T2 surfaces are higher in A and B horizons relative to C horizons (Figure 3). Xlf values from the A and B horizons within the T0 – active floodplain are not distinct from C horizon Xlf values (5–10 * 10−8 m3 kg−1). Overall, the soil horizon Xlf increases as duration of soil formation increases, with the T3 soil having the highest values and T0 having the lowest values (Figure 5).
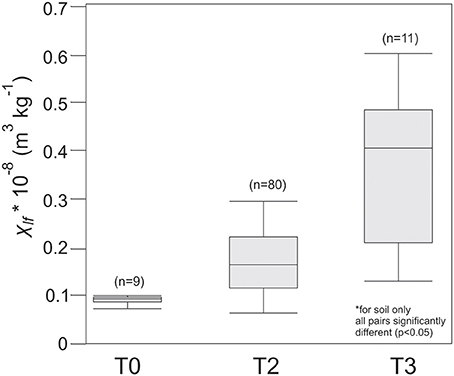
Figure 5. Quantile box plot of Xlf by terrace for the Delaware River Valley study area. The horizontal quantile lines represent, from bottom to top, the minimum, 10, 25%, median, 75, 90%, and maximum. The Xlf values are for soil only, no C, transitional C, or lamellae horizons were included in this analysis. An ANOVA and Tukey test show that the means are significantly different between the three groups (p < 0.05).
The Xlf values from the T2 surface and buried soils vary from 6 to 38 * 10−8 m3 kg−1. Higher Xlf values occur within the well-developed early and middle Holocene buried soil horizons that contain Fe-rich clay coatings (Figures 4C,D). Whereas, lower Xlf values occur within the more weakly developed soils that show little to no evidence of clay illuviation (Figure 3, e.g., see stacked A-C soils toward top of profile) (Figure 4B). The frequency dependent magnetic susceptibility, Xfd, varies from ~0 to <15 for soils and sediment from all three terraces. The Xfd variability is high in the T2 and T0. This variability in the Xfd could be due to varying contributions of superparamagnetic (SP) particles between soils (Dearing et al., 1996a) or noise from the Bartington MS2B.
Magnetic Remanence
Within the T3, T2, and T0 profiles, the IRM and ARM values show similar depth profiles when compared with the respective Xlf data (Figure 3). All Xlf, IRM, and ARM values are larger in the A and B horizons relative to the C horizons in the T3 and T2 landforms showing a relative increase in magnetic minerals in the soil horizons (A and B) relative to the parent material. The youngest T0 floodplain landform shows no significant difference between the soil and C horizons indicating no magnetic enhancement relative to parent material.
The S-ratio provides an estimation of the relative proportions of magnetically soft vs. magnetically hard minerals in the assemblage (Evans and Heller, 2003). In the T0, T2, and T3 terraces, S-ratio values are elevated in A and B horizons compared to C horizons indicating that the soil horizons (A and B) contain more magnetically soft minerals such as magnetite and maghemite. Although the T0 has high S-ratio indicating soft magnetic minerals, it has low Xlf and Ms. These data suggest that although the magnetically soft minerals are in low concentration in the T0, they still dominate the S-ratio signal.
The gradient-acquisition plots of backfield remanence curves show a mixture of at least two magnetic minerals (Figure 6). The plots show a large, low coercivity peak (between 0.01 and 0.1 T) mineral assemblage dominant in the soil (A and B) horizons and a much smaller, high coercivity peak (between 0.1 and 1 T) mineral in the C horizons. These data suggest a mineralogy consisting of both low (magnetite/maghemite) and high (hematite/goethite) coercivity minerals. With the exception of the T2, Bwb8 horizon, the soil B horizons show higher magnetic remanence with increasing age of landform, i.e., the magnetic remanence of T3 > T2 > T0. Interestingly, the gradient-acquisition plots suggest that the clay lamellae sampled in this study are composed of high-coercivity minerals. No low-coercivity minerals are present in the lamellae.
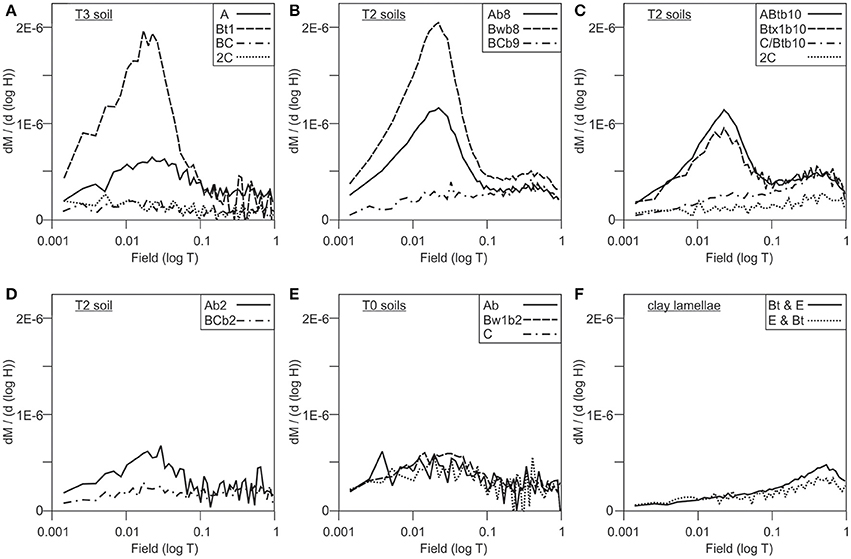
Figure 6. Coercivity of remanence distribution for (A) T3, (B–D) T2, and (E) T0 soils and (F) clay lamellae.
The ratio of ARM to IRM (ARM/IRM) provides a relative estimate of the fine-grained SD-like particle concentration (King et al., 1982; Geiss et al., 2004; Lindquist et al., 2011). Because the S-ratio and backfield remanence suggest the presence of a low-coercivity mineral such as magnetite or maghemite, we can infer the ARM/IRM ratio indicates changes in the relative concentration of fine-grained magnetite/maghemite. The ARM/IRM data for the T3 and T2 alluvial soils show higher concentrations of SD-like particles (magnetite/maghemite) in the soil horizons relative to the C horizons (Figure 3), which is corroborated by magnetic hysteresis measurements discussed below. The ARM/IRM values are fairly uniform throughout the T0 soils. Further, the ARM/IRM values from soil horizons increase with increasing age of the landform (T0–T3).
Magnetic Hysteresis
The hysteresis parameters are summarized in the Dunlop-Day plot (Figure 7) and shown with respect to depth for each alluvial terrace profile (Figure 4) (Day et al., 1977; Dunlop, 2002). The T3, T2, and T0 soils plot within the SD, PSD, and SP-SD mixture fields. The T3 alluvial soil has overall lower remanence ratios (Mr/Ms) and coercivity ratios (Hcr/Hc) compared to the T2 and T0 soils. This indicates a possible lower ratio of high coercivity minerals (hematite/goethite) to lower coercivity minerals (magnetite/maghemite) in the T3 alluvial soil relative to the younger T2 and T0 soils (Jackson et al., 1990). The Mr/Ms and Hcr/Hc for the T0 plot in the PSD field and are similar to samples from the T2 alluvial soils.
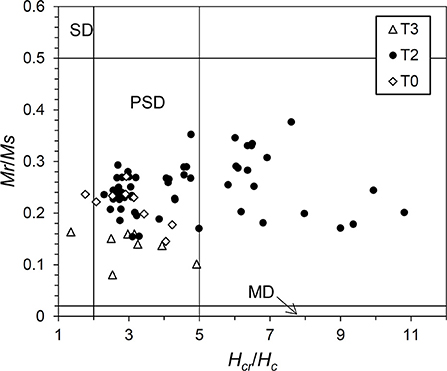
Figure 7. Dunlop-Day (Day et al., 1977; Dunlop, 2002) plot for samples from the T3, T2, and T0 profiles. SD, Single-domain magnetic grains; PSD, Pseudo-single domain magnetic grains; and MD, Multi-domain magnetic grains.
The majority of samples that plot in the SP-SD mixture field are from C, BC, lamellae, or inter-lamellae horizons. Therefore, parent material is largely composed of SP-SD grains, whereas the soil horizons are composed of grains in the SD and PSD fields. Magnetic minerals in soil have been shown to plot in the PSD field and usually indicate a mixture of SD, MD, SP-SD grains (Dunlop, 2002; Evans and Heller, 2003).
Temperature-Dependent Remanence
Low temperature zero-field cooled (ZFC) and field cooled (FC) remanence measurements were conducted upon warming to room temperature for subsoil and C horizons from all three terraces (Figure 8). The ZFC and FC curves resemble diagnostic goethite curves (Bilardello and Jackson, 2013). However, the FC is not quite twice the magnetization of the ZFC, suggesting that other magnetic minerals are present. The Verwey transition, Tv, is not present in any of the ZFC/FC data, most likely reflecting the presence of goethite and/or maghemite. The ZFC and FC curves are irreversible due to unsaturated samples acquiring partial thermal remanent magnetization at low temperatures. This is due to the high saturation field of goethite (Liu et al., 2006).
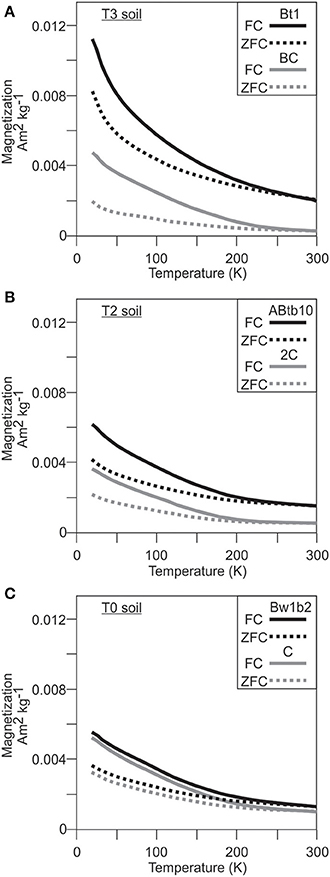
Figure 8. Field-cooled (FC) and zero-field cooled (ZFC) remanence curves from (A) T3, (B) T2, and (C) T0 soil horizons.
With increasing terrace and soil development (e.g., soil reddening, clay illuviation) the overall net magnetization of ZFC and FC increases in the subsoil relative to the parent material—C horizons. The C horizons show a relatively consistent magnetization value for all terraces. Furthermore, the T0 Bw horizon ZFC and FC magnetization has similar values when compared with the ZFC and FC data from the corresponding C horizon. This trend in temperature dependent remanence is similar to that documented in the susceptibility, remanence and hysteresis data.
The RT-SIRM curves show variability between each of the terraces (Figure 9). In the T3 terrace, the increase and then prominent drop in remanence at 110 K (Tv) of the RT-SIRM during cooling indicates the presence of oxidized magnetite, maghemite (Özdemir and Dunlop, 2010). Upon continued cooling past the Tv to 10 K, there is little change in remanence. The Tv in the T2 and T0 terraces is seen as a relatively small drop during cooling in remanence at ~110 K and are not as prominent as the Tv in the T3 subsoil horizon. There is a continued drop in remanence past the Tv to 10 K in both the T2 and T0 terrace samples. The Tv can be masked by high amounts of oxidation (Özdemir et al., 1993), as would be expected in a paleosol, perhaps explaining the lack of Tv seen in the low temperature susceptibility analyses of all terraces and the suppressed Tv transition seen in the T2 and T0 terraces.
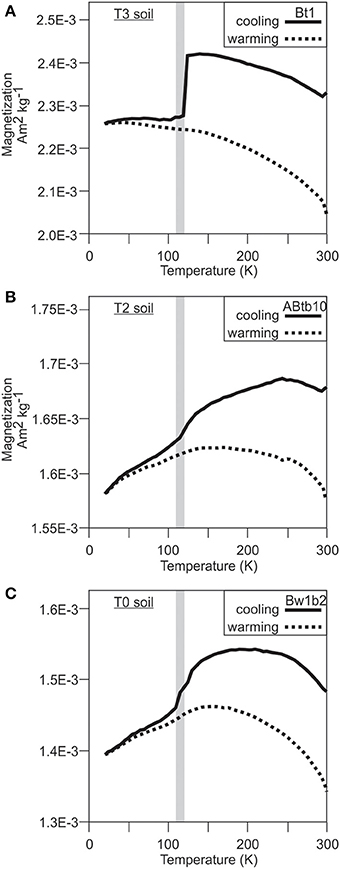
Figure 9. Room temperature-SIRM (RT-SIRM) curves on cooling and warming for soils along the (A) T3, (B) T2, and (C) T0 profiles.
In the T3 and T2 samples, the remanence is not reversible during warming back to 110 K. In the T0 terrace sample, remanence is slightly reversible during warming. This irreversible warming suggests the presence of PSD maghemite (Smirnov and Tarduno, 2002). On continued warming back to room temperature, there is no sign of the Tv in the T3 terrace sample and in the T2 and T0 terraces, the Tv is strongly suppressed. This indicates that the difference in remanence before and after temperature cycling is representative of the MD portions of the magnetic mineralogy and that SD grains hold the remaining remanence after cycling. Decrease in remanence upon warming in the T3 and T0 may be an indication of goethite; whereas the plateau and slight increase ~250 K for the T2 sample may indicate a weak Morin transition, Tm, and the presence of hematite (France and Oldfield, 2000).
Discussion
Magnetic Enhancement in Delaware Alluvial Soils
The high Xlf in A and B horizons in Delaware River alluvial soils, compared to underlying C horizons, suggests an increasing concentration of ferrimagnetic particles such as magnetite or maghemite. The Xlf increases in the soil A and B horizons are associated with increasing terrace age and weathering duration suggesting that the soil-forming factor time influences the magnetic susceptibility and magnetic enhancement of soils. Within the T2 profile, the well-developed soils with clay illuviation toward the base of the profile have higher Xlf values than the weakly-developed soils toward the surface that are currently mapped as Entisols. This provides further evidence that within the multistory T2 profile, time affects the soil magnetic properties.
Interestingly, while the average Xlf for T3 is greater than T2 (Figure 5), some of the T2 buried soils have similar Xlf values to the T3 landform soil, which formed for at least 104 years longer than buried soils that once formed in the T2 landform. Xlf is influence both by magnetic concentration and grain size, thus the similarities between Xlf values in the T3 soil and some T2 buried soils could be function of either factor. Ms is directly proportional to concentration, and thus likely more faithfully indicates variability in concentration between the T2 and T3 buried soils. Ms shows a clear difference between the T2 and T3 soils, and the T3 terrace has much higher Ms that all the T2 buried soils, including the soils with similar Xlf values (Figure 3). This indicates that there has been greater magnetic enhancement in the T3 terrace than in all buried soils in the T2 terrace. Based on this comparison between Ms and Xlf in the T3 and T2 buried soils, we suggest that the very high values in Xlf in some buried soils in the T2 terrace are a reflection of both increased pedogenesis resulting in an increase in magnetic concentration, and variability in grain size. Together this demonstrates that in the Delaware River valley periglacial and alluvial soils pedogenic duration appears to have the strongest influence on the concentration of secondary ferrimagnetic minerals.
The gradient-acquisition plots show a magnetic mineral assemblage dominated by low-coercivity and high-coercivity minerals. As with other magnetic parameters, the magnetic remanence values in the soil horizons (particularly B horizons) increase with increasing terrace age and weathering duration. Because the Tv is absent in the ZFC/FC plots, we suggest that maghemite, not magnetite, is the magnetically soft SD grain primarily responsible for much of the increased magnetic susceptibility in the soil horizons. Lindquist et al. (2011) document a similar ZFC/FC pattern from alluvial soils in Texas and suggested it could be the results of goethite and SP maghemite. In this study however, the RT-SIRM suggests the presence of stoichiometric magnetite in the T3 terrace and the irreversible warming of all RT-SIRM analyses indicates the presence of PSD maghemite in all terraces (Figure 6), suggesting a difference in magnetic mineralogy between our Delaware River valley soils and those of Lindquist et al. (2011).
Iron reduction during microbial respiration produces soluble Fe2+ in soil (Schwertmann, 1988). Given excess Fe2+, the partial dehydration of ferrihydrite can lead to the development of magnetite, which can subsequently oxidize to form maghemite. This observation has been noted and suggested in other environmental magnetic studies on alluvial soils (Singer et al., 1992; Lindquist et al., 2011) and loess (Geiss et al., 2004; Guyodo et al., 2006). The end-products of this process (magnetite and maghemite) can reflect climate (e.g., mean annual precipitation) if enough time has passed for the soil to develop and reach a steady-state with respect to climate. However, this does not appear to be the case for the Delaware River terrace alluvial soils.
Our empirical observations of Delaware periglacial and alluvial terraces show that weathering duration has an effect on the soil magnetic properties. The range of weathering duration for the Delaware periglacial and alluvial soils, 0.001–16 kyrs, falls within the active stage of secondary ferrimagnetic mineral (SFM) development according to a chemical kinetic model (Boyle et al., 2010). During this stage, changes in Xlf are dependent upon duration of soil formation. Because all soils measured along the Delaware River valley have been forming for no longer than 104.2 years, time should be the primary influence on the magnetic enhancement of these soils (Boyle et al., 2010, Figure 6A). This agreement between model output (e.g., Boyle et al., 2010) and our empirical data from Delaware River valley strengthens the argument here that Xlf measurements are a good indicator of weathering duration for periglacial and alluvial soils that formed for <16 kyrs. This approach could be useful in Quaternary (and possibly pre-Quaternary) alluvial settings where other means of age-dating are lacking.
The paleoenvironmental implications of magnetic susceptibility, duration of soil formation and climate relationships are briefly discussed here using an example from the T2 Delaware River valley buried soils (Figure 10; Supplementary Table 5) (Stinchcomb et al., 2012, 2013). In Figure 10A, the intervals with increased magnetic susceptibility coincide with the occurrence of widespread buried alluvial soils, which denote landscape stability and prolonged periods of pedogenesis (Stinchcomb et al., 2012). Two distinct intervals of increased soil formation duration occur during the Early and late-middle Holocene. These intervals correspond with carbon isotope substages IIb and IId, determined from δ13Csom of the same alluvial soils (Stinchcomb et al., 2013). The isotope substages are thought to document dry intervals that have also been documented in previous research (Kirby et al., 2002; Shuman et al., 2004; Newby et al., 2009, 2011; Mullins et al., 2011). The magnetic susceptibility data adds new insight into this relationship between floodplain soils and climate. The enhanced Xlf during the early Holocene coincides with times of moisture deficit because during dry intervals the flooding would have been less frequent along the T2 landform and resulted in prolonged duration of soil formation leading to magnetic enhancement. During the late-middle Holocene interval, enhanced Xlf (6.1 − 4.3 ka) corresponds with a wet to dry transitional phase and a previously documented incision event along the valley bottom. In this case the incision and terrace development resulted in prolonged surface exposure and more time for the accumulation of secondary ferrimagnetic minerals, enhancing Xlf. In both early and late-middle Holocene cases, the magnetic data provide quantitative support for the argument that those periods of moisture-deficit and terrace formation along the Delaware River valley lead to longer intervals of alluvial soil formation that experience less flooding and burial.
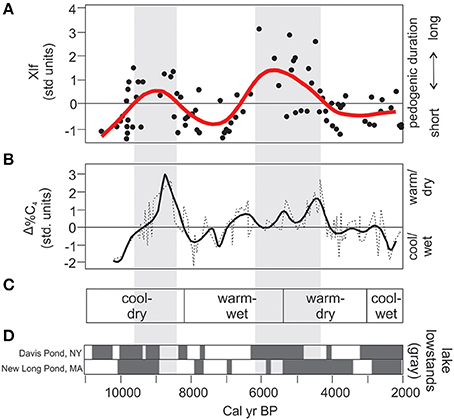
Figure 10. Xlf time series and climate data for northeastern USA study area. (A) Standardized Xlf for T2 alluvial soils along the Delaware River Valley (see Figure 1 for profile locations; Supplementary Table 5 for Xlf data). Vertical gray bars denote enhanced Xlf intervals suggesting prolonged pedogenesis. (B) Standardized variation in the %C4 plants (Δ %C4) for the Delaware River valley (Stinchcomb et al., 2013). (C) Documented climate intervals for northeastern USA (Shuman et al., 2004). (D) Documented lake lowstands for Davis Pond, NY (Newby et al., 2011) and New Long Pond, MA (Newby et al., 2009; Shuman et al., 2009). The vertical gray bars denote intervals of enhanced Xlf that are inferred here to reflect times of prolonged alluvial soil formation along the T2.
Interestingly, although there is evidence for pedogenic magnetic enhancement in the Delaware River Valley alluvial soils, the lack of low-coercivity minerals in clay lamellae suggest that the pedogenic processes responsible for magnetic enhancement in the B horizons of most alluvial soils are not occurring in the lamellae. These data suggest that the dominant processes that form clay lamellae, clay bridging and clay illuviation, are not the primary mechanisms causing magnetic enhancement in the Delaware River valley soils. Rather, clay lamellae and broadly speaking, clay illuviation, results in increasing concentrations of highly coercive magnetic minerals such as hematite or goethite. Because the lamellae are largely composed of Fe-rich clay (e.g., vermiculite, see Stinchcomb et al., in press), we suggest here that this is not likely the source of the magnetite and maghemite. Rather, we propose that the partial dehydration of ferrihydrite is occurring proximal to the framework of phyllosilicates. These zones are likely surrounded by micropore networks where O2 has difficulty diffusing inwards, possibly resulting in a reduced microenvironment and formation of magnetite and maghemite.
Conclusions
The results presented in this study show that along the Delaware River valley the magnetic susceptibility in periglacial and alluvial soils is at least partly controlled by the duration of soil formation, or more simply, the time factor of soil development. Soil horizons are shown to have higher Xlf, Ms, and S-ratios compared to parent material. Further, Xlf, Ms, and S-ratios all increase with duration of soil formation, or in other words, the T3 soil, which has undergone the longest duration of pedogenesis, shows the degree of greatest magnetic enhancement and T0, which has experienced a short duration of pedogenic development shows essentially no evidence for an increase in magnetic concentration over the soils parent material. Within the soils, magnetic remanence shows mixed low- and high coercivity mineral assemblage likely consisting of goethite, hematite and maghemite that contribute to the magnetic enhancement of the soil. Time-dependent Xlf from buried T2 alluvial soils were plotted with respect to age using previously developed age models (Stinchcomb et al., 2013). The Xlf time-series results show that enhanced soil Xlf corresponds with dry climate intervals and terrace formation. We suggest that this is related to less frequent flooding allowing more time low-coercive pedogenic magnetic minerals to form and accumulate resulting in increased Xlf. The environmental magnetic research presented here for the Delaware River valley suggests that in periglacial and buried alluvial soils and paleosols that formed for ≤16 kyrs, time is an important control on magnetic enhancement. Quaternary, and likely pre-Quaternary paleopedology, must consider duration of pedogenesis (i.e., the soil forming factor time), in addition to moisture as an important factor influencing magnetic enhancement in alluvial soils and paleosols.
Conflict of Interest Statement
The authors declare that the research was conducted in the absence of any commercial or financial relationships that could be construed as a potential conflict of interest.
Acknowledgments
We thank the University of Minnesota Institute of Rock Magnetism (IRM) researchers for their assistance and guidance. We are especially indebted to Mike Jackson for his assistance with IRM equipment and discussion on techniques and interpretation. We thank Patrick Levy and Lark Weller for graciously hosting Stinchcomb during an IRM visiting fellowship. We are indebted to Steve Driese for his guidance and support on this research. This work was supported by the National Science Foundation (NSF EAR 0823131 awarded to Driese), the IRM fellowship program, and Baylor University.
Supplementary Material
The Supplementary Material for this article can be found online at: http://www.frontiersin.org/journal/10.3389/feart.2014.00017/abstract
References
Balsam, W. L., Ellwood, B. B., Ji, J., Williams, E. R., Long, X., and El Hassani, A. (2011). Magnetic susceptibility as a proxy for rainfall: worldwide data from tropical and temperate climate. Quat. Sci. Rev. 30, 2732–2744. doi: 10.1016/j.quascirev.2011.06.002
Boyle, J. F., Dearing, J. A., Blundell, A., and Hannam, J. A. (2010). Testing competing hypotheses for soil magnetic susceptibility using a new chemical kinetic model. Geology 38, 1059–1062. doi: 10.1130/G31514.1
Cogoini, M., Elmore, R. D., Soreghan, G. S., and Lewchuk, M. T. (2001). Contrasting rock-magnetic characteristics of two upper paleozoic loessite-paleosol profiles. Phys. Chem. Earth A 26, 905–910. doi: 10.1016/S1464-1895(01)00140-5
Crowl, G. H. (1980). Woodfordian age of the Wisconsin glacial border in northeastern Pennsylvania. Geology 8, 51–55.
Day, R., Ruller, M., and Schmidt, V. (1977). Hysteresis properties of titanomagnetites—grain-size and compositional dependence. Phys. Earth Planet. Inter. 13, 260–267. doi: 10.1016/0031-9201(77)90108-X
Dearing, J. A., Dann, R. J. L., Hay, K., Lees, J. A., Loveland, P. J., Maher, B. A., et al. (1996a). Frequency-dependent susceptibility measurements of environmental materials. Geophys. J. Int. 124, 228–240. doi: 10.1111/j.1365-246X.1996.tb06366.x
Dearing, J. A., Hay, K. L., Baban, S. M. J., Huddleston, A. S., Wellington, E. M. H., and Loveland, P. J. (1996b). Magnetic susceptibility of soil: an evaluation of conflicting theories using a national data set. Geophys. J. Int. 127, 728–734. doi: 10.1111/j.1365-246X.1996.tb04051.x
Dent, R. J. (1999). “Shawnee Minisink: new dates on the Paleoindian component,” in Poster Presented at the 64th Annual Meeting of the Society for American Archaeology (Chicago, IL).
Dunlop, D. J. (2002). Theory and application of the Day plot (M-rs/M-s versus H-cr/H-c) 2. Application to data for rocks, sediments, and soils. J. Geophys. Res. 107, 2057. doi: 10.1029/2001JB000487
Dent, R. (2002). “Paleoindian occupation of the Upper Delaware Valley: Revisiting Shawnee-Minisink and nearby sites,” in Ice Age People of Pennsylvania, eds K. W. Carr and J. M. Adovasio (Harrisburg, PA: Pennsylvania Historical and Museum Commission), 51–78.
Dunlop, D. J., and Özdemir, Ö. (1997). Rock Magnetism: Fundamentals and Frontiers. Cambridge, UK: Cambridge University Press.
Dunlop, D. J., Özdemir, Ö., and Rancourt, D. G. (2006). Magnetism of biotite crystals. Earth Sci. Lett. 243, 805–819. doi: 10.1016/j.epsl.2006.01.048
Evans, M. E., and Heller, F. (2003). Environmental Magnetism Principles and Applications. Amsterdam: Academic Press.
France, D. E., and Oldfield, F. (2000). Identifying goethite and hematite from rock magnetic measurements of soils and sediments. J. Geophys. Res. 105, 2781–2795. doi: 10.1029/1999JB900304
Geiss, C. E., Egli, R., and Zanner, C. W. (2008). Direct estimates of pedogenic magnetite as a tool to reconstruct past climates from buried soils. J. Geophys. Res. 113:B11102. doi: 10.1029/2008JB005669
Geiss, C. E., and Zanner, C. W. (2006). How abundant is pedogenic magnetite? Abundance and grain size estimates for loessic soils based on rock magnetic analyses. J. Geophys. Res. 111, B12S21. doi: 10.1029/2006JB004564
Geiss, C. E., Zanner, C. W., Banerjee, S. K., and Joanna, M. (2004). Signature of magnetic enhancement in a loessic soil in Nebraska, United States of America. Earth Planet. Sci. Lett. 228, 355–367. doi: 10.1016/j.epsl.2004.10.011
Gingerich, J. A. M. (2007). Picking up the pieces: new Paleoindian research in the Upper Delaware Valley. Archaeol. East. N. Am. 35, 117–124.
Gingerich, J. A. M. (2013). “Revisiting shawnee minisink,” in The Eastern Fluted Point Tradition, ed J. A. M. Gingerich (Salt Lake City: University of Utah Press), 218–256.
Guyodo, Y., LaPara, T. M., Anschutz, A. J., Penn, R. L., Banerjee, S. K., Geiss, C. E., et al. (2006). Rock magnetic, chemical and bacterial community analysis of a modern soil from Nebraska. Earth Planet. Sci. Lett. 251, 168–178. doi: 10.1016/j.epsl.2006.09.005
Jackson, M., Worm, H., and Banerjee, S. (1990). Fourier-analysis of digital hysteresis data—rock magnetic applications. Phys. Earth Planet. Inter. 65, 78–87. doi: 10.1016/0031-9201(90)90077-B
Jenny, H. (1941). Factors of Soil Formation: A System of Quantitative Pedology. New York, NY: McGraw-Hill Book Company, Inc.
King, J., Banerjee, S., Marvin, J., and Özdemir, Ö. (1982). A comparison of different magnetic methods for determining the relative grain-size of magnetite in natural materials—some results from lake-sediments. Earth Planet. Sci. Lett. 59, 404–419. doi: 10.1016/0012-821X(82)90142-X
Kinsey, W. F. (1972). Archaeology of the Upper Delaware River Valley. Harrisburg, PA: Anthropological Series of the Pennsylvania Historical and Museum Commission.
Kirby, M. E., Patterson, W. P., Mullins, H. T., and Burnett, A. W. (2002). Post-Younger Dryas climate interval linked to circumpolar vortex variability: isotopic evidence from Fayetteville Green Lake, New York. Clim. Dyn. 19, 321–330. doi: 10.1007/s00382-002-0227-y
Kletetschka, G., and Banerjee, S. (1995). Magnetic stratigraphy of Chinese loess as a record of natural fires. Geophys. Res. Lett. 22, 1341–1343. doi: 10.1029/95GL01324
Kukla, G., Heller, F., Liu, X. M., Xu, C. T., Liu, T., and An, Z. S. (1988). Pleistocene climates in China dated by magnetic susceptibility. Geology 16, 811.
Le Borgne, E. (1955). Susceptibilite magnetique anormale du sol superficiel. Ann. Geophys. 11, 399–419.
Le Borgne, E. (1960). Effect of fire on the magnetic properties of soil and on those of schist and granite. Ann. Geophy. 16, 159–195.
Lee, J., Martin, A., and Stiteler, J. (2010). “Phase III archaeological data recovery of prehistoric site 28Wa290, Route I-80 truck weigh station project, Knowlton Township, Warren County, New Jersey,” in Report Prepared for the New Jersey Department of Transportation. On file, New Jersey Historic Preservation Office (Trenton, NJ: Hunter Research, Inc.).
Lindquist, A. K., Feinberg, J. M., and Waters, M. R. (2011). Rock magnetic properties of a soil developed on an alluvial deposit at Buttermilk Creek, Texas, USA. Geochem. Geophys. Geosyst. 12:Q12Z36. doi: 10.1029/2011GC003848
Liu, Q., Yu, Y., Torrent, J., Roberts, A. P., Pan, Y., and Zhu, R. (2006). Characteristic low-temperature magnetic properties of aluminous goethite [α-(Fe, Al)OOH] explained. J. Geophys. Res. 111, B12S34. doi: 10.1029/2006JB004560
Maher, B. (1986). Characterization of soils by mineral magnetic measurements. Phys. Earth Planet. Inter. 42, 76–92. doi: 10.1016/S0031-9201(86)80010-3
Maher, B. A. (1998). Magnetic properties of modern soils and Quaternary loessic paleosols: paleoclimatic implications. Palaeogeogr. Palaeoclimatol. Palaeoecol. 137, 25–54.
Maher, B. A., Alekseev, A., and Alekseeva, T. (2002). Variation of soil magnetism across the Russian steppe: its significance for use of soil magnetism as a paleorainfall proxy. Quat. Sci. Rev. 21, 1571–1576. doi: 10.1016/S0277-3791(02)00022-7
Maher, B. A., Alekseev, A., and Alekseeva, T. (2003). Magnetic mineralogy of soils across the Russian Steppe: climatic dependence of pedogenic magnetite formation. Palaeogeogr. Palaeoclimatol. Palaeoecol. 201, 321–341. doi: 10.1016/S0031-0182(03)00618-7
Maher, B. A., and Thompson, R. (1995). Paleorainfall reconstructions from pedogenic magnetic susceptibility variations in the Chinese loess and paleosols. Quat. Res. 44, 383–391. doi: 10.1006/qres.1995.1083
McNett, C. W. Jr. McMillan, B. A., and Marshall, S. B. (1977). The Shawnee-Minisink site. Ann. N.Y. Acad. Sci. 288, 282–296. doi: 10.1111/j.1749-6632.1977.tb33623.x
Mullins, C. (1977). Magnetic-susceptibility of soil and its significance in soil science—review. J. Soil Sci. 28, 223–246. doi: 10.1111/j.1365-2389.1977.tb02232.x
Mullins, H. T., Patterson, W. P., Teece, M. A., and Burnett, A. W. (2011). Holocene climate and environmental change in central New York (USA). J. Paleolimn. 45, 243–256. doi: 10.1007/s10933-011-9495-z
Newby, P. E., Donnelly, J. P., Shuman, B. N., and MacDonald, D. (2009). Evidence of centennial-scale drought from southeastern Massachusetts during the Pleistocene/Holocene transition. Quat. Sci. Rev. 28, 1675–1692. doi: 10.1016/j.quascirev.2009.02.020
Newby, P. E., Shuman, B. N., Donnelly, J. P., and MacDonald, D. (2011). Repeated century-scale droughts over the past 13,000 yr near the Hudson River watershed, USA. Quat. Res. 75, 523–530. doi: 10.1016/j.yqres.2011.01.006
Oldfield, F., and Crowther, J. (2007). Establishing fire incidence in temperate soils using magnetic measurements. Palaeogeogr. Palaeoclimatol. Palaeoecol. 249, 362–369. doi: 10.1016/j.palaeo.2007.02.007
Özdemir, Ö., and Dunlop, D. (2010). Hallmarks of maghemitization in low-temperature remanence cycling of partially oxidized magnetite nanoparticles. J. Geophys. Res. 115, B02101. doi: 10.1029/2009JB006756
Özdemir, Ö., Dunlop, D., and Moskowitz, B. (1993). The effect of oxidation on the Verwey transition in magnetite. Geophys. Res. Lett. 20, 1671–1674. doi: 10.1029/93GL01483
Peteet, D. M., Beh, M., Orr, C., Kurdyla, D., Nichols, J., and Guilderson, T. (2012). Delayed deglaciation or extreme Arctic conditions 21–16 cal. kyr at southeastern Laurentide Ice sheet margin? Geophys. Res. Lett. 39, L11706. doi: 10.1029/2012GL051884
Reimer, P. J., Bard, E., Bayliss, A., Beck, J. W., Blackwell, P. G., Bronk Ramsey, C., et al. (2013). IntCal13 and MARINE13 radiocarbon age calibration curves 0-50000 years cal BP. Radiocarbon 55, 1869–1887. doi: 10.2458/azu_js_rc.55.16947
Ritter, D. F., Kinsey, W. F., and Kauffman, M. E. (1973). Overbank sedimentation in the Delaware River valley during the last 6000 years. Science 179, 374–375. doi: 10.1126/science.179.4071.374
Schoeneberger, P. J., Wysocki, D. A., Benham, E. C., and Broderson, W. D. (2002). Field Book for Describing and Sampling Soils, Version 2.0. Lincoln, NE: National Soil Survey Center.
Schwertmann, U. (1988). Goethite and hematite formation in the presence of clay minerals and gibbsite at 25C. Soil Sci. Soc. Am. J. 52, 288–291. doi: 10.2136/sssaj1988.03615995005200010052x
Shuman, B., Newby, P., Huang, Y. S., and Webb, T. (2004). Evidence for the close climatic control of New England vegetation history. Ecology 85, 1297–1310. doi: 10.1890/02-0286
Shuman, B. N., Newby, P., and Donnelly, J. P. (2009). Abrupt climate change as an important agent of ecological change in the Northeast U.S. throughout the past 15,000 years. Quat. Sci. Rev. 28, 1693–1709. doi: 10.1016/j.quascirev.2009.04.005
Singer, M., Fine, P., Verosub, K., and Chadwick, O. (1992). Time-dependence of magnetic-susceptibility of soil chronosequences on the California coast. Quat. Res. 37, 323–332. doi: 10.1016/0033-5894(92)90070-Y
Singer, M. J., and Fine, P. (1989). Pedogenic factors affecting magnetic susceptibility of Northern California soils. Soil Sci. Soc. Am. J. 53, 1119–1127. doi: 10.2136/sssaj1989.03615995005300040023x
Singer, M. J., Verosub, K. L., Fine, P., and TenPas, J. (1996). A conceptual model for the enhancement of magnetic susceptibility in soils. Quat. Int. 34–36, 243–248. doi: 10.1016/1040-6182(95)00089-5
Smirnov, A. V., and Tarduno, J. A. (2002). Magnetic field control of the low-temperature magnetic properties of stoichiometric and cation-deficient magnetite. Earth Planet. Sci. Lett. 194, 359–368. doi: 10.1016/S0012-821X(01)00575-1
Soreghan, G. S., Elmore, R. D., Katz, B., Cogoini, M., and Banerjee, S. (1997). Pedogenically enhanced magnetic susceptibility variations preserved in Paleozoic loessite. Geology 25, 1003–1006.
Stewart, M., Custer, J., and Kline, D. (1991). A deeply stratified archaeological and sedimentary sequence in the Delaware River valley of the Middle Atlantic region, United States. Geoarchaeology 6, 169–182. doi: 10.1002/gea.3340060204
Stinchcomb, G. E., Driese, S. G., Nordt, L. C., and Allen, P. M. (2012). A mid to late Holocene history of floodplain and terrace reworking along the middle Delaware River valley, USA. Geomorphology (Amsterdam, Netherlands) 169–170, 123–141. doi: 10.1016/j.geomorph.2012.04.018
Stinchcomb, G. E., Driese, S. G., Nordt, L. C., Messner, T. C., and DiPietro, L. M. (in press). Early Holocene soil cryoturbation in northeastern USA: implications for archaeological site formation. Quat. Int. doi: 10.1016/j.quaint.2014.05.011
Stinchcomb, G. E., Messner, T. C., Williamson, F. C., Driese, S. G., and Nordt, L. C. (2013). Climatic and human controls on Holocene flood plain vegetation changes in eastern Pennsylvania based on the isotopic composition of soil organic matter. Quat. Res. 79, 377–390. doi: 10.1016/j.yqres.2013.02.004
Stoops, G. (2003). Guidelines for Analysis and Description of Soil and Regolith Thin Sections. Madison, WI: Soil Science Society of America, Inc.
Torrent, J., Liu, Q. S., and Barron, V. (2010). Magnetic susceptibility changes in relation to pedogenesis in a Xeralf chronosequence in northwestern Spain. Eur. J. Soil Sci. 61, 161–173. doi: 10.1111/j.1365-2389.2009.01216.x
Vidic, N. J., Singer, M. J., and Verosub, K. L. (2004). Duration dependence of magnetic susceptibility enhancement in the Chinese loess-palaeosols of the past 620 ky. Palaeogeogr. Palaeoclimatol. Palaeoecol. 211, 271–288. doi: 10.1016/j.palaeo.2004.05.012
Wall, R., and Botwick, B. Y. (1993). Archaeological Survey and Testing, Milford Transect, Delaware Water Gap National Recreation Area, Pennsylvania and New Jersey. Philadelphia, PA: Prepared for the National Park Service, Mid-Atlantic Region.
Watts, W. A. (1979). Late Quaternary vegetation of Central Appalachia and the New Jersey Coastal Plain. Ecol. Monogr. 49, 427–469. doi: 10.2307/1942471
Werner, D. J. (1972). “The zimmerman site, 36-Pi-14,” in Archaeology of the Upper Delaware River Valley, No. 2, ed W. F. Kinsey (Harrisburg, PA: Anthropological Series of the Pennsylvania Historical and Museum Commission), 55–130.
Witte, R. W. (2001). “Late Wisconsinan deglaciation and postglacial history of Minisink Valley: Delaware,” in 2001—A Delaware River Odyssey, Guidebook, 66th Annual Conference of Pennsylvania Geologists, eds J. D. Inners and G. M. Fleeger (Shawnee-on-Delaware, PA), 99–118.
Keywords: buried soils, paleosol, alluvial, periglacial, magnetic susceptibility, paleoenvironment
Citation: Stinchcomb GE and Peppe DJ (2014) The influence of time on the magnetic properties of late Quaternary periglacial and alluvial surface and buried soils along the Delaware River, USA. Front. Earth Sci. 2:17. doi: 10.3389/feart.2014.00017
Received: 28 March 2014; Accepted: 15 July 2014;
Published online: 04 August 2014.
Edited by:
Randel Tom Cox, University of Memphis, USAReviewed by:
Silviu Constantin, Emil Racovita Institute of Speleology, RomaniaRandel Tom Cox, University of Memphis, Earth Sciences, USA
Copyright © 2014 Stinchcomb and Peppe. This is an open-access article distributed under the terms of the Creative Commons Attribution License (CC BY). The use, distribution or reproduction in other forums is permitted, provided the original author(s) or licensor are credited and that the original publication in this journal is cited, in accordance with accepted academic practice. No use, distribution or reproduction is permitted which does not comply with these terms.
*Correspondence: Gary E. Stinchcomb, Department of Geosciences, Watershed Studies Institute, Murray State University, 334 Blackburn Hall, Murray, KY 42071, USA e-mail:Z3N0aW5jaGNvbWJAbXVycmF5c3RhdGUuZWR1