
95% of researchers rate our articles as excellent or good
Learn more about the work of our research integrity team to safeguard the quality of each article we publish.
Find out more
TECHNOLOGY AND CODE article
Front. Drug Saf. Regul. , 19 January 2023
Sec. Advanced Methods in Pharmacovigilance and Pharmacoepidemiology
Volume 2 - 2022 | https://doi.org/10.3389/fdsfr.2022.1016042
This article is part of the Research Topic Computational Methods and Systems to Support Decision Making in Pharmacovigilance View all 7 articles
 Vlasios K. Dimitriadis
 Stella Dimitsaki
 Achilleas Chytas
 George I. Gavriilidis
 Christine Kakalou
 Panos Bonotis
 Pantelis Natsiavas*
As new data sources have emerged, the data space which Pharmacovigilance (PV) processes can use has significantly expanded. However, still, the currently available tools do not widely exploit data sources beyond Spontaneous Report Systems built to collect Individual Case Safety Reports (ICSRs). This article presents an open-source platform enabling the integration of heterogeneous data sources to support the analysis of drug safety related information. Furthermore, the results of a comparative study as part of the project’s pilot phase are also presented. Data sources were integrated in the form of four “workspaces”: (a) Individual Case Safety Reports—obtained from OpenFDA, (b) Real-World Data (RWD) —using the OMOP-CDM data model, (c) social media data—collected via Twitter, and (d) scientific literature—retrieved from PubMed. Data intensive analytics are built for each workspace (e.g., disproportionality analysis metrics are used for OpenFDA data, descriptive statistics for OMOP-CDM data and twitter data streams etc.). Upon these workspaces, the end-user sets up “investigation scenarios” defined by Drug-Event Combinations (DEC). Specialized features like detailed reporting which could be used to support reports for regulatory purposes and also “quick views” are provided to facilitate use where detailed statistics might not be needed and a qualitative overview of the available information might be enough (e.g., clinical environment). The platform’s technical features are presented as Supplementary Material via a walkthrough of an example “investigation scenario”. The presented platform is evaluated via a comparative study against the EVDAS system, conducted by PV professionals. Results from the comparative study, show that there is indeed a need for relevant technical tools and the ability to draw recent data from heterogeneous data sources is appreciated. However, a reluctance by end-users is also outlined as they feel technical improvements and systematic training are required before the potential adoption of the presented software. As a whole, it is concluded that integrating such a platform in real-world setting is far from trivial, requiring significant effort on training and usability aspects.
Adverse Drug Reactions (ADRs) emerge as a major public health issue as they are a significant causal factor for health morbidity and mortality, also leading to vast healthcare system costs. ADRs are estimated to cause an increase on the duration of hospitalization stays for 9.2 ± 0.2 days for outpatient setting and 6.1 ± 2.3 days for inpatient setting (Formica et al., 2018). Furthermore, ADRs financial costs estimated for the inpatient setting range from €2851 to €9015 and from €174 to €8515 for the outpatient setting (Formica et al., 2018). Similarly, in a study regarding the Veteran Affairs ecosystem in United States, the cost of ADRs was estimated from $6951 to $29535 (median costs) (Aspinall et al., 2022).
Pharmacovigilance (PV) is defined as the “science and activities relating to the detection, assessment, understanding and prevention of adverse effects or any other possible drug-related problems” (World Health Organization, 2002). The main data source currently used for PV purposes is the so-called “Individual Case Safety Reports” (ICSRs) (a.k.a. “yellow cards”), voluntarily submitted by healthcare professionals (HCPs) or even patients via “Spontaneous Reporting Systems” (SRSs) or other communication channels (sometimes via direct communication with pharma industry). Typically, SRSs are hosted in a national IT system, e.g., FDA Adverse Event Reporting System (FAERS) hosted by the Food and Drug Administration (FDA) in the United States. Data collected on a national level are eventually aggregated in the VigiBase system by the Uppsala Monitoring Centre (WHO-UMC), the World Health Organization Collaboration Centre for International Drug Monitoring (Lindquist, 2008). These data are statistically elaborated, typically via ‘disproportionality analysis’ (DA) approaches (Arnaud et al., 2017) to identify potential PV “signals”. PV signals are defined as “information that arises from one or multiple sources (including observations and experiments), which suggests a new potentially causal association, or a new aspect of a known association, between an intervention and an event or set of related events, either adverse, or beneficial, that is judged to be of sufficient likelihood to justify verificatory action” (Council for International Organizations of Medical Sciences, 2010). Potential PV signals’ evaluation processes can include various steps (e.g., signal detection, triage, validation, etc.).
Despite the substantial progress in terms of “intelligent” and data-intensive technical paradigms, these developments have not yet been widely adopted in the context of PV every-day activities. Hence, there is an increasing need for the development of new tools aiming to integrate “intelligent” data processing approaches to support drug safety (Trifirò et al., 2018; Bate and Hobbiger, 2020). Moreover, the emergence of additional data sources such as biochemical databases, electronic health records (EHRs), insurance claims or other “Real-World Data” (RWD) and social media (Hussain, 2021; Knowledge Base workgroup of the Observational Health Data Sciences and Informatics (OHDSI) collaborative, 2017) have led to relevant research initiatives (Natsiavas et al., 2019b; Ball et al., 2022). To this end, Machine Learning (ML) algorithms are also under investigation (Lee et al., 2022; Imran et al., 2022), including the use of Natural Language Processing (NLP) which is elaborated to identify ADR mentions in EHRs/clinical notes or other free text/unstructured data. Other Knowledge Engineering approaches (e.g., the use of Semantic Web technologies, ontologies and “reasoning” upon Knowledge Graphs etc.) are also actively investigated (Natsiavas et al., 2019b). Recently, the need to exploit AI upon distributed RWD networks like the OHDSI ecosystem of data providers has also been highlighted as a potential line of work (Wong et al., 2022).
Along these lines, drug-safety focusing organizations actively investigate the use of these emerging data sources. Indicatively, the IMI WEB-RADR and WEB-RADR2 projects’ consortia1 have investigated the use of social media for signal identification (Caster et al., 2018). Beyond research, focusing on the evaluation of RWD, FDA has developed the Sentinel system2 to include clinical data and other RWD in its drug safety-oriented activities and the European Medicines Agency (EMA) has recently initiated an initiative called DARWIN EU® (EMA website, 2022a). However, the currently available software tools are mostly focusing on the use of ICSRs and do not typically engage data sources like RWD and social media. While research initiatives have actively investigated the use EHR as part of the PV signal management processes with notable results [e.g., (Harpaz et al., 2013; Li et al., 2014; Pacurariu et al., 2015; Harpaz et al., 2017; Tavares-Da-Silva et al., 2020)], still, it seems that there is a gap in terms of relevant software tools development.
In this article, we introduce a web platform which integrates ICSRs and emerging data sources, namely clinical data and social media along with the use of scientific publications to support the investigation of potential signals. The presented platform was developed in the context of a project named PVClinical3, aiming to provide a software tool suitable for use both by PV professionals and also HCPs in the clinical setting (Natsiavas et al., 2019a; Natsiavas et al., 2020). The paper focuses on the presentation of the results of a comparative study conducted in the context of the project engaging PV professionals, and discusses challenges in terms of integrating such tools in every-day PV activities.
The PVClinical platform (available as an open-source project4) employs Knowledge Engineering as its main technical paradigm, using Resource Description Framework (RDF) as one of its main data representation formalisms5. More specifically, the referenced terms are organized in the form of RDF-based Knowledge Graphs, enabling syntactic and semantic interoperability, but also enabling reasoning based on the respective conceptual structures and their semantics (e.g., super- or sub-class relationships), a process which is not available on raw data available in non-RDF format [e.g., DrugBank6 (Wishart et al., 2018) data in XML format].
More specifically, two widely adopted reference terminologies are used to semantically organize the respective information, i.e., Anatomical Therapeutic Chemical classification system (WHO-ATC)7 to refer to drugs, and the Medical Dictionary for Regulatory Activities (MedDRA)8 to refer to adverse drug reactions. WHO-ATC is a hierarchical conceptual structure organizing active ingredients according to the organ or system on which they act and their pharmacological profile. Similarly, MedDRA is a conceptual hierarchy organizing ADRs, extensively used as a de facto standard in the context of drug safety. Based on these main terminologies, other data sources are also used in the respective Knowledge Graph (i.e., DrugBank data were used to retrieve drug information) in order to expand the relevant data space and include information useful to identify drugs (e.g., via synonyms, including commercial/brand names)9. The RDF version of MedDRA and the ATC was retrieved via NCBO BioPortal (Salvadores et al., 2013)10, and the RDF version of DrugBank was retrieved using the Bio2RDF (Callahan et al., 2013) transformation script11,12.
Semantic annotation of the raw data integrated in such tools is a typical challenge, usually tackled via NLP approaches including at least a Named Entity Recognition (NER) process. In the presented platform, an annotation approach of the raw data was not applied per se. In the presented platform, an extensive list of synonyms is included in the project’s RDF-based Knowledge Graph built based on DrugBank to retrieve brand names etc. and well-defined conceptual hierarchies (e.g., ATC, MedDRA etc.) to collect synonyms for drugs and ADRs. This synonyms’ list is used to identify drugs and ADR mentions in the raw data and map them to ATC and MedDRA, the main terminologies used to formulate the respective Drug-Event Combination (DEC) scenario and disambiguate relevant terms. During the definition of the DEC-based scenario, multiple ATC and MedDRA codes can be used to overcome the existing complexity of potential multiple links between drugs and ATC codes.
As data management is a cross-cutting concern, some details are provided regarding how data were handled for each data source/workspace:
- FAERS data: Data were originally retrieved from regular XML files published by FDA and then they were stored in a non-relational database, i.e., a MongoDB instance13. During this process, the original free text data were fed in a NER pipeline to identify drugs and ADRs using RxNorm and the already outlined Knowledge Graph containing “synonyms”.
- OMOP-CDM data: OMOP-CDM data have (at least in principle) their basic information (i.e., diagnosis and medication) already semantically annotated using the OHDSI vocabulary terms which are mapped in ATC and MedDRA (among other thesauri). The various fields of the OMOP-CDM which could contain “unstructured” information (e.g., clinical notes fields) were ignored. To facilitate pilot testing of the platform, synthetic clinical data from SynPuf database in OMOP-CDM format were also integrated.
- PubMed: The synonyms identified in the Knowledge Graph were used to retrieve relevant papers using the respective PubMed Application Programming Interface (API). More specifically, the PubMed API is used to retrieve papers containing the DEC-related synonyms in the titles/abstracts.
- Twitter: Indeed, this is the most challenging data source given that people do very frequently use slang language, abbreviations of any kind, hashtags etc. The synonyms contained in the Knowledge Graph are given as arguments in Twitter streaming API calls to retrieve relevant tweets and store them also in MongoDB format. Example tweets mined during the pilot study are:
∘ “I think we need to go up to 100 mg of my Sertraline. I’d already requested 50 mg, but I’m supposed to take the second dose daily of my Valproic Acid before I can have 100 mg (to prevent hypomanic/manic episodes) and I’m wary of that as it can damage the liver. Have to do it though. (sad face emoticon)”
∘ “Read the latest from Guo in Annals of Pharmacotherapy: Valproic Acid After Neurosurgery Induces Elevated Risk of Liver Injury: A Prospective Nested Case-Control Study https://t.co/UJBUIXt3fa”
∘ “@medical_xpress @BrJCancer. Adding to the epidemic of liver disease. Valproic acid has a black box warning for hepatotoxicity, pancreatitis, and fetal abnormalities Valproic acid may cause serious or life-threatening damage to the liver that is most likely to occur with the first 6 months of therapy.”
∘ “@FirstPogMoThoin @felix_masibay Valproic acid does a lot of damage to the liver as well; it is a very harmful drug for the body in general.”
Upon these data sources, a data intensive web user interface has been developed to enable user exploration and drill-down via interactive analytics, based also on other open source software components (e.g., the tools provided by the Observational Health Data Sciences and Informatics (OHDSI) initiative community14 (Dimitriadis et al., 2021), openly available web analytics apps using openFDA data15 etc).
- OpenFDA workspace: Several interactive analytics were deployed, mostly focusing on disproportionality analysis metrics which are extensively used to support decision making processes in PV. These methods include the calculation of Reporting Odds Ratio (ROR) (Rothman et al., 2004; Evans et al., 2001), Proportional Reporting Ratio (PRR) (Evans et al., 2001), Change Point Analysis (CPA) (Xu et al., 2015) and other user interaction functionalities. For example, the “dynamic PRR” and the “Change Point Analysis” views depict how the PRR metric evolves over time, a Bayesian and a variance CPA approach16 while in various views the PVClinical platform enables the identification of medium values for specific time windows, dynamic data filtering, navigating in potential other adverse effects reported in the same ICSRs and data export (including the relevant ICSR reports) in an excel file format.
- OHDSI workspace: In the OHDSI workspace, analytics tools used for observational studies were integrated to support the exploration of RWD sources as they are typically used in the context of the ATLAS tool built and supported by the OHDSI community. To this end, the following analysis tools were integrated (Dimitriadis et al., 2021)17:
∘ “Incidence rate” is defined as a measure of the frequency with which some event, such as a disease diagnosis or other incidence, occurs over a specified time period. Typically, the incidence rate is calculated based on the ratio of the “target cohort” (i.e., the set of patients under investigation, e.g., all the patients of the hospital which the specific drug was administered to) and the “outcome cohort” (i.e., the set of patients which have been diagnosed with the respective adverse condition).
∘ “Cohort characterization” is defined as the process of generating cohort level descriptive summary statistics from person level covariate data.
∘ “Drug exposure” depicts the distribution of the population exposed to a specific drug.
∘ “Condition occurrence” quantifies the distribution of the population diagnosed with the respective health conditions (illness, side effects, side effects, etc.).
∘ “Cohort pathway” provides an aggregated sequence of events (e.g., diagnosis, treatment decisions etc.) for the set of patients which have been treated with the specific drug (target cohort).
- PubMed workspace: The papers retrieved can be marked in terms of relevance with the DEC under question as “selected”, “border-line” or “rejected”. Furthermore, the papers can be filtered via publication date and annotated with comments.
- Twitter workspace: Data are retrieved using twitter’s API simple keyword search and upon the collected tweets, interactive visualization techniques and simple NLP-like operations are employed to identify hashtags, retweets etc. In terms of user interface, counters of relevant tweets indicating the number of retweets are presented in a timeline, enabling dynamic interaction and filtering or sorted by their the platform’s UI by manually selecting a specific time period or clicking on a specific timepoint (see the walkthrough presented as part of the Supplementary Material for screenshots). Furthermore, a heatmap visualization is presented to highlight any twitter accounts heavily posting about the specific DEC and potentially being highly influential. Finally, the top hashtags can be inspected in a separate streamgraph (Kakalou et al., 2022).
The user can interact with the system via two independent pathways (Figure 1):
- (a) Data exploration: this pathway is designed to be typically used by PV professionals who would like to analyze vast amounts of data to support the need for regulatory action or not.
- (b) Individual case management: this pathway is designed to be typically used by HCPs in the clinical setting who would like to decide whether a specific patient is suffering from an ADR or not.
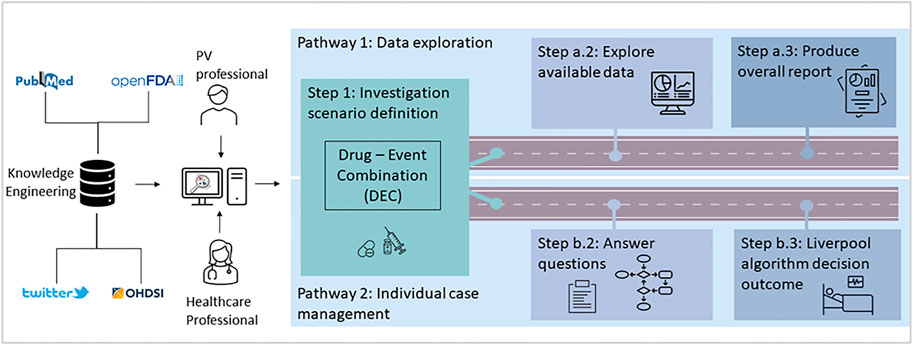
Figure 1. PVClinical platform end user pathways.
It should be noted though that these usage pathways can also be used complementary or interchangeably as many times the PV professionals are analyzing each ICSR individually (steps b.2 and b.3). Similarly, HCPs could also need to have access to a wider data space (e.g., ICSRs, RWD etc.) to support their clinical decisions regarding potential ADRs.
The “data exploration” pathway can be outlined in 3 steps:
- Step 1: the drug event combination (DEC) for the "investigation scenario” is defined
- Step a.2: the available data sources are explored
- Step a.3: an overall aggregative report is produced for further use (e.g., regulatory or quality assurance purposes)
Similarly, for the “individual case management” pathway, there are also 3 steps outlined:
- Step 1: similarly, with the “data exploration” pathway, the DEC for the ‘‘investigation scenario” is defined
- Step b.2: the questions defined in the “Liverpool’s algorithm” (Gallagher et al., 2011) are answered
- Step b.3: based on the answers given in step b.2, the system provides a hint on whether there is an ADR for the specific individual case per se or not
Based on early interaction with potential end-users, it was clear that the presented analytics could be too complicated and thus overwhelming for non-PV professionals, thus, the platform also provides simplified “quick views”. “Quick views” aim to provide access to the most intuitive available statistics/figures, while a “detailed view” is always available providing access to the full stack of available analytics and statistical measures. For example, the “quick view” in the Open FDA workspace does not include the “Bayesian change point analysis”. Similarly, in the OHDSI workspace the ‘‘quick view” only provides access to the “Incidence Rate” and “Cohort Characterizations” functionalities, leaving out the “Drug Exposure”, “Condition Occurrence” and “Cohort Pathways” analysis views.
In the case where the use of multiple synonyms might lead to multiple potential combinations of drugs and/or adverse effect terms, all the potential combinations of keywords are presented and analyzed independently. For example, in a scenario where 5 synonyms for the drug and 5 synonyms for the adverse effect are selected, there are 5 × 5 = 25 “pairs” of DEC terms identified. For each pair of DEC terms, all the relevant disproportionality measures are calculated and the relevant analytics are presented.
• Step 1: Definition of investigation scenario
Each time a new potential PV signal is to be investigated, a new “investigation scenario” is defined as a DEC, which could potentially refer to multiple drugs or (adverse) effects of interest.
• Step a.2: Data exploration
As each data source has its own unique features and characteristics, the respective analytics views provided by the platform are adapted accordingly. For example, while disproportionality analysis ratios (e.g., PRR, ROR etc.) might be highly relevant for ICSR data, their use in RWD is currently under investigation and there are no (yet) widely accepted statistical metrics to be used. Thus, a “workspace” is defined for each data source, leading to a total of four data intensive workspaces to support the investigation of a potential signal, i.e., the OpenFDA workspace enabling the interaction with ICSR data collected via FAERS, the OHDSI workspace enabling the use of data available in OMOP-CDM format, the PubMed workspace for the investigation of scientific publications and the Twitter workspace for social media posts.
• Step a.3: Reporting
A summary report is produced, containing the results of the analysis conducted in the various workspaces, including relevant figures, data tables and potential notes.
• Step 1: Definition of investigation scenario
The “individual case management” pathway begins with the definition of the relevant DEC (step 1 is common between pathway A and pathway B).
• Step b.2: Questionnaire answering
The user answers the “Liverpool algorithm” questions to evaluate a potential ADR on an individual case basis18 (see walkthrough of platform in the Supplementary Figures S8A–C). These questions focus on the adverse response and its relation with drug administration pattern, e.g. a question related with the “dechallenge” process is “Did the event improve when the drug was stopped or dose reduced?”.
• Step b.3: Individual case hint
The system provides a hint regarding whether this case refers to an adverse reaction or not, based on the outcome of the “Liverpool algorithm” (Gallagher et al., 2011).
In order to identify gaps and potential benefits of the presented system in real-world settings, a comparative study was conducted, aiming to compare the presented platform and the EVDAS system provided by the EMA.
EVDAS (EudraVigilance Data Warehouse and Analysis System) is an online service provided by EMA to facilitate the analysis over the ICSRs collected at a European level, providing access to various reports displaying data in different formats, tables and graphs. Typically, data outputs are aggregated but EVDAS also provides the ability to review details of individual case reports. As a whole, EVDAS provides analytics tools comparable to the ones built in the PVClinical platform in terms of ICSR data analysis (e.g., identify reports related with the drug-event combination in question, drill down to the submitted ICSR per se etc.). On the other hand, the two environments also differ quite significantly regarding the provided analytics, for example the EVDAS platform does not provide view for dynamic PRR or CPA. Finally, it should be noted that EVDAS only focuses on ICSRs and does not include any other kind of data sources.
The comparative study was conducted by the “Signal Management Team (SMT)” of a Contract Research Organization (CRO) acting as a subcontractor to support PV activities. The SMT comprised of a total of 4 PV professionals conducting the study during a 2-month period. Based on the Standard Operating Procedures (SOPs) related with PV signal management, three investigation scenarios, i.e., case studies were created and implemented: (a) The first scenario focused on a commonly known adverse event presented during the use of an active substance for the treatment of a chronic disease, during a 6-monthly period (b) the second scenario investigated reports associated with an adverse event (AE) presented during the use of an advanced therapy medicinal product, during a 6-monthly period, and (c) the third scenario concentrated on an already identified, by the EMA Pharmacovigilance Risk Assessment Committee (PRAC), signal associated with an active substance.
The assessment started by exploring EVDAS and continued with the newly developed platform in the context of the PVClinical project. CERTH’s team provided the SMT with the study validation protocol and questionnaire, aiming to assess the platform’s perceived usability and user-satisfaction. The steps of the investigation process can be summarized as follows:
- Examination of the FDA ICSRs for potential duplicates and the identification of potentially incomplete reports
- Thorough review of the related FDA ICSRs (narrative, medical history, age, concomitants)
- Comparison of the literature data collected from PubMed a) through the dedicated literature workspace of PVClinical platform and b) the SMT’s own check of the literature on the PubMed website
- Thorough evaluation of the relevant literature data regarding the signal-at-hand
- Detailed review and evaluation of the EVDAS ICSRs (with the exception of scenario #3 that is an already validated signal)
- Completion of the signal reporting form with the signaling results, according to the internal SOPs of the CRO
- Completion of the comparative questionnaire (see Supplementary Material Table S1). The comparative questionnaire is comprised of preferential ratings with a 7-rating scale (strongly prefer currently available tools, prefer, slightly prefer, prefer both equally, slightly prefer, prefer, strongly prefer PVClinical platform) based on specific factors; those factors are:
o complexity,
o optimal time,
o confidence of decision,
o perceived data quality,
o user experience, and
o overall preference.
- Comprehensive report containing the results and conclusions with regards to the platform’s validity, accessibility and usability.
Notably, each scenario’s results were further evaluated by the SMT if presenting ROR larger than 1, in at least one of the two platforms. Finally, the SMT provided detailed tables of the effort (hours) for each platform in order to assess the impact of PVClinical platform in reducing the investigation time burden.
In this section, the end-users’ evaluation results are presented. It should be noted that as there were no real-world OMOP-CDM data available to be used during the evaluation process, the evaluation of the OHDSI workspace was considered to be out of scope for this paper19.
In Table 1 we present the answers to the comparative questionnaire for each scenario.
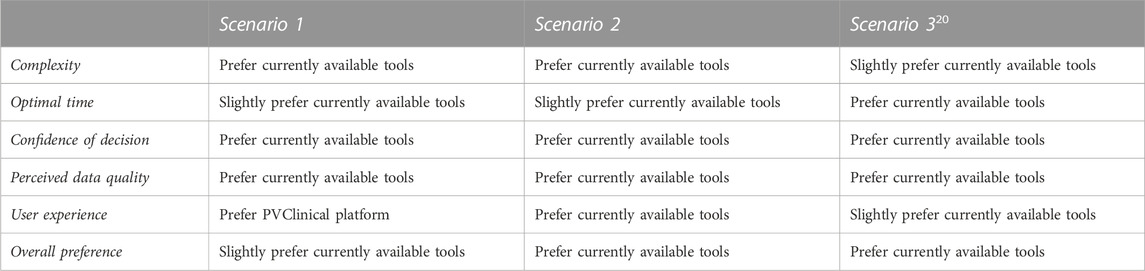
Table 1. Results of the comparison questionnaire.
In Table 2 we present the overall evaluation of the compared tools and the relevant PVClinical platform’s workspaces after their use in the context of the CRO’s SOPs.

Table 2. Performance of each approach based on the CRO’s SOPs.
In Table 3 below we present the effort distribution as time spent per task per scenario.
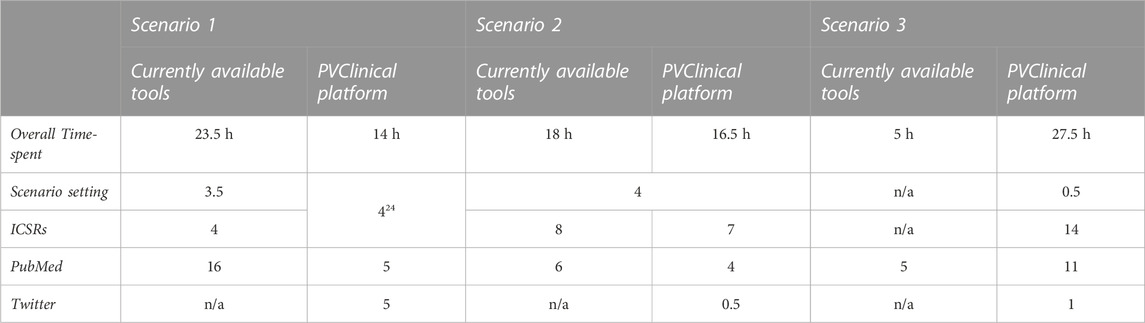
Table 3. Effort distribution per task, scenario and platform (Hours dedicated by SMT).
As a whole, based on discussions with the PV professionals they clearly prefer the use of EVDAS and the tools they currently use, mostly due to technical issues. However, they have also clearly acknowledged the additional capabilities of the presented platform, and reported, that they would happily migrate to it, as long as it is more technically mature and complimented with necessary educational material/training courses. In this section a summary of the strengths and weaknesses identified for each workspace is presented.
The end users clearly acknowledged the value of using FAERS data in their evaluation process. Even though PV regulation in Europe emphasizes on the need to exploit EudraVigilance data (and not data by FDA), still, FDA is an important and very credible organization and thus, the end users highly value the integration of these data in their PV signal management pipeline.
Moreover, the user interface of the OpenFDA workspace was relatively well accepted as it provides analytics comparable to the ones provided by EVDAS.
However, given that the SMT team is used to work with the EVDAS analytics (graphs etc.), sometimes they seemed overwhelmed by the new graphs and the additional statistical metrics available in the OpenFDA workspace. The issue of whether extra analytics can be perceived as a strength (partially it was), or as a weakness/barrier for the overall acceptance is an issue open to interpretation.
In terms of data management, the fact that OpenFDA publicly releases the data with delay, does not allow the system to retrieve the most recent information which is necessary for PV professionals to detect and further validate a potential signal.
Finally, some technical bugs and the need for more technical maturity were also pointed out. For example, the SMT reported their inability to identify and easily retrieve the ICSRs in some cases.
Twitter was very positively accepted by the SMT. The end-users generally agreed that social media data could provide a valuable complementary data source to support PV signal management and the user interface was also positively accepted. The end-users also suggested that beyond the mentions of potential ADRs by citizens/patients, the retweets of relevant scientific literature could also highlight influential literature.
There are no established statistical metrics widely used to quantify the impact of social media posts and thus, it is not clear how these data could be used in a quantifiable manner as part of the overall PV management processes.
The number of citations retrieved during the search through PVClinical platform was significantly larger compared to the results of the simple search via PubMed web interface, also providing scientific papers which were evaluated as “important” for the overall signal analysis process and had been missed via manual search. This could be attributed to the query expansion mechanism using the synonyms produced via the Knowledge Graph. For example, for the first scenario/DEC evaluated in the comparative study, 303 papers were retrieved via direct/manual search and 392 papers were retrieved via the use of the PVClinical platform. Out of the extra papers identified via the PVClinical platform, at least two of them were evaluated as important for the overall signal evaluation process.
While having more results could be considered beneficiary for the overall signal management approach, still the SMT noted that it also required more time to analyze the extra findings. Furthermore, the SMT reported slow response times while retrieving PubMed papers due to technical issues.
As RWD and other emerging data sources have been widely identified as a key data source able to feed the vision of a “Learning Healthcare System”, enabling quicker and richer decision making processes in the clinical context and beyond (Friedman et al., 2015; Dash et al., 2022), they could also play a key-role in terms of pharmacovigilance. To this end, EMA has recently announced that it will update its regulatory activities to include RWD until 2025 (Arlett et al., 2021) and thus, integrating RWD in via software tools aiming to support drug safety activities emerges as a key feature.
Currently, the available commercial software tools aiming to support PV processes, including products from widely established industrial vendors (e.g., Oracle25, ArisGlobal26 etc.), do not support the integration of emerging data sources, like RWD. Similarly, the open (or almost open) tools aiming to support PV activities are built upon SRSs/ICSRs. EVDAS27 and OpenFDA28 are prominent examples and they come with the same limitation of not combining SRS data with RWD.
Adding more data sources beyond ICSRs has been identified as a useful feature as they could complementary support the PV signal management processes. However, the risk of overwhelming end-users with vast amounts of data which cannot be clearly interpreted has also been clearly identified.
Along the same lines, there is a need for clarifications on how these emerging data sources can be used as part of every-day PV signal management activities (e.g., reporting to regulatory organizations etc.) and a clear need for training for the respective PV professionals. Currently, even though the end-users are confident that these data sources could be useful, still, they are not really sure on how they could use them as part of their every-day practice.
A key methodological issue is the lack of widely accepted statistical measures regarding the use of RWD for PV. There is active research on how OMOP-CDM data can be used for PV purposes (Arnaud et al., 2017; Schuemie, 2011; Yu et al., 2019; Thurin et al., 2020), unsurprisingly exploiting disproportionality analysis approaches. However, as there is not yet a widely accepted approach on which methodology/statistical metrics should be used, the presented platform is using OMOP-CDM data in a rather generic manner, based on software components already built in the context of OHDSI initiative. Similarly, while social media have been widely elaborated, they are only able to support PV signal management in an ancillary manner (Caster et al., 2018) and thus, there are no widely accepted statistical metrics developed (yet).
In technical terms, data access is a crucial point. While OMOP-CDM can be an emerging de facto standard which could be used as a reference data model to integrate RWD, it is not yet a universally accepted data model. Furthermore, ICSR data access is also crucial. While EMA and WHO-UMC aggregate data from various sites all over the world, they are not openly available. The presented platform uses OpenFDA stack to access FAERS data which should be commended for their free access provision, but still, the data provided are available in a quarterly fashion—published in 3 months bulks—, leading to a significant delay “window”. The fact that OpenFDA publicly releases the data with delay, does not allow PVClinical platform to retrieve current information which is necessary for professionals to detect and further validate a potential signal. Regarding the semantic annotation of raw data, it is also acknowledged that sophisticated NLP pipelines could also improve the overall process.
The presented platform was planned to reach Technological Readiness Level 529 in the context of the PVClinical project. Thus, there are various technical, methodological and also usability issues which could be further elaborated and these issues could be considered to hinder end user acceptance as a whole. Integrating “intelligent” or data intensive tools in the healthcare context is far from trivial (Li et al., 2020) and to this end, some crucial aspects and challenges regarding the acceptance of such tools for drug safety operations were already identified during the project’s design phase (Gavriilidis et al., 2021).
Finally, regarding the pilot approach there are some limitations worth to be mentioned. The end-users participating on the pilot test were project partners and this could have influenced their judgement as they cannot be considered “independent”. Furthermore, the use of synthetic data could be identified as a potential limitation. In the context of the PVClinical project, real EHR data have also been converted to OMOP-CDM to showcase the feasibility of the process. However, since the project’s goal was to provide a technical platform and not to conduct a PV study, these “real” data were not used during the pilot phase of the project, also in order to avoid legal and administrative implications.
To the best of our knowledge, the presented platform is a novel open-source tool aiming to integrate ICSRs/SRS data, OMOP-CDM data, social media and scientific literature, enabling the use of these data sources in a unified manner to facilitate the identification and management of potential PV signals. The fact that this is published as an open-source platform, enables further collaborative development aligned with the principles of open research. Admittedly while the results of the comparative study depict the benefits that such tools could offer, a reluctance for their adoption is also highlighted, identifying the need to improve regarding technical maturity, user experience but also the need for further PV professionals’ education in terms of data science and its caveats.
As part of the future platform development plans, the investigation of potential alternative user interaction paradigms to enhance usability is a key goal. Moreover, the use of more AI/ML paradigms and the data space widening is actively explored. New potential data sources are also under investigation, including clinical trial data, aggregative PV signal reports produced by drug-safety organizations (e.g., via the OpenPVSignal model (Natsiavas et al., 2018)) and also lower-level biochemical information (e.g., pathway information). Furthermore, the integration of more sophisticated statistical approaches, especially regarding the evaluation of OMOP-CDM data to support PV signal management has also been outlined as a future work line. Finally, systematic validation of the platform, both regarding of technical robustness but also in terms of its integration in PV operational processes is also planned.
Publicly available datasets and data APIs were used in this study. This data can be found here: 1) FDA -FAERS Data: https://www.fda.gov/drugs/questions-and-answers-fdas-adverse-event-reporting-system-faers/fda-adverse-event-reporting-system-faers-public-dashboard 2) Twitter data: https://developer.twitter.com/en/docs/tutorials/consuming-streaming-data 3) SynPuf data: https://www.cms.gov/Research-Statistics-Data-and-Systems/Downloadable-Public-Use-Files/SynPUFs/DE_Syn_PUF 4) PubMed API: https://www.ncbi.nlm.nih.gov/pmc/tools/developers/.
VD was the lead software developer of the platform—he led the code authoring of the OMOP-CDM workspace, the reporting workspace and other platform features. SD has authored the code for the OpenFDA workspace and the PubMed workspace. AC contributed to the development of the OpenFDA workspace. GG is a pharmacologist who supported the design of the platform and also contributed to the design of the project pilot phase. CK authored the code of the Twitter workspace. PB led the comparative study process. PN conceived the idea of the platform, designed the software architecture, and coordinated the overall project. Finally, the authors would like to acknowledge the contribution of late Vassilis Koutkias in the project’s concept definition. All authors contributed to the article and approved the submitted version.
This research has been co-financed by the European Union and Greek national funds through the Operational Program Competitiveness, Entrepreneurship and Innovation, under the call RESEARCH—CREATE—INNOVATE (project code: Τ1EDK-03789).
The authors would like to acknowledge the insights provided by the members of the PVClinical project’s consortium during the project’s design and implementation phase and the contribution of the following PV professionals from Pharmassist Ltd., (https://www.pharmassist-cro.com/): Alexandra Falara, Dafni Karioti, Elena Polatidou and Georgios Ntelis. The authors would also like to acknowledge the use of Jonathan G. Levine’s openly available code as part of the OpenFDA workspace and the use of OHDSI community’s software stack as part of the OHDSI workspace.
The authors declare that the research was conducted in the absence of any commercial or financial relationships that could be construed as a potential conflict of interest.
All claims expressed in this article are solely those of the authors and do not necessarily represent those of their affiliated organizations, or those of the publisher, the editors and the reviewers. Any product that may be evaluated in this article, or claim that may be made by its manufacturer, is not guaranteed or endorsed by the publisher.
The Supplementary Material for this article can be found online at: https://www.frontiersin.org/articles/10.3389/fdsfr.2022.1016042/full#supplementary-material
ADR, Adverse Drug Reaction; AE, Adverse Event; API, Application Programming Interface; CPA, Change Point Analysis; CRO, Contract Research Organization; DA, Disproportionality Analysis; DEC, Drug Event Combination; EHR, Electronic Health Record; EVDAS, EudraVigilance Data Warehouse and Analysis System; FAERS, FDA Adverse Event Reporting System; FDA, Food and Drug Administration; HCP, Healthcare professional; ICSR, Individual Case Safety Report; MedDRA, Medical Dictionary for Regulatory Activities; NER, Named Entity Recognition; NLP, Natural Language Processing; OHDSI, Observational Health Data Sciences and Informatics; OMOP-CDM, Observational Medical Outcomes Partnership—Common Data Model; PRR, Proportional Reporting Ratio; PV, Pharmacovigilance; ROR, Reporting Odds Ratio; RWD, Real-World Data; SOP, Standard Operating Procedures; SMT, Signal Management Team; SRS, Spontaneous Reporting Systems; WHO-ATC, Anatomical Therapeutic Chemical classification system.
1The IMI WEB-RADR and WEB-RADR2 consortia include several regulatory and drug-safety focusing organizations, e.g., the United Kingdom Medicines and Healthcare products Regulatory Agency—MHRA, the WHO-UMC, the Spanish Agencia Espanola De Medicamentos Y Productos Sanitarios, the Croatian Agencija Za Lijekove I Medicinske Proizvode and the LAREB based in the Netherlands.
2https://www.fda.gov/safety/fdas-sentinel-initiative#:∼:textSentinel%20is%20the%20FDA's%20national,FDA%20launched%20the%20Sentinel%20Initiative.
3The PVClinical project’s web site: https://pvclinical-project.eu/.
4The GitHub code repository: https://github.com/inab-certh/PVClinical.
5A walkthrough of the PVClinical platform is available as supplementary material and a demonstration video can be found in https://youtu.be/BJB4OPlKmUM.
6DrugBank web site: https://go.drugbank.com/.
7WHO-ATC classification web site: https://www.who.int/tools/atc-ddd-toolkit/atc-classification.
8MedDRA terminology web site: https://www.meddra.org/.
9This Knowledge Graph is based on data which are not freely available but they come with specific usage licenses, i.e., MedDRA and DrugBank come with their own licenses. Thus, while the PVClinical platform’s source code is openly available, we selected to leave the Knowledge Graph out of the GitHub repository.
10https://bioportal.bioontology.org/.
11https://download.bio2rdf.org/files/release/3/drugbank/drugbank.html.
12The DrugBank raw data source includes information for ADRs based on the information provided in the drugs’ product labels/leaflets. However, this information was not used in our platform as our main use case was to facilitate PV signal elaboration and thus, already confirmed ADRs were considered out of scope. It should be clarified that DrugBank data integrated in our Knowledge Graph are not used as to provide information for ADRs but it is only used to facilitate in terms of synonym’s finding and query space expansion to facilitate the analysis of data sources which could be used to identify novel ADR signals, i.e., the data sources elaborated in the workspaces of the PVClinical platform
13ICSRs from FAERS are also available via the OpenFDA API. However, the OpenFDA API only supports specific kinds of requests/queries and thus, the solution of locally storing FAERS data was selected.
14The OHDSI initiative web site: https://www.ohdsi.org/.
15An open-source repository of web apps developed to support the analysis of OpenFDA data: https://github.com/jonathanglevine/openfdashinyapps.
16A lot of these statistical approaches were implemented in the respective code provided directly by Jonathan G. Levine’s openly available source code https://github.com/jonathanglevine/openfdashinyapps.
17The Book of OHDSI https://ohdsi.github.io/TheBookOfOhdsi/.
18The Liverpool algorithm acts conditionally, applying an “if-then-else” rationale, guiding the end-user among questions based on his/her previous answer(s). The exact navigation path, the number of the questions finally answered and the outcome of the algorithm depends on the answers given on each step.
19Real hospital data have been converted to OMOP-CDM in the context of the project to evaluate the feasibility of the presented platform. However, as these data are sensitive, they could not be shared with out-of-hospital end-users due to legal and ethical barriers, and thus, they were not used during the evaluation of the system by the SMT’s PV professionals.
20The scenario of this study is “Alemtuzumab and Cytomegalovirus”, which is an already identified signal according to the European Medicines Agency (EMA) Pharmacovigilance Risk Assessment Committee (PRAC).
21Since Scenario’s 3 focuses on an already identified signal Pharmacovigilance Risk Assessment Committee (PRAC), only the PVClinical platform was used.
22As already explained in the manuscript, the comparison study was built upon the SOPs applied in the specific CRO. Based on these SOPs, they periodically evaluate potential signals taking into account the ICSRs of the last 6 months. In the time when the comparative study was conducted (late 2021) there were no data available for the two scenarios via the FDA XML downloads.
23308 reports reviewed (out of a total of 449) due to a technical system error. In 69 reports Alemtuzumab was not identified as a suspect drug, while in 239 reports (out of 308) a causal association between the drug and the adverse reaction was identified.
24Merged cells occur when the SMT did not partitioned clearly the time spent based on the corresponding categories on the table
25https://www.oracle.com/industries/life-sciences/pharmacovigilance/.
26https://www.arisglobal.com/lifesphere/fda-drug-safety-solution/?utm_source=pardot&utm_medium=email&utm_campaign=AGMKT-24&utm_content=button.
27https://www.ema.europa.eu/en/human-regulatory/research-development/pharmacovigilance/eudravigilance/eudravigilance-system-overview.
29Technological Readiness Level defintion: https://ec.europa.eu/research/participants/data/ref/h2020/wp/2014_2015/annexes/h2020-wp1415-annex-g-trl_en.pdf.
Arlett, P., Kjaer, J., Broich, K., and Cooke, E. (2021). Real-world evidence in EU medicines regulation: Enabling use and establishing value. Clin Pharmacol Ther. 7 (7), 681–695. doi:10.1002/cpt.2479
Arnaud, M., Bégaud, B., Thurin, N., Moore, N., Pariente, A., and Salvo, F. (2017). Methods for safety signal detection in healthcare databases: A literature review. Expert Opin. Drug Saf. 16, 721–732. doi:10.1080/14740338.2017.1325463
Aspinall, S. L., Vu, M., Moore, V., Jiang, R., Au, A., Bounthavong, M., et al. (2022). Estimated costs of severe adverse drug reactions resulting in hospitalization in the veterans health administration. JAMA Netw. Open 5 (2), e2147909. doi:10.1001/jamanetworkopen.2021.47909
Ball, R., and Gerald, D. P., (2022). Artificial intelligence” for pharmacovigilance: Ready for prime time?. Drug Saf. 45, 429–438. doi:10.1007/s40264-022-01157-4
Bate, A., and Hobbiger, S. F. (2020). Artificial intelligence, real-world automation and the safety of medicines. Drug Saf. 14, 1–8. doi:10.1007/s40264-020-01001-7
Callahan, A., Cruz-Toledo, J., and Dumontier, M. (2013). Ontology-based querying with Bio2RDF’s linked open data. J Biomed Semantics 4 (1), S1. doi:10.1186/2041-1480-4-S1-S1
Caster, O., Dietrich, J., Kürzinger, M-L., Lerch, M., Maskell, S., Norén, G. N., et al. (2018). Assessment of the utility of social media for broad-ranging statistical signal detection in pharmacovigilance: Results from the WEB-RADR project. Drug Saf., 1–15. doi:10.1007/s40264-018-0699-2
Council for International Organizations of Medical Sciences, (2010). Practical aspects of signal detection in pharmacovigilance report of CIOMS working group, VIII. Geneva, Switzerland: CIOMS. isbn: 9290360828.
Dash, D., Gokhale, A., Patel, B. S., Callahan, A., Posada, J., Krishnan, G., et al. (2022). Building a learning health system: Creating an analytical workflow for evidence generation to inform institutional clinical care guidelines. Appl Clin Inform 13 (1), 315–21. doi:10.1055/s-0042-1743241
Dimitriadis, V. K., Gavriilidis, G. I., and Natsiavas, P. (2021). Pharmacovigilance and clinical environment: Utilizing OMOP-CDM and OHDSI software stack to integrate EHR data. Public Heal Inf. Proc. MIE 281, 555–559. doi:10.3233/SHTI210232
European Medicines Agency (EMA), (2022). Data analysis and real world interrogation network (Darwin EU). Amsterdam, Netherlands: European Medicines Agency. https://www.ema.europa.eu/en/about-us/how-we-work/big-data/data-analysis-real-worldinterrogation-network-darwin-eu.
European Medicines Agency (EMA), (2022). Erasmus MC contracted to establish DARWIN EU® Coordination. Amsterdam, Netherlands: Centre for the European Medicines Agency. https://www.ema.europa.eu/en/news/initiation-darwin-eurcoordination-centre-advances-integration-real-world-evidence-assessment.
Evans, S. J, Waller, P. C, and Davis, S. (2001). Use of proportional reporting ratios (PRRs) for signal generation from spontaneous adverse drug reaction reports. Pharmacoepidemiol Drug Saf. 10 (6), 483–486. doi:10.1002/pds.677
Food and Drug Administration (FDA), (2022). FDA adverse event reporting system (FAERS) public dashboard. Silver Spring, Maryland, United States: FDAhttps://www.fda.gov/drugs/questions-and-answers-fdas-adverse-event-reporting-system-faers/fdaadverse-event-reporting-system-faers-public-dashboard.
Formica, D., Sultana, J., Cutroneo, P. M., Lucchesi, S., Angelica, R., Crisafulli, S., et al. (2018). The economic burden of preventable adverse drug reactions: A systematic review of observational studies. Expert Opin. Drug Saf. 17 (7), 681–695. doi:10.1080/14740338.2018.1491547
Friedman, C. P., Rubin, J., Brown, J., Buntin, M., Corn, M., Etheredge, L., et al. (2015). Toward a science of learning systems: A research agenda for the high-functioning learning health system. J. Am. Med. Inf. Assoc. 22 (1), 43–50. doi:10.1136/amiajnl-2014-002977
Gallagher, R. M., Kirkham, J. J., Mason, J. R., Bird, K. A., Williamson, P. R., Nunn, A. J., et al. (2011). Development and inter-rater reliability of the Liverpool adverse drug reaction causality assessment tool. PLoS One. 6 (12), 28096. doi:10.1371/journal.pone.0028096
Gavriilidis, G. I., Dimitriadis, V. K., Jaulent, M. C., and Natsiavas, P. (2021). Identifying actionability as a key factor for the adoption of ‘intelligent’ systems for drug safety: Lessons learned from a user-centred design approach. Drug Saf. 44 (11), 1165. doi:10.1007/s40264-021-01103-w
Harpaz, R., DuMouchel, W., Schuemie, M., Bodenreider, O., Friedman, C., Horvitz, E., et al. (2017). Toward multimodal signal detection of adverse drug reactions. J. Biomed. Inf. 76, 41–49. doi:10.1016/j.jbi.2017.10.013
Harpaz, R., Vilar, S., Dumouchel, W., Salmasian, H., Haerian, K., Shah, N. H., et al. (2013). Combing signals from spontaneous reports and electronic health records for detection of adverse drug reactions. J. Am. Med. Inf. Assoc. 20, 413–419. doi:10.1136/amiajnl-2012-000930
Hussain, R. (2021). Big data, medicines safety and pharmacovigilance. J. Pharm. Policy Pract. 14 (1), 48–50. doi:10.1186/s40545-021-00329-4
Imran, M., Bhatti, A., King, D. M., Lerch, M., Dietrich, J., Doron, G., et al. (2022). Supervised machine learning-based decision support for signal validation classification. Drug Saf 45 (5), 583. doi:10.1007/s40264-022-01159-2
Kakalou, C., Dimitsaki, S., Dimitriadis, V. K., and Natsiavas, P. (2022). Exploiting social media for active pharmacovigilance: The PVClinical social media workspace. Stud Health Technol Inform 290, 739–743. doi:10.3233/SHTI22017610.3233/SHTI220176
Knowledge Base workgroup of the Observational Health Data Sciences and Informatics (OHDSI) collaborative (2017). Large-scale adverse effects related to treatment evidence standardization (LAERTES): An open scalable system for linking pharmacovigilance evidence sources with clinical data. J. Biomed. Semant. 8(1):11. doi:10.1186/s13326-017-0115-3
Lee, J-E., Hwan Kim, J., Bae, J-H., Song, I., and Shin, J-Y. (2022). Detecting early safety signals of infliximab using machine learning algorithms in the Korea adverse event reporting system. Sci Reports 12. doi:10.1038/s41598-022-18522-z
Li, R. C., Asch, S. M., and Shah, N. H. (2020). Developing a delivery science for artificial intelligence in healthcare. NPJ Digit. Med. 3 (1), 107. doi:10.1038/s41746-020-00318-y
Li, Y., Salmasian, H., Vilar, S., Chase, H., Friedman, C., and Wei, Y. (2014). A method for controlling complex confounding effects in the detection of adverse drug reactions using electronic health records. J. Am. Med. Inf. Assoc. 21, 308–314. doi:10.1136/amiajnl-2013-001718
Lindquist, M. (2008). VigiBase, the WHO global ICSR database system: Basic facts. Drug Inf. J. 42 (5), 409–419. doi:10.1177/009286150804200501
Natsiavas, P., Boyce, R. D., Jaulent, M-C., and Koutkias, V. (2018). OpenPVSignal: Advancing information search, sharing and reuse on pharmacovigilance signals via FAIR principles and semantic web technologies. Front Pharmacol 9, 609. doi:10.3389/fphar.2018.00609/full
Natsiavas, P., Gavriilidis, G., Linardaki, Z., Kolangi, G., Gkaliagkousi, E., Zamboulis, C., et al. (2020). Supporting active pharmacovigilance via IT tools in the clinical setting and beyond: Regulatory and management aspects Studies in health technology and informatics. Amsterdam, Netherlands: IOS Press. doi:10.3233/SHTI200565
Natsiavas, P., Jaulent, M-C., and Koutkias, V. (2019). A knowledge-based platform for assessing potential adverse drug reactions at the point of care: User requirements and design. Studies in health technology and informatics 264, 1007–1011. doi:10.3233/SHTI190376
Natsiavas, P., Malousi, A., Bousquet, C., Jaulent, M-C., and Koutkias, V. (2019). Computational advances in drug safety: Systematic and mapping review of knowledge engineering based approaches. Front Pharmacol 10, 415. doi:10.3389/fphar.2019.00415/full
Pacurariu, A. C., Straus, S. M., Trifirò, G., Schuemie, M. J., Gini, R., Herings, R., et al. (2015). Useful interplay between spontaneous ADR reports and electronic healthcare records in signal detection. Drug Saf 38 (12), 1201–1210. doi:10.1007/s40264-015-0341-5
Rothman, K. J., Lanes, S., and Sacks, S. T. (2004). The reporting odds ratio and its advantages over the proportional reporting ratio. Pharmacoepidemiol Drug Saf 13 (8), 519–523. doi:10.1002/pds.1001
Salvadores, M., Alexander, P. R., Musen, M. A., and Noy, N. F. (2013). BioPortal as a dataset of linked biomedical ontologies and terminologies in RDF. Semant. Web 4 (3), 277–284. doi:10.3233/sw-2012-0086
Schuemie, M. J. (2011). Methods for drug safety signal detection in longitudinal observational databases: LGPS and LEOPARD. Pharmacoepidemiol Drug Saf 20 (3), 292–299. doi:10.1002/pds.2051
Tavares-Da-Silva, F., Mahaux, O., Van Holle, L., Haguinet, F., Seifert, H., and Stegmann, J. U. (2020). Post-marketing safety surveillance for the adjuvanted recombinant zoster vaccine: Methodology. Drug Saf. 43 (12), 1223–1234. doi:10.1007/s40264-020-00989-2
Thurin, N. H., Lassalle, R., Schuemie, M., Pénichon, M., Gagne, J. J., Rassen, J. A., et al. (2020). Empirical assessment of case-based methods for drug safety alert identification in the French National Healthcare System database (SNDS): Methodology of the ALCAPONE project. Pharmacoepidemiol. Drug Saf 29 (9), 993–1000. doi:10.1002/pds.4983
Trifirò, G., Sultana, J., and Bate, A. (2018). From big data to smart data for pharmacovigilance: The role of healthcare databases and other emerging sources. Drug Saf. 41 (2), 143–149. doi:10.1007/s40264-017-0592-4
Wishart, D. S., Feunang, Y. D., Guo, A. C., Lo, E. J., Marcu, A., Grant, J. R., et al. (2018). DrugBank 5.0: A major update to the DrugBank database for 2018. Nucleic Acids Res 46 (1), 1074–1082. doi:10.1093/nar/gkx1037
Wong, J., Prieto-Alhambra, D., Rijnbeek, P. R., Desai, R. J., Reps, J. M., and Toh, S. (2022). Applying machine learning in distributed data networks for pharmacoepidemiologic and pharmacovigilance studies: Opportunities, challenges, and considerations. Drug Saf 45 (5), 493. doi:10.1007/s40264-022-01158-3
World Health Organization, (2002). The importance of pharmacovogilance: Safety monitoring of medicinal products. Geneva, Switzerland: World Health Organization.
Xu, Z., Kass-Hout, T., Anderson-Smits, C., and Gray, G. (2015). Signal detection using change point analysis in postmarket surveillancePharmacoepidemiol Drug. Saf. 24 (6), 663–668. doi:10.1002/pds.3783
Keywords: active pharmacovigilance, real-world data, data integration, comparative study, signal management
Citation: Dimitriadis VK, Dimitsaki S, Chytas A, Gavriilidis GI, Kakalou C, Bonotis P and Natsiavas P (2023) An open-source platform integrating emerging data sources to support multi-modal active pharmacovigilance. Front. Drug Saf. Regul. 2:1016042. doi: 10.3389/fdsfr.2022.1016042
Received: 10 August 2022; Accepted: 22 December 2022;
Published: 19 January 2023.
Edited by:
G. Niklas Norén, Uppsala Monitoring Centre, SwedenReviewed by:
Rave Harpaz, Oracle, United StatesCopyright © 2023 Dimitriadis, Dimitsaki, Chytas, Gavriilidis, Kakalou, Bonotis and Natsiavas. This is an open-access article distributed under the terms of the Creative Commons Attribution License (CC BY). The use, distribution or reproduction in other forums is permitted, provided the original author(s) and the copyright owner(s) are credited and that the original publication in this journal is cited, in accordance with accepted academic practice. No use, distribution or reproduction is permitted which does not comply with these terms.
*Correspondence: Pantelis Natsiavas, cG5hdHNpYXZhc0BjZXJ0aC5ncg==
Disclaimer: All claims expressed in this article are solely those of the authors and do not necessarily represent those of their affiliated organizations, or those of the publisher, the editors and the reviewers. Any product that may be evaluated in this article or claim that may be made by its manufacturer is not guaranteed or endorsed by the publisher.
Research integrity at Frontiers
Learn more about the work of our research integrity team to safeguard the quality of each article we publish.