 Oliver Nakoinz
 Michael Bilger
 David Matzig
- Institut für Ur- und Frühgeschichte, Christian-Albrechts-Universität, Kiel, Germany
In the past numerous concepts of urbanity have been discussed and a variety of criteria for towns have been developed. They include size, population, legal aspects, way of life, structural and functional approaches. However, since the mentioned criteria cover only a part of the phenomenon and partly use fixed and arbitrary thresholds, they are not sufficient for analysis. We turn to an understanding of urbanity as a process that creates and shapes the scenery of the buildings and people and that is mainly driven by complexity. In this sense, we understand urbanity as a process of adaptation to changing conditions or contexts in a complex settlement system, which is triggered by size, attracted by exemplary solutions and characterized by the emergence of new structures. In this paper we address the issue of relative centrality as proposed by Christaller in the urbanity process as well as centrality within a network sciences approach. Our aim is to interweave different concepts of urbanity, centrality, interaction and connectivity, combining different concepts and research traditions as well as expanding them, resulting in a collection of different terminological frameworks. In the context of adaptation, urbanity is relative in the sense that different places may have gained better or worse adaptation under different conditions. The urbanity process is always shaped by the threat of too much complexity and too little connectivity. Above all, it is a certain surplus of connectivity that characterizes urbanity. This surplus is mapped by the variant of centrality proposed by Christaller. While Christaller's models can be transferred into network sciences frameworks, Christaller does not offer an adequate centrality measure. Therefore, his concept of centrality cannot be transferred correctly without being translated carefully into the network research context. In this article, we argue why this is necessary and explain how it can be done. In this paper the above concept will be applied to the Early Iron Age Princely Seats with a special focus on the Heuneburg. In order to represent similarities and interaction between different nodes a very limited part of the material culture can be used. For this purpose we use fibulae which allow for fairly accurate dating and hence ensure a narrow time slice for the network analysis. Using Fibulae the research will be limited to a certain social segment, which we refer to as “middle class.” This paper is intended to deal with the rather complex issue of urbanity using more simple approaches such as network analysis. In this context, we pursue a tight integration of theory and methodology and we consider certain conceptual issues. This paper has two main results. Firstly, we develop a consistent approach in order to apply social network centrality measures on geographical networks. Secondly, we will analyse which role the above mentioned middle class played in the course of urbanity processes.
1. Introduction
One of the reasons for the emergence of cities is the structural advantage of central places. Interpreting towns as central places allows us to explain the location of many towns and pre-urban settlements. Despite the fact that there are numerous publications on urbanity and centrality, the theoretical foundation for the combination of these two main concepts appears to be rather weak. This paper attempts to explore the relationship between the two concepts as well as between the two and other concepts. The keywords which will be addressed in the theoretical part of this paper are urbanity and centrality, the aforementioned main concepts, as well as complexity, connectivity, and interaction. We show that the main concepts are closely linked, which reveals new facets regarding the other keywords. Theoretical concepts have a significant impact on methodology. According to our understanding of urbanity and centrality in the light of complexity and connectivity, some changes in the methodology for the estimation of centrality in geographical networks are required. These changes have been directly applied in a case study on Early Iron Age and concern the concepts for the integration of network centrality (cf. Taylor et al., 2010) and Christaller centrality (cf. Christaller, 1933). Since the methodology is now completely covered by theory, these changes lead to a substantial surplus in the interpretations.
This paper mainly focusses on the so-called Early Iron Age Princely Seats (Kimmig, 1969; Krausse, 2008) which are central to the discourse on early urbanization. The Princely Seats are characterized, among other things, by Mediterranean imports, fortifications and rich graves. Some scholars consider these sites to be the 'first towns north of the Alps' (Krausse et al., 2016) while others do not use as many exciting superlatives and buzzwords when referring to them, but focus more on complicated relationships and processes (Stoddart, 2017). Perhaps the question whether princely seats are towns or not is not of any greater importance. Regarding the knowledge of both the social and economic circumstances at that time the question which processes took place in the context of what we call early urbanization is more crucial. This paper aims to contribute to the clarification of this question based on research done in South-West Germany (Figure 1). Our main objective is to explore the role of people in urbanity processes who were not part of the power elite. We decided to use fibulae as an artifact type, as they play a significant role in terms of chronology and in some way are related to the social fraction that we refer to as middle class due to the absence of a more suitable term. Although, fibulae also appear in elite graves, the majority of the fibulae can be attributed to moderate social ranks.
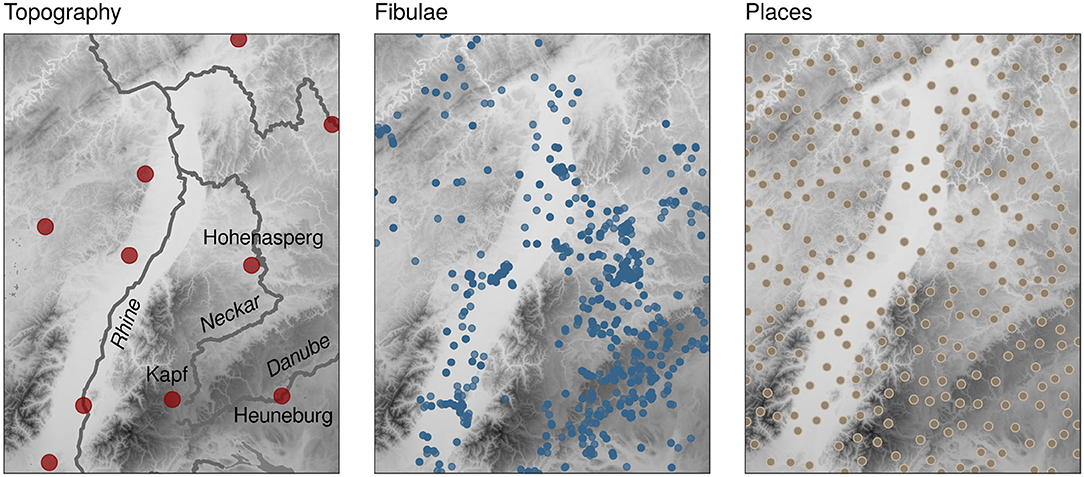
Figure 1. Area of interest. Left: rivers and Princely Seats; Center: Fibulae; Right: simulated site locations and locations of Princely Seats.
2. Theoretical Background
In this section we take a closer look at urbanity and then go into more detail with the discussion of some keywords such as complexity and centrality. In this context, we apply a hermeneutic approach starting with the investigation of certain aspects of the respective terms and looking at their relationship, which is followed by investigating the next set of aspects building on top of the already made relationships. Using this approach we may not be able to avoid redundancies, but it seems to be the most suitable one to clarify the relationship of the tightly connected concepts.
2.1. Concepts of Urbanity
In the literature of different disciplines numerous concepts of urbanity are known. Covering all of them would exceed the scope of this paper. However, some of the concepts need to be addressed (Nakoinz, 2017b). First, we would like to mention the large number of quantitative approaches including legal issues and lifestyle aspects. Towns can be defined as places which have a so-called town law. The town law regulates the behavior of the people who live in that town or toward the surroundings. The medieval town law of Schleswig (Hasse, 1880) is an example which shows that in towns many aspects of daily life require proper regulation, which is not the case for villages. That difference is important, even though the required written sources are not available for prehistory. By introducing laws, rules become institutional and it is obviously the existence of these institutions which is important for towns. Another important qualitative aspect is the specific lifestyle of people living in towns (Wirth, 1938). One example is the increasing anonymity in towns, which is characterized by a lack of economic and to some extend even social interaction between individuals. Two further aspects worth to be mentioned are specialization and social mobility. The dynamic life in towns is another important aspect which, however, is difficult to specify. Our idea of a proper town is a place in which every day comes with some new ideas, events, information and opportunities, rather than a place in which everyday life is characterized by uniformity. While some qualitative aspects are clearly related to the size and complexity of a place, elements of a urban lifestyle can also be found in rural settlements (Gans, 1962). Therefore, many qualitative aspects can be described as symptoms of urbanity, rather than being the main or even diagnostic features of urbanity.
Now, we can turn to the more simple quantitative approaches. Eurostat for instance (Eurostat, 2018) uses a threshold of 5,000 inhabitants to define places as towns. However, this approach appears to be problematic, because that way the boundaries of a place could simply be moved further and further to reach a certain threshold. Aggregating several villages to a unit of 5,000 inhabitants is certainly not the same as a densely occupied place with 5,000 inhabitants. Density defined as population by size can be used to overcome some of these problems. Eurostat (2018) defines a density threshold of 300 people per square kilometre (ppskm) and Demographia (2015) uses a value of 400 ppskm. This approach, however, is still not convincing, since the thresholds are arbitrarily determined and hence the classification is rendered meaningless. Instead of such arbitrary numbers, Roland Flechter's calculations on settlement growth could be of help (Fletcher, 1995). It has been shown that official population thresholds in different countries range between 200 and 50,000 inhabitants (Deuskar, 2015), which makes it impossible to compare cities around the world. A more convincing and popular group of approaches is based on economic functions (Smith, 1989). Although archaeological indicators are even more problematic, this functional approach provides a better insight into the mechanisms of urbanism. Towns have less agriculture and a larger craft and service sector than rural villages. Furthermore, they show a certain degree of division of labor. On the one hand, a specialization takes place which leads to a local division of labor. This means that each craftsman is responsible for a different step in the chaîne opératoire and delivers the semi-finished product to the next expert. On the other hand, there is some kind of geographical division of labor. Towns appear to be consumer sites regarding agricultural products, while producer sites can be seen as consumer sites using craft ware. The division of labor eventually leads to more interaction with other people as well as an increasing dependency on them.
The division of labor leads directly to the structural approaches that focus on the relationship between places and people. Centrality concepts are the most important instance of structural approaches. The term central place was developed by Christaller (1933), in order to circumvent the complex discussion of urbanity. However, the term itself turned out to be complex being loaded with baggage from different disciplines, such as legal and historical approaches. Christaller's idea was to use formal characteristics to explain why places in certain locations have a certain size. He found that the size of a place depends, among other things, on its relationship to other places. Therefore, he isolated this relational aspect as centrality. According to Christaller, centrality is defined as the relative importance of a place (we prefer to translate “Bedeutung” rather with “importance” than “meaning.” However, size and importance of a place are not identical. Christaller defined a central place as a place that has a certain surplus of importance compared to the importance it would have if it had the same size, but no connection to other places. Obviously the idea behind this is that there might be places with many people. However, if these people did not interact with people from other places, the said place would be of no relevance. Christaller hence defined centrality as mentioned above. The importance in this case is provided by central functions such as production, administration and trade with other places. From an urban point of view, centrality is an important aspect of urbanity. Nevertheless, it does not cover all aspects of urbanity. Even small and isolated places can have a certain degree of urban lifestyle. However, we assume that in general towns can be considered as central places. In addition to the definition of centrality and an empirical case study, Christaller presented different models that demonstrate how places obtain a certain degree of centrality. The models are straightforward and based on the assumption of transport cost minimization. This means that people try to minimize their transport costs and hence go for the nearest possible place for supplies. It results in the emergence of well-distinguished, so-called complementary areas for each central place that will be supplied.
There are further aspects of Christaller's centrality model and a lot of literature on central place theory. For more details refer to Knitter and Nakoinz (2018) and Nakoinz (2019). Instead of going too much into detail now, we turn to another concept of centrality, which has been derived from social network theory (Freeman, 1978). This type of centrality refers to the strategic location of a place within a network, rather than the place gaining importance by supplying certain areas with goods and services. In this context, a network center for example plays a significant role, as it guides the interaction between different places.
By taking a little step back we might observe that both approaches look at different organizational structures. Since every place has a certain degree of both Christaller centrality and network centrality, these two organizational structures are complementary. A combination of the two approaches seemed appropriate and was developed during the previous decade (Nakoinz, 2012, 2013, 2019; Knitter and Nakoinz, 2018). First of all, we should follow the two traditional approaches and define centrality as a relative concentration of interactions. Subsequently, we are able to define different models including the Christaller model and the network model. For more details please refer to Nakoinz (2019), where an extensive discussion of the topic is provided. In this paper we will focus on a specific aspect of the integrated approach, which is highly relevant for the urbanity discourse and which has important methodological implications. First, however, we make a small excursus looking at the different paradigms involved.
In archaeology, network approaches are supposed to replace the old paradigm of cultural, ethnic, and other groups. They have their focus explicitly on relationships and therefore are closely intertwined with modern research topics. And although they have entered the archaeological world only recently, they have a long history of research and two completely different and independent roots. In this context, we first need to mention geographical or spatial networks with a research tradition going back to the 19th century. In the course of New Geography in the 1960s and 1970s geographical networks became particularly important (Haggett and Chorley, 1969) and played a crucial role in transport geography as well (Taaffe and Gauthier, 1973; Prignano et al., 2019). In comparison, the social network tradition goes back to the 1930s and it experienced great success at the same time as the geographical network tradition (Scott, 2000; Freeman, 2004). The said period is called “Harvard Break Through” (Raab, 2010). Both traditions are part of the quantitative revolution of the 1960s. Today, both traditions are under discussion, although mainly the social networks have been in the spotlight of current research. There are even attempts to combine the two approaches (cf. Knappett et al., 2008; Rivers et al., 2013; Barthelemy, 2014; Prignano et al., 2019), which would definitely be the right step.
In the previous one or two decades network analysis became an important topic in archaeology (Knappett et al., 2008; Brughmans, 2010; Collar et al., 2015). On the one hand, archaeologists have been trying to focus on the more modern social network approaches. However, leaving geographical network approaches behind turns out to be difficult, since in archaeology spatial information is an essential aspect. Case studies have shown that archaeological researchers might develop a network approach for their own field which could serve as integrative concept for other disciplines as well. The archaeological application of network analyses solves archaeological problems by using ideas from both the geographical and the social network tradition (Sindbæk, 2007; Filet, 2017; Wehner, 2020).
In recent years the status of archaeological network research has been discussed (Fulminante, 2014). The main goal has been to close the theory gap in network analysis by developing an archaeology of interaction (Knappett, 2014).
We would like to go one step further and combine grouping approaches with social and geographical network approaches to create complementary approaches and present one coherent concept (Nakoinz, 2017a). The different approaches are closely linked, but are subject to different traditions and terminological cultures. This article will show how we can benefit from the combination of different so-called paradigms. Furthermore, it will become clear how important the careful use of terminology is.
After demanding integrative approaches, a combination of network and clustering approaches, we would like to come back to the issue of urbanity and hope that the reader of this paper will keep the “integrative spirit” from the previous sentences in mind. The problem with the mentioned concepts of urbanity is that although each concept covers a specific aspect that is important, there is no concept which covers all of the facets. Furthermore, the essence of urbanity is not captured at all. Towns are characterized by a certain size on a relative scale. However, it is not the size itself which defines a place as urban. It is rather a certain reaction to the requirements of size including coping with the emerging complexity and benefiting from the opportunities of big sized places (Nakoinz, 2017b).
Complexity is a concept that can be derived from a certain degree of interaction and connectivity and hence needs to play a major role in the urbanity discourse. In the following section we are going to have a closer look at those keywords.
2.2. Complexity, Interaction, and Connectivity
The meaning of complexity has many facets. For our approach we use the concept of complexity that stems from complex system sciences (Gell-Mann, 1995) and was developed on top of system theory (von Bertalanffy, 1968), as we found it to serve our purpose best.
A system is a model of a specific research topic that maps not only the structure, but also the dynamic interrelationships between different elements. A complex system is a system that shows non-linear behavior, path dependency, butterfly effect and some other features and which is not predictable. Complexity in this sense can be caused by the existence of too many elements or by the elements being too complicated, especially if these elements are in certain non-linear interrelationships. Complex networks can involve some remarkable effects such as emergence, butterfly effects, and path dependency. Cities can be considered as complex systems (Jacobs, 1992; Batty, 2005; Bettencourt and West, 2010; Bettencourt et al., 2013; Schläpfer et al., 2014; Nakoinz, 2017b), even though they are different from complex biological systems (Bettencourt, 2013). Complexity-based urbanity research is a field which aims at combining social and geographical networks by developing social networks of settlements embedded in a geographical space (Ortman et al., 2014).
In addition to the complex nature of social interaction, two main drivers of complexity are size and population. It is a fact that human beings can only manage a certain number of effective contacts (Dunbar, 1992). In this paper, effective contacts are defined as interactions between people that usually have a social, economic or cultural impact. There are thresholds for the size of communities (MacSweeney, 2004; Feinmann, 2011) that define at what point these communities become unstable and thus obtain a certain degree of instability.
Communities that exceed the threshold and become unstable can regain a certain degree of stability by applying complexity reduction methods. This can be achieved by restricting the number of effective contacts, for example within-group connections, neighbors or the edges of a hierarchical network of individuals. The limitation of effective contacts within hierarchies is the most efficient method of complexity reduction. This does not necessarily mean that people from different groups and hierarchies are not allowed to talk to each other. However, there are certain “cultural rules” that make these contacts less effective.
Let us take a closer look at what causes complexity. In fact, it is not the size of a community, but rather the number of effective interactions that causes the threshold to be exceeded. A high number of interactions can also lead to people being more stressed and making mistakes as well as something we could call mismanagement of connections. The higher the number of effective interactions, the more unpredictable is the urban environment to the individual and the urban system to all people. In this sense, interaction can be identified as a distinctive feature of complexity, since in a predictable system the number of manageable connections is limited. Another aspect of complexity is connectivity, which plays an important role in terms of making decisions. If there is the opportunity for people to interact with each other, these people first need to decide whether they actually want to interact with each other or not. In short, when it comes to connectivity, we use our cognitive capacities to decide who should and who should not be our interaction partner and how to manage that contact. When it comes to interaction, we use our cognitive capacities to make decisions regarding the content of an interaction. However, this puts additional stress on people resulting in further uncertainties, especially in systems that are already hard to predict. It is obvious that interaction and connectivity are somehow related. We decided to include these terms in our paper, as they seem to be essential to our topic. In the following section we will present a definition for both terms.
Interaction is a process of action that involves at least two interacting partners. In this process the two interacting partners can have a common goal. In that case the interaction may lead to an expansion of each partner's capabilities. However, if the interacting partners have contradicting goals, this may lead to a reduction of each partner's capabilities (Arponen et al., 2016). While interaction is a real action, connectivity refers to possible actions and thus can be defined as potential interaction. However, the aspect of potential action requires a more detailed discussion. For now, defining connectivity as potential interaction is sufficient and we can conclude that both interaction and connectivity are characteristic features of complexity. The difference between interaction and connectivity is that connectivity involves connections that are not used for actual interaction. Maintaining connectivity requires some effort. However, it does not come along with taking advantage of any benefits. It is the interaction through which one is able to reap those benefits. Thus, performing an interaction requires additional efforts.
Later on, we will discuss the effects which connectivity has on complexity in an urban context. First, however, it should be noted that a higher degree of connectivity and thus complexity go along with more opportunities. Many potential connections raise the chance for a division of labor, as it becomes more likely to find someone who participates in production by conducting a step in the chaînes opératoires. In addition, a division of labor increases connectivity by maintaining the social connection between collaborators. It also leads to more interactivity, as the collaborators are required to interact. It becomes apparent that connectivity and a division of labor mutually reinforce each other. A high degree of connectivity increases the chance of more knowledge to be exchanged and hence the chances for innovation. Finally, a high degree of connectivity increases the chance to offer central functions. At the same time, centrality leads to more connectivity and actual interaction at central places. While centrality also leads to more complexity at central places, it reduces complexity in non-central places. This is due to the fact that in central settlement systems fewer decisions have to be made. In other words, centrality leads to a shift of complexity from the periphery to the center.
Increasing the degree of connectivity and thus of complexity means increasing stress. As mentioned above, a high degree of connectivity requires a large number of decisions and leads to scalar stress (Alberti, 2014). Numerous connections have to be maintained and if the number of connections exceeds a certain threshold, the system becomes unpredictable.
Increasing the degree of connectivity and thus of complexity also means a shift in lifestyle. In this connection, three different aspects should be mentioned. If the number of connections exceeds the already mentioned threshold, the system not only becomes unpredictable, but people start to drop some of their connections due to their limited capabilities. Dropping or devaluing social contacts leads to nothing but an anonymous way of life, which has already been named a characteristic feature of urban life. As a consequence, rules will be introduced to fight the unpredictability of complex urban systems. For this purpose, institutions are being established. Institutions are characterized by specific social functions and roles, where the role incumbent might change, whereas the function persists. That way, it can be ensured that the functions will always be fulfilled in the same way, which leads to a higher degree of stability and predictability and thus reduced complexity.
In summary, agglomerations constantly tend to become too complex and thus too difficult for their inhabitants to live in. This is particularly true for central places with a high complexity, as opposed to central places of the same size that do not have the same level of complexity. Settlement systems with several central places are characterized by rather low centrality in the space between the central places and where each central place shows a rather high degree of complexity. In the next section we will explore which role centrality plays for urbanity.
2.3. Urbanity and Centrality
Prepared with our knowledge regarding complexity and connectivity, we can now come back to the characteristic features of urbanity. It becomes apparent that places with a variety of opportunities trigger and drive different urban processes and towns appear to be places in which new opportunities arise due to urban processes. This mutual interrelation roots in a certain degree of complexity and in turn leads to more complexity. It is the aspect of connectivity in particular that produces both new opportunities and additional complexity. For the following part, we can state that the actual degree of interaction at urban sites is higher than it would be at non-urban sites of the same size. Here, we reach the point where the relative surplus of importance of Christallers concept is inevitably for the urbanity discourse.
These characteristics do not provide us with fixed parameters for the description of a place. However, they appear to be related to specific urban processes as described above. Therefore, urbanity should be understood as a process rather than a status or property of a place. It can be defined as the search for opportunities and the attempt to cope with unpredictable and highly connected environments. In fact, the term 'urban jungle' derives its meaning from an unpredictable and dense environment in which unforeseen interactions can interfere with the predicted course of life.
Not only do the above described processes involve a high degree of connectivity and interaction, but the existing connectivity also continuously increases. Centrality, which we consider as a concentration of interaction (Nakoinz, 2019), is highly involved in this process. While centrality leads to a reduction of complexity at the periphery, it further increases it at the center. We already described the two basic concepts of centrality above. Now we need to take a more detailed look at what centrality actually means and how it is measured. First, we discuss Christaller centrality. While our definition of centrality as the relative concentration of interaction is very general and covers both Christaller's approach and the network approach, Christaller defines centrality as the relative surplus of importance of a place. In order to understand the significance of Christaller's concept of urbanity, we need to clarify the meaning of “relative.” Since this aspect of Christaller's central place theory sometimes is neglected and is partly not covered in the secondary literature, we feel that it needs to be explicitly included. A considerable amount of literature on central places exclusively focusses on an absolute importance instead of a relative surplus of importance and hence does not address centrality as defined by Christaller at all. In this paper, we adopt Christaller's ideas and describe them using our own terminological and conceptual frame. For the original text and concept please refer to Christaller (1933).
We assume that there are different attractors of interaction at a place. First-order attractors, which are analogous to first-order effects in point pattern analyses, are based on locational factors such as soil, water, and natural resources. These factors determine the carrying capacity at a place. Second-order attractors attract interactions by structural properties such as network integration. Both types of attractors represent an interaction potential we call primary interaction potential. Basically, primary interaction potentials refer to the attraction of people. Secondary interaction potentials are based on the primary ones and represent the number of possible interactions. They refer to connectivity, which can be defined as potential interaction. People are attracted by environmental benefits such as a high carrying capacity or natural resources (primary centrality potentials) and by the opportunity to make new useful connections (secondary centrality potentials). The latter is influenced by the number of people at one place, the difficulty of making new contacts and the feasibility to make contacts with people from other places. Since there is no linear relationship between primary and secondary interaction potentials, it makes sense to distinguish between the two potentials. It is the complexity of social relationships that makes it impossible to use the primary potential as proxy for connectivity, even though these two aspects are closely related. The secondary interaction potential already takes these aspects into consideration. In order to circumvent the complicated deduction of the secondary interaction potential based on the first one, structural properties are being used as proxy for the interaction potential. In the case of Christaller centrality, the number of people represents the probable number of interactions. In case of network centrality, the probable amount of interaction will be predicted based on network properties. This information can be provided using centrality indices. We will come back to this issue later on but for now it is clear that the two concepts do not only complement each other but furthermore from the perspective of urbanity a combination of the two concepts is required.
Centrality can be considered as the amount of interaction that exceeds the one that would be adequate for a place with certain locational or structural properties of the secondary interaction potential. Centrality thus provides information on hidden pull factors, which can be understood based on complexity theory. It is the mutual reinforcement of different factors as described above that leads to an additional amount of interaction that has seemingly been produced by hidden pull factors. If a place shows a surplus of interaction, we can deduce a high dynamism of that place and even expect urban or urban-like processes. This surplus, which is characterized by centrality, is an indication for a place to be of extraordinary importance within its settlement system, economic system, and cultural system. Centrality is not equal to urbanity, as the term does not cover all aspects of urbanity, but is an essential part of it.
In principle, the two variants of centrality, Christaller centrality and the various types of network centrality, are very similar. However, there are some crucial differences which need to be discussed (Nakoinz, 2019).
First of all, Christaller presents a model or, to be more precise, three models on how to achieve centrality. These models, also known as Christaller's hexagons, describe an optimized supply network in which, for instance, individual and global distances between interaction partners are kept to a minimum. Although network sciences imply similar structures, these are usually not presented as the main models of a concept. Since Christaller's models describe networks, they can directly be transferred to networks. In this paper, however, we will not cover Christaller's models at all but his concept and definition of centrality. Another difference between the two variants of centrality can be found in the principle of optimization. Christaller centers benefit from synergies gained by the concentration of interaction nodes at the centers, while network centers gain their synergies from controlling and concentrating connection edges (Nakoinz, 2019). It follows that Christaller centrality mainly describes properties of a place in a regional network, while network centrality is focused on the structural integration of a place into a multi-scalar network.
Secondly, Christaller provides one consistent explicit definition, while network centrality models cover a multitude of different implicit definitions that are very similar. For Christaller centrality is the relative surplus of importance, which is the basis for our definition of centrality being a relative concentration of interaction. In network sciences, however, the focus lies on connectivity, which is not understood in the narrow sense referring to the nodal degree, but in a more general sense. In his centrality concept Christaller has excluded the influence of primary centrality potentials or primary pull factors and focusses only on secondary potentials or pull factors that are caused by social dynamics. In other words, the absolute centrality was adjusted by effects of primary centrality potentials. In contrast to that, the basic measures from network sciences do not consider primary factors at all and therefore provide absolute measures. For unweighted networks the basic measures provide information on the existing connections and for the weighted graphs, they show how the actual interactions influence the connectivity of a place. Both contain primary centrality potentials as invisible factors. Since we are interested in centrality adjusted by the primary potential, which is the crucial point for urbanity, Christaller's version is the one we need to consider, when it comes to our present problem.
Thirdly, Christaller offers a centrality measure that is valid only for a specific historical context, while network sciences provide several sound measures. The ideal way would be to simply apply network centrality measures using Christaller's definition. However, that would turn out to be problematic. In his original study Christaller uses population as a node feature to define the size of a place and he uses another node feature to indicate some kind of absolute centrality. In this connection, centrality is measured as absolute centrality that follows the size of a site (population). In order to use centrality measures as defined by network sciences, we would need to translate the nodal information about the places' size into structural information from external connections. Since the assumed centrality and the node feature have different units of measurement, this is not done by simply weighting the nodes by size or even by inversing size. Christaller in turn uses the same unit of measurement for both the centrality measure and the size measure. A solution would be to look at networks of different scale. Up to now, we only considered networks in which the nodes represent different places. An intra-site network looking at individuals could provide us with the information we need for the other level. However, since the available data is limited, such method seems rather unrealistic and there is no need for it to be considered. Furthermore, Christaller's centrality measurement originally focussed on specific network structures that correspond with those structures Christaller proposed for the minimization of transport costs. This star-like network covers the complementary area of a central place.
Both the obvious and the more subtle differences between Christaller centrality and the different network centralities require a literal translation of Christaller's concept into the context of network sciences. As we have already seen, a direct transfer of concepts and methods would not be feasible and lead to inconsistent results. We therefore assume a system of interaction that is mapped using a network (a simplified model of the interaction system). We distinguish between unweighted graphs, which only represent the structure of the interaction system, and weighted graphs, which also map the flow and actual interaction within the interaction system (for a discussion about the flow of interaction and the term itself we refer to Borgatti, 2005; Taylor et al., 2010). While in the first case the most important information gained is the existence of edges, in the second case the most important information revealed lies in the edge weights. Centrality indices applied to unweighted graphs represent some kind of secondary interaction potential, while centrality indices applied to weighted graphs represent the actual concentration of interaction. In order to obtain the relative concentration of interaction, which corresponds to centrality in the sense of our concept (Nakoinz, 2012, 2019; Knitter and Nakoinz, 2018), we need to subtract the centrality measure of the unweighted graph from the one of the weighted graph.
The previous paragraphs have shown that urbanity, centrality, interaction and connectivity are closely intertwined. This information also includes some hints on why networks play a vital role in the process of urbanity. In this connection, we feel the need to clarify this relationship. A network obviously provides places with additional connectivity, which in turn can lead to an additional amount of interaction. The additional amount of interaction increases the complexity as well as the dynamism and vigor that characterizes urban processes. Although, in principle, networks are no precondition of urbanity, they stimulate urban processes and therefore are tightly linked to urbanity. This assessment of the role of networks is valid for inter-town networks as well as for intra-town networks. Both types of networks lead to increasing interaction, albeit different types of interaction, respectively.
3. Method
In order to explore the external conditions of urbanization and urbanity, we need to investigate the real network centrality in contrast to potential or structural centrality. According to our theoretical considerations, the real network centrality (Cent) equals the real interaction (Int) between one network node (i) and other nodes, minus the connectivity represented by structural centrality (Con).
While Coni is a centrality index applied to an unweighted graph, Inti is the corresponding centrality measure for weighted graphs (Borgatti, 2005; Opsahl et al., 2010; Yan et al., 2013). In our case, we use degree, strength, closeness and betweenness, since these measures are very basic, easy to understand and directly lead to an interpretation. Other centrality measures (cf. Bonacich, 1991; Koschützki et al., 2005; Benzi and Klymko, 2013; Agryzkov et al., 2019; Larrañeta et al., 2019; Lv et al., 2019; Skibski et al., 2019) shall be neglected for the moment and can be included at a later stage. While degree only maps the number of connections, strength also includes the intensity of the connections. Closeness is a measure for the reach of a certain node and betweenness maps the interaction control.
This approach is different from most other approaches, since both actual interaction indicators and structural centrality indicators are used. It is also consistent with our theory and there are some additional advantages, which need to be mentioned. Firstly, this approach can be interpreted as the combination of an empirical and a theoretical model, which is a requirement to gain new knowledge (Nakoinz, 2018a, 105). In this connection, the real interaction represents the empirical model, while the centrality index applied to an unweighted graph is a prediction of the structural importance of a place and thus a theoretical model. Secondly, this approach minimizes the edge effects. Spatial network analyses particularly tend to have edge effects, which is due to the fact that peripheral edges cannot have the same amount of structural embeddedness as geographical central nodes. Since both Inti and Coni are affected by this, the edge effect is partly compensated in our equation. This allows for a more extensive interpretation of the network analysis results, as the periphery does not need to be excluded completely.
In order to enter actual values into the equation, we need to define nodes, edges and the flow of our network. The nodes comprise the presumed urban centers and other places. In our case the presumed urban centers are princely seats. Due to a lack of research on ordinary settlements and the fact that we do not have access to a decent data set, the other places are rather difficult to define. However, for our analysis neither the exact location nor the exact inventories are required, unless it was our aim to interpret the minor places themselves. Based on this consideration we can simulate the location of the ordinary settlements. The aim of this simulation is not to capture probable or even real site locations, but to capture the sample point for the aggregation of the fibulae data. However, if we simulate too many places we will end up having too many insignificant fibulae data aggregations comprising only small numbers of fibulae. Therefore, we use a mean distance of 15 km between the different places and a hard-core radius of 10 km, which must not contain any other places. In the princely seat's hard core the other places are substituted by the princely seats themselves. The fibulae are assigned to the nearest place in the set of simulated places and princely seats, which both serve as network nodes.
Since our aim is to obtain connections at different distances, the conventional solution of using a realistic geographic network that connects natural neighbors only (Delaunay graph) is not considered a decent solution for our problem. Instead, we decided to start with a complete graph at the cost of not being able to produce a readable plot of the network connections. The second step of the analysis consisted in cutting some connections to obtain a semi-complete graph, which is required for some applications. The cut-threshold was arbitrarily set to the value 0.85 of relative proximity, with a maximum value of 1.00. For the analysis we have to keep in mind that the edges of the complete graph have been constructed and are not based on archaeological evidence. This excludes, for example, the calculation of the degree for a complete graph or a Delaunay graph.
The archaeological evidence is taken into consideration when weighting the edges, an approach that is part of an ongoing discussion about the special nature and requirements of archaeological networks (Peeples and Roberts, 2013). In our case, the weighting is based on the theoretical concept of cultural distance. Cultural distance has been shown to be a proxy for interaction (Nakoinz, 2013). The methodology is described in detail in other publications (e.g., Cormier et al., 2017) and, from a network research perspective, it can be understood and compared to similarity networks (cf. Östborn and Gerding, 2015; Habiba et al., 2018). First of all, the relative amount of each type is sampled for every sample point. This is followed by using this so-called spectrum of types to calculate a distance matrix (Figure 2). For this purpose, the Euclidean distance is used, as the data has been adapted to the Euclidean space. In fact, we use compositional data in which the Euclidean distance is valid (van den Boogaart and Tolosana-Delgado, 2013). The distance matrix resulting from the calculations is then used as an adjacency matrix in order to produce the network. The original distance matrix eventually leads to a complete weighted graph. The cut mentioned above is done by replacing values below the threshold in the distance matrix by zero. Finally, to obtain an unweighted graph, the weights can be replaced by zero. This procedure leads to three different networks:
• Full weighted graph
• Cut weighted graph
• Cut unweighted graph
While the unweighted graph represents the connectivity, the weighted graphs represent the actual interaction. The cut and the complete graph differ in the presence and absence of edges, which is defined by rather low interaction. The complete graph also includes connections that are less intensive, while the cut graph focusses on the more vital edges. Another reason why we cut the graph has been mentioned above. As a matter of fact, some analyses cannot be done using a complete graph. Since the networks only map the input data, which does not lead to any results directly related to our research objective, there is no need to plot them. The network graphs are not considered a result of this paper but rather an intermediate state of the data. For our case study only the results of the centrality measures of the network are relevant and shown in the figures.
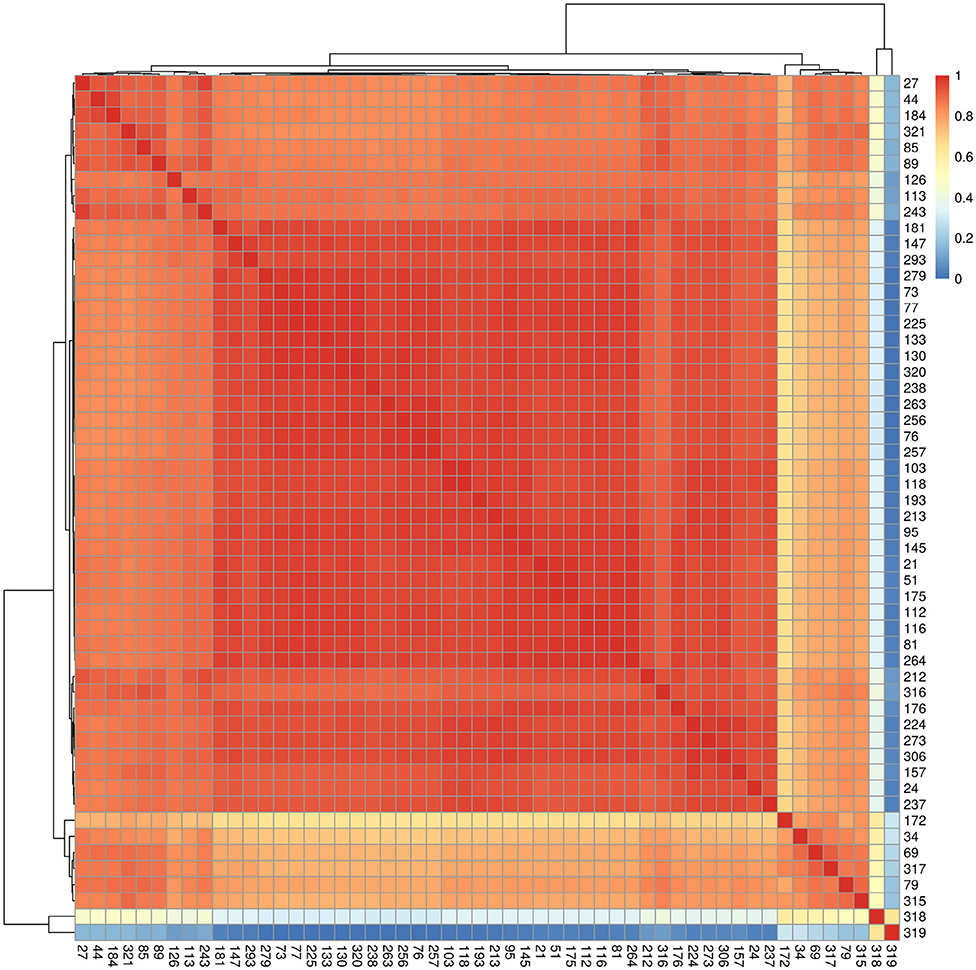
Figure 2. Heatmap of distance matrix for the full weighted graph of Ha D1.
Since the simple and well-known centrality measures are comprehensible and lead to a straightforward interpretation, we decided to use them in our analysis. Using different types of networks the degree, strength, closeness and betweenness are calculated and presented as mapped symbols, of which the size corresponds to the intensity of centrality. In order to obtain a decent size for the symbols on the map, the values of each category are scaled independently of one another. This means that the symbol sizes of one and the same map, which are located between the different time slices of the same category, can be compared to one another. The symbol sizes outside this spectrum will not be included.
All analyses have been done with R and some additional packages (Csardi and Nepusz, 2006; Knitter, 2017; Nakoinz, 2018b; R Core Team, 2018). The analysis scripts of the case study and the data are provided at https://gitlab.com/oliver.nakoinz/urbanityprocess.
4. Case Study
In our case study we apply the ideas outlined in the previous parts of the paper. We want to show the applicability of our concept and, furthermore, that new insights can be gained by using this approach. Applying this specific approach, we tread new ground, in which we address the involvement of some kind of middle class in urban processes based on fully reproducible quantitative research.
4.1. Objective
The main objective of this case study is to identify places that show a high degree of network centrality and therefore good conditions for urbanity processes. In this connection, it should be emphasized that we focus on urbanity processes and not urbanization. According to our theoretical background, urbanity is a process in which people permanently have to deal with the challenges and opportunities that come with rising connectivity, growing interaction density and increasing complexity. Since urbanity does not describe a fixed state, the understanding of urbanization as the formation of urbanized places seems to be inaccurate. Instead, we understand urbanization as the existence of specific factors that cause urbanity processes. Looking at urbanization in the context of our case study, we would rather discuss the causes of centrality instead of the location of central places or the degree of centrality of places. In this connection, we look for places which gained a high degree of centrality through network integration, which can be considered a factor of the urbanity process.
4.2. Data
In this case study we apply a very restrictive data set, meaning we only use fibulae. This bears some advantages, such as the comparability with the work of Brun (1988), who also used fibulae to compare princely seats to one another, and a narrow focus of interpretation. The disadvantage is that we are not able to gain a general insight into centrality. The fibulae we used are classified according to Mansfeld (1973). The data stems from the shkr database (Nakoinz, 2013). It was inserted during previous projects and completed during the preparation of this paper. The data used in this study originates from Baden-Württemberg in Germany, with a few additions coming from other countries and states such as Hesse (Germany), Rhineland-Palatinate (Germany), Saarland (Germany), and Alsace (France) (Figure 1).
Distributed to the three phases of the late Hallstatt period, the database includes 272 fibulae from Ha D1, 747 fibulae from Ha D2 and 345 fibulae from Ha D3. Considering the different lengths of the phases, the dominant position of Ha D2 becomes fairly clear. While Ha D1 provides two fibulae per year and Ha D3 six fibulae per year, Ha D2 surpasses that with 37 fibulae per year.
The specific scope of interpretation of the fibulae case study is limited to the middle class and does not include the elites or the poor. We also focus on social ties, rather than religious or economic aspects. Therefore, the fibulae primarily map social developments as part of urbanity processes. This information supplements information from other data. Thanks to proxies of wealth and trade, we already know that some places show some kind of economic connectivity (Nakoinz, 2017b).
4.3. Results
In accordance with the above mentioned categories and the three phases mapped in Figures 3–5, our analysis results in different centrality indices. For the complete weighted graph there are only two maps, as for this type of graph the calculation of the degree would not make any sense. Regarding closeness the values for Ha D1 at Kapf, Ha D2 near Hohenasperg and Ha D3 also near and at Hohenasperg as well as at the Heuneburg are above average (Figure 1). In all three phases, the transport corridors at Rhine and Neckar show medium values. The betweenness of the complete weighted graph highlights the same sites, which are Kapf in Ha D1, the surrounding areas of Hohenasperg in Ha D2 and the Heuneburg in Ha D3. Maximum values are observed for Ha D2.
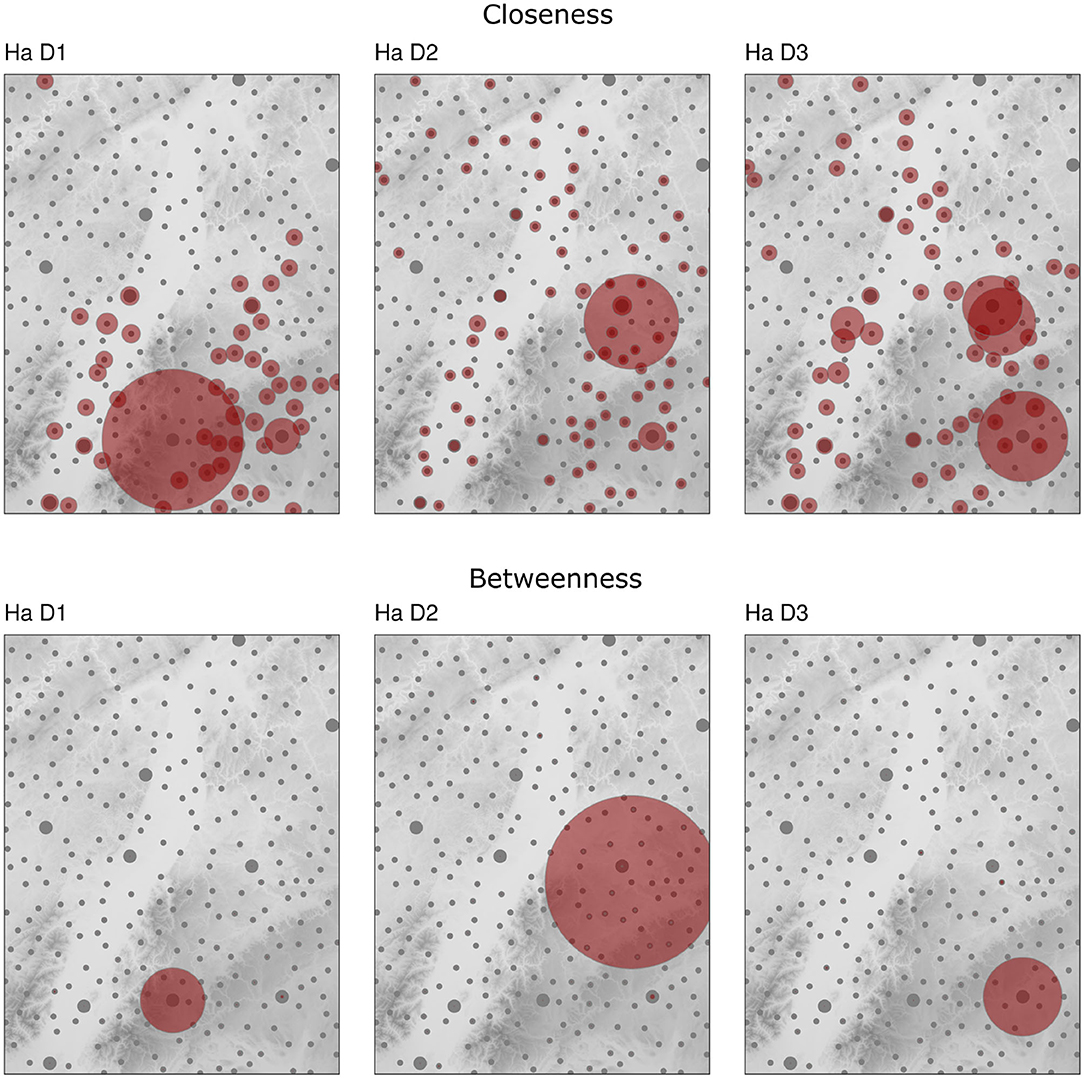
Figure 3. Closeness and betweenness of full weighted graphs. Gray points are the simulated sites and the Princely Seats, the red circles indicate the centrality according to the mentioned index, where the size of the circles corresponds with the centrality. The symbols of each row is scaled differently.
The degree of the cut weighted graph, which for weighted graphs would actually be indicated as the strength, but for reasons of better comparability is mentioned as degree, does not highlight the princely seats at all, but rather excludes them (Figure 4). The increase in Ha D2 is followed by a decrease in Ha D3. Regarding closeness, the princely seats also seem to be mainly excluded and similar to the closeness of the complete graph, the transport corridors are characterized by values above average. The mean values decrease in Ha D2 and increase in Ha D3. In contrast to the degree, the highest closeness values in Ha D3 can be found at one of the princely seats, namely the Heuneburg. Similar to the closeness, the betweenness shows the highest values in Ha D3, which at the same time are the highest values of all phases at the Heuneburg. Other princely seats do not show values above average. The maximum values for betweenness per phase seem to be continuously increasing.
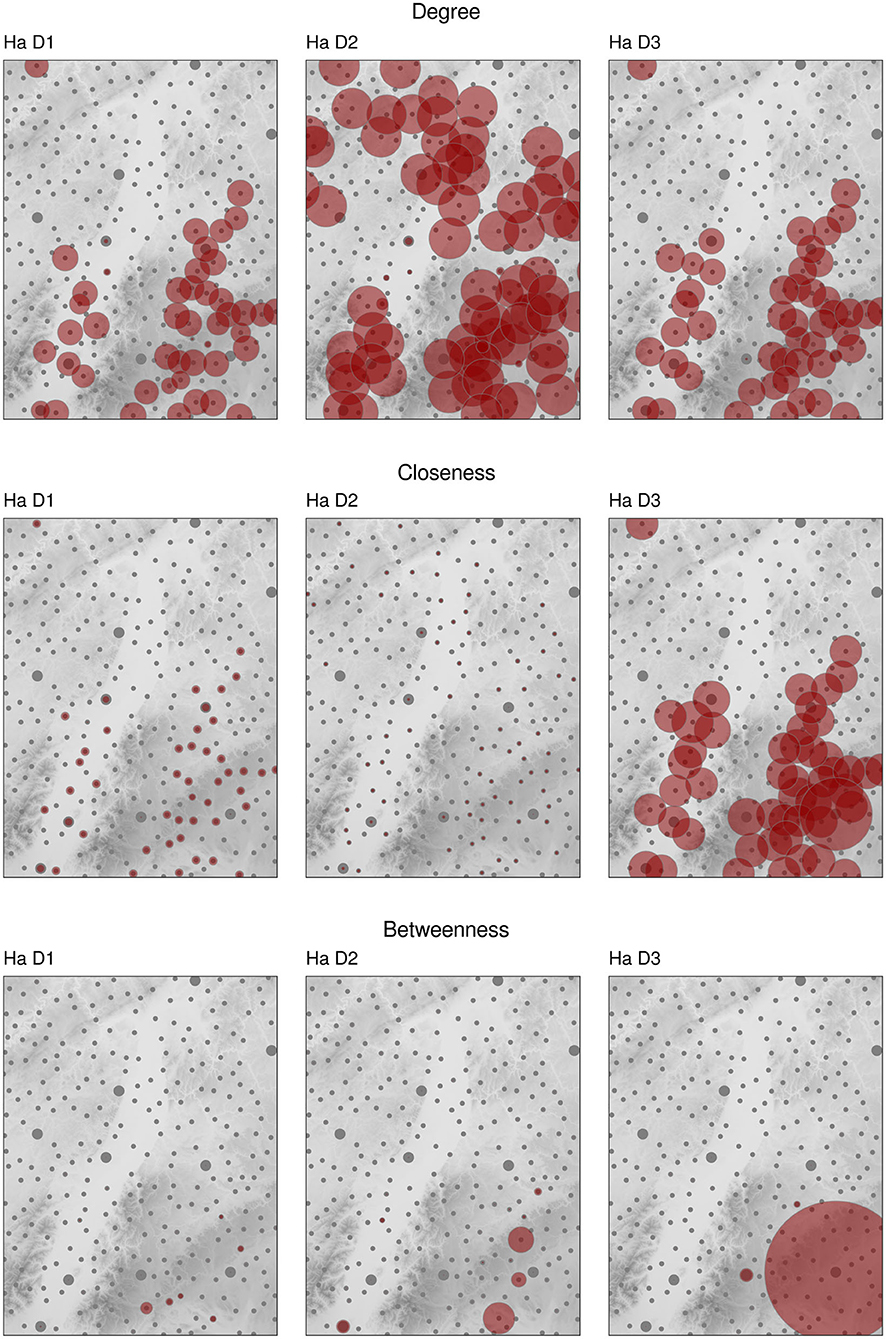
Figure 4. Degree, closeness, and betweenness of cut weighted graphs. Gray points are the simulated sites and the Princely Seats, the red circles indicate the centrality according to the mentioned index, where the size of the circles corresponds with the centrality. The symbols of each row is scaled differently.
The last category of centrality measures that we present in this study focusses on the differences between the cut weighted graph and the cut unweighted graph (Figure 5). Regarding the degree the maximum values per phase increase. However, the upper range of the values does not highlight the princely seats. The results show a more general increase of the values, rather than an increase for specific places. The closeness shows an abrupt increase in Ha D3 with a focus on the princely seats Heuneburg and Kapf, with maximum values for the Heuneburg. The betweenness provides outstandingly high values for the Heuneburg and, in second place with much lower values, Kapf. In Ha D2 the values above average do not focus on princely seats, but show a rather general increase continuing the process from Ha D1.
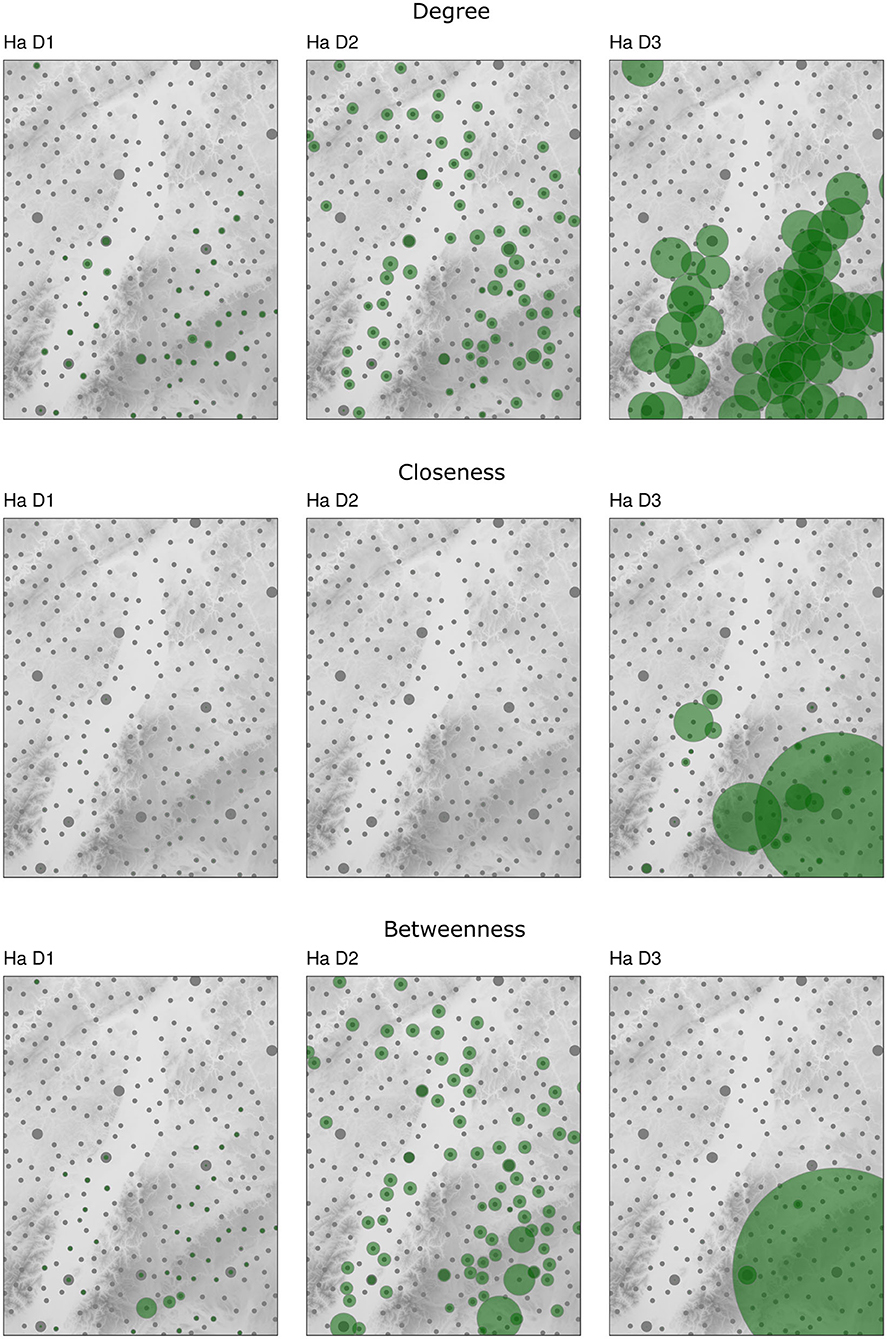
Figure 5. Relative degree, closeness and betweenness of cut graphs. Gray points are the simulated sites and the Princely Seats, the red circles indicate the centrality according to the mentioned index, where the size of the circles corresponds with the centrality. The symbols of each row is scaled differently.
4.4. Interpretation
The interpretation of our results is based on previous knowledge. We are convinced that the princely seats are some kind of central place (Krausse, 2008) and particularly function as network centers (Nakoinz, 2013). We furthermore assume that they are characterized by wealth and trade (summarized Nakoinz, 2017b). This case study is based on the assumption that interaction measures applied to an unweighted graph indicate connectivity and that interaction measures applied to a weighted graph indicate absolute interaction. Furthermore, it is assumed that relative interaction measures indicate centrality in the sense as discussed above. Moreover, we assume that the degree maps the chances for interaction, closeness the possible reaches of interaction and betweenness the interaction control. Taking the actually used data, which is the fibulae, into account, we can assume that we will gain knowledge on social interaction, rather than economic processes. Considering the fibulae we look at people from some kind of middle class who are able to influence society, but are not part of the power elites. They seem to be people who have certain ambitions and a certain degree of influence, but do not have actual political power. This assumption does not deny the existence of elites. We just assume that the majority of the fibulae neither belong to the elites nor to the poor.
The complete graph results highlight the places with the highest degree of interaction. In contrast, the cut graph shows that the places in which social interaction mainly took place come with very small interaction intensities and become rather isolated when neglecting the existing superficial connections. For closeness and betweenness the results are similar. While the Kapf is highlighted in Ha D1, it is the surrounding area of Hohenasperg that is highlighted in Ha D2 and partly in Ha D3. In the latter phase the Heuneburg is in a dominant position as well. At first glance, it is particularly irritating that the Heuneburg is missing in Ha D1 and Ha D2. Upon closer inspection, however, this seems to make sense: In times of economic growth the control of the power elites would have left fewer opportunities for a free development of a middle class than in times of consolidation and decline.
This interpretation is further supported by the results of the cut graphs. Regarding betweenness the Heuneburg emerges as the most important point in Ha D3. In contrast, Ha D1 and Ha D2 do not show such extensive betweenness values at all. Looking at the degree or in this case strength and closeness, we notice that the princely seats do not play any particular role. When it comes to the number of vital connections, we can observe a general increase from Ha D1 to Ha D2 and a decrease at a later time. This decrease is obviously compensated by a much higher general reach of interaction indicated by closeness.
Centrality, which according to our definition is the relative interaction, maps the interaction that is added to the already existing interaction determined by the interaction potential. Centrality hence identifies the places that act as actual social stimulators. Compared to the absolute interaction, this surplus of interaction is rather small. However, it highlights the most vital places regarding the social development of the middle class and provides additional complexity.
The continuous increase of the relative degree shows that the decrease of the absolute degree in Ha D3 does not tell the whole story. Most places are even better connected than the interaction potential would suggest and we can assume that the natural development is hampered by external factors which lower the interaction potential. The relative closeness, meaning the relative reach of connections, particularly increases in Ha D3. However, it is mainly the Heuneburg that is affected by that and to a lesser extent the Kapf. The relative betweenness shows a similar pattern, with a general increase in Ha D2 and enormous increases in Ha D3 for the Heuneburg, which showed rather small values in Ha D2.
Regarding urbanity, we thus find good conditions for middle class interactivity in Ha D3 at the Heuneburg and to a lesser extent at the Kapf. However, there seems to be hardly any interactivity at the princely seats further north. This is somehow ironic, as the original function of these places as economic network centers had already moved further north (Nakoinz, 2013) and the southern line of the princely seats had been abandoned to other activities. Perhaps it was this asynchronous social development of the middle class and the economic development of the power elites that stopped the urban process eventually and lead to something which Brun and Chaume (2013) called unfinished urbanization.
5. Discussion
The Late Hallstatt period appears to be a time of challenges and experiments. It is a highly dynamic time in which agglomerations emerge and disappear and it is a time of high complexity, which continuously grows. The climax of complexity is the urban processes, in which complexity is the driving force. Urban places and urban processes attract people, because they offer new opportunities and capabilities (Arponen et al., 2016), even, or particularly, in times of crisis. These opportunities and capabilities, however, come at the cost of instability and unpredictability. The art of successfully managing urban places is the art of finding a balance between the reduction of complexity and the limitation of opportunities through organizational structures, in other words, finding the balance between stagnation and collapse. Networks play a dual role in urban processes. On the one hand, they lead to additional connectivity and thus additional complexity. On the other hand, they provide stability by buffering some of the occurring issues. It becomes clear that networks obviously stimulate urban processes. The mentioned buffer function requires synchronous and interlinked processes. However, as shown in this paper, this requirement was not met in the Early Iron Age of South-West Germany. Different social subsystems developed independently from one another and asynchronously constrained each other. Complexity at that time was high. However, as opposed to what is assumed for urban processes, it was neither possible to reduce complexity nor to benefit from it. Above all, it was not possible to take advantage of the network's buffering capability. The processes required for the adaptation to new conditions could not hold pace with the processes of growing complexity. For the Heuneburg it has already been discussed, if the failure to cope with growing complexity lead to the local collapse in Ha D2 (Nakoinz, 2017b). In our paper we address this problem as well. However, we present a more general picture of it.
Thanks to the detailed analysis of interaction and interaction potentials as well as of connectivity and centrality, we are able to get an insight into the development of the Early Iron Age society and the rather tragic role of urban processes at that time. Theoretical considerations provided us with the necessary tools and terms for a detailed analysis. Without the theoretical considerations we would hardly be able to base our interpretation on different results and indicators. On the contrary, we would perhaps treat completely divergent concepts such as centrality in geography and centrality in social network analysis as equivalent and hence come to wrong conclusions.
Finally, we can answer the question raised in the introduction. Although the middle class was involved in urban processes, for the urbanization as a whole it did not play any important role. And although it potentially could have done so, apparently this middle class had been in the wrong place or lived during the wrong phase, in which synergies with other parts of urban processes or the reinforcement thereof were not possible. At least it seems that this component together with additional capabilities of adaptation and innovation was missing at economic central places and the elites' residences. Sustainable urban processes need a balance between stagnation and crisis and this middle class could have been a providing factor.
Data Availability Statement
The datasets analyzed for this study can be found in the gitlab repository https://gitlab.com/oliver.nakoinz/urbanityprocess.
Author Contributions
All authors listed have made a substantial, direct and intellectual contribution to the work, and approved it for publication.
Funding
This paper has been published thanks to EU OPEN-AIRE funding granted to Francesca Fulminante for the Maria Slodowska Curie Project 628818 Past-People-Net (2014-2016). The preparation of this paper was funded by the Deutsche Forschungsgemeinschaft (DFG, German Research Foundation - Projektnummer 2901391021-SFB 1266 and Projektnummer 252470382). The finalization of this project was funded by the Deutsche Forschungsgemeinschaft (DFG, German Research Foundation) under Germany's Excellence Strategy-EXC-2150-390870439.
Conflict of Interest
The authors declare that the research was conducted in the absence of any commercial or financial relationships that could be construed as a potential conflict of interest.
Acknowledgments
We are grateful to Francesca Fulminate for inviting us to this publication. We would like to thank the participants of the course 'Die ersten Städte nördlich der Alpen? Urbanisierungsprozesse in der Eisenzeit' (Kiel University 2018, course no 200129) for intense discussions.
References
Agryzkov, T., Tortosa, L., and Vicent, J. F. (2019). A variant of the current flow betweenness centrality and its application in urban networks. Appl. Math. Comput. 347, 600–615. doi: 10.1016/j.amc.2018.11.032
Alberti, G. (2014). Modeling group size and scalar stress by logistic regression from an archaeological perspective. PLoS ONE 9:e91510. doi: 10.1371/journal.pone.0091510
Arponen, V., Muller, J., Hofmann, R., Furholt, M., Ribeiro, A., Horn, C., et al. (2016). Using the capability approach to conceptualise inequality in archaeology: the case of the late Neolithic Bosnian site Okoliste c. 5200-4600 BCE. J. Archaeol. Method Theory 23, 541–560. doi: 10.1007/s10816-015-9252-0
Barthelemy, M. (2014). Discussion: social and spatial networks. Les nouvelles de l'archeologie 135, 51–61. doi: 10.4000/nda.2374
Batty, M. (2005). Cities and Complexity: Understanding Cities with Cellular Automata, Agent-Based Models, and Fractals. Cambridge, MA: The MIT Press.
Benzi, M., and Klymko, C. (2013). ATRIX analysis of different centrality measures. SIAM J. Matrix Anal. Appl. 36, 686–706. doi: 10.1137/130950550
Bettencourt, L., and West, G. (2010). A unified theory of urban living. Nature 467, 912–913. doi: 10.1038/467912a
Bettencourt, L. M. A. (2013). The origins of scaling in cities. Science 340, 1438–1441. doi: 10.1126/science.1235823
Bettencourt, L. M. A., Lobo, J., and Youn, H. (2013). The Hypothesis of Urban Scaling: Formalization, Implications and Challenges. Technical report.
Bonacich, P. (1991). Simultaneous group and individual centralities. Soc. Netw. 13, 155–168. doi: 10.1016/0378-8733(91)90018-O
Borgatti, S. P. (2005). Centrality and network flow. Soc. Netw. 27, 55–71. doi: 10.1016/j.socnet.2004.11.008
Brughmans, T. (2010). Connecting the dots: towards archaeological network analysis. Oxford J. Archaeol. 29, 277–303. doi: 10.1111/j.1468-0092.2010.00349.x
Brun, P. (1988). “Les 'résidences princières' comme centres territoriaux: élements de véreification,” in Les princes celtes et la Méditerranée. Actes du colloque Paris 1987, Rencontres de l'école du Louvre, eds J. P. Mohen and A. Duval (Paris: Rencontres de l'école du Louvre), 128–143.
Brun, P., and Chaume, B. (2013). Une éphémère tentative d'urbanisation en europe centre-occidentale durant les VIe et Ve siècles av. J. C.? Bulletin de la Société Préhistorique Française 110, 319–349. doi: 10.3406/bspf.2013.14263
Christaller, W. (1933). Die zentralen Orte in Süddeutschland - Eine ökonomischgeographische Untersuchung über die Gesetzmäßigkeiten der Verbreitung und Entwicklung der Siedlungen mit städtischer Funktion. Jena: Gustav Fischer.
Collar, A., Coeard, F., Brughmans, T., and Mills, B. (2015). Networks in archaeology: phenomena, abstraction, representation. J. Archaeol. Method Theory 22, 1–32. doi: 10.1007/s10816-014-9235-6
Cormier, L. T., Nakoinz, O., and Popa, C. N. (2017). Three methods for detecting past groupings: cultural space and group identity. J. Archaeol. Method Theory 25, 643–661. doi: 10.1007/s10816-017-9350-2
Csardi, G., and Nepusz, T. (2006). The igraph software package for complex network research. InterJ. Complex Syst. 1695, 1–9.
Dunbar, R. (1992). Neocortex size as a constraint on group size in primates. J. Hum. Evol. 22, 469–493. doi: 10.1016/0047-2484(92)90081-J
Feinmann, G. (2011). Size, complexity, and organizational variation: a comparative approach. Cross Cult. Res. 45, 37–58. doi: 10.1177/1069397110383658
Filet, C. (2017). An attempt to estimate the impact of the spread of economic flows on Latenian urbanization1. Front. Digit. Humanit. 3:10. doi: 10.3389/fdigh.2016.00010
Fletcher, R. (1995). The Limits of Settlement Growth - A Theoretical Outline. New Studies in Archaeology. Cambridge: Cambridge University Press.
Freeman, L. C. (1978). Centrality in social networks conceptual clarification. Soc. Netw. 1, 215–239. doi: 10.1016/0378-8733(78)90021-7
Freeman, L. C. (2004). The Development of Social Network Analysis: A Study in the Sociology of Science. Vancouver, BC; North Charleston, SC: Empirical Press; BookSurge.
Fulminante, F. (2014). The network approach: tool or paradigm? Archaeol. Rev. Cambridge 29, 167–178.
Gans, H. J. (1962). “Urbanism and suburbanism as ways of life: a reevaluation of definitions,” in Human Behavior and Social Process, ed A. M. Rose (Boston, MA), 625–648.
Habiba, H., Athenstädt, J. C., Mills, B. J., and Brandes, U. (2018) Social networks similarity of site assemblages. J. Archaeol. Sci. 92, 63–72. doi: 10.1016/j.jas.2017.11.002
Hasse, P. (1880). Das Schleswiger Stadtrecht: Untersuchungen zur Dänischen Rechtsgeschichte. Lipsius & Tischer, Kiel.
Kimmig, W. (1969). “Zum Problem späthallstättischer Adelssitze,” in Siedlung, Burg und Stadt. Studien zu ihren Anfängen, eds K. H. Otto and J. Hermann (Berlin: Akademia-Verlag), 95–113.
Knappett, C. (2014). An Archaeology of Interaction: Network Perspectives on Material Culture and Society. Oxford: Oxford University Press.
Knappett, C., Evans, T., and Rivers, R. (2008). Modelling maritime interaction in the Aegean Bronze Age. Antiquity 82, 1009–1024. doi: 10.1017/S0003598X0009774X
Knitter, D. (2017). moin – Modeling Interactions Using Gravity and Entropy Maximizing Approaches. doi: 10.5281/zenodo.841106
Knitter, D., and Nakoinz, O. (2018). The relative concentration of interaction–a proposal for an integrated understanding of centrality and central places. Land 7, 1–18. doi: 10.3390/land7030086
Koschützki, D., Lehmann, K. A., Peeters, L., Richter, S., Tenfelde-Podehl, D., and Zlotowski, O. (2005). “Centrality indices,” in Network Analysis: Methodological Foundations, eds U. Brandes and T. Erlebach (Berlin; Heidelberg: Springer), 16–61. doi: 10.1007/978-3-540-31955-9_3
Krausse, D. (ed.). (2008). Frühe Zentralisierungs- und Urbanisierungsprozesse. Zur Genese und Entwicklung frühkeltischer Fürstensitze und ihres territorialen Umlandes. Konrad Theiss Verlag Stuttgart.
Krausse, D., Fernández-Götz, M., Hansen, L., and Kretschmer, I. (2016). The Heuneburg and the Early Iron Age Princely Seats: First Towns North of the Alps. Archaeolingua.
Larrañeta, B., Molina-Morales, F. X., and Herrero, I. (2019). Centrality in networks of geographically proximate firms and competitive capabilities. BRQ Bus. Res. Q. 23, 1–14.
Lv, L., Zhang, K., Bardou, D., Zhang, T., Zhang, J., Cai, Y., and Jiang, T. (2019). A new centrality measure based on random walks for multilayer networks under the framework of tensor computation. Phys. A Stat. Mech. Appl. 526:121000. doi: 10.1016/j.physa.2019.04.236
MacSweeney, N. (2004). Social complexity and population: a study in the early bronze age Aegean. Pap. Instit. Archaeol. 15, 53–66. doi: 10.5334/pia.225
Mansfeld, G. (1973). Die Fibeln der Heuneburg 1950-1970. Ein Beitrag zur Geschichte der Späthallstattfibel., Volume 33 of Römisch-Germanische Forschungen. de Gruyter. Heuneburgstudien II. Berlin.
Nakoinz, O. (2012). “Models of centrality,” in Landscape Archaeology. Conference (LAC 2012), Volume 3 of Topoi Special Volume (Berlin; Topoi), 217–223.
Nakoinz, O. (2013). Archäologische Kulturgeographie der Ältereisenzeitlichen Zentralorte Südwestdeutschlands, Volume 224 of Universitätsforsch. Bonn: Prähist. Arch. Habelt.
Nakoinz, O. (2017a). Kollektive und netzwerke als komplementäre ansätze in der eisenzeitforschung. Zeitschrift für Kultur und Kollektivwissenschaft 3, 61–82. doi: 10.14361/zkkw-2017-0206
Nakoinz, O. (2017b). “Quantifying iron age urbanism,” in Delicate Urbanism in Context: Pre-Roman German Urbanism (The DAAD Cambridge Symposium), ed S. Stoddart (Cambridge: McDonald Institute), 87–95.
Nakoinz, O. (2018a). “Models and modelling in archaeology,” in Models and Modelling between Digital and Humanities-A Multidisciplinary Perspective, A. Ciula, Ø. Eide, C. Marras, and P. Sahle (Cologne: GESIS - Leibniz Institute for the Social Sciences), 101–112.
Nakoinz, O. (2018b). shkrData: Retrieving and Handling SHKR data with the Package shkrdata. Kiel: R package version 0.1.2.
Nakoinz, O. (2019). Zentralität. Theorie, Methoden und Fallbeispiele zur Analyse zentraler Orte. Berlin: Topoi. Available online at: http://www.edition-topoi.org/books/details/1569
Opsahl, T., Agneessens, F., and Skvoretz, J. (2010). Node centrality in weighted networks: generalizing degree and shortest paths. Soc. Netw. 32, 45–251. doi: 10.1016/j.socnet.2010.03.006
Ortman, S. G., Cabaniss, A. H. F., Sturm, J. O., and Bettencourt, L. M. A. (2014). The pre-history of urban scaling. PLoS ONE 9:e87902. doi: 10.1371/journal.pone.0087902
Östborn, P., and Gerding, H. (2015). The diffusion of fired bricks in Hellenistic Europe: a similarity network analysis. J. Archaeol. Method Theory 22, 306–344. doi: 10.1007/s10816-014-9229-4
Peeples, M., and Roberts, J. (2013). To binarize or not to binarize: relational data and the construction of archaeological networks. J. Archaeol. Sci. 40, 3001–3010. doi: 10.1016/j.jas.2013.03.014
Prignano, L., Morer, I., Fulminante, F., and Lozano, S. (2019). Modelling terrestrial route networks to understand inter-polity interactions (southern Etruria, 950-500 BC). J. Archaeol. Sci. 105, 46–58. doi: 10.1016/j.jas.2019.02.007
R Core Team (2018). R: A Language and Environment for Statistical Computing. Vienna: R Foundation for Statistical Computing.
Raab, J. (2010). Der “harvard breakthrough”,” in Handbuch Netzwerkforschung, eds C. Stegbauer, C., and R. Häußling (Wiesbaden: VS Verlag für Sozialwissenschaften), 29–37. doi: 10.1007/978-3-531-92575-2_4
Rivers, R., Knappett, C., and Evans, T. (2013). “What makes a site important? Centrality, gateways, and gravity,” in Network Analysis in Archaeology, ed C. Knappett (Oxford: Oxford University Press), 125–150. doi: 10.1093/acprof:oso/9780199697090.003.0006
Schläpfer, M., Bettencourt, L. M. A., Grauwin, S., Raschke, M., Claxton, R., Smoreda, Z., et al. (2014). The scaling of human interactions with city size. J. R. Soc. Interface 11:20130789. doi: 10.1098/rsif.2013.0789
Sindbæk, S. (2007). Networks and nodal points: the emergence of towns in early viking age scandinavia. Antiquity 81, 119–132. doi: 10.1017/S0003598X00094886
Skibski, O., Rahwan, T., Michalak, T. P., and Yokoo, M. (2019). Attachment centrality: measure for connectivity in networks. Artif. Intell. 274, 151–179. doi: 10.1016/j.artint.2019.03.002
Smith, M. E. (1989). Cities, towns, and urbanism: comment on sanders and webster. Am. Anthropol. 91, 454–61. doi: 10.1525/aa.1989.91.2.02a00180
Stoddart, S. (ed.). (2017). Delicate Urbanism in Context: Settlement Nucleation in Pre-Roman Germany. Cambridge: McDonald Institute for Archaeological Research University of Cambridge.
Taaffe, E. J., and Gauthier, H. L. (1973). Geography of Transportation. Englewood Cliffs, NJ: Prentice-Hall.
Taylor, P. J., Hoyler, M., and Verbruggen, R. (2010). External urban relational process: introducing central flow theory to complement central place theory. Urban Stud. 47, 2803–2818. doi: 10.1177/0042098010377367
van den Boogaart, K., and Tolosana-Delgado, R. (2013). Analyzing Compositional Data with R. Berlin; Heidelberg: Springer-Verlag. doi: 10.1007/978-3-642-36809-7
von Bertalanffy, L. (1968). General System Theory: Foundations, Development, Applications. New York NY: George Braziller.
Wehner, D. (2020). Artefakt-Netzwerke imöstlichen Mitteleuropa an der Schwelle zum hohen Mittelalter: Zur Quantifizierung, Visualisierung und Beschaffenheit überregionaler Kommunikations- und Austauschbeziehungen. Bonn: Universitäts. Prähist. Arch. Habelt.
Keywords: urbanity, connectivity, interaction, centrality, complexity, Iron Age
Citation: Nakoinz O, Bilger M and Matzig D (2020) Urbanity as a Process and the Role of Relative Network Properties—A Case Study From the Early Iron Age. Front. Digit. Humanit. 7:2. doi: 10.3389/fdigh.2020.00002
Received: 31 January 2019; Accepted: 15 July 2020;
Published: 27 August 2020.
Edited by:
Francesca Fulminante, University of Bristol, United KingdomReviewed by:
Luce Prignano, University of Barcelona, SpainRaymond John Rivers, Imperial College London, United Kingdom
Copyright © 2020 Nakoinz, Bilger and Matzig. This is an open-access article distributed under the terms of the Creative Commons Attribution License (CC BY). The use, distribution or reproduction in other forums is permitted, provided the original author(s) and the copyright owner(s) are credited and that the original publication in this journal is cited, in accordance with accepted academic practice. No use, distribution or reproduction is permitted which does not comply with these terms.
*Correspondence: Oliver Nakoinz, b2xpdmVyLm5ha29pbnpAdWZnLnVuaS1raWVsLmRl