 Jordi Marti-Henneberg
 Xavier Franch-Auladell
 Jorge Solanas-Jiménez
- University of Lleida, Lleida, Spain
Digital tools, and in particular GIS, have enormously increased the possibilities for analysis in historical geography. In this article, we shall explain how these tools can be used to study the evolution of population density over a significant period. The territorial units used will be municipalities, as they allow detailed territorial analysis. However, research projects that take municipalities as their points of reference tend to be complex because their territorial boundaries have often undergone numerous changes over the course of modern history. The same has occurred, to a greater or lesser degree, in all of the countries in Europe (Bennett, 1989). The countries that have had the most stable municipal boundaries over the past 150 years include France, Italy, and Spain, though the modifications to their boundaries have also been notable. However, like all relevant challenges, these changes also offer us new opportunities, if we are able to cope with them. In this particular case, the challenge will be to achieve the territorial homogenization of the historical municipal series. In other words, when the municipal limits have changed, it will be necessary to adapt the data from the old municipal territories to the new ones. This exercise will have a number of applications. In this article, we present just one of these: the possibility of detecting areas and periods in which, over the course of history, there has been population growth, decline, or stagnation. This will serve as a relevant indicator, or proxy, for organizing research in other fields. For example, in the case of economic history, it is clear that variations in the density of population provide clues for interpreting the territorial distribution of economic activity. We also understand that it will be possible to apply our research about Spain to other countries and that this will make it possible to evaluate the interest and results that we can expect from the homogenized work. We think that, despite its interest, this type of study has, until now, been very rare on account of the methodological difficulties involved. However, these new digital tools in the field of historical GIS, as spatial aggregation and Moran I techniques, have helped to provide solutions to assume this challenge.
Introduction
This work constitutes a contribution to the analysis of long-term patterns of population concentration applied to the case of Spain. The proposed methodology, which is based on the homogenization of both data and administrative units, has made it possible to compare and analyze historical data series spanning a period of 125 years. This work seeks to show how applying spatial analysis techniques to this type of homogeneous data series allows us to make more detailed studies of population patterns within a given territory. The most important conclusions that we reached were that, in Spain, sustained population growth has followed a spatial pattern that has become increasingly consolidated over time. The tendencies observed have produced an uneven distribution of population within the national territory marked by the existence of a series of well-defined, and often very localized, areas that spread beyond the limits of the official administrative boundaries. Using this new methodology, it has been possible to chart these homogeneous areas and to monitor their evolution.
One of the central aspects of historical studies of the growth and concentration of population is that the data must be homogenized. It is only in this way that is it possible to compare the series over an extended period and to carry out a historical study.
In this article, it is relevant to underline the challenge entailed in treating data in a digital format in studies of historical geography, and in the digital humanities in general. Boundaries – whether municipal or of any other type – provide a good example of the digital treatment of historical information. The main challenge is that to calculate growth associated with territorial entities, it is necessary to use a stable base (Burgueño and Guerrero, 2014). Municipal cartography based on the latest census data is normally used as a point of reference, as this is usually the most accurate and it is always available in digital format. Even so, this still implies transferring information to the present administrative geography from units that were different at some time in the past. In population studies, it is necessary to take into consideration all of the population nuclei and to reassign them from an old to a new municipality when their boundaries have changed. This is a time-consuming activity, although one that now has the support of the new instruments of digital cartography.
This task of generating research infrastructure does not always receive the institutional backing that it merits, particularly when we refer to data in the field of the Humanities. As a result, this task has been undertaken in very few countries, although Spain has been one of them (Goerlich et al., 2015). This article is therefore useful for evaluating the potential results to be obtained from investing in infrastructure to provide data like these. In parallel, we have used the results presented in this article to interpret the relationship between changes in population and other factors such as physical geography and railway coverage (Alvarez et al., 2013; Franch et al., 2013a,b). In these works, we have also addressed the question of why these changes in population distribution occurred.
The changes in Spain’s municipal boundaries have basically taken place under three different circumstances, which are presented in Maps 1, 2, and 3: (1) in large cities with expansion projects that have physically absorbed villages around them (here, we present the example of Barcelona), (2) in medium-sized cities that have integrated small neighboring municipalities to form a poly-nuclear municipality (Zaragoza), and (3) in rural areas with low population densities in which a number of small municipalities have merged to form a larger one (Campezo). In all of these cases, municipalities have been suppressed. On the other hand, the creation of new municipalities has been very punctual in recent years and has been motivated by various types of political casuistry.
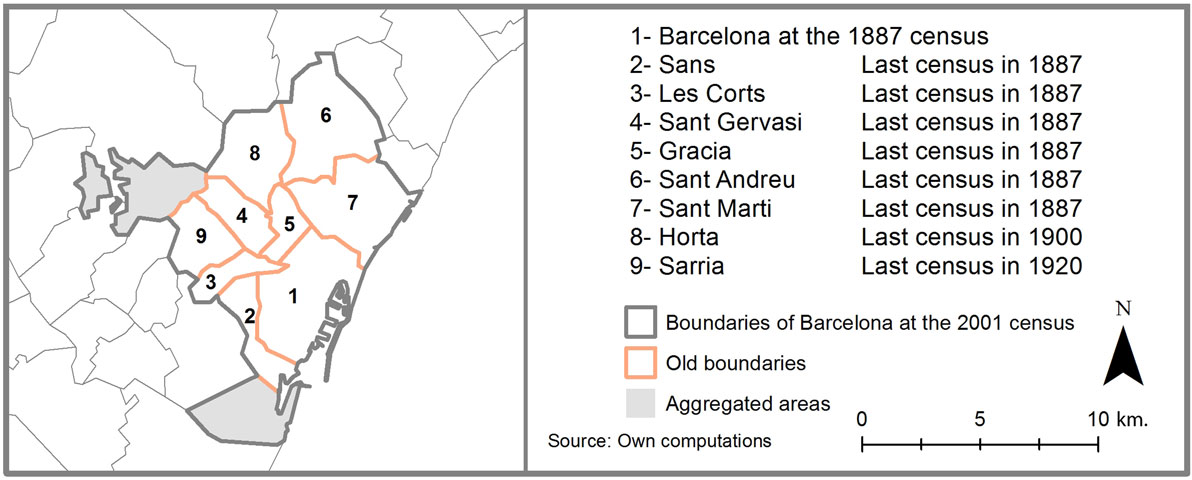
Map 1. Municipal boundary changes in Barcelona.
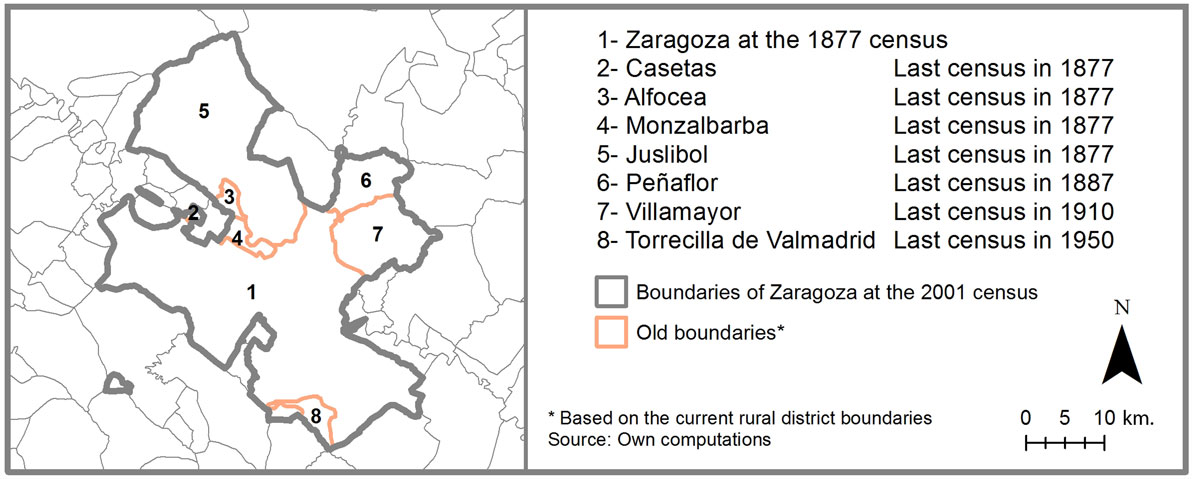
Map 2. Municipal boundary changes in Zaragoza.
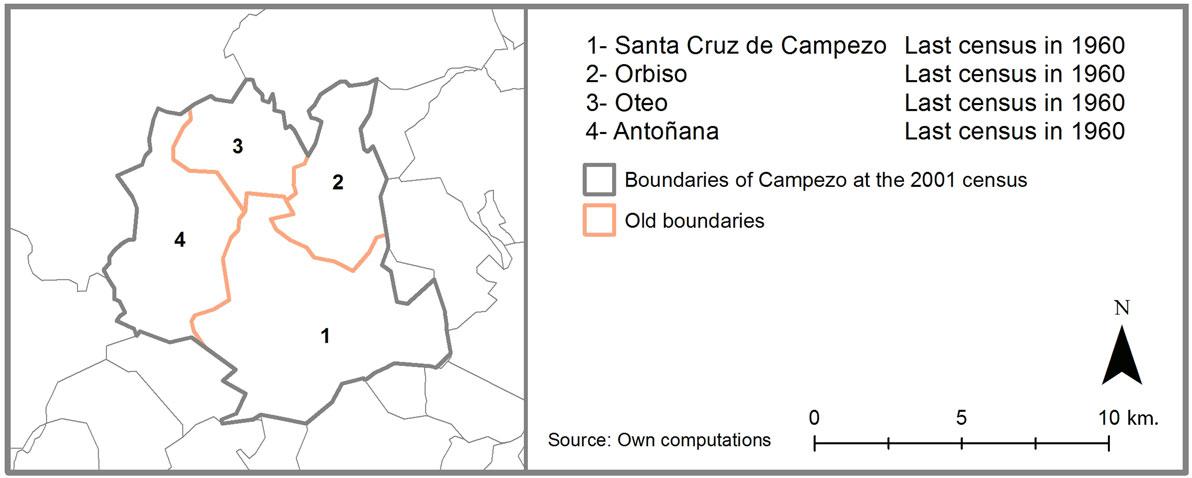
Map 3. Municipal boundary changes in Campezo.
Over the past 125 years, Spain has experienced profound demographic, social, and economic change. The country’s population has multiplied by 2.5, passing from almost 17 million in 1877 to 40 million in 2001. During this period, industrialization became consolidated in almost the whole country and economic growth took place, albeit in a rather uneven way, and affected all levels of life and society. However, these changes took place at different intensities and over time, and their distribution was uneven with respect to the national territory (Goerlich et al., 2007). At the beginning of the twentieth century, the first industries developed slowly, but from the second half of the century onward, Spain’s industrialization increased with ever greater force. With time, Spain’s population concentrated in its biggest cities and industrial areas and also, increasingly along its coast. This trend becomes increasingly evident over time, as does the progressive emptying of municipalities1 with smaller populations, particularly in rural and mountain areas, as a consequence of rural-to-urban migration (Luna, 1988). This process of population concentration, which became even more intensive during the 1960s and 1970s (García-Ballesteros, 1984), has recently been referred to as the “metropolitanization of the population”: a process in which the large urban centers have gained protagonism (Vinuesa, 1996; Nel·lo, 2004; García-Coll, 2005).
Because of this process, the distribution of population settlements in Spain is not evenly shared either across its territory or over time. This has given rise to the existence of areas of high population concentration, while others remain practically deserted. This concentration of population has, to a large degree, been determined by natural and territorial advantages, but it has also been influenced by administrative factors, such as the presence of provincial capitals; this can be seen particularly clearly in the case of Madrid, which is the seat of Spain’s central government (Ades and Glaeser, 1995). It is important not to overlook the scale factor when analyzing these distributions and trying to explain the inequalities present in the spatial distribution of Spain’s population. The studies that have been carried out to date tend to produce different results according to the level of detail, whether regional or municipal, of the data used. Approaches based on the regional level tend to smooth out phenomena related to the distribution of population through a generalization effect; this has been shown at the European level by Martí-Henneberg (2005) and for Spain, by Ayuda et al. (2010). The municipal level allows a more precise analysis, although it requires having access to extensive databases and using advanced computer systems (Gregory, 2005). As a result, the majority of previous studies have focused on cities or on specific regions (Reher, 1986; Vinuesa, 1996). However, although urban municipalities concentrate the majority of Spain’s population, they represent only a small percentage of its territory; as a result, their combined study is of rather limited value and does not allow us to observe patterns that could affect other parts of the territory. With a view to solve these problems, this article seeks to go one step further and to integrate all of the available national data. Other authors have already begun to work along similar lines: examining the distribution of population over the long term and at the municipal level; using Geographical Information Systems (SIG); and applying statistical models (De Cos and Reques, 2005; Goerlich and Mas, 2008).
This article examines the evolution of population in Spain between 1877 and 2001 with the objective of adding a new perspective to this theme. Here, we present the results of spatial analysis based on census data relating to the municipal scale once they have been previously homogenized. The objective is to give a new perspective to study the concentration of population in Spain and to establish a series of spatial patterns that describe its evolution, defining it in terms of both time and territory and based on all of the country’s different municipalities. The article is divided into three subsections. The first explains the origins of the data, its homogenization, and the methodology used. The second presents and analyses the results achieved. In the final section, we present our general conclusions.
Data and Methodology
Data Sources and Homogenization
The source of the data used was the de jure population according to the Spanish censuses from 1877 to 2001.2 Over the period covered by these censuses, we used two calculations of population based on two different criteria. These were the de facto population, which was the number of people who spent the night in the municipality in question on the reference date for the census, and the de jure population, which was computed from the number of people who officially had their place of residence in the municipal area in question on the reference date for the census. In the 2001 census, the de facto population disappeared and a new definition was used: the resident population, which was equivalent to the de jure population according to previous censuses. This explains why we adopted this logic for our historical series.
The second relevant aspect is the geographical homogenization of the data. As mentioned in the previous section, in order to compare the data series, it is necessary to unify the administrative units used as references: the municipalities. During intercensal periods, there are sometimes changes in their number and size, with municipalities being added, fused, or divided. Thus, at the time of the 1877 census, there were 9,314 municipalities, but by 1981 that number had fallen to a minimum value of 8,022. At the 2001 census, Spain had 8,108 municipalities. These variations mean that it is not possible to study the evolution of municipal population using the original data as this would not provide directly comparable cartography.
Our initial database included all of the municipalities that existed from 1877 to 2001, with their respective identification codes, population censuses and the changes that they have undergone over time. The homogenization process consisted of reconstructing the population series used for reference: the municipal structure as of the 2001 census. The methodology used varied according to each type of change that took place. On the one hand, a significant number of municipalities (6,928 or 85.5% of the total) did not undergo any changes during this period; as a result, their data did not require any homogenization treatment. In contrast, other municipalities did experience changes during this period (751 or 9.3% of the total), with cases of total or partial aggregation, fusion, and division. In these cases, population has been assigned on the basis of the municipal thresholds that existed at the time of the 2001 municipal censuses. The other 429 municipalities, which represent only 5.2% of the total, need to be treated separately. In their case, we took the whole series from 1900 to 2001 presented by Goerlich et al. (2006) as our reference and applied analog criteria to extrapolate previous census data for earlier in the nineteenth century. This was possible thanks to the information available in Spain that complements the official census data. This is the “Nomenclator,” or list of names, for each individual inhabited place, which also includes the number of inhabitants. This made it possible to assign the exact population to each area that has passed from one municipality to another. We shall now go on to refer to the use of this information.
This type of homogenization has already been employed in previous works, providing very successful results. The first such case was that of García-Fernández (1985), who used the municipal structure of the 1981 census as the base reference to study the de facto population of Spain’s municipal areas since the beginning of the twentieth century. More recently, Goerlich et al. (2006) recovered this idea of developing a population series for the twentieth century at the municipal scale and also created homogeneous data series based on the municipal structure of the 2001 census and the de jure population. In contrast to these earlier studies, the present study is the first to include the most significant censuses of the nineteenth century. Along these lines, this case study of Spain seeks to serve as a guide for similar work to be conducted. For this to be possible, it depends on both the magnitude of the changes in the administrative geography of each country and on the data that are available. In the former case, it is necessary to consider the country’s administrative history. In the case of Spain, our work was favored by the fact that this is one of the European countries in which the municipal administrative map has undergone the fewest changes. In contrast, in the majority of other European countries, the territorial reforms that have taken place have been very far-reaching, particularly since the 1960s (Bennett, 1989). The second limitation comes in the form of the historical data that are available in digital format. This also varies significantly between countries and preparing, these data are also a time-consuming part of the research process.
The factors described here are the principles that must be taken into consideration when homogenizing data that refer to units that change over time. We consider two ways of doing this. The first is the areal interpolation method (Gregory and Ell, 2007) which was first applied to Britain’s National HGIS project. This methodology requires digitizing the geometry of every spatial unit for the whole period studied. Areal interpolation is then applied to create a standardized set of administrative boundaries. The results offer great potential, but the approach requires dealing with a great number of errors (Gregory and Ell, 2006). Furthermore, the information required to reconstruct boundary changes is not available for any other territories than England and Wales. The second method, which has also been applied, is based on current municipal boundaries. For example, France is the state which is most similar to Spain in terms of the stability of its municipal boundaries. For France, a single directory (Motte et al., 2003) details the changes in each and every one of its 36,565 municipalities. According to this source, boundary changes have affected 823 municipalities (2%). This percentage is considered acceptable for a detailed study like the one conducted in Spain. Each country therefore presents its own political, administrative, and historical characteristics. The characteristics of the cartographical and census data available also vary enormously. As a result, a solution that can be applied in one country cannot automatically be transferred to others. Even so, the analyses that will be detailed for Spain could be used as a guide and help to provide solutions for a large number of other cases.
Methodology for Calculating Population Density and Growth Rates and Carrying Out Spatial Analysis
An initial analysis of the data was undertaken based on the calculation of population density and accumulated annual growth rates. In the first of these cases, the population density was obtained by dividing the total number of inhabitants of a municipality registered in each census by the surface area of the municipality in question, expressed in square kilometers. On the other hand, accumulated annual growth rates were calculated for each intercensal period. This last indicator measures population growth between two census dates according to the following equation:
where ri is the accumulated annual growth rate and n the number of months that have passed between the two censuses expressed in years. Population densities and accumulated annual growth rates were calculated for all Spain’s 8,108 municipalities once a homogenized series of census data had been generated using the methodology described in the previous section. The results obtained using these two indicators are summarized in the first part of the results section.
In the second section, we also study population density in greater detail, using local and global exploratory spatial analysis to evaluate the evolution of the concentration and location of population within the territory. As far as the use of spatial analysis techniques is concerned, we have detailed some of the aspects of the indicators used (Anselin, 1995). Global spatial analysis provides an indicator of spatial association: the Global Moran I, which helps to confirm the spatial autocorrelation of data. The hypothesis that this examines relates to the spatial independence of the variable. According to this hypothesis, there is a homogeneous distribution of the values of the variable over space and therefore the absence of concentrations of high values in very specific areas of the territory and of low values in others. The refutation of this hypothesis would be paramount to confirming the existence of spatial autocorrelation and, in such a case, the next step would be to determine where the highest and lowest values are concentrated within the territory. This stage deals with local spatial analysis and the calculation of the Local Moran I. This is an indicator that allows us to detect clusters that are formed according to the intensity of the variable studied. With the values of the Local Moran I, we can create a series of maps in which we can distinguish: (1) positive spatial autocorrelation, or municipalities with a high value of the variable that are surrounded by municipalities with a high value, or low values surrounded by low values; and (2) negative spatial autocorrelation, or when we have municipalities with values that are significantly different to those of their nearest neighbors; in other words, high values surrounded by low ones, or vice versa. One final consideration is that in order to obtain these spatial indicators, we have to use a criterion that considers relations of proximity between all of the units in a given territory. In general, these criteria were classified according to how they use distance or consider contiguity between these territorial units. This study uses a criterion of contiguity known as second order queen. In this sense, the first order queen criterion considers that a municipality only has as its neighbors other municipalities that share a municipal boundary with it. The second order queen criterion, on the other hand, widens this group to include the neighbors of these first order neighbors. In Spain, there is a considerable heterogeneity in the size of municipalities. The use of this latter criterion of contiguity allows us to increase the number of neighbors that are considered and brings better results.
Finally, it is important to underline the fact that within this article we have detailed a number of results that takes as their point of reference the administrative territories that are currently used in modern-day Spain. For a better understanding of their respective locations, we have included Map 4, which shows the boundaries of Spain’s Autonomous Communities and provinces and their respective capitals.
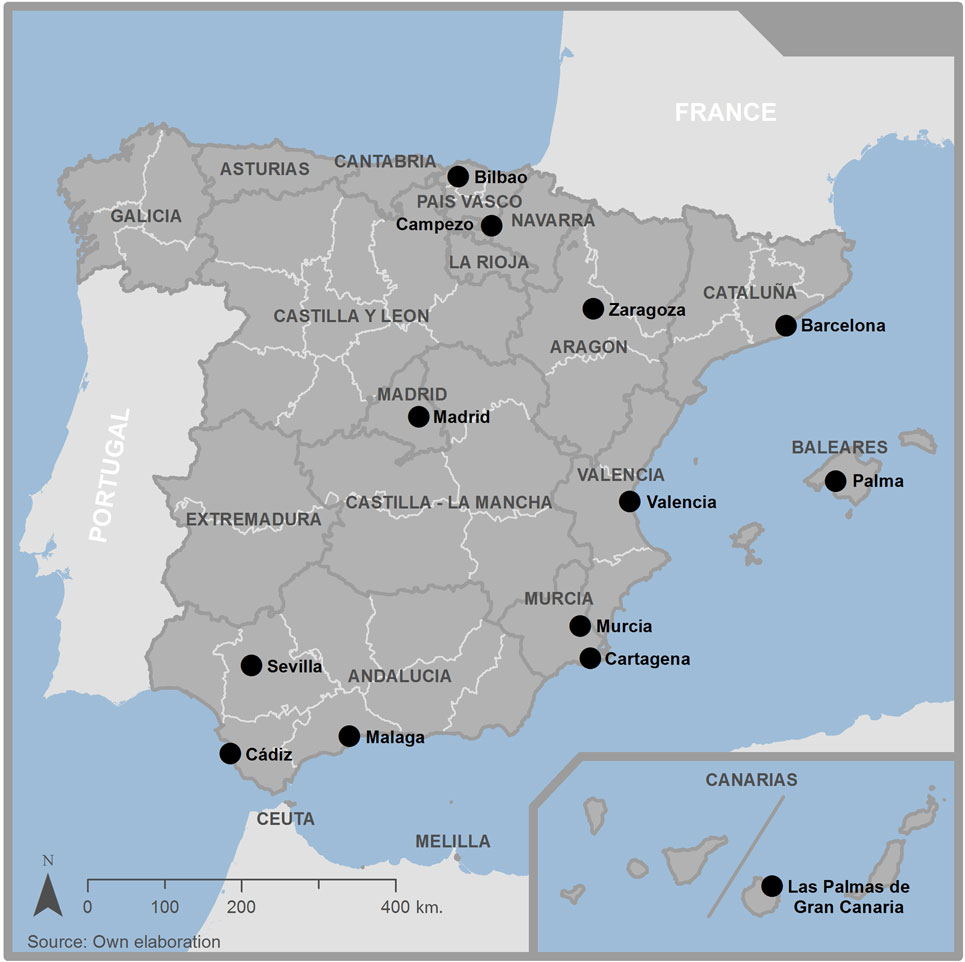
Map 4. Spain and its Autonomous Communities and provinces.
Results
Population Growth in Spain, 1877–2001
Population growth in Spain was constant from 1877 to 2001 (Figures 1 and 2), with the total population passing from 16.7 to 40.8 million. As several other authors have already observed (Vinuesa, 1996; De Cos and Reques, 2005; Goerlich et al., 2006), it is possible to identify a number of different phases within this period. Here, we focus on the following: 1887–1910, 1910–1930, 1930–1950, 1950–1981, and 1981–2001.
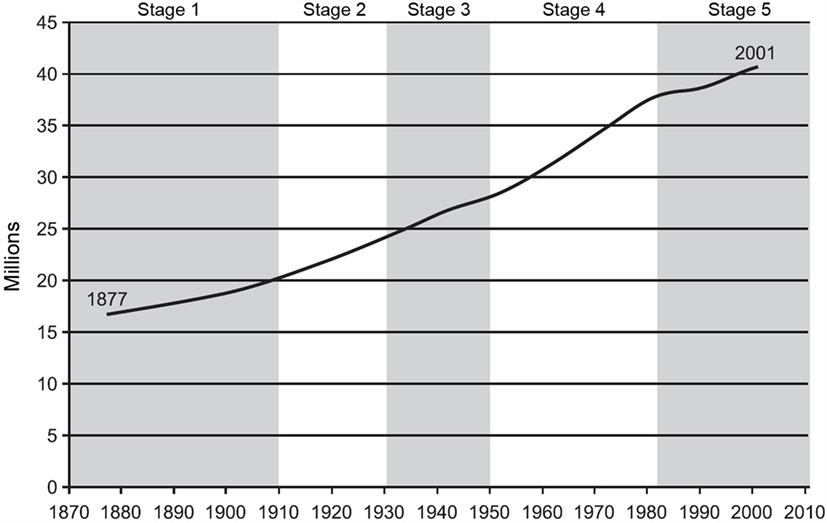
Figure 1. Population growth. Spain, 1877–2001.
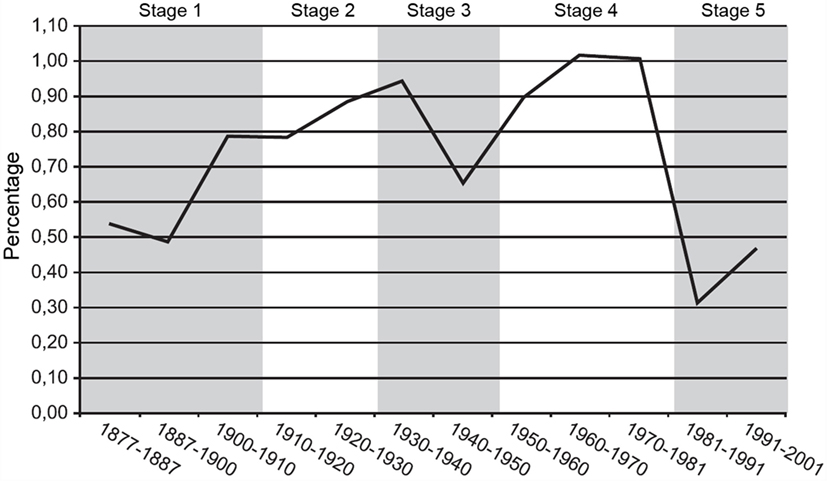
Figure 2. Evolution of the accumulated annual growth rate. Spain, 1877–2001.
During the first phase, Spain’s population increased at a constant rhythm, of up to 22%, reaching 20.3 million people by 1910. The accumulated annual growth rate also increased: from 0.54 to 0.78% by the end of this period. In the second phase, population growth was maintained and the population reached 24 million, and there was also an increase in the growth rate: from 0.78 to 0.88%. During the first intercensal period of the third phase: between 1930 and 1940, the growth rate reached its highest level for these first three phases: 0.94%. Between 1940 and 1950, the rate descended to 0.66% and Spain’s total population in the middle of the twentieth century was 28 million. The fourth phase was one of recovery, with the population rising beyond 30 million and to 40 million by the end of the phase. This was the period with the greatest rates of growth, with a maximum of 1% between the two intercensal periods from 1960 to 1981. Finally, the last two decades corresponded to a period of readjustment and a decrease in the growth rate, although population growth was maintained and the total population had reached 40.8 million by the 2001 census.
However, this general perspective of the evolution of population and the rate of growth does not reflect the stark contrasts that were present at the municipal scale. An initial examination of these changes was obtained through an analysis of the evolution of the percentage of municipalities exhibiting positive accumulated annual growth rates (Figure 3).
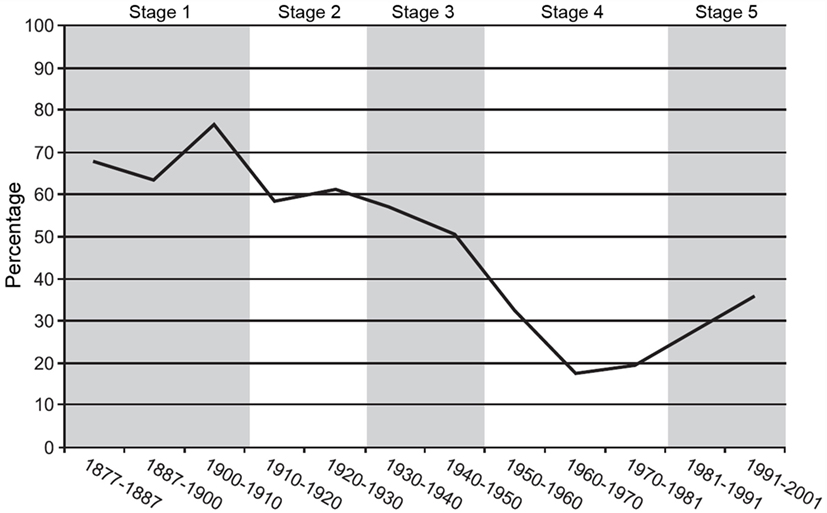
Figure 3. Evolution of the percentage of municipalities with positive accumulated annual growth rate. Spain, 1877–2001.
We can see that during the first intercensal period 68% of Spain’s municipalities had positive growth rates and that this percentage was much smaller toward the end of the period: around 36%. Over the whole period studied, there was a continual descent in the number of municipalities registering population growth, with the decade 1920–1930 being the threshold after which this descent became more significant. Although, as previously noted, this evolution produced a clear downward tendency in terms of the percentage of municipalities exhibiting positive growth, it also confirmed that after eight decades of continuous descent (to 18% between 1960 and 1970), there was a recovery in the last four decades. This change in the general pattern of growth corresponded to a period that was characterized for being a phase of incipient urban sprawl related to demographic growth and the expansion of the metropolitan areas (Nel·lo, 2004).
Map 5 shows the signs for the accumulated annual growth rate during the most significant periods: 1877–1887, 1940–1950, 1960–1970, and 1991–2001. The respective percentages of municipalities with positive intercensal growth during these periods were 68, 50, 18, and 36%.
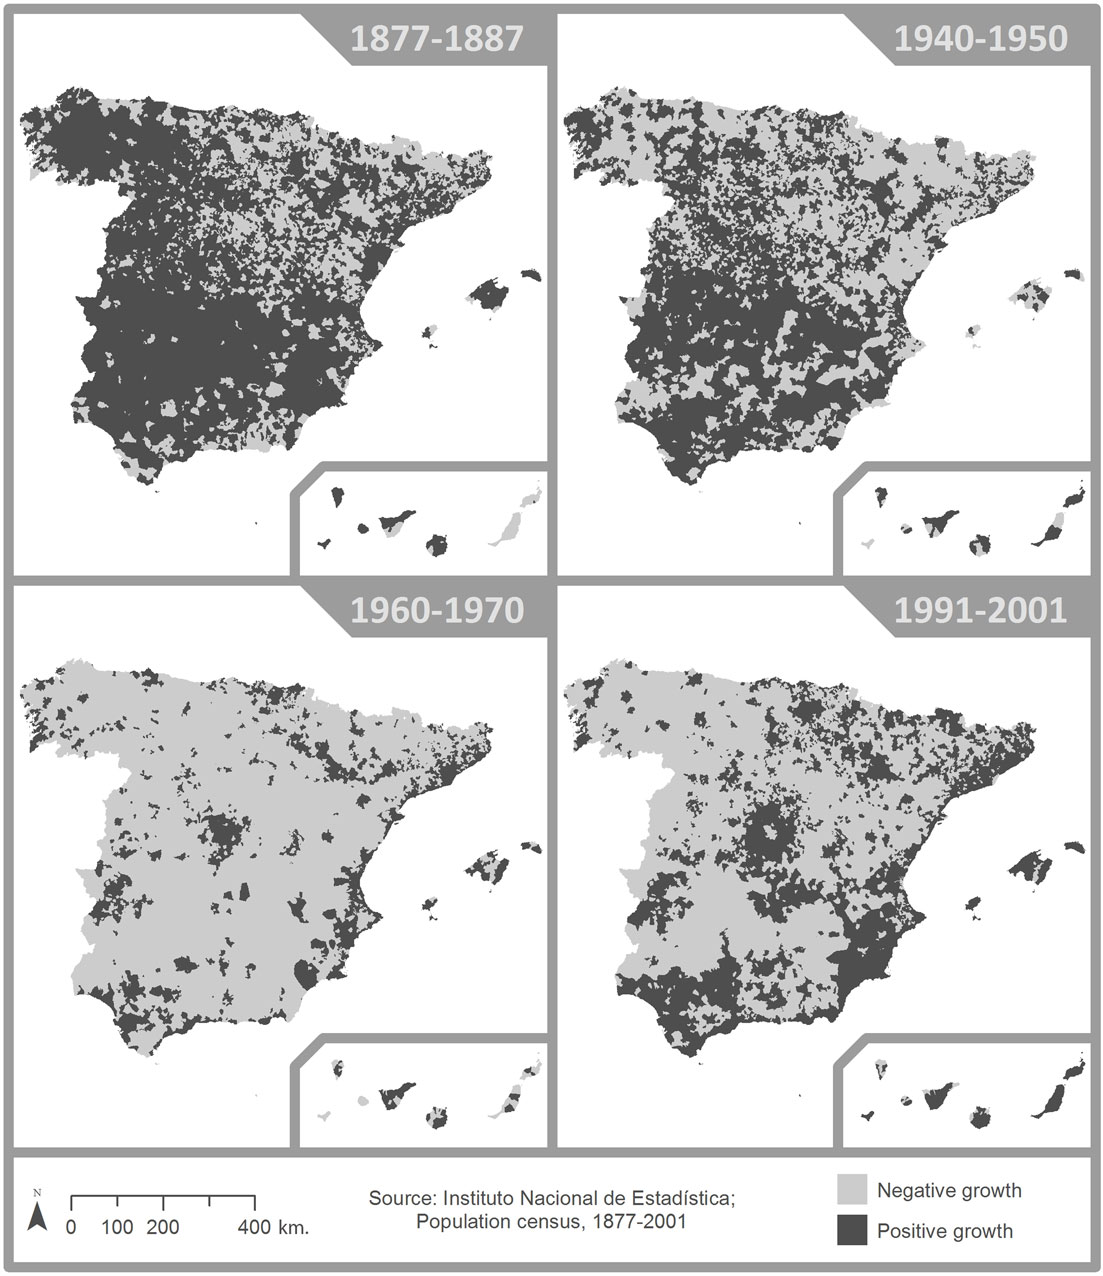
Map 5. Evolution of the sign of accumulated annual growth rate. Spain, 1877–2001.
During the first two phases, growth affected the whole territory. Even so, a larger percentage of growth, over or around 60%, was registered in municipalities with positive growth rates located in the interior and northwest of Spain: Galicia, Asturias, Andalucía, Castilla-La Mancha, and Castilla y León. However, from the 1950s onward, these regions began to exhibit negative growth rates. As this is a large area of territory, we witness a generalized decrease that brought to an end a 90-year process that ran until the 1960s, when growth became restricted to regions like Madrid, the coastal municipalities of Catalonia and Valencia, and the archipelagos of the Baleares and Canarias. Meanwhile, in the center of the Iberian Peninsula (Castilla-La Mancha, Castilla y León, and Extremadura) and in the northwestern regions (Galicia, Asturias, and Cantabria), it is possible to observe a significant reduction in population growth. The final decade confirmed the existence of a new period of generalized growth in the majority of Spanish municipalities, although this was less pronounced than in the first phases. It also coincided with the consolidation of patterns of decentralization from the largest cities and the growth of the metropolitan peripheries. A clear example of this last trend is provided by the negative growth of cities like Madrid and Barcelona, while the municipalities located around them have generally grown in size.
These territorial patterns of the growth rate bore a close relationship with the evolution of population growth over this extensive period and exhibited an evident tendency toward concentration (Map 6). If we take the intercensal periods 1877–1887, 1940–1950, 1960–1970, and 1991–2001 as being representative of the 5 previously cited phases, we observe that in 1877, the 10 most populated municipalities were, in descending order of size: Madrid, Barcelona, Valencia, Sevilla, Málaga, Zaragoza, Murcia, Granada, Cartagena, and Cádiz. The first two of these cities had populations of 419,243 and 344,428, respectively, and accounted for 4.6% of Spain’s total population and their respective population densities were 692 and 3,507 inhabitants/km2. In fact, the total population of these 10 cities only represented 9% of Spain’s officially registered population in that year. The tendency toward increasing concentrations of population at specific locations became all the more evident in subsequent censuses and through to the end of the 1960s. By then, Madrid and Barcelona accounted for 14% of Spain’s population, which was the highest concentration registered, and their respective populations had increased to 3.1 and 1.7 million inhabitants. Furthermore, it was in these years that the 10 most populated cities concentrated the greatest number of inhabitants for the whole study period: 24% of Spain’s total population. After the 1970s, there was a an evident decentralization of population; this was further consolidated in the most recent intercensal period, in which Madrid and Barcelona together accounted for just over 11% of the Spanish population, with 2.9 and 1.5 million inhabitants, respectively, though with respective densities of 4,851 and 15,312 inhabitants/km2. Moreover, according to this last census, after Madrid and Barcelona, the other settlements among Spain’s 10 most populated cities were, in descending rank order: Valencia, Sevilla, Zaragoza, Málaga, Murcia, Las Palmas de Gran Canaria, Bilbao, and Palma de Mallorca. The population of these large cities currently represents 20% of Spain’s total population. In the next section, we propose an approach for analyzing this concentration, and the subsequent process of dispersion, based on a form of territorial analysis that considers the formation of clusters within a given territory. However, we can also state that, in general terms, over the 125-year period that was studied, Madrid, Barcelona, Valencia, and Sevilla were always among the four largest cities in terms of population (with the next positions in the urban hierarchy being occupied by Zaragoza, Málaga, and Bilbao: municipalities whose positions within the ranking varied according to the period considered). However, what happened between 1970 until 2001 constituted a significant change and confirmed a theory that had previously been forwarded by more than one author (De Cos and Reques, 2005): that of dispersal and therefore a loss of population by the capitals and its movement to other municipalities.
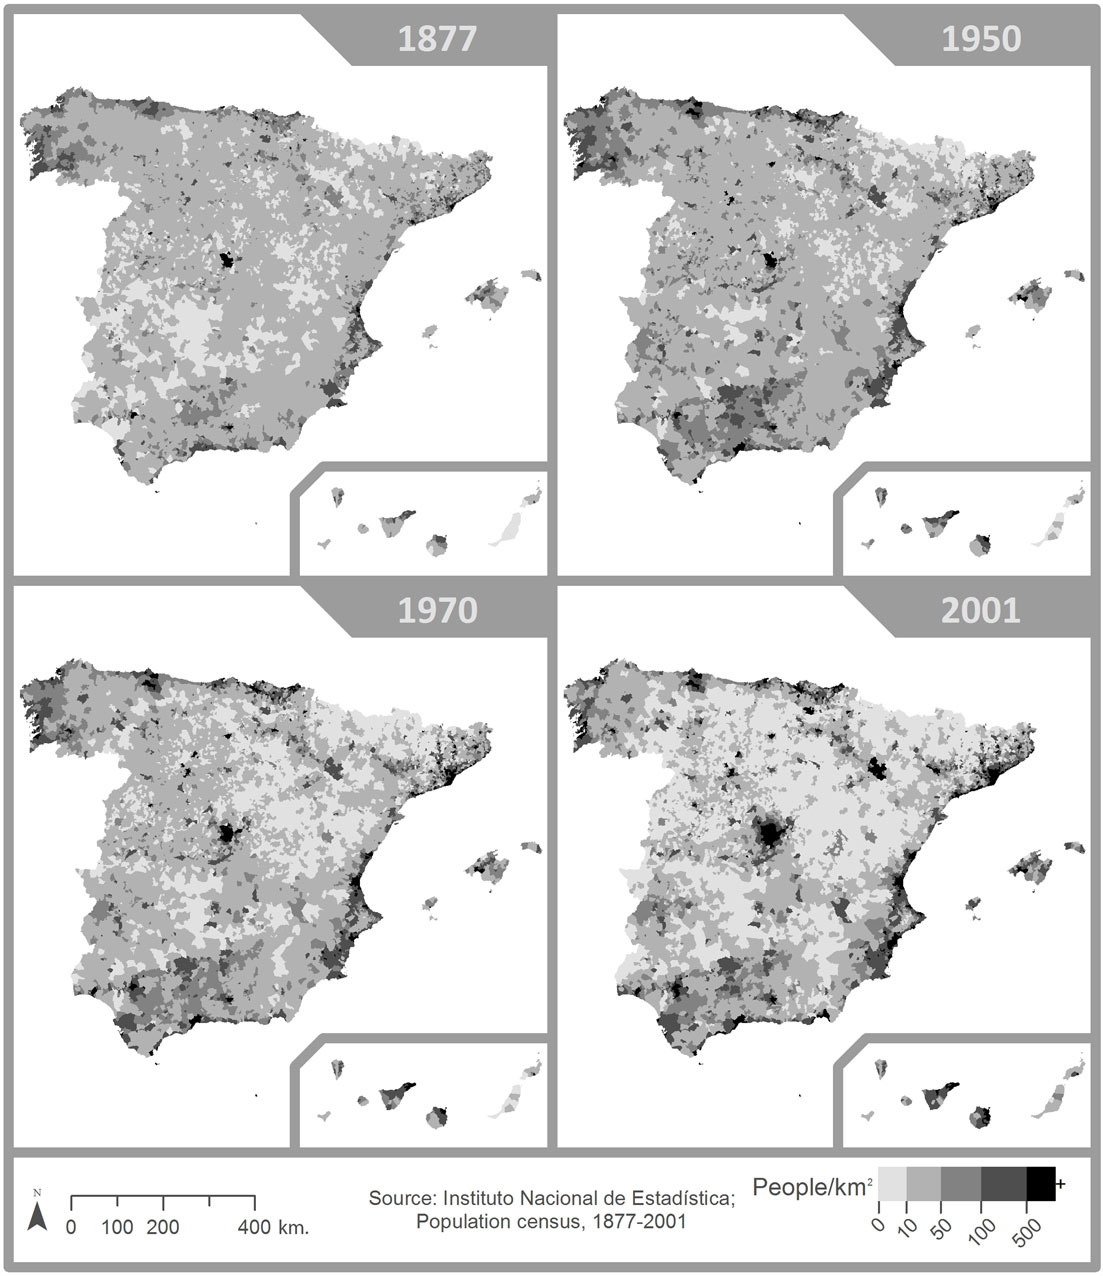
Map 6. Evolution of the population density. Spain, 1877–2001.
Another aspect to take into consideration when studying the evolution of population is the evolution of population density and its territorial patterns. If we look at Map 6, we can observe the evolution of this density over the same periods as the phenomena described in the previous paragraph. Population became progressively concentrated in certain specific areas: along the Mediterranean coast; in the Ebro and Guadalquivir valleys; and in Madrid, the national capital. This is represented on the map by the areas of darker hatching, as explained in the legend of Map 6. In contrast, the predominantly rural interior of the peninsula gradually emptied over time, leaving the area almost unpopulated. It is interesting to observe how, in general, the areas that emptied are the ones that already had low population densities and how those whose populations increased, already started with quite high densities. Following the development of these results, in the next section, we apply spatial analysis to highlight the territorial patterns of population density. We locate the different clusters of population density and show its size and its evolution over time.
The Concentration and Location of Population in Spain, 1877–2001
The homogenization of censuses took the whole surface area of Spain as its base reference: 504,639 km2. This value remained constant throughout the period analyzed. The average population density at the beginning of the study period was 33 inhabitants/km2, but had reached 81 by 2001. However, as previously mentioned, this increase in population density was not evenly spread throughout the territory. The results presented in this section are based on spatial analysis of the population density variable. Figure 4 shows the evolution of the values obtained by calculating the Global Moran indicator of population density from 1877 to 2001.
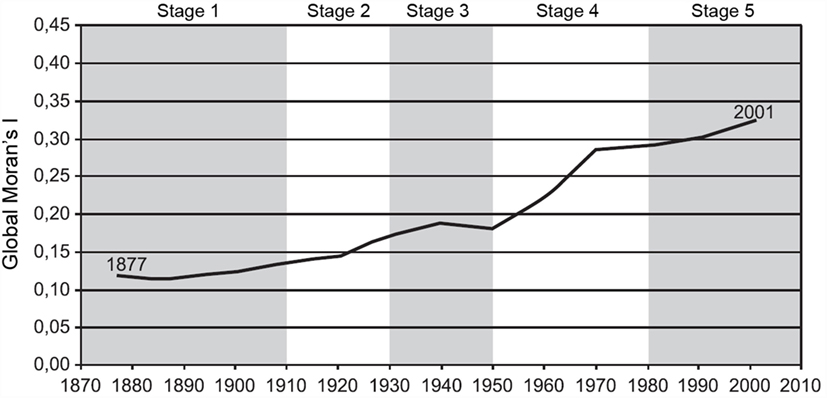
Figure 4. Evolution of the global Moran I indicator of population density. Spain, 1877–2001.
The calculation of this indicator is the first step in spatial analysis and the results obtained allow us to evaluate the spatial autocorrelation of the data available. We obtained significant values for this indicator for all the censuses studied; as a result, it is possible to affirm the existence of a spatial autocorrelation. We also observed a clear increase in Global Moran values over time. Between the first and last censuses, the value of this indicator increased threefold. These results led us to the conclusion that population density followed a well-defined pattern which became increasingly consolidated over time. This is associated with the idea that was mentioned in the previous section. Other important results derived from an analysis of the evolution of the Local Moran I, which is the next path to follow after confirming the existence of spatial autocorrelation. We show here how the percentage of Spain’s municipalities has evolved according to the values of this local spatial indicator (Figure 5) and how this evolution has produced a series of territorial patterns (Map 7).
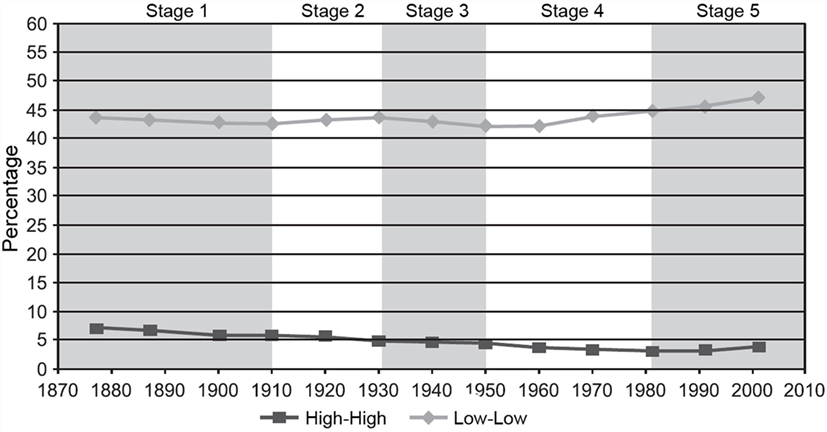
Figure 5. Evolution of the percentage of municipalities according to the values of the local Moran I indicator of population density. Spain, 1877–2001.
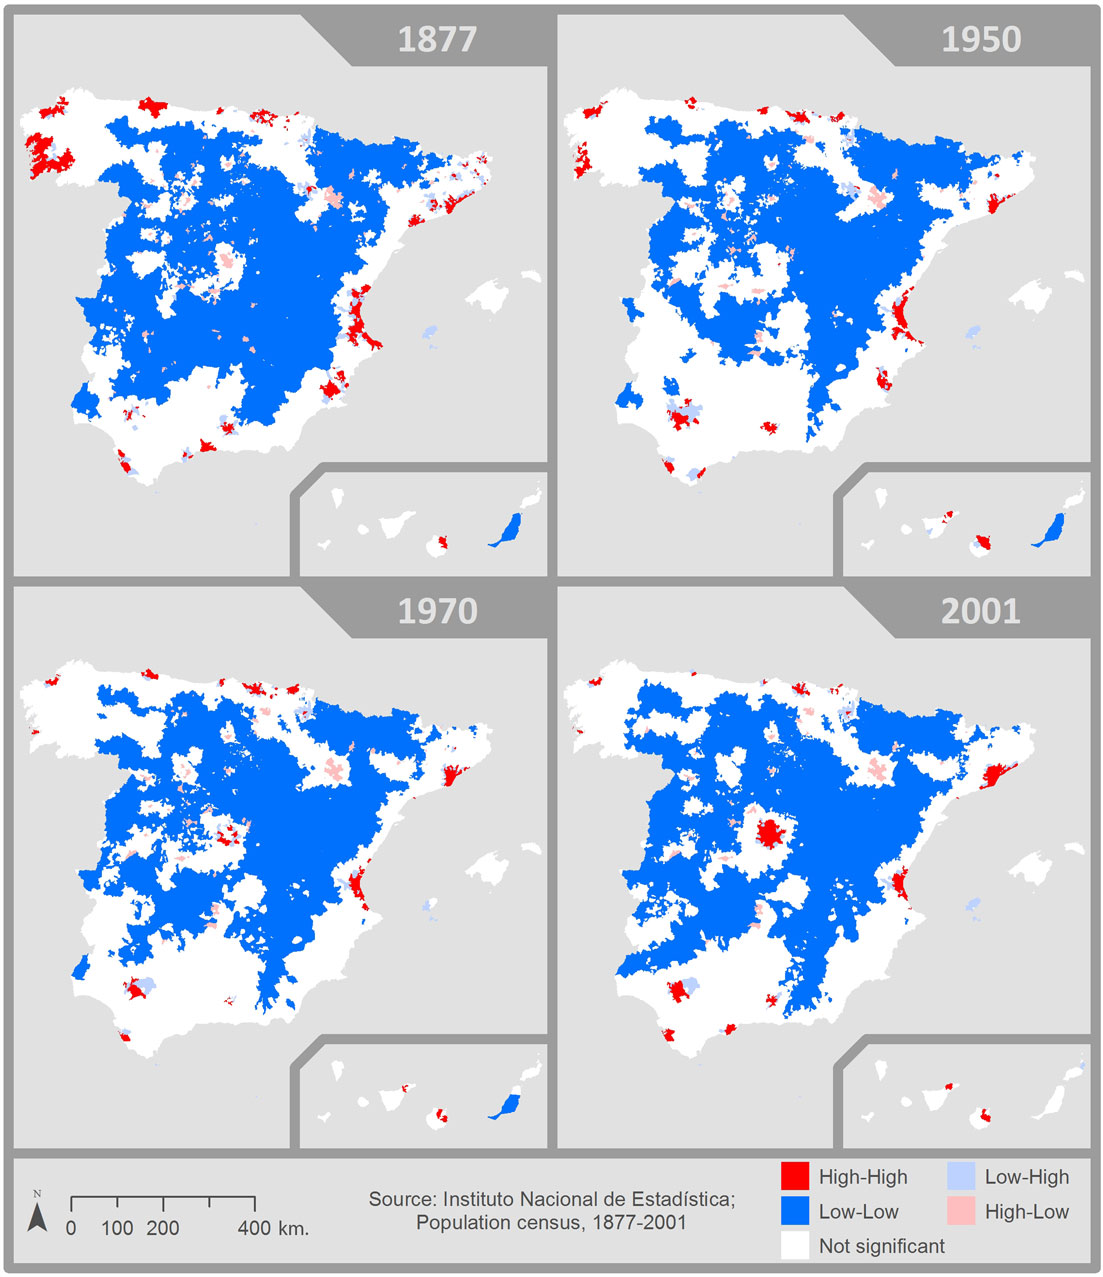
Map 7. Evolution of the Local Moran I indicator of population density. Spain, 1877–2001.
We focused on the cases in which a positive spatial autocorrelation was confirmed. In other words, we looked at those cases in which the value for a given municipality was high and those of its neighbors were too, or when a municipality and its neighbors had low values. We observed that the percentage of Spanish municipalities that formed part of low-density clusters remained above 40% until 1981 and increased to almost 50% in the last two censuses studied. Furthermore, the percentage of clusters formed by municipalities with high population densities was always below 10%. Its initial value, corresponding to the 1877 census, was the highest of all, with 7% of municipalities forming part of these clusters. It has since descended to today’s value of around 4%. We therefore noted a slight increase in the percentage of municipalities with low population densities and a moderate descent in those with high densities. It is therefore evident that over all these years, half of Spain’s national territory continued to have low population densities. This occurred despite the constant growth of the population registered in all the censuses which, as we have already seen, remained stable until the middle of the twentieth century, when 50% of the municipalities registered population growth. The territorial patterns of the rate suggested a tendency toward the concentration of population growth in urban municipalities.
Map 7, where we present the results for the Local Moran I indicator of population density for the years 1877, 1950, 1970, and 2001, provides a vision that is different from what we have previously commented. Here, the years represented coincide with the phases that were studied in the previous section. At first sight, it can be seen that municipalities with low population densities are predominantly located in parts of the territory that hardly experienced any change over the study period and that they occupy a very large area. In fact and again linking in with what we have seen in Figure 4, it can be seen that the majority of the municipalities (over 40%) have maintained low population densities and are located in the northwest and interior of Spain. Low population densities therefore correspond to extensive areas of territory and to whole regions and in many cases these areas spread beyond regional boundaries. Over the 125-year period studied, regions in the north, like Aragón, Navarra, and La Rioja, and in the interior, such as Castilla y León, Castilla-La Mancha, and Extremadura, continued to have a high percentage of low population density municipalities. Castilla y León and Castilla-La Mancha provide good examples of regions in which this percentage has hardly changed over time: it remained at over 70% from 1877 until the most recent census. The case of the Community of Madrid is particularly interesting: in the 1877 census, over 50% of its municipalities had very low population densities, and a century later, at the 1970 census, this percentage still remained at around 35%. It was only in the most recent census (2001) that a change occurred and the municipalities of the interior and those immediately surrounding Madrid (about 22% of the total) became consolidated as densely populated areas. If we analyze the Spanish provinces with the most important capitals, we see that Zaragoza is the only one that has always had more than half of its municipalities with low densities. In fact, its evolution has been very different to those of the other Spanish provinces, as its percentage of low-density municipalities increased over the whole period studied. This was doubtless due to the fact that this province has suffered a process of generalized depopulation, while the population of its capital has significantly increased without entering a subsequent process of dispersion. In contrast, the provinces of Valencia and Vizcaya have always had high percentages of municipalities with high population densities. These two provinces show a similar tendency, which consists of a reduction in the percentage of densely populated municipalities; their percentages both fell from 50% in the 1877 census to 24 and 26%, respectively, in 2001. In Barcelona and Sevilla, on the other hand, the number of municipalities with high population densities has increased over time, but without exceeding 25% of the total. What has happened in Barcelona province can be explained by the significant growth of the municipalities that surround the provincial capital; this is a clear example of a process of conurbation and dispersal from a large city. As a final note, with the data provided by the 2001 census, it is possible to confirm that in Spain, densely populated areas do not occupy a very extensive area of the national territory; they correspond to just 4% of all municipalities and are mainly located around large capitals. Finally, Madrid, Barcelona, Valencia, and Sevilla have all become consolidated as capitals that generate extensive clusters of high population density in their immediate vicinities.
We therefore observed an evolution that allowed us to identify areas of territory that exhibited different types of behavior. The interior regions and those of the northeast of Spain (Aragón, Navarra, La Rioja, Castilla y León, Castilla-La Mancha, and Extremadura) are areas in which the majority of the municipalities experienced positive rates of growth until the middle of the twentieth century, whereas their respective population densities were always among the lowest in about 60% of their municipalities. These regions contain the largest clusters of low population density in Spain and this situation remained almost unchanged over the 125-year period studied. Another important aspect is the fact that in 1877, 20% of Spain’s total population lived in these low-density clusters, while by the 2001 census, this had fallen to only 6%. In other words, Spain’s population largely stopped living in low-density municipalities located on the interior plateau. Moreover, there are a group of three regions in the northwest: Cantabria, Asturias, and Galicia, in which the evolution of the growth rates was similar to that associated with the first type. In other words, these regions initially exhibited positive growth before then showing negative growth over the rest of the period. The great difference between this type and the first one is that here, no large clusters of low-density population were ever observed.
Another case is that of the regions of Catalonia, Community of Valencia, and Basque Country. These areas exhibited a different type of behavior to the rest of Spain due to the fact that their municipalities underwent alternating periods of generalized population growth and population loss. The high population density has not affected many of their municipalities and, as a result, the clusters that have formed have been highly localized and not very extensive, coinciding with the metropolitan areas in these regions. Another important aspect is the fact that in the first census of 1877, 8% of Spain’s population lived in municipalities located in these three communities and formed part of their high-density clusters, which were relatively small in size and highly localized. By 2001, this percentage had risen to 16%. In Andalucía, the tendency was very clear: the situation changed from one of generalized population growth in all of its municipalities during the first seven decades to one of a sustained decrease in population in over half of these municipalities. However, it is not possible to speak of areas of low population density that could be delimited and the areas of high density are reduced to the surroundings of Sevilla, Cádiz, Málaga, and Granada. Finally, we observed that the majority of the municipalities in the Community of Madrid always registered population growth. Since 1877, over 65% of the municipalities in this region have registered positive growth rates. However, this growth did not significantly affect the population density until the most recent period, when 20% of the municipalities were densely populated; even so, it is evident that the percentage of high density municipalities still remained rather low. One last thing to note is that at the last census studied, the population corresponding to high density clusters had raised to 12% of Spain’s total population; this is relevant if we bear in mind that back in 1877 the corresponding percentage was <1%.
Conclusion
A detailed study of the evolution of population based on census data requires the use of a methodology that allows the comparison of historical data series that chart the changes that affect territorial units. In this article, we have presented the results derived from the homogenization of data that we carried out at the municipal scale and which took as its reference the territorial units corresponding to Spain’s most recent population census. This procedure allowed us to obtain a homogeneous historical data series for population between 1877 and 2001. The analysis proposed revealed the existence of spatial patterns that were maintained throughout this extensive period and also other types of pattern that resulted from the changes that took place during certain specific phases. We were also able to confirm that the observed increase in Spain’s population was paralleled by its progressive territorial concentration. This process, which started in the middle of the twentieth century, has been measured and delimited in this paper.
An analysis of the accumulated growth rates shows how population growth was generalized across most of the territory at the beginning of the study period. This tendency was maintained until the beginning of the twentieth century, when Spain entered its first phase of population concentration and its urban areas began to become consolidated. However, by the end of the twentieth century, a new phase was emerging in which it is important to highlight the generalized growth of some municipalities that had not previously experienced significant growth and which then began to grow as a result of population dispersion from the largest cities. These first results therefore confirm what other authors have previously observed with respect to the territorial patterns of Spain’s population.
However, a more accurate spatial analysis of the evolution of population density offers a new perspective. This study has helped to geographically delimit the areas of Spain in which population is distributed according to a series of specific patterns in a statistically significant way. In this respect, the most important results from this analysis confirmed two things that should be highlighted as starting points for future research work that could examine population and its territorial distribution in greater detail. The first conclusion is that during the period from 1877 to 2001 there are several well-differentiated phases that, to a certain degree, coincide with those generally accepted in the existing literature, although in this case, several new functions have been proposed based on the new results obtained. The second important conclusion is that, during each of these phases, it is possible to precisely delimit those parts of the territory in which the distribution of population continued to exhibit a well-differentiated pattern. The product of this analysis is cartography of the areas that exhibit distinctive behavior. For example, throughout the periods analyzed, we found that almost half of the municipalities formed part of clusters in which the density of population was significantly low. This is an important percentage and also one that showed a slight increase from the middle of the twentieth century onward due to the processes of population loss that many municipalities suffered once the process of rural-to-urban migration had become consolidated. These areas were mainly located in the north and interior of Spain; the exceptions to this rule were the municipalities located around Madrid where their evolution consolidated them as an area of high population density from the 1970s onward. On the other hand, we observed that the areas that constituted high density clusters showed a clear tendency to contract, and even, in some cases, to disappear. The number of municipalities that formed part of these areas never exceeded 10% of the total number of municipalities in Spain and their reduction was progressive since the end of the nineteenth century. This is a process that has derived from the tendency for population to locate in specific areas. Among the results obtained, one important fact to highlight is that we can see how the process known as “litoralización” (the drift to the coast) was not the same way along the whole coast and how a reduced number of areas emerged in which the concentration of population was much more significant. These data have opened the door to other research in which the impacts of various different factors have been comparatively analyzed. We have already referred to the work done to study the impact of the railway network and certain aspects of the country’s physical geography. Now, it remains only to explore the relationships between the phenomena described and cultural, political, and economic elements of the country being studied.
Author Contributions
JM-H: data analysis and writing. XF-A: data analysis and writing. JS-J: data analysis, writing, and cartography.
Conflict of Interest Statement
The authors declare that the research was conducted in the absence of any commercial or financial relationships that could be construed as a potential conflict of interest.
Acknowledgments
Partial funding was provided by the Spanish Ministry of Education (CSO2015-65733-P), the EU (Jean Monnet 562390-EPP-1-2015-1-ES-EPPJMO), and ICREA-Academia. This work was done when JM-H was a visiting scholar at the Department of Geography, University of Cambridge.
Footnotes
- ^Basic administrative unit in most European countries.
- ^The census studied were those of: 1877, 1887, 1900, 1910, 1920, 1930, 1940, 1950, 1960, 1970, 1981, 1991, and 2001. We did not include the 1897 census on account of its proximity to 1900, with the latter being of better quality. Similarly, we did not use the censuses of 1857 and 1860 as they do not provide de jure population data.
References
Ades, A., and Glaeser, E. (1995). Trade and circuses: explaining urban giants. Quarterly Journal of Economics 110: 195–228. doi: 10.2307/2118515
Alvarez, E., Franch, X., and Martí-Henneberg, J. (2013). Evolution of the territorial coverage of the railway network and its influence on population growth: the case of England and Wales, 1871–1931. Historical Methods 46: 175–91. doi:10.1080/01615440.2013.804788
Anselin, L. (1995). Local indicators of spatial association-LISA. Geographical Analysis 27: 93–115. doi:10.1111/j.1538-4632.1995.tb00338.x
Ayuda, M. I., Collantes, F., and Pinilla, V. (2010). From locational fundamentals to increasing returns: the spatial concentration of population in Spain, 1787–2000. Journal of Geographical Systems 12: 25–50. doi:10.1007/s10109-009-0092-x
Burgueño, J., and Guerrero, M. (2014). El mapa municipal en España. Una caracterización geogràfica. Boletín de la Asociación de Geógrafos Españoles 64: 11–36.
De Cos, O., and Reques, P. (2005). Los cambios en los patrones territoriales de la población española (1900–2001). Papeles de economía española 104: 167–92.
Franch, X., Marti-Henneberg, J., and Puig-Farré, J. (2013a). Un análisis espacial de las pautas de crecimiento y concentración de la población a partir de series homogéneas: España (1877–2001)*/A spatial analysis of patterns of growth and concentration of population based on homogeneous population censuses: Spain (1877–2001). Investigaciones regionales 25: 43.
Franch, X., Morillas-Torné, M., and Martí-Henneberg, J. (2013b). Railways as a factor of change in the distribution of population in Spain, 1900–1970. Historical Methods 46: 144–56. doi:10.1080/01615440.2013.803414
García-Ballesteros, A. (1984). Cambios y permanencias en la distribución espacial de la población española (1970–1981). Anales de Geografía de la Universidad Complutense 4: 83–105.
García-Coll, A. (2005). Migraciones interiores y transformaciones territoriales. Papeles de Economía Española 104: 76–91.
García-Fernández, P. (1985). Población de los actuales términos municipales 1900-1981. Poblaciones de hecho según los censos. Madrid: Instituto Nacional de Estadística.
Goerlich, F.J., and Mas, M. (2008). Algunas pautas de localización de la población española a lo largo del siglo XX. Investigaciones regionales 12: 5–33.
Goerlich, F.J., Mas, M., Azagra, J., and Chorén, P. (2006). La localización de la población española sobre el territorio. Un siglo de cambios. Un estudio basado en series homogéneas, 1900–2001. Bilbao: Fundación BBVA.
Goerlich, F.J., Mas, M., Azagra, J., and Chorén, P. (2007). Actividad y territorio. Un siglo de cambios. Bilbao: Fundación BBVA.
Goerlich, F.J., Ruiz, F., Chorén, P., and Albert, C. (2015). Cambios en las estructura y localización de la población. Una visión a largo plazo (1842–2011). Bilbao: BBVA.
Gregory, I.N., and Ell, P.S. (2006). Error-sensitive historical GIS: identifying areal interpolation errors in time-series data. International Journal of Geographical Information Science 20: 135–52. doi:10.1080/13658810500399589
Gregory, I.N., and Ell, P.S. (2007). Historical GIS: Technologies, Methodologies and Scholarship. Cambridge: Cambridge University Press.
Luna, G. (1988). La población urbana en España, 1860–1930. Revista de Demografía Histórica 6: 25–68.
Martí-Henneberg, J. (2005). Empirical evidence of regional population concentration in Europe, 1870–2000. Population, Space and Place 11: 269–81. doi:10.1002/psp.373
Motte, C., Séguy, I., and Théré, C. (2003). Communes d’hier. communes d’aujourd’hui: les communes de la France métropolitaine, 1801–2001: dictionnaire d’histoire administrative. Paris: Ined.
Nel·lo, O. (2004). ¿Cambio de siglo, cambio de ciclo? Las grandes ciudades españolas en el umbral del siglo XXI. Ciudad y Territorio Estudios territoriales 141-142: 523–42.
Reher, D.S. (1986). Desarrollo urbano y evolución de la población: España 1787-1930. Revista de Historia Económica 4: 39–66. doi:10.1017/S021261090001418X
Keywords: Spain, GIS, municipality, spatial analysis
Citation: Marti-Henneberg J, Franch-Auladell X and Solanas-Jiménez J (2016) The Use of Digital Tools for Spatial Analysis in Population Geography. Front. Digit. Humanit. 3:9. doi: 10.3389/fdigh.2016.00009
Received: 13 June 2016; Accepted: 05 September 2016;
Published: 22 September 2016
Edited by:
Arianna Ciula, University of Roehampton, UKReviewed by:
Matthew James Phillpott, University of London, UKPatricia Murrieta-Flores, University of Chester, UK
Copyright: © 2016 Marti-Henneberg, Franch-Auladell and Solanas-Jiménez. This is an open-access article distributed under the terms of the Creative Commons Attribution License (CC BY). The use, distribution or reproduction in other forums is permitted, provided the original author(s) or licensor are credited and that the original publication in this journal is cited, in accordance with accepted academic practice. No use, distribution or reproduction is permitted which does not comply with these terms.
*Correspondence: Jordi Marti-Henneberg, bWFydGkuaGVubmViZXJnQGdlb3NvYy51ZGwuZXM=