 R. Rossini1,2,3*
 G. Baldazzi4,5S. Banfi6M. Baruzzo7R. Benocci6,8R. Bertoni6
 M. Bonesini6,9
 S. Carsi6,10D. Cirrincione7,11M. Clemenza6L. Colace12,13A. De Bari1,2C. De Vecchi2E. Fasci14,15R. Gaigher6
 L. Gianfrani14,15A. D. Hillier3K. Ishida3,16P. J. C. King3J. S. Lord3R. Mazza6A. Menegolli1,2E. Mocchiutti7S. Monzani7,11L. Moretti14,15C. Petroselli6,10C. Pizzolotto7M. C. Prata2
 M. Pullia2,17L. Quintieri3R. Ramponi18,19M. Rossella2A. Sbrizzi5G. Toci20L. Tortora13E. S. Vallazza6
 K. Yokoyama3A. Vacchi7,11
- 1Department of Physics, University of Pavia, Pavia, Italy
- 2Sezione di Pavia, Istituto Nazionale di Fisica Nucleare (INFN), Pavia, Italy
- 3ISIS Neutron and Muon Source, Science and Technology Facilities Council (STFC), Didcot, United Kingdom
- 4Department of Physics “A. Righi”, University of Bologna, Bologna, Italy
- 5Sezione di Bologna, Istituto Nazionale di Fisica Nucleare (INFN), Bologna, Italy
- 6Sezione di Milano-Bicocca, Istituto Nazionale di Fisica Nucleare (INFN), Milan, Italy
- 7Sezione di Trieste, Istituto Nazionale di Fisica Nucleare (INFN), Trieste, Italy
- 8Department of Earth and Environmental Sciences (DISAT), University of Milano-Bicocca, Milan, Italy
- 9Department of Physics “G. Occhialini”, University of Milano-Bicocca, Milan, Italy
- 10Department of Science and High Technology, University of Insubria, Como, Italy
- 11Department of Mathematics, Computer Science and Physics, University of Udine, Udine, Italy
- 12Department of Engineering, University of Roma Tre, Rome, Italy
- 13Sezione di Roma Tre, Istituto Nazionale di Fisica Nucleare (INFN), Rome, Italy
- 14Department of Mathematics and Physics, University of Campania “Luigi Vanvitelli”, Caserta, Italy
- 15Sezione di Napoli, Istituto Nazionale di Fisica Nucleare (INFN), Naples, Italy
- 16RIKEN Nishina Center, Saitama, Japan
- 17Centro Nazionale di Adroterapia Oncologica (CNAO), Pavia, Italy
- 18Sezione di Milano, Istituto Nazionale di Fisica Nucleare (INFN), Milan, Italy
- 19Istituto di Fotonica e Nanotecnologie (IFN), Consiglio Nazionale delle Ricerche (CNR), Milan, Italy
- 20Istituto di Nazionale di Ottica (INO), Consiglio Nazionale delle Ricerche (CNR), Florence, Italy
FAMU is an INFN-led muonic atom physics experiment based at the RIKEN-RAL muon facility at the ISIS Neutron and Muon Source (United Kingdom). The aim of FAMU is to measure the hyperfine splitting in muonic hydrogen to determine the value of the proton Zemach radius with an accuracy better than 1%. The experiment has a scintillating-fibre hodoscope for beam monitoring and data normalisation. In order to carry out muon flux estimation, low-rate measurements were performed to extract the single-muon average deposited charge. Then, detector simulation in Geant4 and FLUKA allowed a thorough understanding of the single-muon response function, which is crucial for determining the muon flux. This work presents the design features of the FAMU beam monitor, along with the simulation and absolute calibration measurements in order to enable flux determination and enable data normalisation.
1 Introduction
The aim of the FAMU experiment (Pizzolotto et al. (2020); Vacchi et al. (2023); Rossini et al. (2024a)) is to explore the magnetic structure of the proton through a measurement of the proton Zemach radius (Carlson (2015); Antognini et al. (2022)). The latter is extracted from a measurement of the hyperfine splitting energy of the muonic hydrogen (
A beam hodoscope, composed of two planes of 32 scintillating fibres read out by silicon photomultipliers (SiPMs), has been set up for the experiment. The specific design of this detector, discussed in Section 2, is the best match among the number of available channels (64), the detector area, and its thickness. Other detector designs, such as muon cameras (Lord et al. (2011)), were avoided in order to minimise the amount of material immersed in the beam, as the beam monitor is expected to stay in the beam for the duration of the experiment. Similar detectors for higher rates and continuous beams are being developed at other muon facilities, such as PSI (Papa et al. (2015); Papa et al. (2019); Dal Maso et al. (2023)). The hodoscope serves both as a beam shape detector to optimise beam centring and focussing and as a flux meter. The latter role of the detector is made possible thanks to the analyses reported in this work.
The estimated average negative muon flux with a momentum of 55 MeV/c is on the order of
Initially, data from cosmic muon calibrations combined with Particle Data Group (PDG)
Then, a 1-mm pitch hodoscope with adjacent fibres (Hodo-1) was calibrated at the CNAO synchrotron in Pavia (Italy) with a low-rate proton beam with energy loss
The latest FAMU hodoscope (Hodo-4), that is, the position-sensitive muon beam monitor detector, is here thoroughly discussed. The design of the detector, discussed in Section 2, fits best with the number of available channels (64) and the required thickness, active area, and space resolution. It is composed of 1 mm fibres, spaced by 1 mm. The simulation and tests of the detector are presented in this work. Calibration measurements were carried out in the FAMU setup, exploiting the RIKEN-RAL Port1 muon beam with a modified configuration to obtain a low-rate muon beam, as later explained in Section 3. This has been crucial in order to disclose single-particle signals. In addition, the detector has been simulated in Geant4 (Agostinelli et al. (2003)) and Flair-FLUKA (Battistoni et al. (2015); Ahdida et al. (2022); Vlachoudis (2009)) to understand its response and extract crucial parameters and information for its calibration.
The equation to extract the muon rate from the hodoscope reading is the following:
where
Simulation, measurements, and analysis techniques are presented in Sections 3, 4 and 5, whereas the results are extensively presented and discussed in Section 6. Eventually, the value of
2 Design of the 1-mm hodoscope (Hodo-4)
A
Previous hodoscope versions (Carbone et al. (2015); Bonesini et al. (2019); Rossini et al. (2023b); Rossini et al. (2023a); Rossini et al. (2024b)) had either too much material immersed in the beam (

Figure 1. Hodoscope without its cover. The interspaced scintillating fibres are clearly visible in the middle (white). The internal printed circuit boards hold the SiPMs, and they are connected by stripes to the external ones, holding the 64 micro coaxial connectors (MCXs, signals) and 4 LEMO (bias supply) connectors.
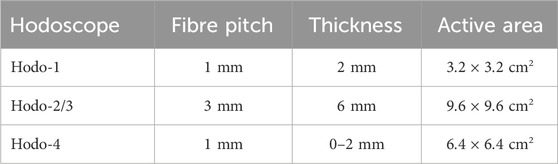
Table 1. Comparison among the various models of
This model of the hodoscope has been considered the best compromise among all features, and it has, therefore, been installed in the final FAMU setup for 2023 and 2024 runs. Consequently, carrying out single-particle calibration was crucial for its operation in the FAMU experiment. The position of the hodoscope in the FAMU setup is shown in Figure 2.
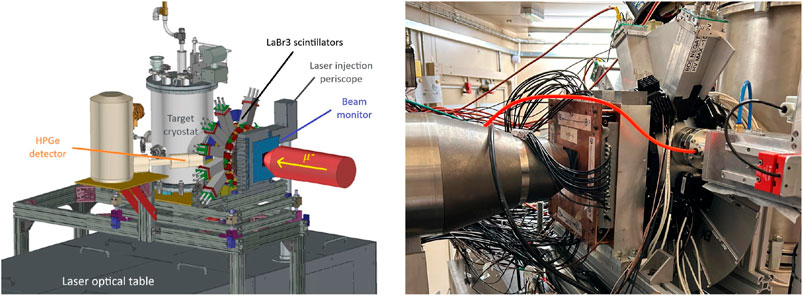
Figure 2. FAMU in the 2023 setup. The picture on the left shows a CAD scheme of the target and detector system in the 2023 setup: the hodoscope (beam monitor) is positioned just after the muon beamline collimator, whereas all other detectors (LaBr3 and HPGe) are positioned around the gas target. On the right is shown a picture of the setup, where the hodoscope (copper-shielded detector) is in a close-up view. Figures taken from Rossini et al. (2024b).
Each fibre is read out by a
3 Hodoscope measurements at RIKEN-RAL Port1
The FAMU experiment is installed at the RIKEN-RAL Port1 muon beamline at the ISIS Neutron and Muon Source in Didcot, United Kingdom. The experiment consists of a pressurised cryostat holding
The ISIS synchrotron accelerates protons with an energy of 800 MeV with a pulse rate of 50 Hz. Four consecutive pulses are sent to Target Station 1 (TS1), and one is sent to Target Station 2 (TS2). The graphite target for muon beamlines is located in the beampipe connecting the synchrotron to TS1. Hence, it receives protons and produces muon pulses at the same rate as TS1 (
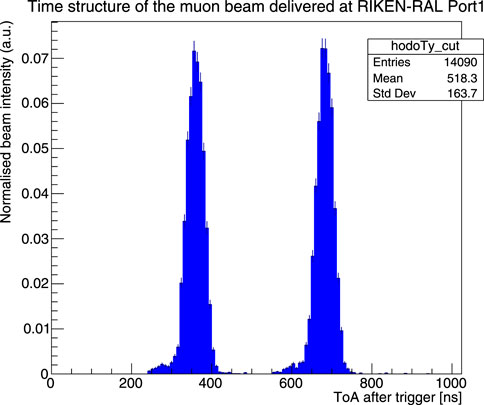
Figure 3. Time structure of the muon beam for each trigger. This normalised histogram has been measured by the FAMU hodoscope at a low rate, but the time structure holds for a high rate as well.
3.1 High-rate measurements at RIKEN-RAL
The beam is generally set to work at the highest available rate. At the momentum value used in FAMU, the average rate is the order of
After that, two FAMU data-taking runs were carried out in October 2023 (6 beam days, RAL202305) and December 2023 (12 beam days, RAL202306).
3.2 Low-rate measurements at RIKEN-RAL
After carrying out some tests with protons at the CNAO synchrotron in Pavia (Rossini et al. (2024b)), it was decided to characterise the current hodoscope directly on the FAMU setup as its particular design was expected to be more sensitive to beam geometry changes.
In order to obtain a single-particle beam, the currents of some quadrupole and bending magnets were de-tuned to minimise the amount of pions directed in the beampipe. In particular, the first two quadrupoles (RQ1 and RQ2) were turned off to widen the pion bunch, and the first bending magnet (RB1) was de-tuned to direct the beam halo, rather than its central part, into the beampipe. See Figure 4 for a detailed map of the path followed by the beam from the target to Port1, including the magnets encountered. The choice of which magnets had to be tuned was made to not compromise the beam optics, which would result in not delivering the beam to Port1. The shut-down of the two quadrupoles resulted in a
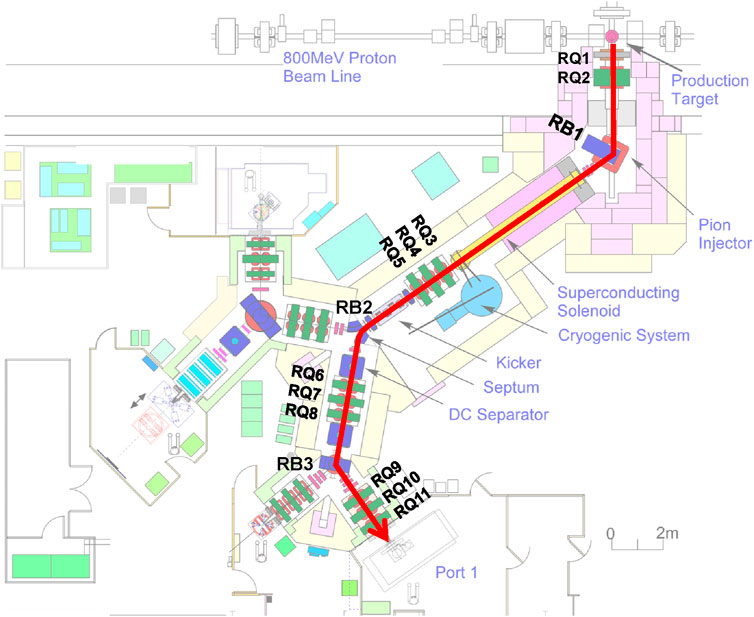
Figure 4. Path followed by the negative muons (red arrow) from the graphite target to Port1, where the FAMU target and detectors are located. The quadrupole (RQ) and bending magnets (RB) implied in the delivery of muons to FAMU are labelled. Adapted from https://www.isis.stfc.ac.uk/.
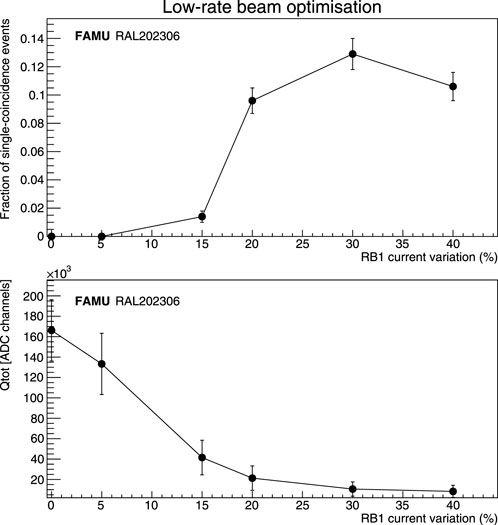
Figure 5. Optimisation of the RB1 current to obtain the low-rate configuration. The upper panel shows the fraction of events selected as single-particle events as a function of the RB1 current displacement, while the lower one shows the related decrease of
The low-rate data acquisition RAL202306 consisted of several hours of beam optimisation and final
4 Data analysis
The data analysis technique, described in Figure 6, is based on imposing single coincidences between each detector plane.
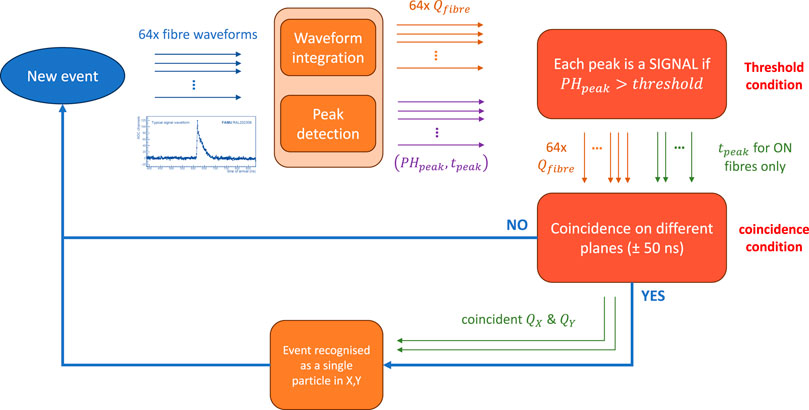
Figure 6. Scheme of the coincidence data processing workflow, described in Section 4, to select events with a single muon interacting with both detector planes (2-hit data).
For each beam trigger, the FAMU DAQ system opens an acquisition window and digitises the signals coming from each hodoscope channel at a rate of 1 G/s. The resulting data packet is called an event. In the previous analysis procedure, extensively described and tested by Rossini et al. (2024b), an event was considered a single-particle hit if only one fibre per plane had integrated charge over a given threshold. This method has been considered valid as the hodoscopes had no interspacing, and the measurements were particle-triggered. This means that most muons arrived at the same time (given the fixed pre-trigger window) and passed by one fibre per plane. However, in this case, the trigger comes from the synchrotron, and the full-rate beam shape is complex (every synchrotron trigger corresponds to two
During data processing, for each event and for each hodoscope fibre
The value of total deposited energy for every event is the sum on all fibres of the integrated charge
having five free parameters: additive constant
The value obtained by analysing the data taken at RIKEN-RAL with low-rate muons is
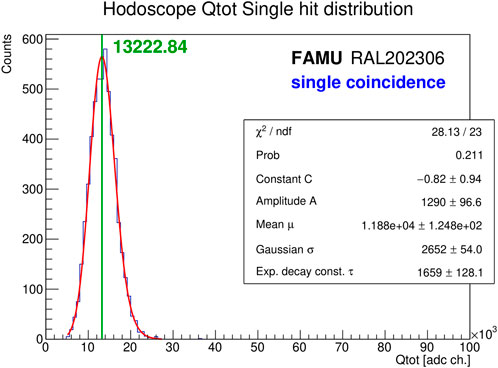
Figure 7. Determination of
5 Hodoscope simulation
In order to understand the energy loss of muons in the detector and, therefore, its theoretical response function, the hodoscope has been simulated using the Geant4 (Agostinelli et al. (2003)) toolkit. The geometry consists of the fibres, coatings and entrance windows as described in Section 2; that is, each fibre (polystyrene, 1 mm pitch, 6.4 cm length) is coated with a 15
The muon beam simulated for this work is a 55 MeV/c negative muon beam with 2-dimensional Gaussian shape, with
In order to obtain an uncertainty budget, all simulations were repeated with Gaussian dispersion of momentum (
All primaries have been tracked and assigned flags depending on whether they passed by front and back plane fibres. In fact, given the geometry of the hodoscope, muons can pass by zero, one, or two fibres. The contributions of these muons are plotted separately and also jointly in Figure 8. In the zero-hit case, the energy deposit different from zero in some events is caused by secondary particles (e.g., delta rays generated in the coating and decay electrons) interacting with the fibres. The probability of hitting zero, one, or two fibres is about 25%, 50%, and 25%, respectively, as one can derive from geometrical considerations from Figure 9. However, the exact values of
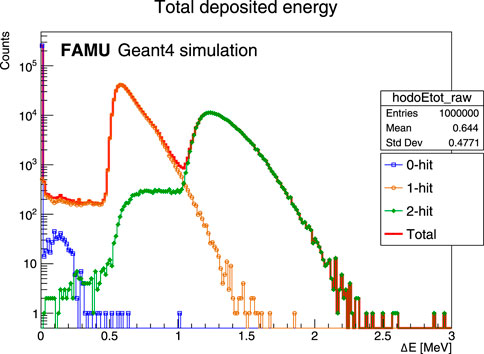
Figure 8. Geant4 simulation (
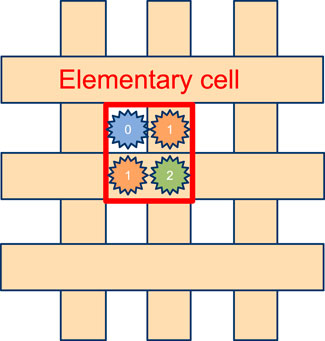
Figure 9. Graphical representation of the hodoscope subdivision in elementary cells (red). As one can derive from the scheme, assuming uniform flux, muons can interact with either zero (blue), one (orange), or two fibres (green) with probabilities of
In the Geant4 simulation,
In addition, the ratio
The estimate for the ratio between the double-hit and the single-hit mean deposited energy is
In parallel, an independent simulation based on the FLUKA-CERN (Battistoni et al. (2015); Ahdida et al. (2022)) toolkit was also developed using the Flair interface (Vlachoudis (2009)) for comparison (reported just as FLUKA in this work, for simplicity). The FLUKA simulation has been modelled to match the exact geometry and beam characteristics with the one in Geant4. The geometric factors determined with the FLUKA simulation with the same number of events
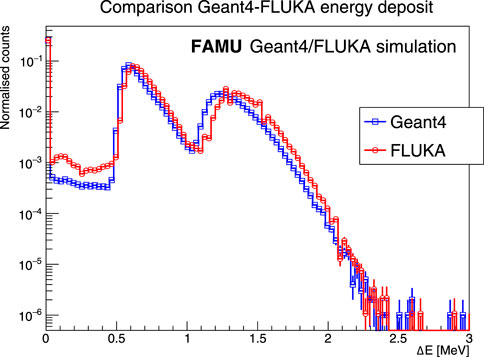
Figure 10. Comparison of Geant4 (blue squares) and FLUKA (red circles) simulated energy deposited in hodoscope fibres (
The FLUKA simulation was also used to estimate effective backscattering, that is, the fraction of particles interacting with one fibre in the first plane, one in the second plane, and then one back in the first plane, as a result of backscattering. Ideally, this value should be minimal for better hodoscope accuracy. The effective backscattering rate is
All the useful parameters extracted from Geant4 and FLUKA simulations are reported in Table 2. The coefficients for Eq. 1 used in this work for flux estimation are taken from the Geant4 simulation because the applied physics lists and transport thresholds had already been tuned and validated for the FAMU experiment.
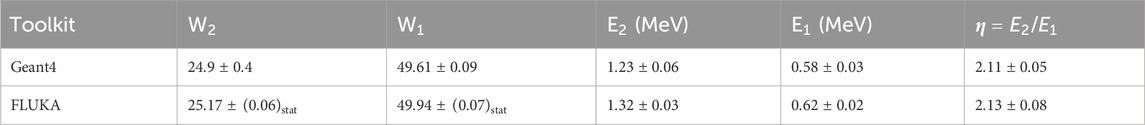
Table 2. Comparison between parameters estimated by the Geant4 and FLUKA simulations with
Figure 11 shows some 2D distributions obtained using the Flair interface to FLUKA-CERN. In particular, the first row shows the probability density for the particles present in the simulation (primary muons, decay electrons, and photons/electrons resulting from elastic and inelastic processes). The second row shows the space distribution of the energy deposition, which is higher in the detector fibres than in air, reflecting the Gaussian shape of the beam on the
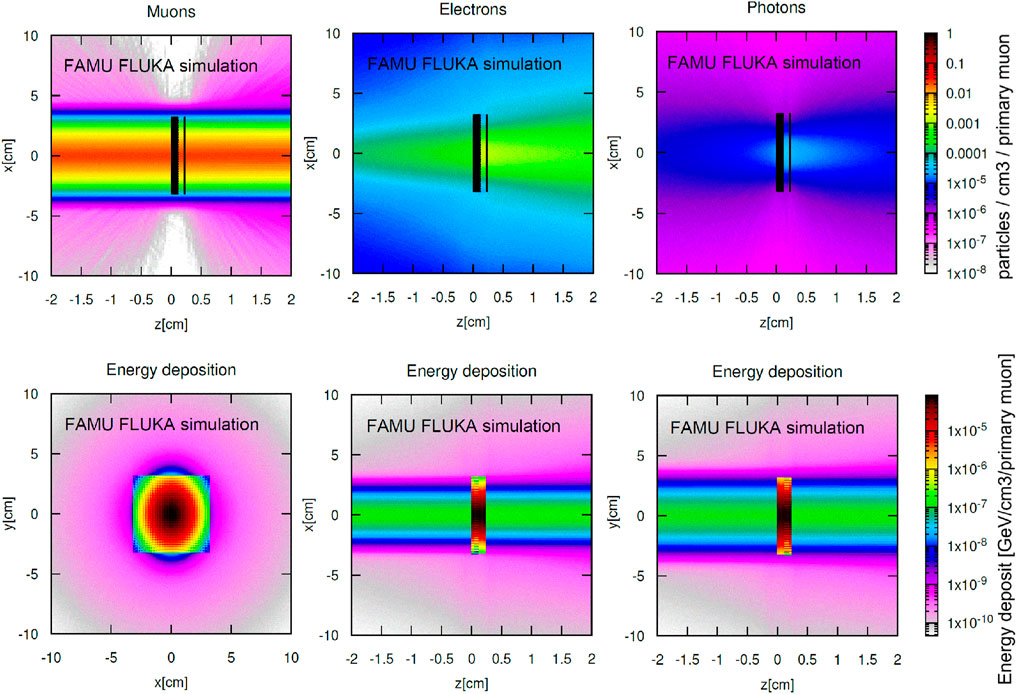
Figure 11. 2D distributions extracted from the Flair interface to the FLUKA simulation. The muon beam runs along the
6 Results
Following the procedures explained in the previous sections of this work, it has been possible to estimate the values of
Fitting the full-rate beam histogram of the charge deposited in the hodoscope in each muon spill with a Gaussian profile (see Figure 12) made it possible to extract the average value of
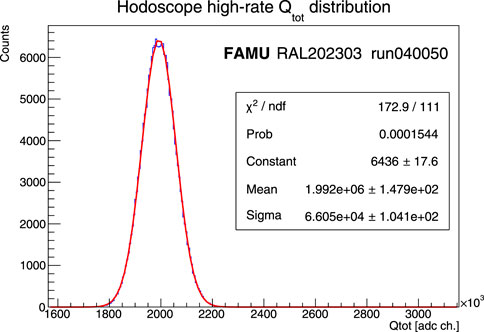
Figure 12. Extraction of average
By extracting weighing factors for
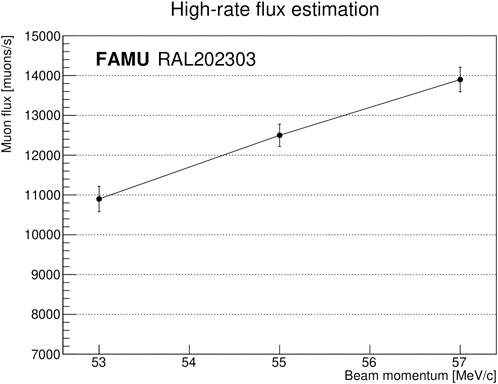
Figure 13. Estimation of muon flux from three values of beam momentum. The correction factor for the value of
7 Conclusion
A full calibration protocol for a beam hodoscope that will be used as a flux monitor has been explained, applied, and tested.
When the beam repetition rate
This protocol can be applied to similar detectors to use them for the same particle counting task in cases where single-particle discrimination is not possible.
This procedure can be carried out with any scintillating fibre-based hodoscope that will be used as a muon beamline monitor with various applications. For example, muonic atom X-ray spectroscopy (
Data availability statement
The raw data supporting the conclusions of this article will be made available by the authors, without undue reservation.
Author contributions
RRo: conceptualization, data curation, formal analysis, investigation, methodology, resources, software, supervision, validation, visualization, writing–original draft, and writing–review and editing. GB: methodology, resources, and writing–review and editing. SB: resources and writing–review and editing. MB: resources and writing–review and editing. RBn: resources and writing–review and editing. RBr: resources and writing–review and editing. MB: resources, writing–review and editing, funding acquisition, investigation, and supervision. SC: resources and writing–review and editing. DC: resources and writing–review and editing. MC: resources and writing–review and editing. LC: resources and writing–review and editing. AD: resources and writing–review and editing. CD: resources and writing–review and editing. EF: resources and writing–review and editing. RG: resources and writing–review and editing. LG: resources and writing–review and editing. AH: investigation, methodology, resources, writing–review and editing, and supervision. KI: resources, writing–review and editing, investigation, and methodology. PK: resources and writing–review and editing. JL: resources, writing–review and editing, investigation, methodology, and validation. RM: resources and writing–review and editing. AM: conceptualization, investigation, methodology, resources, supervision, writing–review and editing, validation, and visualization. EM: resources, writing–review and editing, conceptualization, data curation, investigation, methodology, project administration, software, and supervision. SM: resources and writing–review and editing. LM: resources and writing–review and editing. CPe: resources, writing–review and editing, and validation. CPi: resources, writing–review and editing, funding acquisition, project administration, software, and supervision. MPr: resources and writing–review and editing. MPu: resources and writing–review and editing. LQ: resources, writing–review and editing, formal analysis, investigation, methodology, and software. RRa: resources and writing–review and editing. MR: resources and writing–review and editing. AS: resources, writing–review and editing, software, and supervision. GT: resources and writing–review and editing. LT: resources and writing–review and editing. EV: resources, writing–review and editing, and software. KY: resources and writing–review and editing. AV: conceptualization, funding acquisition, investigation, project administration, resources, supervision, and writing–review and editing.
Funding
The author(s) declare that financial support was received for the research, authorship, and/or publication of this article. The National Scientific Commission 3 (CSN3) of Istituto Nazionale di Fisica Nucleare (INFN) is gratefully acknowledged as the funding agency of the FAMU experiment. The Science and Technology Facilities Council (STFC) is gratefully acknowledged for the beamtime at the ISIS Neutron and Muon Source for the FAMU experiment (beamtime reference number RB2000022). Computing resources were provided by INFN CNAF Tier1 (data analysis and Geant4 simulation) and the STFC Scientific Computing Department’s SCARF cluster (FLUKA simulation).
Conflict of interest
The authors declare that the research was conducted in the absence of any commercial or financial relationships that could be construed as a potential conflict of interest.
The author(s) declared that they were an editorial board member of Frontiers, at the time of submission. This had no impact on the peer review process and the final decision.
Publisher’s note
All claims expressed in this article are solely those of the authors and do not necessarily represent those of their affiliated organizations, or those of the publisher, the editors, and the reviewers. Any product that may be evaluated in this article, or claim that may be made by its manufacturer, is not guaranteed or endorsed by the publisher.
Footnotes
1the operational voltage values for the three printed circuit boards (each one holding 16 SiPMs) are as follows:
2Using the ROOT (Brun and Rademakers (1997) method TF1:GetMaximumX.
References
Agostinelli, S., Allison, J., Amako, K., Apostolakis, J., Araujo, H., Arce, P., et al. (2003). Geant4—a simulation toolkit. Nucl. Instrum. Methods Phys. Res. Sect. A Accel. Spectrom. Detect. Assoc. Equip. 506, 250–303. doi:10.1016/s0168-9002(03)01368-81016/S0168-9002(03)01368-8
Ahdida, C., Bozzato, D., Calzolari, D., Cerutti, F., Charitonidis, N., Cimmino, A., et al. (2022). New capabilities of the fluka multi-purpose code. Front. Phys. 9, 788253. doi:10.3389/fphy.2021.788253
Antognini, A., Hagelstein, F., and Pascalutsa, V. (2022). The proton structure in and out of muonic hydrogen. Annu. Rev. Nucl. Part. Sci. 72, 389–418. doi:10.1146/annurev-nucl-101920-024709annurev-nucl-101920-024709
Battistoni, G., Boehlen, T., Cerutti, F., Chin, P. W., Esposito, L. S., Fassò, A., et al. (2015). Overview of the fluka code. Ann. Nucl. Energy 82, 10–18. doi:10.1016/j.anucene.2014.11.007
Bonesini, M., Benocci, R., Bertoni, R., Mazza, R., deBari, A., Menegolli, A., et al. (2019). The upgraded beam monitor system of the famu experiment at riken–ral. Nucl. Instrum. Methods Phys. Res. Sect. A Accel. Spectrom. Detect. Assoc. Equip. 936, 592–594. doi:10.1016/j.nima.2018.08.092092
Bonesini, M., Bertoni, R., Chignoli, F., Mazza, R., Cervi, T., de Bari, A., et al. (2017). The construction of the fiber-sipm beam monitor system of the r484 and r582 experiments at the riken-ral muon facility. J. Instrum. (JINST) 12, C03035. doi:10.1088/1748-0221/12/03/c030351748-0221/12/03/C03035
Brun, R., and Rademakers, F. (1997). Root — an object oriented data analysis framework. Nucl. Instrum. Methods Phys. Res. Sect. A Accel. Spectrom. Detect. Assoc. Equip. 389, 81–86. doi:10.1016/s0168-9002(97)00048-x1016/S0168-9002(97)00048-X
Carbone, R., Bonesini, M., Bertoni, R., Mazza, R., Rossella, M., Tortora, L., et al. (2015). The fiber-sipmt beam monitor of the r484 experiment at the riken-ral muon facility. J. Instrum. (JINST) 10, C03007. doi:10.1088/1748-0221/10/03/C03007
Carlson, C. (2015). The proton radius puzzle. Prog. Part. Nucl. Phys. 82, 59–77. doi:10.1016/j.ppnp.2015.01.002
Cataldo, M., Clemenza, M., Ishida, K., and Hillier, A. (2022). A novel non-destructive technique for cultural heritage: depth profiling and elemental analysis underneath the surface with negative muons. Appl. Sci. 12, 4237. doi:10.3390/app12094237app12094237
Clemenza, M., Baldazzi, G., Ballerini, G., Bonesini, M., Carpinelli, M., Cremonesi, O., et al. (2019). Chnet-tandem experiment: use of negative muons at riken-ral port4 for elemental characterization of “nuragic votive ship” samples. Nucl. Instrum. Methods Phys. Res. Sect. A Accel. Spectrom. Detect. Assoc. Equip. 936, 27–28. doi:10.1016/j.nima.2018.11.076
Dal Maso, G., Barchetti, F., Francesconi, M., Galli, L., Greuter, U., Hildebrandt, M., et al. (2023). Beam monitoring detectors for high intensity muon beams. Nucl. Instrum. Methods Phys. Res. Sect. A Accel. Spectrom. Detect. Assoc. Equip. 1047, 167739. doi:10.1016/j.nima.2022.167739
Hillier, A. D., Lord, J. S., Ishida, K., and Rogers, C. (2019). Muons at isis. Philosophical Trans. R. Soc. A Math. Phys. Eng. Sci. 377, 20180064. doi:10.1098/rsta.2018.0064
Lord, J., McKenzie, I., Baker, P., Blundell, S. J., Cottrell, S. P., Giblin, S. R., et al. (2011). Design and commissioning of a high magnetic field muon spin relaxation spectrometer at the isis pulsed neutron and muon source. Rev. Sci. Instrum. 82, 073904. doi:10.1063/1.3608114
Matsuzaki, T., Ishida, K., Nagamine, K., Watanabe, I., Eaton, G., and Williams, W. (2001). The riken-ral pulsed muon facility. Nucl. Instrum. Methods Phys. Res. Sect. A Accel. Spectrom. Detect. Assoc. Equip. 465, 365–383. doi:10.1016/S0168-9002(01)00694-5
Papa, A., Barchetti, F., Gray, F., Ripiccini, E., and Rutar, G. (2015). A multi-purposed detector with silicon photomultiplier readout of scintillating fibers. Nucl. Instrum. Methods Phys. Res. Sect. A Accel. Spectrom. Detect. Assoc. Equip. 787, 130–133. doi:10.1016/j.nima.2014.11.074
Papa, A., Rutar, G., Barchetti, F., Hildebrandt, M., and Kettle, P. (2019). A fast and quasi non-invasive muon beam monitor working at the intensity frontier. Nucl. Instrum. Methods Phys. Res. Sect. A Accel. Spectrom. Detect. Assoc. Equip. 936, 634–635. doi:10.1016/j.nima.2018.10.145
Pizzolotto, C., Adamczak, A., Bakalov, F. D., et al. (2020). The famu experiment: muonic hydrogen high precision spectroscopy studies. Eur. Phys. J. A 56, 185. doi:10.1140/epja/s10050-020-00195-9
Rossini, R., Adamczak, A., Bakalov, D., Baldazzi, G., Banfi, S., Baruzzo, M., et al. (2024a). Status of the detector setup for the famu experiment at riken-ral for a precision measurement of the zemach radius of the proton in muonic hydrogen. J. Instrum. (JINST) 19, C02034. doi:10.1088/1748-0221/19/02/C02034
Rossini, R., Benocci, R., Bertoni, R., Bonesini, M., Carsi, S., Clemenza, M., et al. (2024b). Characterisation of a low-momentum high-rate muon beam monitor for the famu experiment at the cnao-xpr beam facility. J. Instrum. (JINST) 19, C01024. doi:10.1088/1748-0221/19/01/C01024
Rossini, R., Benocci, R., Bertoni, R., Bonesini, M., Clemenza, M., De Vecchi, C., et al. (2023a). Characterisation of a scintillating fibre-based hodoscope exposed to the cnao low-energy proton beam. Nucl. Instrum. Methods Phys. Res. Sect. A Accel. Spectrom. Detect. Assoc. Equip. 1046, 167746. doi:10.1016/j.nima.2022.167746
Rossini, R., Benocci, R., Bertoni, R., Bonesini, M., Clemenza, M., Menegolli, A., et al. (2023b). Characterisation of muon and proton beam monitors based on scintillating fibres with a sipm read-out. Nucl. Instrum. Methods Phys. Res. Sect. A Accel. Spectrom. Detect. Assoc. Equip. 1046, 167684. doi:10.1016/j.nima.2022.167684
Rossini, R., Di Martino, D., Agoro, T., Cataldo, M., Gorini, G., Hillier, A. D., et al. (2023c). A new multidisciplinary non-destructive protocol for the analysis of stony meteorites: gamma spectroscopy, neutron and muon techniques supported by Raman microscopy and sem-eds. J. Anal. At. Spectrom. 38, 293–302. doi:10.1039/D2JA00263A
Vacchi, A., Mocchiutti, E., Adamczak, A., Bakalov, D., Baldazzi, G., Baruzzo, M., et al. (2023). Investigating the proton structure: the famu experiment. Nucl. Phys. News 33, 9–16. doi:10.1080/10619127.2023.21989132198913
Keywords: beam monitor, muon, beam calibration, single-particle beam, muonic atom physics, detector simulation
Citation: Rossini R, Baldazzi G, Banfi S, Baruzzo M, Benocci R, Bertoni R, Bonesini M, Carsi S, Cirrincione D, Clemenza M, Colace L, De Bari A, De Vecchi C, Fasci E, Gaigher R, Gianfrani L, Hillier AD, Ishida K, King PJC, Lord JS, Mazza R, Menegolli A, Mocchiutti E, Monzani S, Moretti L, Petroselli C, Pizzolotto C, Prata MC, Pullia M, Quintieri L, Ramponi R, Rossella M, Sbrizzi A, Toci G, Tortora L, Vallazza ES, Yokoyama K and Vacchi A (2024) The muon beam monitor for the FAMU experiment: design, simulation, test, and operation. Front. Detect. Sci. Technol 2:1438902. doi: 10.3389/fdest.2024.1438902
Received: 26 May 2024; Accepted: 02 July 2024;
Published: 05 August 2024.
Edited by:
Piergiorgio Cerello, National Institute of Nuclear Physics of Turin, ItalyReviewed by:
Marco Capogni, Italian National Agency for New Technologies, Energy and Sustainable Economic Development (ENEA), ItalyMarin Karuza, University of Rijeka, Croatia
Copyright © 2024 Rossini, Baldazzi, Banfi, Baruzzo, Benocci, Bertoni, Bonesini, Carsi, Cirrincione, Clemenza, Colace, De Bari, De Vecchi, Fasci, Gaigher, Gianfrani, Hillier, Ishida, King, Lord, Mazza, Menegolli, Mocchiutti, Monzani, Moretti, Petroselli, Pizzolotto, Prata, Pullia, Quintieri, Ramponi, Rossella, Sbrizzi, Toci, Tortora, Vallazza, Yokoyama and Vacchi. This is an open-access article distributed under the terms of the Creative Commons Attribution License (CC BY). The use, distribution or reproduction in other forums is permitted, provided the original author(s) and the copyright owner(s) are credited and that the original publication in this journal is cited, in accordance with accepted academic practice. No use, distribution or reproduction is permitted which does not comply with these terms.
*Correspondence: R. Rossini, cmljY2FyZG8ucm9zc2luaUBpbmZuLml0