 Amanda Carolina Souza Delfino Rocha1
 Renata Klemp Orlandini1
 Ana Carolina Fragoso Motta2
 Juliana Barchelli Pinheiro3
 Gilberto André e Silva1
 Viviane de Cássia Oliveira3
 Alan Grupioni Lourenço1*
- 1Department of Basic and Oral Biology, Ribeirão Preto School of Dentistry, University of São Paulo, Ribeirão Preto, Brazil
- 2Department of Stomatology, Public Oral Health, and Forensic Dentistry, Ribeirão Preto School of Dentistry, University of São Paulo, Ribeirão Preto, Brazil
- 3Department of Dental Materials and Prosthesis, Ribeirão Preto School of Dentistry, University of São Paulo, Ribeirão Preto, Brazil
Introduction: Recent studies have identified inflammatory mediators as potential biomarkers for monitoring or diagnosing periodontitis. However, the brief half-life of these mediators, coupled with their variability among different individuals and across different stages of periodontal disease, may limit their reliability as biomarkers.
Methods: In this study, we assessed the concentration profile of salivary biomarkers (IL-6, IL-8, and total protein) through repeated measurements within the same day and across different days in 79 patients exhibiting various states of periodontal health: intact periodontium, stable periodontitis, and active periodontitis. Additionally, we explored how daily variations, such as the interval between toothbrushing and eating, impact the levels of these salivary biomarkers and their diagnostic efficacy for periodontitis activity.
Results: Our results showed high salivary levels of IL-6 and total proteins in periodontitis patients (p < 0.001), with detection ability reflected by an Area Under the Receiver Operating Characteristic Curve (AUC-ROC) ranging between 0.709 and 0.852. Conversely, IL-8 levels were higher in patients with intact periodontium (p < 0.001), with an AUC-ROC for periodontitis detection between 0.671 and 0.815. Daily activities such as toothbrushing and eating influenced the levels of specific analytes, particularly total proteins (p < 0.001), but this did not affect their ability to detect periodontal disease activity. The highest measurement agreement, assessed by Intraclass Correlation Coefficients (ICC), was found for IL-6, with no significant differences in agreement between same-day and different-day measurements.
Conclusions: Our study demonstrated consistency in the repeated measurements of salivary analytes, both within the same day and across different days, except for salivary total protein levels. These analytes exhibited variability within a range that did not undermine their effectiveness as biomarkers for periodontal disease.
1 Introduction
Periodontitis, a prevalent chronic inflammatory disease affecting the tissues supporting teeth, poses a major challenge to global oral health. The WHO's 2022 report indicates that nearly 19% of the global population suffers from this condition (1). Despite technological advances, the diagnosis of periodontitis still primarily depends on evaluating tissue damage, a method that falls short in accurately representing the current state of disease activity (2, 3). In this context, salivary biomarkers are increasingly recognized as a promising approach for improving the diagnosis and monitoring of periodontitis (4).
Saliva is an ideal medium for biomarker discovery due to its non-invasive, safe, and simple collection process, which facilitates repeated sampling with minimal discomfort to the patient (5). Inflammatory mediators, such as Interleukin 6 (IL-6) and Interleukin 8 (IL-8), along with total salivary proteins, are gaining attention as salivary biomarkers because they are closely related to the progression of periodontal disease (2, 6–8). This interest is based on several studies that have reported elevated levels of these analytes in the saliva of patients with periodontal disease, highlighting their potential usefulness as diagnostic indicators or markers of disease progression (5, 9, 10).
Interleukin-6 (IL-6) plays a pivotal role in periodontal disease, not only because it is intricately involved in the bone resorption process characteristic of periodontitis but also as a regulator of acute phase proteins in inflammation (9, 11). Similarly, Interleukin-8 (IL-8) is crucial for the innate immune response to microorganisms in dental biofilm, facilitating neutrophil recruitment and angiogenesis (6, 12). Additionally, the total protein content in saliva is gaining recognition as a promising biomarker. It reflects the overall levels of inflammation and may serve as an indicator of periodontal health status (4, 13).
While these analytes demonstrate a strong association with the progression of periodontal disease, various factors introduce challenges that may limit their utility as biomarkers. These challenges include their short half-life, the variability of concentrations within the same individual, and their fluctuating levels corresponding to different stages of periodontal disease (14, 15). Studies indicate that salivary levels of these markers can vary significantly in measurements taken on different days in the same individual (5, 16). This variability is influenced by numerous factors, such as sympathetic and parasympathetic nervous system activity, medication usage, circadian rhythms, and physical exercise (17–19). Moreover, while some research presents conflicting findings, evidence suggests that hormonal fluctuations associated with puberty, pregnancy, menstrual cycles, and related disorders may also affect these biomarker levels (16, 20–23).
Additionally, everyday factors such as nutrition, hydration, and oral hygiene can influence the variability of salivary analytes (5, 24). To address this variability, numerous studies have standardized saliva collection methods by setting specific times for collection and controlling for the period since the last tooth brushing and meal (7, 8, 25). However, even with stringent saliva collection criteria, sample variability remains a significant challenge. For example, common guidelines for saliva collection typically involve abstaining from eating and brushing teeth for at least an hour prior to collection (2, 3, 7, 8, 11, 16, 18). This, however, results in a wide range of sample variations, from individuals who adhere to the minimum requirements to those who haven’t eaten or brushed their teeth in the past 12 h. Such disparities raise concerns about the heterogeneity of the samples collected, especially in the context of researching salivary inflammatory markers, where the impact of common daily variations on their concentration levels is not fully understood.
The precision of a biomarker is defined by its measurement reproducibility, meaning that identical results should be consistently obtained when the same test is repeated under identical conditions (26). Furthermore, effective salivary biomarkers should more significantly reflect changes due to periodontal disease rather than daily variations in saliva composition. However, studies focusing on the variability in total salivary protein concentrations are limited. To our knowledge, no studies have examined the impact of daily variables, such as intervals between tooth brushing and eating, on the salivary levels of IL-6 and IL-8. Moreover, the influence of these variables on the diagnostic capability of these biomarkers remains unexplored.
For this reason, the primary objective of this study was to evaluate the concentration profile of salivary biomarkers by performing repeated measurements within a single day and across different days, in patients with different states of periodontal health: intact periodontitis, stable periodontitis and active periodontitis, in order to assess the diagnostic capacity of this biomarkers in distinguishing cases of periodontitis from those of intact periodontium and stable periodontitis. Additionally, this investigation explored the impact of common daily variations, such as the interval between toothbrushing and eating, on the levels of these salivary biomarkers and their ability in diagnosing periodontitis activity.
2 Materials and methods
2.1 Study population and design
This study was conducted from March 2020 to February 2022. All participants were fully informed about the research objectives and provided informed and voluntary consent. The project received approval from the Research Ethics Committee of FORP (CAAE 98638818.2.0000.5419). Participants were categorized based on the new classification system for periodontal disease by the American Academy and the European Federation of Periodontology (27) into three groups: (1) Intact Periodontium Group (IP group): Individuals exhibiting no periodontal attachment loss, a probing depth of up to 3 mm, bleeding on probing in less than 10% of the sites; (2) Stable Periodontitis Group (SP group): Participants with attachment loss, a probing depth of up to 4 mm, no sites with probing depth ≥4 mm with bleeding, and bleeding on probing in less than 10% of the sites; and (3) Periodontitis Group (P group): Patients showing detectable proximal attachment loss on two or more non-adjacent teeth and/or attachment loss ≥3 mm on the buccal or lingual/palatal surfaces in at least 2 teeth due to periodontal disease. These individuals also exhibited a probing depth ≥5 mm or a probing depth ≥4 mm with bleeding on probing.
The number of participants was calculated using G*Power 3.1 software, with an effect size of 20%. The sample size calculation was based on achieving a statistical power of 80% and a significance level of 0.05. This resulted in a total of 18 participants per group for the study.
All participants were selected based on the following inclusion criteria: (1) Absence of systemic conditions that could affect salivary cytokine levels, such as diabetes mellitus, antineoplastic treatment, or immunosuppression; (2) No use of anti-inflammatory or antibiotic medications in the past three months; (3) No periodontal treatment received within the last 6 months; and (4) Have more than 14 teeth.
2.2 Study design and Saliva collection
The duration of individual participation in the study extended over 16 days, involving three visits. In the initial visit (Day 0), a calibrated researcher performed a periodontal examination of the entire mouth using a North Carolina millimeter periodontal probe (HuFriedy, Chicago, IL). The evaluated parameters included the Gingival Bleeding Index (BI), Probing Depth (PD), and Clinical Attachment Level (CAL) at six different sites for each tooth. The BI was determined by the presence or absence of bleeding within 20 s of probing. PD was measured from the gingival margin to the base of the sulcus or periodontal pocket, while CAL was assessed from the cementoenamel junction to the most apical portion of the sulcus or pocket.
The day following the periodontal examination (Day 1), three saliva collections were conducted to introduce variability in relation to the time elapsed since the last oral hygiene and feeding session.
The first saliva collection (T1) occurred at 8 am, with participants in a fasting state and having not performed morning tooth brushing, ensuring more than 6 h since the last oral hygiene and eating. Immediately following T1, participants were instructed to perform oral hygiene. Approximately one-hour post-tooth brushing, around 9 am, the second collection (T2) was conducted. Participants were still fasting, guaranteeing more than 7 h without food and 1 h after the last oral hygiene. Immediately following T2, participants were instructed to have breakfast. The third collection (T3) took place approximately two hours after breakfast, around 11 am, corresponding to 2 h post-meal and 3 h after the last oral hygiene. The same methodology for saliva collection was repeated 15 days later (Day 16). Given the significant impact of hormonal fluctuations on salivary composition, setting a 15-day interval between saliva collections is strategically justified. This timing ensures that the collections span the transitions between the different phases of the menstrual cycle in female participants: the follicular phase (days 1–14), the luteal phase (days 15–28), and the menstrual phase (21). The saliva collection methodology is illustrated in Figure 1.
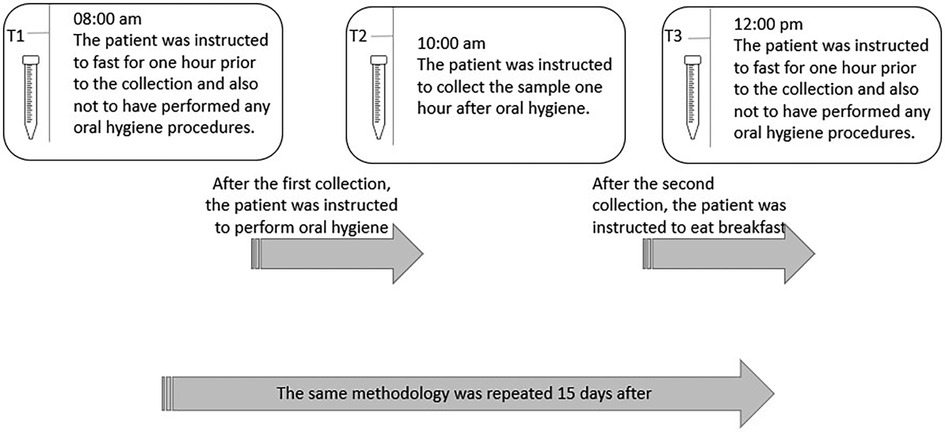
Figure 1. Description of the saliva collection methodology.
Importantly, all saliva collections adhered to standard instructions of abstaining from eating, drinking, smoking, or performing oral hygiene for at least one hour before each collection. This approach was designed to introduce a broad range of variability in collection conditions while still adhering to the standard guidelines commonly mentioned in scientific literature.
Saliva collection from all participants involved instructing them to rinse with tap water. The non-stimulated saliva was collected according to the method described by Navazesh et al. (25). Subsequently, saliva samples were collected on ice, and aliquots were prepared, which were then frozen at −80°C until the analysis phase.
2.3 Cytokine analysis
For the determination of protein concentration, we used the Bio-Rad DC Protein Assay (DC™ Protein Assay Reagents Package) colorimetric assay, following the manufacturer's guidelines.
To quantify salivary levels of IL-6 and IL-8, sandwich ELISA kits provided by Peprotech (California, USA) were used. Absorbance measurements at 405 nm were recorded using a Thermo Scientific Multiskan GO ELISA reader, in accordance with the manufacturer's instructions.
2.4 Statistical analyses
Statistical analyses were performed using SPSS software version 25.0 (IBM Corp, Armonk, NY, USA), and graphs were generated using GraphPad Prism 8.0 (GraphPad Software, Boston, MA, USA). A two-tailed test was adopted with an alpha of 0.05. Descriptive analyses included the calculation of means, standard deviations, medians, and quartiles. The chi-square test was utilized to assess qualitative independence. The normality of data distribution was evaluated using the Shapiro–Wilk test. For demographic data, one-way ANOVA was applied to variables with a normal distribution, while the Kruskal–Wallis test was used for non-normal variables.
Analysis of the dependent variables IL-6, IL-8, and Total Protein employed a Linear Mixed Model, with participants as a random factor. Fixed factors included group (periodontal status), time of study (T1, T2, and T3), and collection days (D1 and D16), using an AR (1) covariance matrix. The choice of an AR (1) covariance matrix to model the temporal correlation among repeated measurements for each participant was informed by an analysis based on the Akaike Information Criterion (AIC). Pairwise comparisons were adjusted using the Bonferroni method. The effect size was quantified by calculating the mean difference (MD) for each comparison between fixed factors, as well as within each fixed factor, accompanied by the respective 95% confidence intervals (CIs).
Intraclass Correlation Coefficients (ICC) were calculated using a one-way random-effects model to evaluate consistency between salivary analyte measurements within the same day (T1, T2, and T3) and on different days (D1 and D16). Following Cicchetti, (28), ICCs were classified as: poor (<0.40), fair (0.40–0.59), good (0.60–0.74), and excellent (0.75–1.00).
For assessing periodontal disease activity, we utilized the Area Under the Curve (AUC) of the Receiver Operating Characteristic (ROC). Participants were categorized into “periodontal health” (21 with intact periodontium and 22 with stable periodontitis) and “active disease” (36 with active periodontitis). In the discriminant analysis between periodontitis and intact periodontium, stable periodontitis cases were excluded. The predictive capacity of salivary cytokine levels was assessed by AUC-ROC, considered significant if above 0.5. For AUC-ROC analysis, all cytokine samples (T1–3) were examined collectively, and comparative analyses were conducted for each collection time (T1, T2, and T3) to identify the most opportune moment for optimizing diagnostic accuracy.
3 Results
This cohort study included 21 participants in IP Group, 22 in SP Group, and 36 in the P Group. The participant inclusion process is depicted in the flowchart in Figure 2.
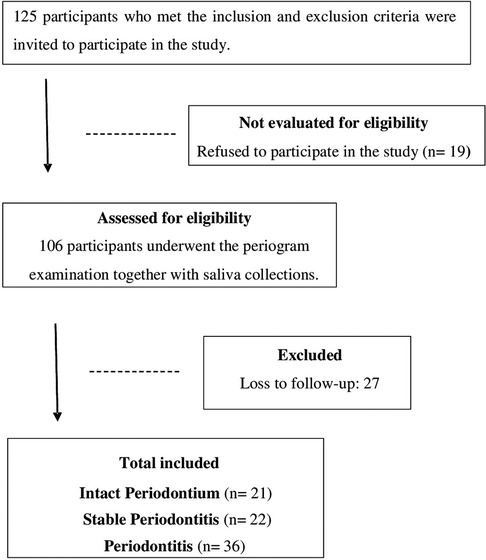
Figure 2. Flowchart of study design.
An analysis of demographic and clinical data indicated a homogeneous distribution across the groups in terms of variables such as gender, smoking habits, drug use, alcohol consumption, presence of chronic systemic diseases, and medication usage. The sociodemographic and clinical characteristics of the participants are detailed in Table 1. All patients diagnosed with periodontitis were classified as being in either stage III or IV of the disease.
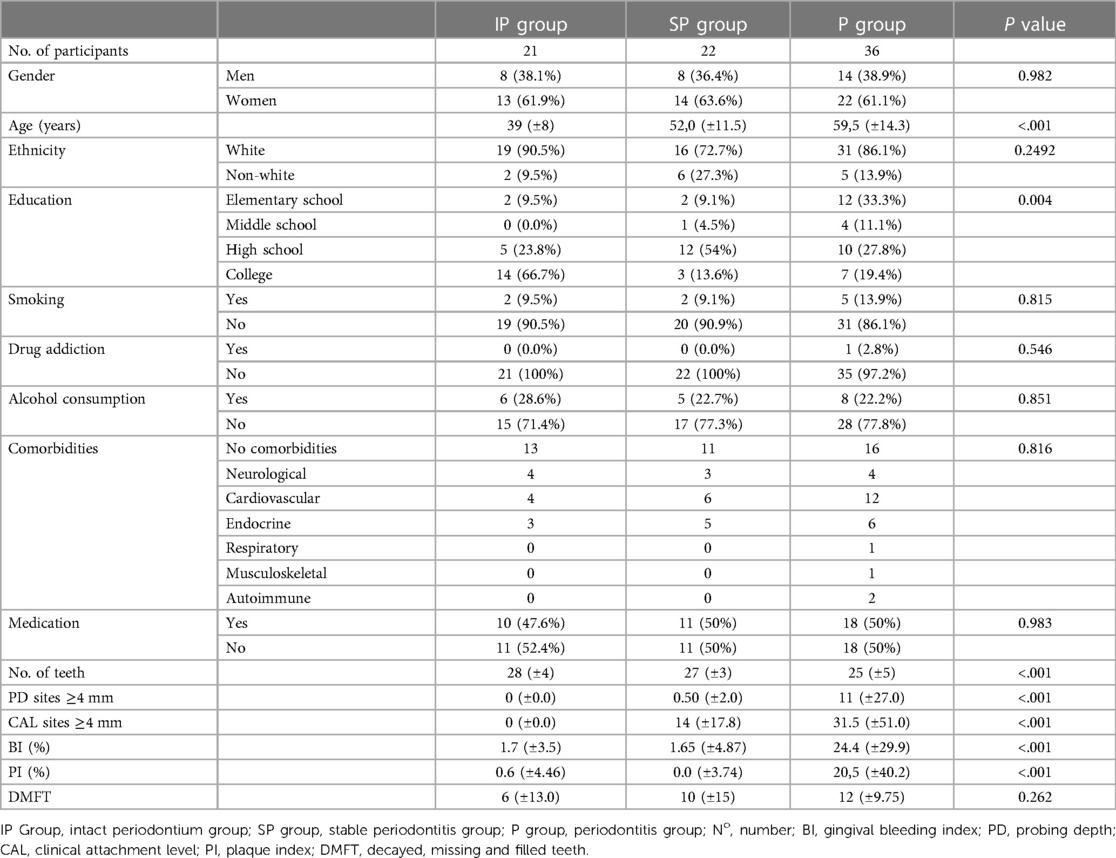
Table 1. Sociodemographic and clinical profile of the participants.
3.1 Analysis of salivary levels of IL-6, IL-8, and total protein in different periodontal health conditions and their variability across study times
The salivary levels of IL-6 and total protein were significantly higher in the P group compared to both the IP group (p < 0.001) and the SP group (IL-6: p = 0.013; Total protein: p = 0.002). Specifically, IL-6 levels in the P group were higher by a mean difference (MD) of 248 pg/ml compared to the IP group, with a confidence interval (CI) of 29–219 (p < 0.001), and by 124 pg/ml compared to the SP group (CI: 152–345; p = 0.013). For total protein, the P group exhibited a significant increase, with an MD of 1,821 pg/ml over the IP group (CI = 910–2,732; p < 0.001) and 1,360 mg/ml over the SP group (CI: 910–2,732 mg/ml; p = 0.002). Conversely, IL-8 levels were higher in the IP group than in both the P group (MD = 138 pg/ml, CI: 195–81, p < 0.001) and the SP group (MD = 91 pg/ml, CI: 27–154, p = 0.002), as detailed in Figure 3.
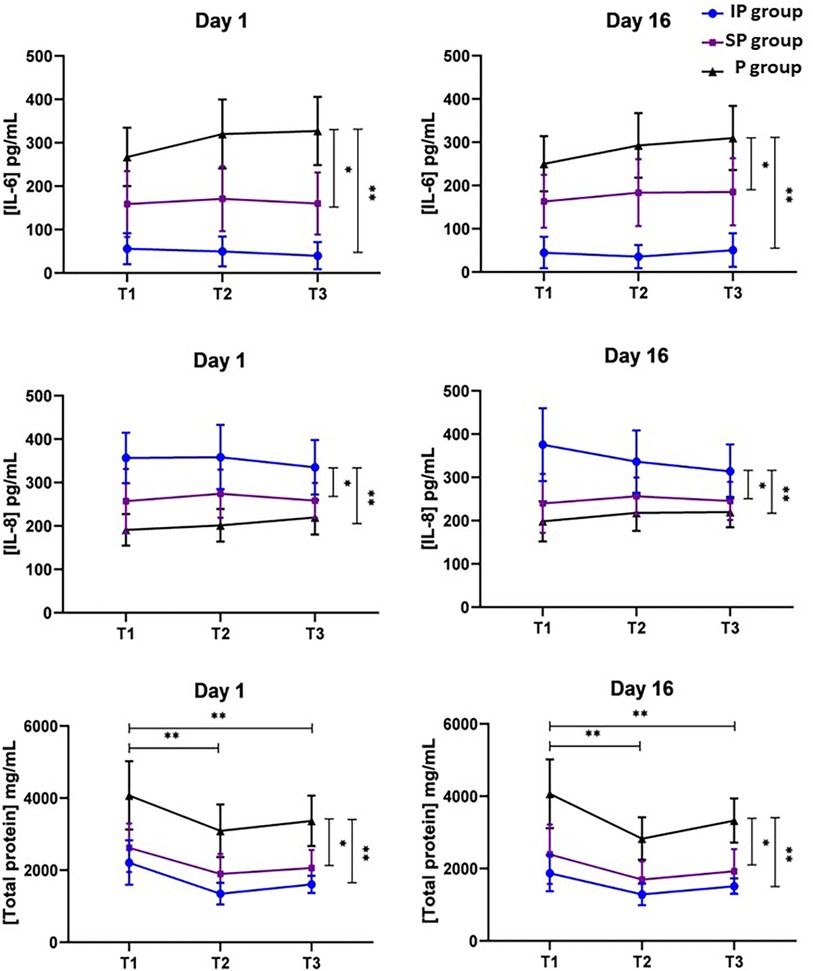
Figure 3. Profiles of salivary biomarker concentrations through repeated measurements within a single day (T1, T2, and T3) and across different days (Day 1 and Day 16) in patients with intact periodontium (IP group), stable periodontitis (SP group), and periodontitis (P group). T1: Saliva collection from participants in a fasting state, without having performed morning tooth brushing. T2: Saliva collection from participants who are still fasting and 1 h post-last oral hygiene. T3: Saliva collection occurring two hours after breakfast and 3 h following the last oral hygiene. *p < 0.05; **p < 0.001.
In our investigation of the variation in salivary biomarker levels at different collection times within the same day, distinct patterns emerged in relation to the time elapsed since the last oral hygiene and feeding session. The levels of Interleukin-6 (IL-6) did not show significant changes across different times (p = 0.418), a pattern similarly observed in the levels of Interleukin-8 (IL-8), which remained consistent (p = 0.803). However, an influence of collection time was detected on total protein levels. The highest levels were recorded at T1, during the fasting period and prior to morning toothbrushing. Subsequently, there was a significant decrease in these levels one hour after toothbrushing (T2; MD = −849 mg/ml, CI: −1,253 to 445, p < 0.001) and two hours post-breakfast (T3; MD = −573 mg/ml, CI: −1,112 to −34, p < 0.001).
In comparing the data obtained on the two different collection days, Day 1 and Day 16, no significant variations were observed in the levels of IL-6 (MD = 4 pg/ml, CI: −10 to 17, p = 0.582), IL-8 (MD = 5 pg/ml, CI = −9 to 20, p = 0.453), and total protein (MD = 151 mg/ml; CI: −10 to 313, p = 0.07). This consistency in biomarker levels across different days is illustrated in Figure 3. Such findings suggest a notable stability in the levels of these biomarkers over time.
In terms of agreement in repeated measurements, assessed by ICC, salivary IL-6 levels exhibited greater consistency between measurements compared to IL-8 and Total Protein. Following the classification system by Cicchetti et al. (28), the ICC for IL-6 was categorized as “excellent”, whereas the ICCs for IL-8 and Total Protein were categorized as “good”. There were no significant differences in the ICCs between measurements taken on the same day and those taken on different days. This indicates a stable presence of these salivary markers over time, as shown in Table 2.
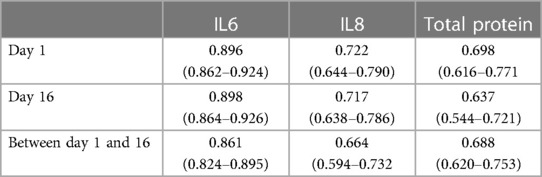
Table 2. Intraclass correlation coefficients and their confidence intervals for repeated measurements within a single day (Day 1 and Day 16) and across different days (between Day 1 and 16).
3.2 Study of diagnostic capacity for detecting periodontitis at different collection times
To assess the diagnostic accuracy in detecting periodontitis using ROC curves, two distinct analyses were conducted: Situation 1: This analysis examined the ability to differentiate cases of periodontitis from those with intact periodontium and stable periodontitis (periodontal health); Situation 2: This analysis focused on distinguishing periodontitis cases from those with intact periodontium. Additionally, each study time (T1, T2, and T3) was individually considered, along with the calculation of the AUC for all study times combined (–3).
In both situations, IL-6 demonstrated a larger AUC-ROC compared to the salivary levels of IL-8 and Total Protein, with the exception of T2 in Situation 1.
For none of the biomarkers did we observe any influence of the post-brushing and feeding interval on their AUC-ROC in detecting periodontitis. That is, the AUCs evaluated collectively (T1–3) were comparable to those evaluated at individual times (T1, T2, and T3). The AUC-ROC values were consistent across all study times for the evaluated biomarkers, as detailed in Table 3.
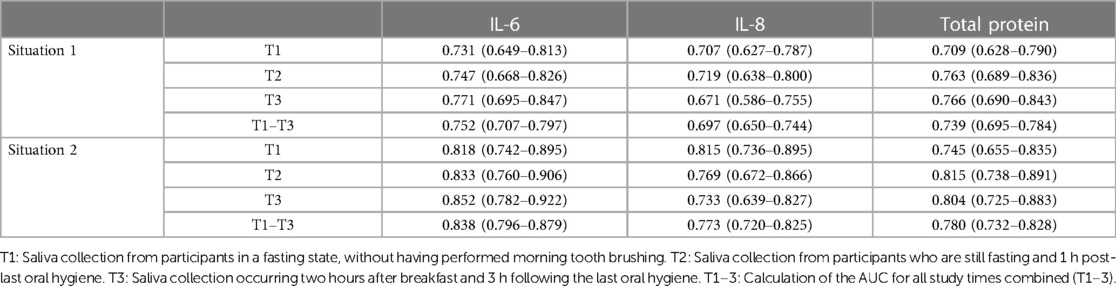
Table 3. Area under the ROC curve for examining the ability to differentiate cases of periodontitis from those with intact periodontium and stable periodontitis (situation 1), and the ability to distinguish periodontitis cases from those with intact periodontium (situation 2). Additionally, each study time (T1, T2, and T3) was individually considered, along with the calculation of the AUC for all study times combined (T1–3).
Additionally, the AUC-ROC was consistently higher in Situation 2 compared to Situation 1 across all times analyzed. This suggests that distinguishing cases of periodontitis from intact periodontium cases was more effective than differentiating periodontitis cases from a combination of stable periodontitis and intact periodontium.
Despite notable variability in salivary total protein levels due to everyday conditions, this variation did not impact diagnostic accuracy, as indicated by the stability of the total protein AUC-ROC, as shown in Table 3.
4 Discussion
This study has identified variability in the measurements of potential salivary biomarkers due to daily challenges. Despite this variability, the biomarkers demonstrated satisfactory diagnostic accuracy. The importance of examining variability in repeated measurements lies in the necessity for measurement reproducibility: the same test, when applied to an unchanged patient, should yield consistent results (26, 29). Our findings indicate that while daily conditions can influence protein salivary concentrations, this variability does not impair the diagnostic accuracy for detecting periodontitis.
Remarkably, our study did not conduct strictly repeated measurements, as each collection was performed under unique hygiene conditions, food intake, and varying times. Nonetheless, it is desirable that variations in the salivary levels of these biomarkers should be predominantly influenced by periodontal disease rather than by daily variables such as post-brushing and feeding times (26).
Our study noted that IL-6 concentrations are higher in the saliva of patients with periodontal disease, and these elevated levels are capable of detecting active periodontitis. This observation is in line with other research findings, where IL-6 has demonstrated the ability to detect periodontitis with a sensitivity ranging from 52% to 80% and a specificity between 48% and 87% (30). Ebersole et al. (7) also reported findings consistent with our study, identifying significantly higher concentrations of salivary IL-6 in periodontitis patients compared to those with gingivitis or in a periodontally healthy state.
In terms of IL-8, our study identified elevated levels in patients with intact periodontium, aligning with the findings of Khalaf et al. (31). Similarly, Miranda et al. (32) observed high levels of IL-8 in the gingival crevicular fluid of healthy sites in contrast to sites affected by periodontitis. However, the link between salivary IL-8 levels and periodontitis remains unclear. Studies such as those by Teles et al. (33) and Lisa Cheng et al. (34) did not establish a direct correlation between salivary IL-8 levels and the incidence of periodontal disease.
The systematic review by Finoti et al. (35) underscores the variability and lack of consensus in research examining salivary IL-8 levels in periodontitis patients. The authors suggest that discrepancies in findings may be attributed to factors such as differing methods of saliva collection and processing, biomarker quantification techniques, and varying stages of periodontitis.
The findings from our study regarding total salivary protein align with the results reported by Cui et al. (36) and Kejriwal et al. (37), who also observed an increase in total protein concentration in the saliva of periodontitis patients compared to healthy individuals. This consistent correlation underscores the potential of salivary total protein as a biomarker for periodontal disease.
To our knowledge, this study is the first to evaluate the variations in salivary pro-inflammatory cytokines IL-6 and IL-8 in response to daily challenges and to assess their correlation with the diagnostic capacity for periodontitis. Concerning total protein, our results align with those of Justino et al. (38), who observed a decrease in salivary total protein levels following tooth brushing. The finding that daily conditions can significantly affect salivary total protein levels is noteworthy, particularly considering that many studies use these levels as an endogenous control for normalizing and correcting experimental biases in their analytes (39, 40). Our findings suggest that the use of salivary total protein as a normalization factor in experimental settings should be approached with caution due to its variability in response to common daily activities.
We found no significant differences in the agreements of repeated analyses, as measured by ICC, whether conducted on the same day or on different days. These results indicate the temporal stability of the analytes. Although studies suggest that hormonal variations may affect periodontal tissue metabolism (22, 23), our study did not observe any significant gender-based discrepancies in salivary analyte levels (results not shown). Notably, the 15-day interval between collections was chosen to accommodate potential changes in the menstrual cycle phases of female participants (16). Nevertheless, these hormonal variations did not contribute to the variability of the analytes across different days, a finding also observed by other studies that did not notice the influence of the menstrual cycle on the levels of salivary analytes (41).
In 2009, Thomas and colleagues (26) evaluated the ICC for IL-6 through repeated measurements over several days. They reported lower levels of agreement than those observed in our study, a difference that can be attributed to variations in methodology. In their study, Thomas and colleagues (26) carried out six different measurements, with some collections self-administered by patients at home. Such a setup could lead to increased variability between collections, potentially resulting in greater variability in the ICC values.
One limitation of our study is the variation in clinical and demographic profiles across different groups. Predominantly, the intact periodontium group consisted of younger patients with higher educational levels. Despite concerted efforts to balance participant ages, it proved challenging to recruit patients over 40 years old with intact periodontium. Another limitation relates to the control of participants’ hydration levels. While we instructed participants to refrain from consuming liquids one hour before each collection, as per Navazesh et al. (25), specific monitoring of hydration levels was not conducted. This is a significant consideration, given that hydration status can affect saliva viscosity, total protein concentrations, and osmolality (24).
5 Conclusion
In conclusion, our study has demonstrated that salivary levels of IL-6, IL-8, and total protein significantly vary among patient groups with differing periodontal conditions, affirming the discriminative potential of these biomarkers in distinguishing between healthy states and periodontal disease. Notably, the levels of IL-6 and IL-8 exhibited remarkable stability, unaffected by the timing of saliva collection, reinforcing the reliability of these markers under a range of temporal conditions. Although daily conditions, such as oral hygiene and diet, were found to influence fluctuations in total protein levels, these variations did not compromise its diagnostic value for detecting periodontitis. Therefore, the presence of daily variabilities and measurement fluctuations at different times did not diminish the predictive efficacy of these biomarkers for periodontal disease. Given the scarcity of research on the variability of salivary biomarkers within the context of periodontal disease, this area emerges as a crucial avenue for future investigation. Consequently, we underscore the critical need for further studies aimed at elucidating the variability of these salivary biomarkers and assessing their impact on diagnostic accuracy.
Data availability statement
The original contributions presented in the study are included in the article/Supplementary Material, further inquiries can be directed to the corresponding author.
Ethics statement
The studies involving humans were approved by Research Ethics Committee of FORP (CAAE 98638818.2.0000.5419). The studies were conducted in accordance with the local legislation and institutional requirements. The participants provided their written informed consent to participate in this study.
Author contributions
AR: Data curation, Investigation, Methodology, Validation, Writing – original draft, Writing – review & editing. RO: Investigation, Methodology, Writing – review & editing, Validation. AM: Conceptualization, Funding acquisition, Resources, Writing – review & editing. JP: Investigation, Writing – review & editing. GS: Methodology, Writing – review & editing, Validation. VO: Formal Analysis, Methodology, Writing – review & editing, Validation. AL: Conceptualization, Data curation, Formal Analysis, Funding acquisition, Project administration, Resources, Supervision, Visualization, Writing – original draft, Writing – review & editing.
Funding
The author(s) declare that financial support was received for the research, authorship, and/or publication of this article.
This study was supported by the National Council for Scientific and Technological Development—CNPq (grant: 420689/2018-4) and São Paulo Research Foundation—FAPESP (grant: 18/13204-7).
Conflict of interest
The authors declare that the research was conducted in the absence of any commercial or financial relationships that could be construed as a potential conflict of interest.
Publisher's note
All claims expressed in this article are solely those of the authors and do not necessarily represent those of their affiliated organizations, or those of the publisher, the editors and the reviewers. Any product that may be evaluated in this article, or claim that may be made by its manufacturer, is not guaranteed or endorsed by the publisher.
Supplementary material
The Supplementary Material for this article can be found online at: https://www.frontiersin.org/articles/10.3389/fdmed.2024.1369186/full#supplementary-material
References
1. World Health Organization. Global Oral Health Status Report: Towards Universal Health Coverage for Oral Health by 2030. Geneva: License: CC BY-NC-SA 3.0 IGO (2022).
2. Kaczyński T, Wroński J, Głuszko P, Kryczka T, Miskiewicz A, Górski B, et al. Salivary interleukin 6, interleukin 8, interleukin 17A, and tumour necrosis factor α levels in patients with periodontitis and rheumatoid arthritis. Cent Eur J Immunol. (2019) 44(3):269–76. doi: 10.5114/ceji.2019.89601
3. Bostanci N, Selevsek N, Wolski W, Grossmann J, Bao K, Wahlander A, et al. Targeted proteomics guided by label-free quantitative proteome analysis in saliva reveal transition signatures from health to periodontal disease. Mol Cell Proteomics. (2018) 17(7):1392–409. doi: 10.1074/mcp.RA118.000718
4. Podzimek S, Vondrackova L, Duskova J, Janatova T, Broukal Z. Salivary markers for periodontal and general diseases. Dis Markers. (2016) 2016:9179632. doi: 10.1155/2016/9179632
5. Zhou Y, Liu Z. Saliva biomarkers in oral disease. Clin Chim Acta. (2023) 548:117503. doi: 10.1016/j.cca.2023.117503
6. Frasheri I, Heym R, Ern C, Summer B, Hennessen TG, Högg C, et al. Salivary and gingival CXCL8 correlation with periodontal status, periodontal pathogens, and smoking. Oral Dis. (2022) 28(8):2267–76. doi: 10.1111/odi.13994
7. Ebersole JL, Nagarajan R, Akers D, Miller CS. Targeted salivary biomarkers for discrimination of periodontal health and disease(s). Front Cell Infect Microbiol. (2015) 5:62. doi: 10.3389/fcimb.2015.00062
8. Zhang Y, Kang N, Xue F, Qiao J, Duan J, Chen F, et al. Evaluation of salivary biomarkers for the diagnosis of periodontitis. BMC Oral Health. (2021) 21(1):266. doi: 10.1186/s12903-021-01600-5
9. Turkmen E, Uzun EV, Bozaba F, Balci N, Toygar H. Salivary irisin level is higher and related with interleukin-6 in generalized periodontitis. Clin Oral Investig. (2023) 27(6):3001–8. doi: 10.1007/s00784-023-04903-9
10. Majeed ZN, Jassim SD, Kamil ZH. Assessment of salivary and gingival crevicular fluids IL6, IL-8, IL-12, and IL-17 levels in healthy subjects and patients with periodontal disease. J Oral Maxillofac Pathol. (2023) 27(3):494–8. doi: 10.4103/jomfp.jomfp_170_23
11. Jaedicke KM, Preshaw PM, Taylor JJ. Salivary cytokines as biomarkers of periodontal diseases. Periodontol 2000. (2016) 70(1):164–83. doi: 10.1111/prd.12117
12. Valentine J, Saladyanant T, Ramsey K, Blake J, Morelli T, Southerland J, et al. Impact of periodontal intervention on local inflammation, periodontitis, and HIV outcomes. Oral Dis. (2016) 22(Suppl 1):87–97. doi: 10.1111/odi.12419
13. Rawdhah R, Mahmood MS. Salivary lactate dehydrogenase and salivary total protein as potential biomarkers for screening periodontal disease. Saudi Dent J. (2023) 35(7):827–33. doi: 10.1016/j.sdentj.2023.07.011
14. Jansson L, Lundmark A, Modin C, Abadji D, Yucel-Lindberg T. Intra-individual cytokine profile in peri-implantitis and periodontitis: a cross-sectional study. Clin Oral Implants Res. (2021) 32(5):559–68. doi: 10.1111/clr.13725
15. Duarte PM, Bastos MF, Fermiano D, Rabelo CC, Perez-Chaparro PJ, Figueiredo LC, et al. Do subjects with aggressive and chronic periodontitis exhibit a different cytokine/chemokine profile in the gingival crevicular fluid? A systematic review. J Periodontal Res. (2015) 50(1):18–27. doi: 10.1111/jre.12180
16. Sobas EM, Reinoso R, Cuadrado-Asensio R, Fernández I, Maldonado MJ, Pastor JC. Reliability of potential pain biomarkers in the saliva of healthy subjects: inter-individual differences and intersession variability. PLoS One. (2016) 11(12):e0166976. doi: 10.1371/journal.pone.0166976
17. Proctor GB, Shaalan AM. Disease-induced changes in salivary gland function and the composition of saliva. J Dent Res. (2021) 100(11):1201–9. doi: 10.1177/00220345211004842
18. Xie H, Zheng X, Huang Y, Li W, Wang W, Li Q, et al. Diurnal pattern of salivary alpha-amylase and cortisol under citric acid stimulation in young adults. PeerJ. (2022) 10:e13178. doi: 10.7717/peerj.13178
19. Ntovas P, Loumprinis N, Maniatakos P, Margaritidi L, Rahiotis C. The effects of physical exercise on saliva composition: a comprehensive review. Dent J (Basel). (2022) 10(1):7. doi: 10.3390/dj10010007
20. Wei M, An G, Fan L, Chen X, Li C, Chen J, et al. Characteristics of menstrual cycle disorder and saliva metabolomics of young women in a high-temperature environment. Front Physiol. (2023) 13:994990. doi: 10.3389/fphys.2022.994990
21. Rieder JK, Darabos K, Weierich MR. Estradiol and women’s health: considering the role of estradiol as a marker in behavioral medicine. Int J Behav Med. (2020) 27(3):294–304. doi: 10.1007/s12529-019-09820-4
22. Su X, Jin K, Zhou X, Zhang Z, Zhang C, Li Y, et al. The association between sex hormones and periodontitis among American adults: a cross-sectional study. Front Endocrinol (Lausanne). (2023) 14:1125819. doi: 10.3389/fendo.2023.1125819
23. Baser U, Cekici A, Tanrikulu-Kucuk S, Kantarci A, Ademoglu E, Yalcin F. Gingival inflammation and interleukin-1 beta and tumor necrosis factor-alpha levels in gingival crevicular fluid during the menstrual cycle. J Periodontol. (2009) 80(12):1983–90. doi: 10.1902/jop.2009.090076
24. Mentes JC, DeVost MA, Nandy K. Salivary osmolality, function, and hydration habits in community-dwelling older adults. SAGE Open Nurs. (2019) 5:2377960819826253. doi: 10.1177/2377960819826253
25. Navazesh M. Methods for collecting saliva. Ann N Y Acad Sci. (1993) 694:72–7. doi: 10.1111/j.1749-6632.1993.tb18343.x
26. Thomas MV, Branscum A, Miller CS, Ebersole J, Al-Sabbagh M, Schuster JL. Within-subject variability in repeated measures of salivary analytes in healthy adults. J Periodontol. (2009) 80(7):1146–53. doi: 10.1902/jop.2009.080654
27. Caton JG, Armitage G, Berglundh T, Chapple ILC, Jepsen S, Kornman KS, et al. A new classification scheme for periodontal and peri-implant diseases and conditions—introduction and key changes from the 1999 classification. J Clin Periodontol. (2018) 45(Suppl 20):S1–8. doi: 10.1111/jcpe.12935
28. Cicchetti DV. Guidelines, criteria, and rules of thumb for evaluating normed and standardized assessment instruments in psychology. Psychol Assess. (1994) 6(4):284–90. doi: 10.1037/1040-3590.6.4.284
29. Alajbeg IZ, Lapić I, Rogić D, Vuletić L, Andabak Rogulj A, Illeš D, et al. Within-subject reliability and between-subject variability of oxidative stress markers in Saliva of healthy subjects: a longitudinal pilot study. Dis Markers. (2017) 2017:2697464. doi: 10.1155/2017/2697464
30. Sukriti Kc, Wang XZ, Gallagher JE. Diagnostic sensitivity and specificity of host-derived salivary biomarkers in periodontal disease amongst adults: systematic review. J Clin Periodontol. (2020) 47(3):289–308. doi: 10.1111/jcpe.13218
31. Khalaf H, Lönn J, Bengtsson T. Cytokines and chemokines are differentially expressed in patients with periodontitis: possible role for TGF-β1 as a marker for disease progression. Cytokine. (2014) 67(1):29–35. doi: 10.1016/j.cyto.2014.02.007
32. Miranda TS, Figueiredo NF, Figueiredo LC, Silva HDPD, Rocha FRG, Duarte PM. Cytokine profiles of healthy and diseased sites in individuals with periodontitis. Arch Oral Biol. (2020) 120:104957. doi: 10.1016/j.archoralbio.2020.104957
33. Teles RP, Likhari V, Socransky SS, Haffajee AD. Salivary cytokine levels in subjects with chronic periodontitis and in periodontally healthy individuals: a cross-sectional study. J Periodontal Res. (2009) 44(3):411–7. doi: 10.1111/j.1600-0765.2008.01119.x
34. Cheng YS L, Jordan L, Gorugantula LM, Schneiderman E, Chen HS, Rees T. Salivary interleukin-6 and -8 in patients with oral cancer and patients with chronic oral inflammatory diseases. J Periodontol. (2014) 85(7):956–65. doi: 10.1902/jop.2013.130320
35. Finoti LS, Nepomuceno R, Pigossi SC, Corbi SC, Secolin R, Scarel-Caminaga RM. Association between interleukin-8 levels and chronic periodontal disease: a PRISMA-compliant systematic review and meta-analysis. Med (Baltimore). (2017) 96(22):e6932. doi: 10.1097/MD.0000000000006932
36. Cui B, Yu Y, Yuan W, Zhou W, Zhou X, Zhang P. Variations in protein concentration and albumin/globulin ratio of whole unstimulated saliva obtained from healthy people and patients with chronic periodontitis. Hua Xi Kou Qiang Yi Xue Za Zhi. (2015) 33(4):339–42 (Chinese). doi: 10.7518/hxkq.2015.04.003
37. Kejriwal S, Bhandary R, Thomas B, Kumari S. Estimation of levels of salivary mucin, amylase and total protein in gingivitis and chronic periodontitis patients. J Clin Diagn Res. (2014) 8(10):ZC56–60. doi: 10.7860/JCDR/2014/8239.5042
38. Justino AB, Teixeira RR, Peixoto LG, Jaramillo OLB, Espindola FS. Effect of saliva collection methods and oral hygiene on salivary biomarkers. Scand J Clin Lab Invest. (2017) 77(6):415–22. doi: 10.1080/00365513.2017.1334261
39. Kibune R, Muraoka K, Morishita M, Ariyoshi W, Awano S. Relationship between dynamics of TNF-α and its soluble receptors in saliva and periodontal health state. Dent J (Basel). (2022) 10(2):25. doi: 10.3390/dj10020025
40. Hsiao YC, Chu LJ, Chen YT, Chi LM, Chien KY, Chiang WF, et al. Variability assessment of 90 salivary proteins in intraday and interday samples from healthy donors by multiple reaction monitoring-mass spectrometry. Proteomics Clin Appl. (2018) 12(2):1700039. doi: 10.1002/prca.201700039
Keywords: biomarkers, saliva, periodontitis, repeated measurements, variability, IL-6, IL-8, total protein
Citation: Rocha ACSD, Orlandini RK, Motta ACF, Pinheiro JB, Silva GA, Oliveira VdC and Lourenço AG (2024) Variability of salivary analytes under daily conditions and their implications for periodontitis biomarkers. Front. Dent. Med 5:1369186. doi: 10.3389/fdmed.2024.1369186
Received: 11 January 2024; Accepted: 5 March 2024;
Published: 18 March 2024.
Edited by:
Melissa M. Grant, University of Birmingham, United KingdomReviewed by:
Pradeep Kumar Yadalam, Saveetha Dental College And Hospitals, IndiaDogukan Yilmaz, University of Turku, Finland
© 2024 Rocha, Orlandini, Motta, Pinheiro, Silva, Oliveira and Lourenço. This is an open-access article distributed under the terms of the Creative Commons Attribution License (CC BY). The use, distribution or reproduction in other forums is permitted, provided the original author(s) and the copyright owner(s) are credited and that the original publication in this journal is cited, in accordance with accepted academic practice. No use, distribution or reproduction is permitted which does not comply with these terms.
*Correspondence: Alan Grupioni Lourenço, bG91cmVuY29AZm9ycC51c3AuYnI=