 George W. Gruenhagen
 Talha Mubeen
 Chinar Patil
 Joseph Stockert
 Jeffrey T. Streelman
94% of researchers rate our articles as excellent or good
Learn more about the work of our research integrity team to safeguard the quality of each article we publish.
Find out more
ORIGINAL RESEARCH article
Front. Dent. Med. , 30 May 2022
Sec. Regenerative Dentistry
Volume 3 - 2022 | https://doi.org/10.3389/fdmed.2022.845449
This article is part of the Research Topic Advances in Dental Research Driven by Single Cell Transcriptomics View all 4 articles
Like most mammals, humans replace their teeth once throughout their lives and have limited regenerative capabilities. In contrast, mice continually renew tissues lost due to gnawing through a well characterized population of stem cells on the labial surface of the incisor. Most non-mammalian vertebrates replace teeth throughout life; the cellular and molecular mechanisms of successional tooth replacement are largely unknown. Here we use single nuclei RNA sequencing (snRNA-seq) of replacement teeth and adjacent oral lamina in Lake Malawi cichlids, species with lifelong whole–tooth replacement, to make two main discoveries. First, despite hundreds of millions of years of evolution, we demonstrate conservation of cell type gene expression across vertebrate teeth (fish, mouse, human). Second, we used an approach that combines marker gene expression and developmental potential of dental cells to uncover the transcriptional signature of stem-like cells in regenerating teeth. Our work underscores the importance of a comparative framework in the study of vertebrate oral and regenerative biology.
Teeth are ancient structures whose presence in the fossil record chronicles the half billion-year history of vertebrates. Despite deep origins and conservation of the unit tooth, dental patterns vary widely amongst vertebrate groups. Teeth form in single or multiple rows on oral jaws and throughout the pharynx in many non-mammalian groups; birds lack teeth altogether, while mammals possess a single row of differently shaped teeth on the jaw margin. During early development, teeth are formed by an interaction initiated by the ectoderm [or endoderm (1–3)] of the pharyngeal arches with neural crest-derived ectomesenchyme. In humans, primordial progenitor populations disappear soon after development is complete. Humans and many mammal groups are termed diphyodonts because they have two generations of teeth (deciduous and permanent). While, mice and related rodents are termed monophyodonts and possess just one set of teeth throughout life. Mice do not replace teeth, but they do regenerate dental tissues from well-characterized stem cell populations on the labial surface of the incisor enamel and in proximity to the neurovascular bundle in pulp mesenchyme (4, 5). In contrast, Lake Malawi cichlids and most non-mammalian vertebrates are called polyphyodonts, because they possess a dentition capable of whole–tooth replacement throughout life (6). Successive generations of teeth in polyphyodonts, the replacement teeth of cichlids, arise from a persistent dental lamina, a band of tissue containing stem cells (7–10) formed by invagination of the oral epithelium into the dental mesenchyme during odontogenesis. This dental lamina (also called successional lamina) has been documented to persist through adulthood in various non-mammalian vertebrates (11).
Given the long history of teeth in the fossil record as well as the diversity of dental patterning and regenerative capacities noted above, it is of keen interest to know which features of teeth are evolutionary conserved, and which features are labile on evolutionarily deep and shallow timescales (12). Notably, the molecular tool kit involved in tooth initiation is highly conserved across vertebrates from sharks to bony fishes to reptiles to mammals, regardless of tooth location in the pharynx or on the oral jaw (13–16). This observation has been supported by spatial gene expression analysis in dental tissues. Despite this deep homology of tooth initiation, few comparative studies have addressed the cellular heterogeneity in vertebrate teeth (17). Recently, Krivanek and colleagues used single cell RNA-sequencing to produce a glimpse into the homology of mouse and human dental cell types (18). Similar cell types were found in human and mouse teeth with greater divergence observed in specific subpopulations of molar pulp. Yet, to date, no broader cellular-level comparison across vertebrates has been achieved.
Despite species- or group-specific attributes of dental regeneration and tooth replacement, recent evidence supports the deployment of common molecular signals. For instance, sox2 is associated with epithelial stem cells in the dentitions of sharks, bony fishes, reptiles and mammals (7). Similarly, we identified a putative quiescent population of Celsr1+ stem cells in the dental pulp mesenchyme in both Lake Malawi cichlids and the mouse incisor (19). Upon clipping-induced damage to the mouse incisor, this quiescent pool of cells replenished dental mesenchymal stem cells required for accelerated growth (4, 20). In Lake Malawi cichlids, slow-cycling BrdU+/celsr1+ cells are found in epithelial and mesenchymal zones of label retaining cells in replacement teeth (19).
In this report, we used snRNA-seq to explore the cellular profiles of replacement teeth and associated tissues in Lake Malawi cichlids. We chose to isolate and sequence single nuclei instead of single cells because we wanted the flexibility of freezing dissected samples before library preparation and we wished to avoid dissociation-induced gene expression associated with standard single cell protocols (21, 22). We aimed to (i) characterize the cell types of replacement teeth and associated oral lamina, (ii) compare the transcriptional features of these cell types to those from different types of teeth in mice and human; and (iii) identify the gene expression signature of cells that may contribute to dental regeneration and whole–tooth replacement.
To identify cell populations associated with replacement teeth in the jaws of Lake Malawi cichlids, we performed single nuclei RNA-sequencing on many dissected replacement teeth and the adjacent soft jaw tissue, containing taste buds and the oral lamina, from Maylandia zebra individuals (see Methods). Replacement teeth, which undergo one–for-one substitution of the functional tooth, are anatomically linked to taste buds located in the adjacent oral epithelium (Figure 1A). Tastebuds undergo continuous renewal, are co-localized with teeth throughout the oro-pharynx, share genetic loci regulating their co-density and likely share competent epithelium and mesenchyme during development and regeneration (7, 23). Because replacement teeth and the soft jaw tissue represent samples of different hardness and composition, we kept them separate for tissue processing and library preparation. Nuclei were FACS sorted using DAPI, libraries were prepared using 10x Genomics kist, and the samples were sequenced using Illumina chemistry on a NextSeq 500. Reads were filtered and aligned to the M. zebra genome using CellRanger. Next, the resulting gene expression matrix was further filtered to remove poor quality data and nuclei were clustered based on their transcriptional profiles in Seurat (24). Seven hundred and thirty nine nuclei were recovered from replacement teeth that met our quality filters with a mean of 326 genes expressed and 303 unique molecular identifiers (UMI) per nucleus. For the soft jaw tissue, 1,296 nuclei were recovered that met our quality filters with a mean of 721 genes expressed and 1,098 UMI per nucleus (Supplementary Figure 3).
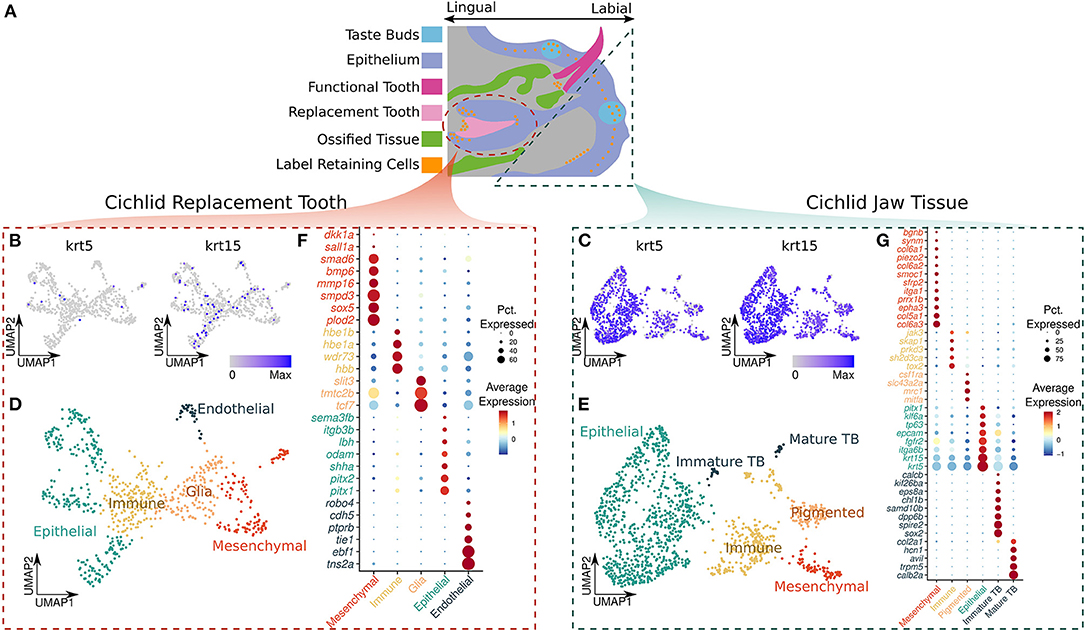
Figure 1. (A) Illustration of a sagittal view of the cichlid jaw, original artwork modified from reference (7). The dashed regions represent the tissue collected for our samples, replacement tooth (circle) and adjacent soft jaw tissue (triangle). The legend depicts the color representing each of the oral structures: taste buds in blue, epithelium in purple, functional tooth in magenta, replacement tooth in light pink, ossified tissue (crypt bone) in green, and label retaining cells in orange. (B,C) UMAP plot of the normalized expression of krt5 and krt15 in the replacement tooth and jaw, respectively. (D) UMAP plot of the annotated cell types in the replacement tooth. (E) UMAP plot of the annotated cell types in the adjacent soft jaw tissue. (F,G) Gene markers used to identify cell types in the replacement tooth and jaw, respectively. Average relative expression relative expression of the markers in each cell type is represented by color, red denoting greater relative expression and blue denoting lower relative expression. The size of the point represents the percent of cells in the cell type that express the marker.
Notably, nuclei from the two tissues were transcriptionally distinct from each other, with krt5 and krt15 showing the greatest differences. Nuclei from replacement teeth can be distinguished from those from surrounding soft tissue by krt5 with 91.2% accuracy (Figures 1B,C). krt5 was expressed by 90.4% of nuclei from the soft jaw tissue and 7.57% of nuclei from the replacement tooth (average log fold change = 3.59; Bonferroni adjusted p-value = 7.12e-242). In addition, krt15 could be used to distinguish the two tissues with 81.3% accuracy (Figures 1B,C). krt15 was expressed by 71.4% of nuclei from the soft jaw tissue and 1.35% of nuclei from the replacement teeth (average log fold change = 4.32; Bonferroni adjusted p-value = 3.30e−178). Using the presence of either krt5 or krt15 to classify nuclei resulted in 92.8% accuracy, enabling the potential to separate these two tissues using either of the genes or their combination. This may be important for future experiments wherein samples could be pooled prior to processing and nuclei could then be separated by the presence/absence of these keratin genes. We identified cell types for each tissue type separately through a cluster detection function in Seurat, and then manual annotation of cell type based on cluster marker gene expression.
In the replacement tooth sample, we detected 10 nuclei clusters representing 5 broad cell types: dental epithelial, dental mesenchymal, glial, endothelial and immune (Figure 1D). Endothelial cells were characterized by greater expression of tie1; a component of the angiopoietin/Tie (ANG/Tie) receptor system that controls vascular remodeling and inflammation (25), ptprb; a gene which encodes receptor-type tyrosine–protein phosphatase beta (VE–PTP), an enzyme essential for blood vessel development (26, 27), pecam1; or CD31, a molecule expressed throughout vascular cells whilst being largely concentrated at endothelial cell-cell junctions (28), and robo4; a cell-surface receptor that has been shown to mediate attraction signaling mechanisms via RhoGTPase, which are essential for vascular guidance in vertebrates (29)—along with genes such as tnsa, ebf1 and cdh5 which have diverse roles in vascular biology (30).
Dental epithelial nuclei were marked by increased expression of bicoid-related homeodomain factors pitx1 and pitx2, which are predominantly restricted to the dental epithelium during odontogenesis (31, 32) whilst playing a key role in the odontogenic homeobox code for tooth patterning (33); shha, a protein coding gene whose expression has been well documented in stellate reticulum, stratum intermedium, inner, outer dental epithelium and epithelial-derived ameloblasts within the dental architecture (18, 34); odam, a odontogenic ameloblast-associated protein (18, 35); itgb3b, a gene that encodes integrin beta-3 (β3) or CD61 protein which is predominantly expressed in the developing epithelial tooth germ and adult dental lamina (36); and sema3fb, a member of the semaphorin gene family expressed in the epithelium of developing and adult teeth (37, 38).
The glial population of nuclei was identified by expression of tcf7, tmtc2b, and slit3; genes which have been deemed important in maintaining neurogenesis, neural homeostasis, myelin formation in the peripheral nervous system, and provide support to neurons. Immune nuclei were marked by expression of hbb, wdr73, hbe1a, and hbe1b. Finally, dental mesenchymal nuclei were marked by increased expression of plod2, Procollagen-Lysine,2-Oxoglutarate 5-Dioxygenase 2, a gene which is involved in the regulation of dentinogenic differentiation of dental pulp stem cells (39, 40); sox5, which belongs to the SRY-related HMG-box family of transcription factors having a key role in mesenchymal stem cell differentiation (41) and predominantly expressed in the dental mesenchyme (42); mmp16; a member of matrix metalloproteinase family whose members are involved in extracellular matrix reorganization in various cellular processes with mmp16 particularly being differentially expressed in dental follicles (43); bmp6, smad6, sall1a, smpd3 and dkk1a, which are well established pre–odontoblast makers (18) (Figure 1F).
Pathway enrichment analysis was performed on upregulated differentially expressed genes (DEGs) marking each cell type in the replacement tooth (Supplementary Figure 4A). DEGs for epithelial cells were enriched for cell surface (Bonferroni adjusted p-value = 7.29e−5), intrinsic component of plasma membrane (Bonferroni adjusted p-value = 2.51e−4), integral component of plasma membrane (Bonferroni adjusted p-value = 4.94e−4), anchoring junction (Bonferroni adjusted p-value = 8.88e−4), cell-cell junction (Bonferroni adjusted p-value = 4.43e−3), and protein complex involved in cell adhesion (Bonferroni adjusted p-value = 5.51e−3). DEGs for mesenchymal cells were enriched for ossification (Bonferroni adjusted p-value = 2.89e−12), odontogenesis of dentin-containing tooth (Bonferroni adjusted p-value = 5.88e−5), skeletal system development (Bonferroni adjusted p-value = 6.78e−15), osteoblast differentiation (Bonferroni adjusted p-value = 5.57e−7), skeletal system morphogenesis (Bonferroni adjusted p-value = 3.51e-7), chondrocyte differentiation (Bonferroni adjusted p-value = 7.22e-9), bone development (Bonferroni adjusted p-value = 2.25e−10), bone morphogenesis (Bonferroni adjusted p-value = 1.55e−3), mesenchymal cell differentiation (Bonferroni adjusted p-value = 7.66e−3), odontogenesis (Bonferroni adjusted p-value = 1.15e−4), biomineralization (Bonferroni adjusted p-value = 4.44e−3), and chondrocyte development (Bonferroni adjusted p-value = 7.22e−9).
DEGs for glial cells were enriched for neurogenesis (Bonferroni adjusted p-value = 1.16e−5), generation of neurons (Bonferroni adjusted p-value = 4.42e−6), neuron projection development (Bonferroni adjusted p-value = 8.27e−5), axon development (Bonferroni adjusted p-value = 3.14e−5), neuron differentiation (Bonferroni adjusted p-value = 1.72e−5), neuron development (Bonferroni adjusted p-value = 2.99e−4), regulation of axonogenesis (Bonferroni adjusted p-value = 8.40e−7), axon guidance (Bonferroni adjusted p-value = 2.56e-3), neuron projection guidance (Bonferroni adjusted p-value = 2.61e−3), and cell projection organization (Bonferroni adjusted p-value = 8.60e−3). DEGs for endothelial cells were enriched for blood vessel development (Bonferroni adjusted p-value = 1.21e−8), vasculature development (Bonferroni adjusted p-value = 2.99e−8), blood vessel morphogenesis (Bonferroni adjusted p-value = 3.35e−7), angiogenesis (Bonferroni adjusted p-value = 9.48e−7), tube morphogenesis (Bonferroni adjusted p-value = 1.05e−6), endothelial development (Bonferroni adjusted p-value = 5.92e−4), endothelial cell differentiation (Bonferroni adjusted p-value = 2.56e−3), regulation of angiogenesis (Bonferroni adjusted p-value = 3.12e−3), regulation of endothelial cell proliferation (Bonferroni adjusted p-value = 7.13e−3), regulation of vasculature development (Bonferroni adjusted p-value = 3.67e−3).
Separately, nuclei from the soft jaw tissue formed twelve clusters that represent six major cell types: oral epithelium, mesenchymal cells, pigmented cells, immature taste buds, mature taste buds, and immune cells (Figure 1E). Mature taste bud nuclei were primarily defined by expression of calb2a (calretinin); a calcium signaling regulator, a marker which has been previously shown to be predominantly expressed in mature cichlid taste buds (7), trpm5; a gene which encodes a transient calcium channel receptor of the TRP subfamily highly expressed in the mammalian tongue taste buds where it plays a key role in perception of taste (44), avil; a gene which encodes a calcium regulated actin binding protein highly expressed in primate circumvallate taste buds (45), hcn; which encodes hyperpolarization-activated cyclic nucleotide–gated (HCN) channels which are integral membrane proteins shown to be present in taste buds where they contribute to sour perception (46, 47), and col2a1; which encodes type II collagen. Immature taste bud nuclei exhibited increased expression of sox2, which distinguishes progenitor taste bud cells from adult taste buds (7), chl1b; a gene which encodes a cell adhesion molecule expressed during taste bud development in cichlids (7), kif26ba, spire2, and calcb genes which are associated with budding and tube formation (48). Epithelial nuclei were marked by the expression of keratins; krt5 and krt15, integrin; itga6b, epcam; a epithelial adhesion molecule, and prominent epithelial marker pitx1 which has been demonstrated to be expressed in epithelial and mucosal surfaces across species along with tp63, a prominent epithelial stem cell marker (49). A population of pigmented cells was primarily characterized by the expression of mitfa; which regulates the function of pigment producing cells; melanocytes (50), mrc1 (or melanocortin receptor-1); a membrane surface receptor predominantly expressed by melanocytes (51), slc43a2a; associated with melatonin metabolism (52), and csf1ra; colony stimulating factor receptor 1—known for its role in zebrafish pigmentation (53).
Immune cell nuclei were identified by expression of tox2; a transcription factor which drives T cell function and development by regulating chromatin modeling (54), sh2d3ca (also known as Shep1); gene which encodes mediator proteins controlling cell signaling, deemed essential for immune response via the BCAR1-CRK-RAPGEF1 pathway (55) and B-cell function, along with genes prkd3, skap1, and jak3. Finally, mesenchymal cells had increased expression of genes col6a3, col5a1, col6a2, col6a1 which encode collagen V and VI localized within mammalian gingival mucosa (56), mesenchymal stem markers sfrp2, smoc1, piezo2, along with epha3 and prrx1b which contribute to epithelial to mesenchymal transition in tumors (57) (Figure 1G).
Pathway enrichment analysis was performed on the DEGs marking each cell type in the oral lamina soft tissue (Supplementary Figure 4B). DEGs for epithelial nuclei were enriched for morphogenesis of an epithelium (Bonferroni adjusted p-value = 4.68e−4), cell-cell junction assembly (Bonferroni adjusted p-value = 5.19e−4), epithelial cell morphogenesis (Bonferroni adjusted p-value = 6.33e−4), epithelial cell differentiation (Bonferroni adjusted p-value = 3.37e−13), epithelial cell proliferation (Bonferroni adjusted p-value = 8.66e−6), positive regulation of epithelial cell proliferation (Bonferroni adjusted p-value = 9.90e−6), regulation of epithelial cell proliferation (Bonferroni adjusted p-value = 1.19e−5), and epithelial cell migration (Bonferroni adjusted p-value = 1.67e−5).
DEGs for mesenchymal nuclei were enriched for mesenchyme development (Bonferroni adjusted p-value = 3.28e−4), mesenchymal cell differentiation (Bonferroni adjusted p-value = 1.92e−3), extracellular matrix structural constituent (Bonferroni adjusted p-value = 4.21e−22), glycosaminoglycan binding (Bonferroni adjusted p-value = 5.31e−10), extracellular matrix organization (Bonferroni adjusted p-value = 1.12e−24), extracellular structure organization (Bonferroni adjusted p-value = 1.23e−24), and connective tissue development (Bonferroni adjusted p-value = 2.13e−5).
DEGs for pigment cell nuclei were enriched for pigment cell differentiation (FDR adjusted p-value = 8.09e−3), pigmentation (FDR adjusted p-value = 9.28e−3), developmental pigmentation (FDR adjusted p-value = 1.87e−2), pigment accumulation (FDR adjusted p-value = 4.23e−2), cellular pigment accumulation (FDR adjusted p-value = 4.23e−2), endosome to pigment granule transport (FDR adjusted p-value = 3.28e−2), and pigment granule maturation (FDR adjusted p-value = 3.28e−2).
DEGs for immune cell nuclei were enriched for cell activation (Bonferroni adjusted p-value = 3.88e−21), leukocyte activation (Bonferroni adjusted p-value = 3.12e−20), lymphocyte activation (Bonferroni adjusted p-value = 2.71e−18), lymphocyte differentiation (Bonferroni adjusted p-value = 2.54e−13), mononuclear cell differentiation (Bonferroni adjusted p-value = 5.88e−13), T cell activation (Bonferroni adjusted p-value = 3.49e−12), leukocyte differentiation (Bonferroni adjusted p-value = 4.73e−11). DEGs for immature TB were enriched for gland morphogenesis (Bonferroni adjusted p-value = 3.18e−4), gland development (Bonferroni adjusted p-value = 6.21e−3), and morphogenesis of an epithelial bud (Bonferroni adjusted p-value = 9.58e−4).
We aimed to compare the transcriptional profiles of cell types within the dentitions of multiple vertebrate species. Comparison of single cell RNA-seq datasets is an area of active research (24, 58, 59) but we found that existing tools do not easily accommodate species as distantly related as fishes and mammals, sequenced with different approaches to different depths per cell or nucleus. Therefore, we explored an approach that compares differentially expressed genes characteristic of cell types found by independent study. High quality dental single cell RNA-seq datasets from mice and humans have been published recently, facilitating a transcriptional comparison that spans hundreds of millions of years of evolutionary distance. From Krivanek et al. (18), we gathered scRNA-seq datasets originating from the mouse incisor (MI), mouse incisor and mouse molar (MIM), and human molar (HM). We computed DEGs from the dental cell types identified by Krivanek and colleagues and then compared mammal dental cell type DEGs to those from cichlid replacement teeth (CT) and the adjacent soft jaw tissue (CJ). The heat map presented in Figure 2A illustrates the general approach and results from this analysis.
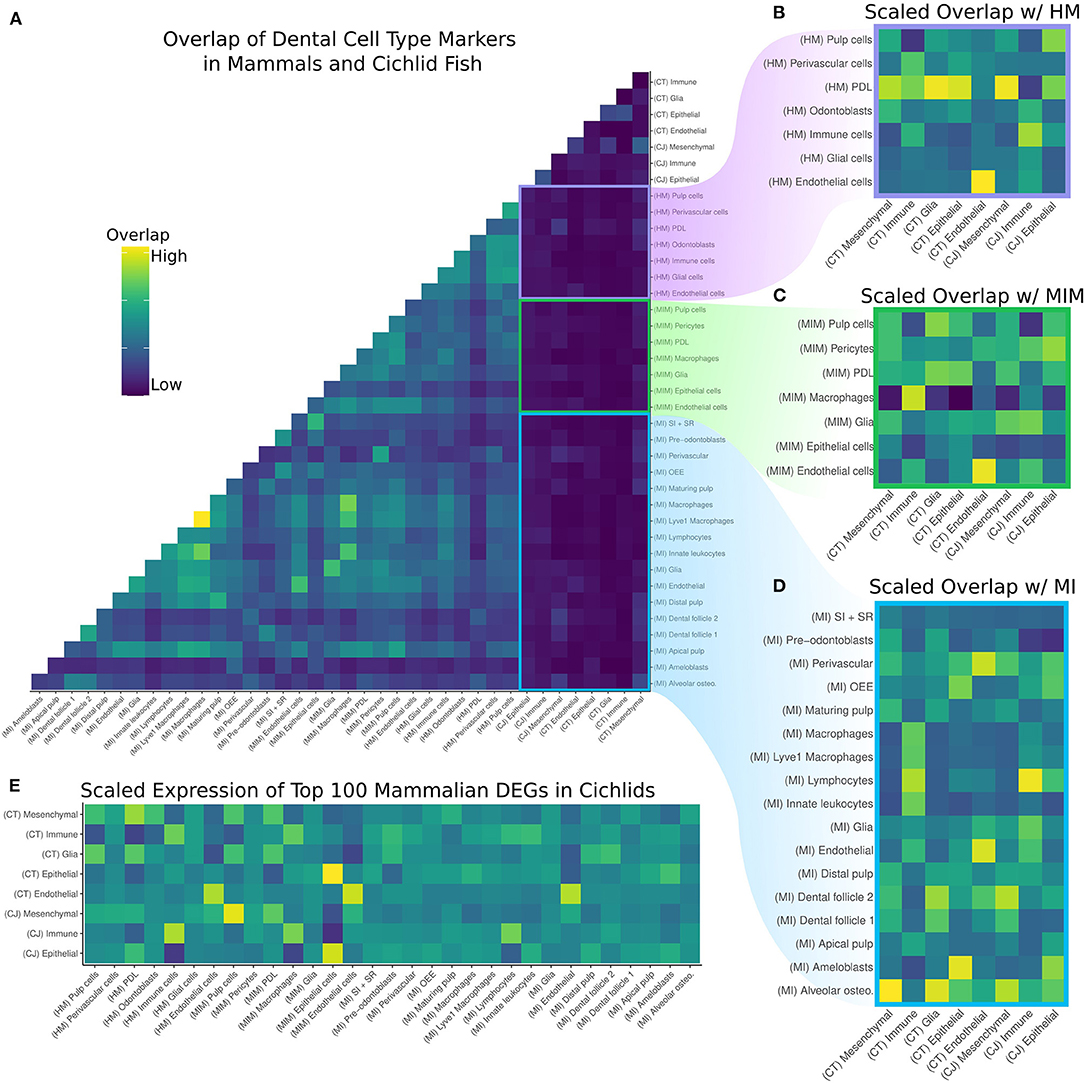
Figure 2. (A) Overlap of DEGs by cell type in the cichlid replacement tooth (CT), cichlid jaw (CJ), human molar (HM), mouse incisor and molar (MIM), and mouse incisor (MI). Values are normalized by the size of the query cell type, target cell type, and number of DEGs with human orthologs. (B–D) Pairwise comparisons of the overlap of DEGs of HM, MIM, and MI, respectively, with CT and CJ. The same normalization scheme is applied and values are scaled by column in order to determine the mammalian cell type most similar to the cichlid cell type. Generally, there is greater overlap between mammalian dental cell types and the corresponding cichlid cell type. (E) Average relative expression of the sum of the top 100 unique DEGs per mammalian cell type scaled by row to determine the mammalian cell type most similar to the cichlid cell type. Generally, there is greater expression of mammalian dental cell type markers in the corresponding cichlid cell type.
As expected, the greatest degree of overlap in DEGs was between cell types in the two mouse datasets, MI and MIM. There is lower overlap of DEGs in the cichlid cell types compared with the mammalian datasets and with human compared to mouse. This is expected due to the evolutionary relationships of species involved. To identify the mammalian dental cell type(s) with the closest overlap compared to cichlid cell types, we subset by mammalian dataset and created z-scores for each cichlid cell type (Figures 2B–D). DEGs for endothelial cells for the mammalian datasets match well and distinctly with cichlid endothelial nuclei. The DEGs for cichlid mesenchymal nuclei match most closely with pulp cells, PDL, odontoblasts, and alveolar osteocytes. Cichlid immune cell nuclei match most closely with immune cells, macrophages, Lyve1 macrophages, lymphocytes, and innate leukocytes. Cichlid epithelial nuclei show the most distinct overlap in the mouse incisor, where they overlap to the greatest degree with ameloblasts. The cichlid cell type we annotate as glia tends not to match with expected corresponding cell types in the mammal datasets.
Next, we sought additional specificity in the matching of mammalian dental cell types to those in the cichlid dataset. We found the top 100 upregulated DEGs exclusive to each mammal cell type per dataset. Then, we calculated the cumulative expression of these markers in each of the cichlid cell types and scaled by row (Figure 2E). This expression score was typically the highest for corresponding cell types across data sets. For example, the mammalian cell types with the highest expression score in the mesenchymal clusters of cichlids were “pulp cells”, “PDL”, and “odontoblasts.” Similarly, cichlid immune clusters had the highest expression score with cell types “immune cells,” “macrophages,” and “lymphocytes.” The cichlid epithelial clusters had the highest match with mammalian “epithelial” cell types.
We next investigated the identity of mammal cell type markers with conserved expression in cichlid cell types. Here we present the top five of these conserved vertebrate dental cell type markers: CT Mesenchyme with HM PDL (n = 34): COL11A1, TENM4, RAB27B, SRPX, and SVEP1. CT Immune with HM Immune cells (n = 25): IL1B, PTPRC, FCER1G, TNFAIP3, and LCP1. CT Glia with HM Immune cells (n = 13): NKG7, TNFAIP3, PLEK, CYBB, and CD3D. CT Epithelium with MIM epithelium (n = 46): PITX2, SPINT2, VWA2, PERP, and PKP1. CT Endothelial with MIM Endothelial (n = 41): FLT1, PLVAP, PTPRB, KDR, and ESM1. CJ Mesenchymal with MIM Pulp cells (n = 59): OLFML1, DIO3, RDH10, SOX9, UNC5C, and PTN. CJ Immune with HM Immune (n = 45): IL1B, C1QA, MS4A7, DUSP2, and PTPRC. CJ Epithelial with MIM Epithelial (n = 59): KRT5, LAMC2, PITX2, EPCAM, and SPINT2.
It is notable that between 13 and 60% of upregulated DEGs exclusive to mammalian dental cell types were observed to be expressed in corresponding cichlid cell types. Over all analyses, cichlid glial cells show the lowest degree of conservation. This is an indication that this cell type has evolved between mammals and fishes, but also may indicate that we require more complete sampling of this cell type in cichlid teeth. Conversely, endothelial cells show the highest degree of conservation between cichlids and the mammalian species examined. Taken together, we find deep homology in the transcriptional profiles of dental cell types for vertebrate species that span hundreds of millions of years of evolutionary divergence.
Having demonstrated conserved gene expression profiles amongst vertebrate dental cell types, we next asked whether we could identify a transcriptional signature of stem-like cells in vertebrate regenerating dentitions. One traditional approach to identify quiescent and cycling stem-like cells in tissue is to assay for the presence of specific molecular markers. This approach is typically aided by anatomical context (e.g., from histological sections). By contrast to the traditional approach, single–cell and single–nucleus RNA-seq datasets are much more sensitive and do not benefit from anatomical context. It is trivial to sort single cells in their clusters and find those expressing dental stem cell markers (e.g., Sox2, Gli1, Celsr1). We did so and observed cells expressing markers of interest in nearly all clusters, in many cases in cells from differentiated cell types. We reasoned that most, if not all, markers of stem-like cells are pleiotropic and therefore their expression in single cells alone is a poor indicator of a stem-like state. Therefore, we combined analysis of stem-like markers in cells with a computational approach to estimate the developmental potential of a cell. Below, we illustrate this strategy with Celsr1, a dental stem marker previously described in both cichlids and mice (19).
CytoTRACE (60) outperforms other computational approaches to identify quiescent or stem-like cells and is relevant for any species and tissue. CytoTRACE calculates a score for each cell, ranging from 0 to 1, based upon the scaled transcriptional diversity within that cell. Differentiated cells have low transcriptional diversity and low CytoTRACE scores; proliferating/cycling cells have high transcriptional diversity and high CytoTRACE scores; quiescent cells are intermediate in transcriptional diversity with CytoTRACE scores in the range of 0.6-0.8, centered on a mean of 0.7 (60). We thus calculated CytoTRACE scores for each cell of the cichlid datasets, the incisor component of MIM (MIMI), the molar component of MIM (MIMM), and epithelial cells from MI computationally separated by Krivanek et al. (18) (Figures 3A–D and Supplementary Figure 6).
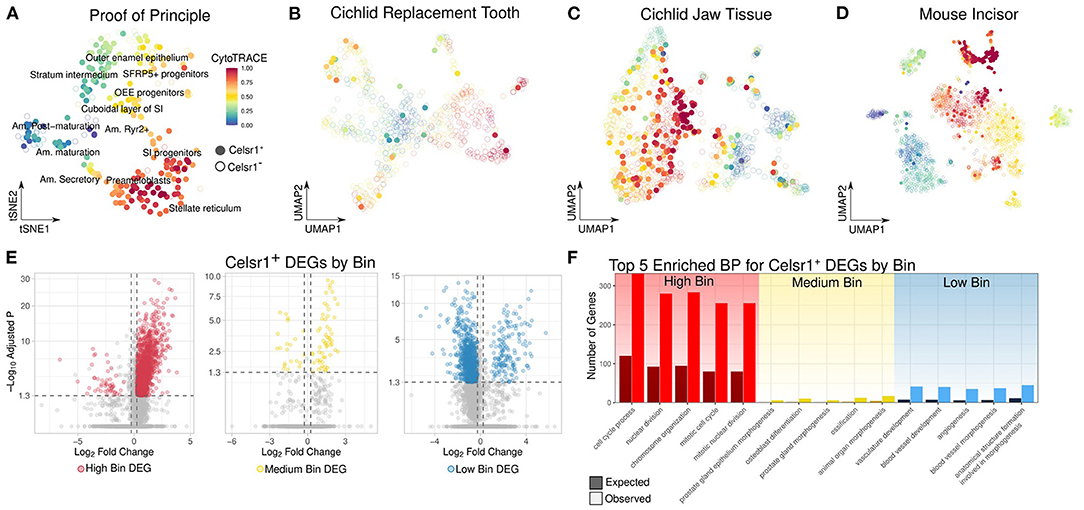
Figure 3. (A–D) UMAP plot of CytoTRACE score in the epithelial cells of from the mouse incisor, cichlid replacement tooth (CT), cichlid soft jaw tissue (CJ), and mouse incisor (MI), respectively. Celsr1+ cells are represented by filled-in circles with no transparency, while Celsr1− cells are shown with open circles with transparency. The color of the circle represents the CytoTRACE score, cells that are more red are less differentiated and more blue are more differentiated. Celsr1+ cells are found in a variety of cell types and differentiation states. (E) Volcano plot of genes differentially expressed between Celsr1+ cells in different differentiation states from the following datasets combined: CT, CJ, MI, and MIMI. Celsr1+ cells were binned by their differentiation state as defined by high, medium, and low CytoTRACE scores. (F) Observed vs. expected number of genes for the top 5 significantly enriched biological processes of upregulated DEGs by bin. Celsr1+ cells in different differentiation states have distinct transcriptional profiles.
As proof of concept in dental cells, we applied CytoTRACE to clusters along an ameloblast differentiation trajectory annotated by Krivanek and colleagues (18). We found strong alignment between CytoTRACE score and the predicted differentiation state of the cell (Figure 3A). For instance, mature ameloblasts have low CytoTRACE scores, Mki67+ cycling cells had high CytoTRACE scores and Sfrp5+ progenitor cells were intermediate, in the range of 0.6–0.75.
We then applied CytoTRACE to all cichlid and mammalian dental datasets and subset cells into celsr1/Celsr1+ and celsr1/Celsr1– populations. In all dental datasets, Celsr1+ cells were found not only in a wide variety of cell types, but also with a wide range of CytoTRACE scores (Figures 3B–D and Supplementary Figure 6). Following previous observations that CytoTRACE scores correlate with the differentiation state of the cell, we generated three equally sized bins of Celsr1+ cells based on CytoTRACE score: low, medium, and high. To enhance statistical power, we combined the following datasets from vertebrates with regenerative dental capabilities: CT, CJ, and MIMI.
We performed differential gene expression analysis of Celsr1+ cells by CytoTRACE bin (Figure 3E) and found a total of 2,616 DEGs that met thresholds described in the Methods. Of those, 1,602 DEGs were found in the high bin, 78 were found in the medium, and 936 were found in the low. In the high bin 97% of DEGs were upregulated, while in the low bin, 83% of DEGs were downregulated. High CytoTRACE scores are defined by high transcriptional diversity, which is also associated with high gene counts, while the converse is true of low CytoTRACE scores (Supplementary Figure 7). Greater gene counts in general makes it more likely that any given gene will be upregulated and this likely explains the observed relationship between CytoTRACE bin and the direction of effects for DEGs.
As expected, we observed classic proliferation marker genes to be high-bin DEGs, such as Mki67 (Bonferroni adjusted p-value = 1.00e−9, average logFC = 2.96), Cdk4 (Bonferroni adjusted p-value = 2.17e−9, average logFC = 1.76), Pcna (Bonferroni adjusted p-value = 7.60e−4, average logFC = 1.28), p53 (Bonferroni adjusted p-value = 2.41e−5, average logFC = 1.15), Mcm2 (Bonferroni adjusted p-value = 7.02e−8, average logFC = 2.00), Mcm6 (Bonferroni adjusted p-value = 1.59e−5, average logFC = 2.07) and Mybl2 (Bonferroni adjusted p-value = 4.78e−9, average logFC = 1.51). The top 5 enriched biological processes of upregulated DEGs in the high bin were cell cycle process (Bonferroni adjusted p-value = 4.40e−65), nuclear division (Bonferroni adjusted p-value = 5.49e−62), chromosome organization (Bonferroni adjusted p-value = 1.43e−61), mitotic cell cycle (Bonferroni adjusted p-value = 1.44e−60), and mitotic nuclear division (Bonferroni adjusted p-value = 1.44e−60) (Figure 3F).
Celsr1+ cells in the medium bin upregulated markers of quiescence, including Sox9 (Bonferroni adjusted p-value = 1.14e−2, average logFC = 0.99); a transcription factor which maintains quiescence of hair follicular stem cells (61); and Notch2 (Bonferroni adjusted p-value = 3.25e−2, average logFC = 1.08), a receptor in the Notch signaling pathway, associated with maintenance of quiescence in cardiac myocytes (62). Other notable genes upregulated in the medium bin of Celsr1+ cells gene include Tnc (Bonferroni adjusted p-value = 5.25e−10, average logFC = 1.97), a glycoprotein which has been shown to induce quiescence in adult human astrocytes (63); Kcnh1 (Bonferroni adjusted p-value = 1.32e−9, average logFC = 1.78), a voltage gated potassium channel protein shown to regulate pluripotency in human induced pluripotent stem cells (64); and Ctnnd2 (Bonferroni adjusted p-value = 1.98e−7, average logFC = 1.36) which encodes δ-Catenin and has been shown to regulate neural stem cell quiescence (65), through the Notch pathway. The top 5 enriched biological process of DEGs in medium-bin Celsr1+ cells are prostate gland epithelium morphogenesis (Bonferroni adjusted p-value = 7.61e−05), osteoblast differentiation (Bonferroni adjusted p-value = 9.97e−05), prostate gland morphogenesis (Bonferroni adjusted p-value = 1.04e−04), ossification (Bonferroni adjusted p-value = 1.14e−04), and animal organ morphogenesis (Bonferroni adjusted p-value = 3.94e−04) (Figure 3F).
Low-bin Celsr1+ DEGs were enriched for the biological processes: vasculature development (Bonferroni adjusted p-value = 1.61e−18), blood vessel development (Bonferroni adjusted p-value = 3.32e−18), angiogenesis (Bonferroni adjusted p-value = 3.11e−17), blood vessel morphogenesis (Bonferroni adjusted p-value = 4.57e−17), and anatomical structure formation involved in morphogenesis (Bonferroni adjusted p-value = 4.70e−15) (Figure 3F). These enriched categories of upregulated DEGs of cells in the low bin indicate a population of putatively differentiated cells associated with a well described role of Celsr1, namely angiogenesis (66).
Our approach of pairing a molecular marker (i.e., Celsr1) with a metric of developmental potential for each cell identifies transcriptional signatures of cells from different differentiation states (i.e., bins). To gauge the degree of specificity of these transcriptional profiles for Celsr1+ cells, we carried out an identical analysis for Celsr1− cells. We observed 12,323 DEGs across high, medium, and low CytoTRACE bins. By inspection, we found DEGs present across the bins of Celsr1+ cells, but not Celsr1− cells. Accordingly, 1,271 DEGs (862 in the high, 68 in the medium, and 341 in the low bin; Supplementary Table 5) were specific to the Celsr1+ cell population. These data indicate that Celsr1+ cells, binned by scores of developmental potential, contain transcriptional profiles distinct by bin, and distinct from cells not expressing Celsr1.
To assess this point directly, we identified DEGs between Celsr1+ and Celsr1− cells in each of the high, medium and low CytoTRACE bins (Figure 4A). Notably, the vast majority (4,799 out of 5,972; 80%) of total DEGs were upregulated in Celsr1+ cells (Supplementary Tables 6, 7). Functional enrichment of DEGs from this direct comparison (Figure 4B) are similar to the analysis by bin for Celsr1+ cells only (Figure 3F). We note that classical markers of proliferation (Mki67, Cdk4, Pcna, Mcm2) are differentially expressed in this direct comparison of Celsr1+ vs. Celsr1− cells for the high bin; and markers of quiescence (Sox9, Notch2, TNC, Ctnnd2) are likewise differentially expressed in the comparison of Celsr1+ vs. Celsr1− cells for the medium bin. Taken together, we have identified distinct transcriptional profiles of Celsr1+ cells sampled from vertebrate teeth and binned by cellular developmental potential, and we have shown that these transcriptional profiles are largely distinct from Celsr1− cells (Figure 4).
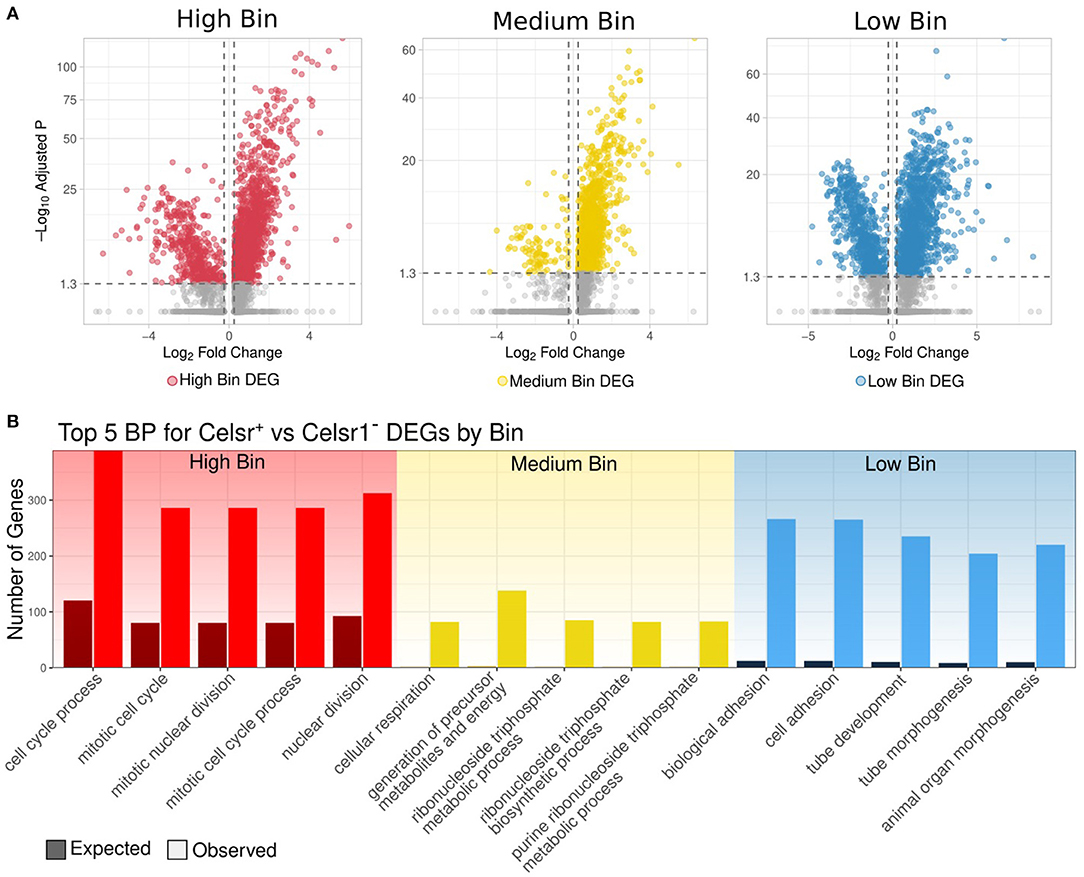
Figure 4. (A) Volcano plot of genes differentially expressed between Celsr1+ and Celsr1− cells in each bin, respectively: high, medium, and low. (B) Observed vs. expected number of genes for the top 5 significantly enriched biological processes of DEGs upregulated in Celsr1+ compared to Celsr1− by bin.
We carried out single nucleus RNA-seq from cichlid fish replacement teeth and oral lamina and compared these cell populations to those from mammalian teeth. With this work we made two main discoveries.
First, we have extended the concept of deep homology of dental gene expression (12, 67) to that of cell populations within teeth. Across hundreds of millions of years of vertebrate evolutionary history, major dental cell types (e.g., mesenchymal, epithelial, immune, endothelial) exhibit strong conservation of gene expression. Dental glial cells, by contrast, appear to have undergone gene expression evolution. We offer a few caveats and ways forward from this analysis. Cichlid replacement teeth are small and difficult to sample. We identified a method to extract, digest tissue and access nuclei from replacement teeth, but improvements can be made as single cell protocols for hard tissues develop. Improved sampling will likely lead to improved data quality from cichlid dental nuclei—this means we should be able to sequence with greater depth and diversity. Although methods exist to compare cell types from different experiments (24, 58, 59), these existing methods could not account for the evolutionary scale and experimental variance of the cell types we compared. We thus invented a strategy to compare cell types across species and samples by comparing the differentially expressed genes within each dataset. This worked well for our purposes, but as the scope of single–cell and single–nucleus datasets increases for vertebrate teeth, more robust comparative methods will need to be developed for deeper biological insights to be achieved.
Having demonstrated conservation of gene expression amongst vertebrate dental cell types, we next asked whether we could ascertain a common signature of stem-like cells in vertebrate regenerating teeth. The approach we chose combines selecting cells based on their expression of a molecular marker (in this case Celsr1/celsr1) with analysis of a cell's developmental potential. In the mouse incisor, Celsr1 marks a population of quiescent cells that are mobilized for accelerated growth after clipping; in cichlid replacement teeth, celsr1 co-localizes with label-retaining cells at the base of the tooth, at the tooth tip and in the cervical loops (19). However, Celsr1 (similar to other markers of stem-like cells) is pleiotropic and single–cell techniques have unprecedented sensitivity such that any chosen marker is likely to be expressed in cells from many clusters and in many differentiation states.
We therefore used CytoTRACE (60) to measure, in an unbiased manner, the differentiation state of every cell in available datasets. We first assessed this approach using annotated single cells along an incisor epithelial differentiation trajectory (18) and then identified the transcriptional signature of Celsr1+ cells, from vertebrate regenerating teeth, that are putatively (i) quiescent, (ii) cycling and (iii) differentiated. Correspondingly, putatively quiescent Celsr1 cells differentially expressed other known markers of quiescence (Sox9, Notch2), while those in the putative cycling state differentially expressed markers associated with mitosis and the cell cycle (Mki67, Cdk4); finally, those in the differentiated state expressed markers of angiogenesis, a known pleiotropic function of Celsr1. Perhaps less expected, these transcriptional signatures are not only statistically distinct from one Celsr1+ CytoTRACE bin to another, but are also statistically distinct in Celsr1+ vs. Celsr1− cell populations. Our discovery of Celsr1+ transcriptional profiles will aid future experiments in targeting specific populations. For instance, Sox9 and Cdk4 could be used to specifically target quiescent vs. cycling Celsr1 dental stem-like cells, respectively, with a transgenic tag or antibodies. In conclusion, our results highlight the advantages of an explicitly comparative strategy to solve fundamental problems in dental and regenerative biology.
Cichlids were housed in the Physiological Research Laboratory at Georgia Institute of Technology (Atlanta, GA) and all experiments were performed according to institutional animal care and use policies. A total of 10 adult male Maylandia zebra individuals (IACUC protocol no. A100028) were used for single–cell experiments. Environmental conditions of aquaria were similar to those of the Lake Malawi environment; subjects were maintained on a 12-h:12-h light:dark cycle with full lights on between 8 am and 6 pm Eastern Standard Time (EST) and dim lights on for 60 min between light-dark transition (7 am−8 am and 6 pm−7 pm EST) in pH=8.2, 26.7°C water and fed twice daily (Spirulina Flake; Pentair Aquatic Ecosystems, Apopka, FL, U.S.A.). All tanks were maintained on a central recirculating system.
Study animals were euthanized by tricaine methanesulfonate (MS-222) immersion and stored on ice until dissection. All animals were euthanized and dissected the day before nuclei preparation. Dissections of the first 10 individuals took place the afternoon before nuclei preparation and yielded a pooled sample of around 300 regenerating teeth along with soft tissue samples from upper and lower oral jaws. Oral jaws were separated from the head (Supplementary Figure 1A) and the soft tissue labial to each jaw was shaved away, exposing the jawbone underneath (Supplementary Figures 1B,C). To harvest regenerating teeth, an incision was made with a scalpel along the length of the exposed jawbone just under the line of surface teeth. The tip of the scalpel was then inserted into the cut and used to pry the outermost layer of bone up and off, exposing the tooth crypt containing 10–20 regenerating teeth. Teeth from all 10 animals were removed using forceps and pooled in 1 mL of 1x HBSS at −20°C overnight. Soft tissue was saved from both jaws of a single individual and stored at −20°C overnight. The following day, soft tissues were divided into four roughly 50 mg segments, which were processed separately and then pooled at the end of nuclei preparation. Each tissue segment was placed in 1 mL each of 1x HBSS (Sigma-Aldrich H4385) and briefly stored on ice (~30 min) while reagents were prepared for nuclei preparation.
All steps were performed at 4°C in a cold room. Nuclei preparation methods were based on the 10x Genomics Demonstrated Protocol for lysis and washing of single nuclei. To this protocol the following modifications were made: 1x HBSS was used in place of HEB; tissues were placed in lysis buffer for 10 min (to account for a smaller tissue mass) and then homogenized with disposable pellet pestles (Sigma-Aldrich Z359947) before halting lysis with HBSS; the tissue was suspended in 300 μL of wash buffer and passed through a 30 μm MACS SmartStrainer once before proceeding to FACS.
Filtered samples were stained with DAPI at a concentration of 0.1 μL DAPI per 100 μL of suspension and sorted using the BD FACSAria Fusion. Gates were set conservatively to collect DAPI+ singlet nuclei (Supplementary Figure 2) and nuclei were sorted into 200 μL of wash buffer. Total volume in each collection tube was recorded, collected nuclei were centrifuged at 300 rcf, 4°C for 10 min and supernatant was removed, leaving nuclei suspended in 50 μL of wash buffer. Event counts registered during sorting were used to estimate final cell suspension concentrations: from upper jaw soft tissue, 20,668 nuclei were collected for a final concentration of 413 nuclei/μL; from lower jaw soft tissue, 20,181 nuclei were collected for a final concentration of 403 nuclei/μL; from regenerating teeth 14,700 nuclei were collected for a final concentration of 294 nuclei/μL.
Libraries were prepared for sequencing by the Genome Analysis Core at Georgia Tech using the 10x Chromium V3 Single Cell Gene Expression Solution protocol and reagent kit (10x Genomics 1000092) with a targeted cell recovery of 3,000 nuclei per sample. Sequencing was performed by the Molecular Evolution Core at Georgia Tech; libraries were sequenced on an NextSeq 500 (Illumina SY-415-1001). Soft tissue libraries were pooled and sequenced in one lane; tooth libraries were sequenced in a separate lane.
FASTQ files were processed with Cell Ranger version 3.1.0 (10X Genomics) (68), including alignment, filtering, barcode counting, and UMI counting. We obtained the Maylandia zebra Lake Malawi cichlid genome assembly (69) from NCBI RefSeq (assembly accession: GCF_000238955.4; Assembly name: M_zebra_UMD2a) and annotations from Ensembl version 98. Because nuclear RNA contains intronic sequences, reads were mapped to the M. zebra reference genome (including intronic regions) using a splice–aware alignment algorithm (STAR) within Cell Ranger using the count command with the default options. During alignment Cell Ranger filtered out UMIs that are homopolymers, contain N, or contain any base with a quality score <10. These steps were followed separately for the replacement teeth, the upper and lower jaw samples. The upper and lower samples were aggregated into one sample, hereby referred to as the soft jaw sample, using cellranger aggr. For all the samples, Cell Ranger generated a filtered feature–barcode matrix containing expression data for a total of 28,622 features (corresponding to genes). The number of total barcodes (corresponding to putative nuclei) were 821 and 1,381 for the replacement teeth and soft jaw samples, respectively.
Many software suites exist for single cell RNA-seq analysis. Seurat v3 was chosen for its wide use in the field, robust documentation, control given to users over the parameters used, and flexibility in conversion to other data types. The filtered feature matrices from Cellranger were imported into Seurat. The matrices were normalized using the default method, which normalizes feature counts in a cell by the total number of counts for all features in the cell. Potential dead cells, doublets, and multiplets were filtered out by removing cells with >2,500 feature counts and 5% mitochondrial transcripts. Different minimum thresholds for feature counts were used for replacement teeth and jaw samples since these were different library preparations with distinct quality parameters. Thresholds employed were 125 and 300 feature counts for the replacement teeth and soft jaw samples, respectively. Next, features with high cell to cell variation were identified and the data was scaled prior to dimensionality reduction. PCA was used to reduce dimensionality, the first 30 principal components were calculated since all were determined as significant from JackStraw plots. A shared nearest neighbor graph was constructed using k = 20, from these Seurat-determined clusters of cells.
After clustering cells, DEGs for each cluster were examined in order to determine their biological identities. DEGs were found using the FindAllMarkers function from Seurat using the default thresholds, including the default logfc.threshold = 0.25 and min.pct = 0.1. DEGs were genes that had a Bonferroni adjusted p-value < 0.05. These DEGs from our clusters were compared to known markers for dental cell types with the most weight given to DEGs with the strongest adjusted p-values. Human orthologs for cichlid gene names were found using the BioConductor package in R and from a phylogeny-based approach using the TreeFam database (70). Next, DEGs were calculated by cichlid cell type and these are the cluster DEGs referred to throughout unless otherwise noted. These DEGs were again compared to known dental cell type markers to ensure accuracy.
Single cell RNA-seq data from Krivanek et al. (18) was acquired from the author's website: http://pklab.med.harvard.edu/ruslan/dental.atlas.html. The datasets used include the “General mouse incisor atlas”, “Comparative map of mouse incisor and molar teeth”, and “Human adult and growing molar teeth”. The counts matrices were used to create Seurat objects and the spatial coordinates of cells from the author's website were imported into the objects. The function FindAllMarkers from Seurat was used to find cluster DEGs for each cell type as annotated by the authors.
DEGs for each cell type within the mouse and human datasets were found using the FindAllMarkers function in Seurat using the default thresholds. Next, the DEGs from each cluster from each dataset were compared to one another in a pairwise manner. The number of DEGs that were consistent in direction, either both upregulated or downregulated, in the clusters was recorded. This number representing the overlap of DEGs was then normalized by the total number of DEGs in both clusters. For pairwise clusters that included a cichlid cluster in the comparison, a correction factor was applied to account for cichlid gene names where human orthologs could not be found, likely because of evolutionary divergence. The correction factor is equal to the number of cichlid cluster DEGs with human orthologs divided by the total number of cichlid cluster DEGs. The correction factor was roughly ~80% for all cichlid clusters. This process was repeated for pairwise datasets with colors scaled by column in order to determine which mouse or human dataset had the greatest similarity with the cichlid clusters.
As another measure to ascertain the degree of homology between cell types in vertebrate dentition, we found both the magnitude of the expression of the top 100 unique mammalian cell type DEGs and the number of those expressed in each cell type in cichlids. For each cell type, we found DEGs with the most significant Bonferroni adjusted p-values that were additionally not a DEG for another cell type within each mammalian dataset. Next, the relative expression of these were found in the cichlid data sets using the ScaleData function in Seurat with the default parameters. The relative expression in the cichlid clusters was then summed for each mammalian cell type. Additionally, the identity of genes from the top 100 unique mammalian cell type DEGs that were expressed in each cichlid cell type was determined and the top 5 were noted.
CytoTRACE [Cellular (Cyto) Trajectory Reconstruction Analysis using gene Counts and Expression] (60) version 0.3.3 was used to determine the differentiation state of each cell. Many lineage trajectory algorithms exist for single nuclei data, but many rely on a priori knowledge of the starting point, intermediate states, or end point. In addition, other approaches have difficulty distinguishing between quiescent cells and mature cell types. CytoTRACE overcomes these weaknesses and has been validated on 33 scRNA-seq datasets. CytoTRACE determines the differentiation state of a cell based on transcriptional diversity, the number of genes expressed in the cell. More differentiated nuclei tend to restrict chromatin accessibility resulting in a decrease in transcriptional diversity. The raw transcript counts for each gene and cell were supplied to CytoTRACE using the default settings. CytoTRACE supplied a score for each cell ranging from 0 to 1. A score of 0 indicates a more differentiated nucleus and a score of 1 indicates a less differentiated nucleus. CytoTRACE ranks the differentiation state of cells relative to the others in the input, therefore CytoTRACE was performed on each dataset separately.
First, CytoTRACE was run on the data to find the differentiation state of the cells. The cells in the bottom third quantile of CytoTRACE scores were put in the low bin, the middle quantile created the medium bin, and the top third quantile formed the high bin. Next, FindAllMarkers was run with the default parameters excluding the following: logfc.threshold = 0, and min.pct = 0.01. Then the percent difference in expression was calculated as pct.1 – pct.2 DEGs that mark the differentiation states of Celsr1+ and Celsr1− cells are genes that pass the following criteria: Bonferroni adjusted p-value < 0.05, absolute average logFC >0.25, absolute percent difference between bins >5%, and average logFC and percent difference in the same direction of effect (ie positive average logFC and positive percent difference). The DEGs found in corresponding bins Celsr1+ and Celsr1− were compared. The average logFC values were subtracted (ɤ) as well as their percent differences (Ω). DEGs that mark differentiation states of Celsr1+, but not Celsr1− had to pass these additional criteria: | ɤ| > 0.25, | Ω | > 5%, and ɤand Ω in the same direction of effect. Finally DEGs present in both Celsr1+ and Celsr1- of opposite direction of effect were not filtered (ie upregulated in one population and downregulated in the other).
Instead of comparing the DEGs between CytoTRACE bins in Celsr1+ to those in Celsr1–, an additional, more direct approach was taken. After applying the same approach to create CytoTRACE bins outlined above on Celsr1+ and Celsr1– cells independently, DEGs were found between Celsr1+ and Celsr1– in each bin: high, medium and low. This was done using the FindMarkers function from Seurat with the default thresholds, including the default logfc.threshold = 0.25 and min.pct = 0.1.
To gain more biological insight into lists of DEGs, pathway enrichment analysis was performed using ToppGene (71). GO terms from categories including Biological Process, Molecular Function, and Cellular Component are ranked by their overrepresentation in the query list. Additionally, p-values and p-values adjusted for multiple comparisons are returned. We compared the observed vs. expected number of genes in the query list in the top 5 Biological Process GO terms. The observed values are the number of genes in the query list in the GO term and the expected values are the number of genes in the query list multiplied by the number of genes in the GO term divided by the number of genes in the genome.
The original contributions presented in the study are publicly available. This data can be found here: https://www.ncbi.nlm.nih.gov/geo/query/acc.cgi?acc=GSE193287 and https://www.ncbi.nlm.nih.gov/bioproject/PRJNA795669.
The animal study was reviewed and approved by Georgia Tech Institutional Animal Care and Use Committee (IACUC) protocols (permit A100003).
JSt conceived of the project. CP and JSt carried out the experiments. GG analyzed the data with significant intellectual contributions from TM and JSt. GG, TM, and JSt wrote the manuscript. All authors contributed to the article and approved the submitted version.
This work was supported by National Institute of Dental and Craniofacial Research (NIDCR) Grant R01 DE019637 (to JS).
The authors declare that the research was conducted in the absence of any commercial or financial relationships that could be construed as a potential conflict of interest.
All claims expressed in this article are solely those of the authors and do not necessarily represent those of their affiliated organizations, or those of the publisher, the editors and the reviewers. Any product that may be evaluated in this article, or claim that may be made by its manufacturer, is not guaranteed or endorsed by the publisher.
The Supplementary Material for this article can be found online at: https://www.frontiersin.org/articles/10.3389/fdmed.2022.845449/full#supplementary-material
Supplementary Figure 1. (A) Sequence of cuts made to separate upper and lower oral jaws from the head. (B) A standard razor blade was used to shave soft tissue from the labial surface of each jaw. (C) Once soft tissue was removed, replacement teeth were visible in the tooth crypt beneath. Replacement teeth are colored red by mineralization.
Supplementary Figure 2. Plots showing gating strategies employed for single nuclei sorting (A–C). FACS gating strategy targeting DAPI+ nuclei from cichlid replacement teeth. (D–F). FACS gating strategy targeting DAPI+ nuclei from soft jaw tissue of the upper jaws. (G–I) FACS gating strategy targeting DAPI+ nuclei from soft jaw tissue of the lower jaws. (A,D,G) Nuclei are circled. (B,E,H) Singlets from within the selected population are boxed/circled. (C,F,I) DAPI+ nuclei within the selected population are boxed. These steps ensured an optimal collection of singlet nuclei prior to sequencing.
Supplementary Figure 3. (A) Violin plot of the number of UMIs in each cell grouped by cell type in the cichlid replacement tooth. (B) Violin plot of the number of genes in each cell grouped by cell type in the cichlid replacement tooth. (C) Violin plot of the number of UMIs in each cell grouped by cell type in the cichlid soft jaw tissue. (D) Violin plot of the number of genes in each cell grouped by cell type in the cichlid soft jaw tissue.
Supplementary Figure 4. (A,B) Select enriched biological processes of upregulated DEGs in replacement teeth and surrounding soft jaw tissue cell types, respectively.
Supplementary Figure 5. (A,C,E) Violin plot of the number of UMIs per cell grouped by cell type in the mouse incisor, mouse incisor and molar, and human molar, respectively. (B,D,F) Violin plot of the number of genes in each cell grouped by cell type in the mouse incisor, mouse incisor and molar, and human molar, respectively. Points on the plot represent cells, except in human samples where the points have been due to the large number of cells present.
Supplementary Figure 6. UMAP plot of CytoTRACE score in the incisor component of the mouse incisor and molar (MIMI). Celsr1+ cells are represented by filled-in circles with no transparency., while Celsr1− cells are shown with open circles with transparency. The color of the circle represents the CytoTRACE score, cells that are more red are less differentiated and more blue are more differentiated. Celsr1+ cells are found in a variety of cell types and differentiation states.
Supplementary Figure 7. (A–E) Transcriptional diversity and number of UMIs have a strong correlation in CT, CJ, MI, MIM, and HM respectively.
Supplementary Table 1. Differentially expressed genes that define cell types in the cichlid replacement tooth with ToppGene enrichment of positive DEGs.
Supplementary Table 2. Differentially expressed genes that define cell types in the cichlid soft jaw tissue with ToppGene enrichment of positive DEGs.
Supplementary Table 3. Top 100 upregated DEGs per cell type in mouse incisor, mouse incisor and molar, and human molar. These DEGs are also required to not be a DEG in any cell type within each dataset.
Supplementary Table 4. DEGs, with ToppGene enrichment of positive DEGs, between Celsr1+ cells binned by CytoTRACE score into three even bins: high, medium, and low.
Supplementary Table 5. DEGs, with ToppGene enrichment of positive DEGs, in Celsr1+ cells binned by CytoTRACE that are not DEGs in the corresponding bins of Celsr1− cells.
Supplementary Table 6. DEGs between Celsr1+ and Celsr1− by bin that are upregulated in Celsr1+ with ToppGene enrichment.
Supplementary Table 7. DEGs between Celsr1+ and Celsr1− by bin that are upregulated in Celsr1− with ToppGene enrichment.
1. rácek I and Cerny R R Dual epithelial origin of vertebrate oral teeth Nature. (2008) 455:795–8. doi: 10.1038/nature07304
2. Barlow LA, Northcutt RG. Embryonic origin of amphibian taste buds. Dev Biol. (1995) 169:273–85. doi: 10.1006/dbio.1995.1143
3. Imai H, Osumi N, Eto K. Contribution of foregut endoderm to tooth initiation of mandibular incisor in rat embryos. Eur J Oral Sci. (1998) 106:19–23. doi: 10.1111/j.1600-0722.1998.tb02148.x
4. Zhao H, Feng J, Seidel K, Shi S, Klein O, Sharpe P. Secretion of Shh by a Neurovascular Bundle Niche Supports Mesenchymal Stem Cell Homeostasis in the Adult Mouse Incisor. Cell Stem Cell. (2018) 147. doi: 10.1016/j.stem.2018.05.023
5. Juuri E, Saito K, Ahtiainen L, Seidel K, Tummers M, Hochedlinger K. Sox2+ stem cells contribute to all epithelial lineages of the tooth via Sfrp5+ progenitors. Dev Cell. (2012) 23:317–28. doi: 10.1016/j.devcel.2012.05.012
6. Richman JM, Handrigan GR. Reptilian tooth development. Genesis. (2011) 49:247–60. doi: 10.1002/dvg.20721
7. Bloomquist RF, Fowler TE, An Z, Abdilleh YTY, Fraser K GJ, et al. Developmental plasticity of epithelial stem cells in tooth and taste bud renewal. Proc Natl Acad Sci USA. (2019) 116:17858–66. doi: 10.1073/pnas.1821202116
8. Handrigan GR, Leung KJ, Richman JM. Identification of putative dental epithelial stem cells in a lizard with life-long tooth replacement. Development. (2010) 137:3545–9. doi: 10.1242/dev.052415
9. Fraser GJ, Hamed SS, Martin KJ, Hunter KD. Shark tooth regeneration reveals common stem cell characters in both human rested lamina and ameloblastoma. Sci Rep. (2019) 9:15956. doi: 10.1038/s41598-019-52406-z
10. Popa E M, Buchtova M, Tucker A. S. Revitalising the rudimentary replacement dentition in the mouse. Development. (2019) 146. doi: 10.1242/dev.171363
11. Whitlock JA, Richman JM. Biology of tooth replacement in amniotes. Int J Oral Sci. (2013) 5:66–70. doi: 10.1038/ijos.2013.36
12. Fraser GJ, Cerny R, Soukup V, Bronner-Fraser M, Streelman JT. The odontode explosion: the origin of tooth-like structures in vertebrates. Bioessays. (2010) 32:808–17. doi: 10.1002/bies.200900151
13. Tucker AS, Fraser GJ. Evolution and developmental diversity of tooth regeneration. Semin Cell Dev Biol. (2014) 25–26:71–80. doi: 10.1016/j.semcdb.2013.12.013
14. Thesleff I, Järvinen E, Suomalainen M. Affecting tooth morphology and renewal by fine-tuning the signals mediating cell and tissue interactions. Tinker Microevol Dev. (2007) 142–57. doi: 10.1002/9780470319390.ch10
15. Tummers M and Thesleff I. The importance of signal pathway modulation in all aspects of tooth development. J Exp Zool B Mol Dev Evol. (2009) 312B:309–19. doi: 10.1002/jez.b.21280
16. Fraser GJ, Bloomquist RF, Streelman JTA. periodic pattern generator for dental diversity. BMC Biol. (2008) 6:32. doi: 10.1186/1741-7007-6-32
17. Krivanek J, Adameyko I, Fried K. Heterogeneity and developmental connections between cell types inhabiting teeth. Front Physiol. (2017) 8:376. doi: 10.3389/fphys.2017.00376
18. Krivanek J, Soldatov RA, Kastriti ME, Chontorotzea T, Herdina AN, Petersen J. Dental cell type atlas reveals stem and differentiated cell types in mouse and human teeth. Nat Commun. (2020) 11:4816. doi: 10.1038/s41467-020-18512-7
19. An Z, Sabalic M, Bloomquist RF, Fowler TE, Streelman T, Sharpe PTA. quiescent cell population replenishes mesenchymal stem cells to drive accelerated growth in mouse incisors. Nat Commun. (2018) 9:378. doi: 10.1038/s41467-017-02785-6
21. van den Brink SC, Sage F, Vértesy Á, Spanjaard B, Peterson-Maduro J, Baron CS. Single-cell sequencing reveals dissociation-induced gene expression in tissue subpopulations. Nat Methods. (2017) 14:935–6. doi: 10.1038/nmeth.4437
22. Ding J, Adiconis X, Simmons SK, Kowalczyk MS, Hession CC, Marjanovic ND. Systematic comparison of single-cell and single-nucleus RNA-sequencing methods. Nat Biotechnol. (2020) 38:737–46. doi: 10.1038/s41587-020-0465-8
23. Bloomquist RF Parnell NF Phillips KA Fowler TE Sharpe Sharpe YTY Coevolutionary patterning of teeth and taste buds. Proc Natl Acad Sci USA. (2015) 112:E5954–62. doi: 10.1073/pnas.1514298112
24. Stuart T, Butler A, Hoffman P, Hafemeister C, Papalexi E, Mauck WM, et al. Comprehensive integration of single-cell data. Cell. (2019) 177:1888–902.e21. doi: 10.1016/j.cell.2019.05.031
25. Korhonen EA, Lampinen A, Giri H, Anisimov A, Kim M, Allen B. Tie1 controls angiopoietin function in vascular remodeling and inflammation. J Clin Invest. (2016) 126:3495–510. doi: 10.1172/JCI84923
26. Fachinger G, Deutsch U, Risau W. Functional interaction of vascular endothelial-protein-tyrosine phosphatase with the angiopoietin receptor Tie-2. Oncogene. (1999) 18:5948–53. doi: 10.1038/sj.onc.1202992
27. Bäumer S, Keller L, Holtmann A, Funke R, August B, Gamp A. Vascular endothelial cell-specific phosphotyrosine phosphatase (VE-PTP) activity is required for blood vessel development. Blood. (2006) 107:4754–62. doi: 10.1182/blood-2006-01-0141
28. Woodfin A, Voisin M-B, Nourshargh S. (2007). PECAM-1: a multi-functional molecule in inflammation and vascular biology. Arterioscler Thromb Vasc Biol. 27, 2514–23. doi: 10.1161/ATVBAHA.107.151456
29. Kaur S, Castellone MD, Bedell VM, Konar M, Gutkind JS, Ramchandran R. Robo4 signaling in endothelial cells implies attraction guidance mechanisms. J Biol Chem. (2006) 281:11347–56. doi: 10.1074/jbc.M508853200
30. Oh M, Nör JE. The Perivascular Niche and Self-Renewal of Stem Cells. Front Physiol. (2015) 6:367. doi: 10.3389/fphys.2015.00367
31. St Amand TR, Zhang Y, Semina EV, Zhao X, Hu Y, Nguyen L. Antagonistic signals between BMP4 and FGF8 define the expression of Pitx1 and Pitx2 in mouse tooth-forming anlage. Dev Biol. (2000) 217:323–32. doi: 10.1006/dbio.1999.9547
32. Zhang YD, Chen Z, Song YQ, Liu C, Chen YP. Making a tooth: growth factors, transcription factors, and stem cells. Cell Res. (2005) 15:301–16. doi: 10.1038/sj.cr.7290299
33. Tucker A, Sharpe P. The cutting-edge of mammalian development; how the embryo makes teeth. Nat Rev Genet. (2004) 5:499–508. doi: 10.1038/nrg1380
34. Hosoya A, Shalehin N, Takebe H, Shimo T, Irie K. Sonic hedgehog signaling and tooth development. Int J Mol Sci. (2020) 21. doi: 10.3390/ijms21051587
35. Lee H-K, Park JS, Choung S-J, Choi H-W, Lee YH-J, et al. Odontogenic ameloblast-associated protein (odam) mediates junctional epithelium attachment to teeth via integrin-ODAM-Rho Guanine Nucleotide Exchange Factor 5 (ARHGEF5)-RhoA Signaling. J Biol Chem. (2015) 290:14740–53. doi: 10.1074/jbc.M115.648022
36. Modolo F, Martins MT, Loducca SVL, de de Araujo VC. Expression of integrin subunits alpha2, alpha3, alpha5, alphav, beta1, beta3 and beta4 in different histological types of ameloblastoma compared with dental germ, dental lamina and adult lining epithelium. Oral Dis. (2004) 10:277–82. doi: 10.1111/j.1601-0825.2004.01028.x
37. Løes S, Kettunen P, Kvinnsland IH, Taniguchi M, Fujisawa H, Luukko K. Expression of class 3 semaphorins and neuropilin receptors in the developing mouse tooth. Mech Dev. (2001) 101:191–4. doi: 10.1016/S0925-4773(00)00545-1
38. Pemberton TJ, Li F-Y, Oka S, Mendoza-Fandino GA, Hsu Y-H, Bringas P. Identification of novel genes expressed during mouse tooth development by microarray gene expression analysis. Dev Dyn. (2007) 236, 2245–57. doi: 10.1002/dvdy.21226
39. Wang L, Yang H, Lin X, Cao Y, Gao P, Zheng Y. KDM1A regulated the osteo/dentinogenic differentiation process of the stem cells of the apical papilla via binding with PLOD2. Cell Prolif. (2018) 51:e12459. doi: 10.1111/cpr.12459
40. Alkhayal Z, Shinwari Z, Gaafar A, Alaiya A. Proteomic Profiling of the First Human Dental Pulp Mesenchymal Stem/Stromal Cells from Carbonic Anhydrase II Deficiency Osteopetrosis Patients. Int J Mol Sci. (2020) 22. doi: 10.3390/ijms22010380
41. Frith J, Genever P. Transcriptional control of mesenchymal stem cell differentiation. Transf Med Hemother. (2008) 35:216–27. doi: 10.1159/000127448
42. Kawasaki K, Kawasaki M, Watanabe M, Idrus E, Nagai T, Oommen S. Expression of Sox genes in tooth development. Int J Dev Biol. (2015) 59:471–8. doi: 10.1387/ijdb.150192ao
43. Kang C-M, Kim S-O, Jeon M, Choi H-J, Jung H-S, Lee J-H. Comparison of stemness and gene expression between gingiva and dental follicles in children. Stem Cells Int. (2016) 35:8596520. doi: 10.1155/2016/8596520
44. Talavera K, Yasumatsu K, Voets T, Droogmans G, Shigemura N, Ninomiya Y. Heat activation of TRPM5 underlies thermal sensitivity of sweet taste. Nature. (2005) 438:1022–5. doi: 10.1038/nature04248
45. Hevezi P, Moyer BD, Lu M, Gao N, White E, Echeverri F. Genome-wide analysis of gene expression in primate taste buds reveals links to diverse processes. PLoS ONE. (2009) 4:e6395. doi: 10.1371/journal.pone.0006395
46. Romanov RA, Kolesnikov SS. Electrophysiologically identified subpopulations of taste bud cells. Neurosci Lett. (2006) 395:249–54. doi: 10.1016/j.neulet.2005.10.085
47. Roper S. Faculty Opinions recommendation of Hyperpolarization-activated channels HCN1 and HCN4 mediate responses to sour stimuli. Faculty Opin Post Publ Peer Rev Biomed Liter. (2002). doi: 10.3410/f.1003646.36405
48. McCoy ES, Taylor-Blake B, Zylka MJ. CGRPα-expressing sensory neurons respond to stimuli that evoke sensations of pain and itch. PLoS ONE. (2012) 7:e36355. doi: 10.1371/journal.pone.0036355
49. Claudinot S, Sakabe J-I, Oshima H, Gonneau C, Mitsiadis T, Littman D, et al. Tp63-expressing adult epithelial stem cells cross lineages boundaries revealing latent hairy skin competence. Nat Commun. (2020) 11. doi: 10.1038/s41467-020-19485-3
50. Kawakami A, Fisher DE. The master role of microphthalmia-associated transcription factor in melanocyte and melanoma biology. Lab Invest. (2017) 97:649–56. doi: 10.1038/labinvest.2017.9
51. Rees JLT. 1 Receptor (MC1R): More Than Just Red Hair. Pigment Cell Res. (2000) 13:135–40. doi: 10.1034/j.1600-0749.2000.130303.x
52. Strunnikova NV, Maminishkis A, Barb JJ, Wang F, Zhi C, Sergeev Y. Transcriptome analysis and molecular signature of human retinal pigment epithelium. Hum Mol Genet. (2010) 19:2468–86. doi: 10.1093/hmg/ddq129
53. Parichy DM, Ransom DG, Paw B, Zon LI, Johnson SL. An orthologue of the kit-related gene fms is required for development of neural crest-derived xanthophores and a subpopulation of adult melanocytes in the zebrafish, Danio rerio. Development. (2000) 127:3031–44. doi: 10.1242/dev.127.14.3031
54. Minton K. TOX2 helping hand for TFH cells. Nat Rev Immunol. (2020) 20:4–5. doi: 10.1038/s41577-019-0249-x
55. Sakakibara A, Ohba Y, Kurokawa K, Matsuda M, Hattori S. Novel function of Chat in controlling cell adhesion via Cas-Crk-C3G-pathway-mediated Rap1 activation. J Cell Sci. (2002) 115:4915–24. doi: 10.1242/jcs.00207
56. Rabanus JP, Gelderblom HR, Schuppan D, Becker J. Distribution of collagens type V and VI in the normal human alveolar mucosa: an immunoelectronmicroscopic study using ultrathin frozen sections. J Periodontal Res. (1991) 26:138–43. doi: 10.1111/j.1600-0765.1991.tb01637.x
57. Kim SH, Lee WH, Kim SW, Je HU, Lee JC, Chang HW. EphA3 maintains radioresistance in head and neck cancers through epithelial mesenchymal transition. Cell Signal. (2018) 47:122–30. doi: 10.1016/j.cellsig.2018.04.001
58. Barkas N, Petukhov V, Nikolaeva D, Lozinsky Y, Demharter S, Khodosevich K. Joint analysis of heterogeneous single-cell RNA-seq dataset collections. Nat Methods. (2019) 16:695–8. doi: 10.1038/s41592-019-0466-z
59. Hie B, Bryson B, Berger B. Efficient integration of heterogeneous single-cell transcriptomes using Scanorama. Nat Biotechnol. (2019) 37:685–91. doi: 10.1038/s41587-019-0113-3
60. Gulati GS, Sikandar SS, Wesche DJ, Manjunath A, Bharadwaj A, Berger MJ. Single-cell transcriptional diversity is a hallmark of developmental potential. Science. (2020) 367:405–11. doi: 10.1126/science.aax0249
61. Kadaja M, Keyes BE, Lin M, Pasolli HA, Genander M, Polak L. SOX9: a stem cell transcriptional regulator of secreted niche signaling factors. Genes Dev. (2014) 28:328–41. doi: 10.1101/gad.233247.113
62. Campa VM, Gutiérrez-Lanza R, Cerignoli F, Díaz-Trelles R, Nelson B, Tsuji T. Notch activates cell cycle reentry and progression in quiescent cardiomyocytes. J Cell Biol. (2008) 183:129–41. doi: 10.1083/jcb.200806104
63. Holley JE, Gveric D, Whatmore JL, Gutowski NJT. induces a quiescent phenotype in cultured adult human astrocytes. Glia. (2005) 52:53–8. doi: 10.1002/glia.20231
64. Firth AL, Yuan JX-J. Ether-à-go-go” proliferation of iPSC-derived mesenchymal stem cells. Focus on “Regulation of cell proliferation of human induced pluripotent stem cell-derived mesenchymal stem cells via ether-à-go-go 1 (hEAG1) potassium channel.” Am J Physiol Cell Physiol. 303:C113–4. doi: 10.1152/ajpcell.00160.2012
65. Schaberg E, Götz M, Faissner A. Cell tracking of adult neural stem cells from the subependymal zone in vitro reveals cell type-specific impacts on cell cycle progression by the extracellular matrix molecule tenascin-C.
66. Zhan Y-H, Luo Q-C, Zhang X-R, Xiao N-A, Lu C-X, Yue C. CELSR1 Is a positive regulator of endothelial cell migration and angiogenesis. Biochemistry. (2016) 81:591–9. doi: 10.1134/S0006297916060055
67. Smith MM, Fraser GJ, Mitsiadis TA. Dental lamina as source of odontogenic stem cells: evolutionary origins and developmental control of tooth generation in gnathostomes. J Exp Zool B Mol Dev Evol. (2009) 312B:260–80. doi: 10.1002/jez.b.21272
68. Zheng GXY, Terry JM, Belgrader P, Ryvkin P, Bent ZW, Wilson R. Massively parallel digital transcriptional profiling of single cells. Nat Commun. (2017) 8:14049. doi: 10.1038/ncomms14049
69. Conte MA, Joshi R, Moore EC, Nandamuri SP, Gammerdinger WJ, Roberts RB. Chromosome-scale assemblies reveal the structural evolution of African cichlid genomes. Gigascience. (2019) 8. doi: 10.1093/gigascience/giz030
70. Ramakrishnan Varadarajan A, Mopuri R, Streelman JT. McGrath PT. Genome-wide protein phylogenies for four African cichlid species. BMC Evol Biol. (2018) 18:1. doi: 10.1186/s12862-017-1072-2
Keywords: tooth replacement, stem cell, cichlid fish, single nuclei RNA-Seq, dentition
Citation: Gruenhagen GW, Mubeen T, Patil C, Stockert J and Streelman JT (2022) Single Cell RNA Sequencing Reveals Deep Homology of Dental Cell Types Across Vertebrates. Front. Dent. Med. 3:845449. doi: 10.3389/fdmed.2022.845449
Received: 29 December 2021; Accepted: 09 May 2022;
Published: 30 May 2022.
Edited by:
Han Sung Jung, Yonsei University, South KoreaCopyright © 2022 Gruenhagen, Mubeen, Patil, Stockert and Streelman. This is an open-access article distributed under the terms of the Creative Commons Attribution License (CC BY). The use, distribution or reproduction in other forums is permitted, provided the original author(s) and the copyright owner(s) are credited and that the original publication in this journal is cited, in accordance with accepted academic practice. No use, distribution or reproduction is permitted which does not comply with these terms.
*Correspondence: George W. Gruenhagen, Z3dnQGdhdGVjaC5lZHU=
Disclaimer: All claims expressed in this article are solely those of the authors and do not necessarily represent those of their affiliated organizations, or those of the publisher, the editors and the reviewers. Any product that may be evaluated in this article or claim that may be made by its manufacturer is not guaranteed or endorsed by the publisher.
Research integrity at Frontiers
Learn more about the work of our research integrity team to safeguard the quality of each article we publish.