 Tommaso Castroflorio1*
 Ambra Sedran1Francesca Spadaro1Gabriele Rossini1Giovanni Cugliari2
 Vincenzo Quinzi3
 Andrea Deregibus1
- 1Department of Surgical Sciences, Specialization School of Orthodontics, Dental School, University of Turin, Turin, Italy
- 2Department of Medical Sciences, University of Turin, Turin, Italy
- 3Department of Life, Health and Environmental Sciences Postgraduate School of Orthodontics, University of L'Aquila, L'Aquila, Italy
Objectives: The aims of this study were: (1) to assess the average inter-arch distances characterizing Class II malocclusions, (2) to analyze the applied forces at those distances by different elastics, and (3) to compare measured forces with those declared by manufacturers, both in dry and wet environments.
Materials and Methods: Settings and sample population: Class II models of 167 adult subjects (96 women and 71 men, age: 28 ± 3 years) referred to the Orthodontic Department of the University of Turin, Turin, Italy, between January 2018 and January 2020, were collected. Distances between facial axes (FA) points of upper canines and lower first molars (A), upper first premolar and lower first molar (B), upper second premolar and lower first molar (C), upper canine and lower first premolar (D), and upper canine and lower second premolar (E), were measured using 3Shape Ortho® Viewer program. Different elastics' diameters and forces were tested at those distances. The MTS Insight® Electromechanical Testing System was used to measure the tensile forces of elastics. The applied forces were measured in dry (T0) and wet conditions, after 1 (T1), 6 (T2), and 12 h (T3).
Results: Average distances were calculated: A = 24.64 mm (SD 2.10), B = 16.3 mm (SD 1.94), C = 9.78 mm (SD 1.77), D = 9.8 mm (SD 1.88), and E = 15.99 mm (SD 2.06). Significant differences (p < 0.05) were highlighted between the measured force and the force declared by manufacturers, and all elastics had a significant force decay (p < 0.05).
Conclusion: The results showed that 3/16" 4.5 oz are the most reliable elastics in terms of applied force with respect to the declared one and in terms of force degradation.
Introduction
Inter-arch elastics are considered one of the most important auxiliaries in orthodontics, supporting the correction of molar relationship, spaces closure, and anchorage management.
Despite the widespread use of elastics in the orthodontic community, there are conflicting data on their mechanical properties. Applied forces are dependent on materials, sizes, and application sites. Anecdotally, the declared force is obtained when the elastic is stretched out three times its original diameter, but evidence supporting this suggestion is still lacking (1–3).
The sizes and declared forces of elastics may vary considerably among manufacturing companies. Ormco® (Sybron Dental Specialties, Glendora, CA, USA), produces 24 different elastics, while there are 19 different elastics produced by American Orthodontics® (Sheboyagan, WI, USA) and 21 by 3M Unitek® (Monrovia, CA, USA).
The weakness of elastics is represented by their rapid deterioration and loss of elasticity into the oral environment (4, 5). A review of the existing literature in the field showed that most of the studies examined the applied force of inter-arch elastics, at standard distances, and in a static environment (6, 7). Only few authors used study models to determine the real elongation distance (8, 9). However, average real inter-arch distances at different anchorage sites obtained from Class II malocclusion patients have not been reported in reducing the validity of force measurements in previous studies.
According to the existing literature, the number of adults seeking orthodontic treatment is rising. The American Association of Orthodontists estimates that 27% of all the United States and Canadian orthodontic patients are adults (10). A similar percentage (26.52%) was obtained from a Brazilian study for patients between 20 and 40 years of age (11). A survey from the British Orthodontic Society indicated the increasing number of adult patients treated by United Kingdom orthodontists (12).
The aims of this study were to assess the average inter-arch distances characterizing Class II malocclusions in adults and to analyze the applied forces at those different distances by Class II inter-arch elastics of different manufacturing companies. Furthermore, the study aimed to compare measured forces with those declared by manufacturers of orthodontic elastics used for the correction of malocclusion class II, both in dry and wet environments.
This study should help clinicians to know the effectively applied forces by elastics, based on average inter-arch distances, to improve the clinical efficiency of Class II treatments.
Materials and Methods
Sample Group Selection and Inter-arch Distances Measurements
Study models obtained from intraoral scans (iTero Element, Align Tech., San José, CA, USA) of 167 adult orthodontic patients (100 women 67 men, mean age 29 ± 12.5 years, median 27) were used to determine the stretching distances elastics. The selected patients had Class II malocclusion, according to the objective grading system's occlusal relationship evaluation (13). Other inclusion criteria were: (1) presence of complete permanent dentition, (2) absence of periodontal disease, (3) absence of prosthodontic restorations, (4) no history of craniofacial trauma, and (5) no syndromes. The study was approved by the local ethic committee (Comitato Etico Interaziendale A.O.U. Città della Salute e della Scienza di Torino #157/2020).
The distance between the facial axes (FA) (14) points of the upper canine and the lower first molar was measured on both left and right sides at centric occlusion jaw relationship, using the “3Shape Ortho Viewer” software (3Shape A/S, Copenhagen, Denmark). In addition, measurements were detected between the FA points of upper first premolars and lower first molars, between upper second premolars and lower first molars, between upper canines and lower first premolars, and between upper canines and lower second premolars, to test all the possible clinical scenarios in which Class II elastics could be used (Figure 1).
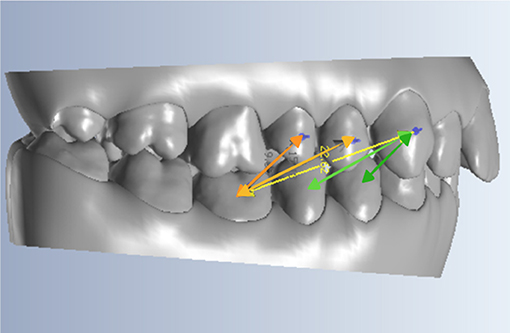
Figure 1. Representation of a subject model, including the five distances considered.
Class II Elastics Mechanical Evaluation
The sample of latex elastics analyzed in the present study was represented by 24 Ormco® (Ormco Corporation, Glendora, CA, USA) elastics, 19 American Orthodontics® (American Orthodontics Corporate, Sheboygan, WI, USA) elastics, and 21 3M Unitek® (3M Oral Care, St. Paul, MN, USA) elastics. In other words, all the inter-arch elastics produced by those three companies were tested. Elastics were provided by the manufacturers in their original sealed plastic bags and were stored accordingly to instructions of manufacturers.
The MTS Insight® Electromechanical Testing System (MTS Systems, Eden Prairie, MN, USA) was used to measure tensile forces of elastics: two hooks were created with 1.5 mm diameter stainless steel wire and located over the support plates of the machine (Figure 2). The distance between the two hooks was adjusted to reproduce every considered FA points distance. For each diameter/force combination, five elastics were tested employing a 500 N-load cell to measure the applied force. So, each elastic type was tested five times at every above-mentioned FA points distance and forces data were obtained in Newton.
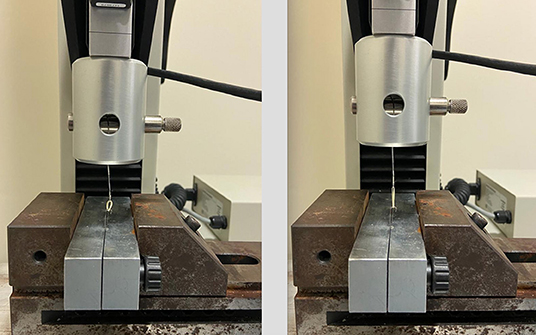
Figure 2. The MTS Insight® Electromechanical Testing System.
Artificial saliva was obtained by dissolving chemical compounds in 1 dm3 of distilled water in the following quantities: NaCl (0.4 g), KCl (0.4 g), NaOH (0.05 g), CaCl2·2H20 (0.22 g), NaH2PO4 (0.12 g), and urea (1 g), at a temperature of 37°C. Prior to the tests, all samples were conditioned in 20 ml of artificial saliva.
The applied force of elastic was measured in four different conditions: (1) baseline (T0) when measures were performed on dry elastics (picked up from the sealed bag); (2) after 1-h artificial saliva (temperature = 37°C, pH = 6.7) immersion (T1), (3) after 6-h artificial saliva immersion (T2), and (4) after 12-h artificial saliva immersion (T3). All tests were performed at room temperature (25°) and dry air condition.
Statistical Analysis
The Shapiro–Wilk test was used to evaluate the normality assumption; homoscedasticity and autocorrelation of the variables were assessed using the Breusch–Pagan and the Durbin–Watson tests. Linear regression analysis was performed to estimate (1) differences between observed and declared force values (declared force values used as reference) and (2) the force variation during artificial saliva immersion follow-up (T0 measurements used as reference).
All the analyses were stratified by elastic type (diameter of the elastic and declared force value). Values are shown as mean ± SD and 95% CI is used to test the outcome variability. The level of statistical significance was set at p < 0.05.
Statistical analyses were conducted using the R statistical package (version 3.5.3, R Core Team, Foundation for Statistical Computing, Vienna, Austria).
Power Calculation
A priori power analysis was performed to test the difference between groups using T statistic and non-centrality parameter with the aim to detect an effect size ≥ 0.30 and an SD = 1.00 (reference in population). Results showed that a total sample of 167 participants was required to achieve a statistical power of 80% (15).
Result
Regarding Class II models, the average distances measured between the considered FA points are as follows (mean ± SD):
- 9.80 mm ± 1.8 between the upper canine and the lower 1st premolar (A).
- 15.99 mm ± 2.0 between the upper canine and the lower 2nd premolar (B).
- 24.64 mm ± 2.1 between the upper canine and the lower 1st molar (C).
- 16.30 mm ± 1.9 between the upper 1st premolar and the lower 1st molar (D).
- 9.78 mm ± 1.7 between the upper 2nd premolar and the lower 1st molar (E).
The force values declared by the manufacturer and the force values measured at T0 (dry elastics), T1, T2, and T3 (respectively, after 1, 6, and 12 h of artificial saliva immersion) for each elastic type and for every FA points distance considered in the study are shown in Supplementary Table 1.
Supplementary Table 2 shows the mean deviation (MD) between the manufacturer declared force value and the T0 measured value, for every considered FA points distance. Most of the elastics showed a significant difference between the declared force value and the measured one (p < 0.05).
Results of the statistical analysis comparing the force values measured at T0 with those measured after artificial saliva immersion showed significant results. The force released by most of the elastics at T1, T2, and T3 had a significant decay with respect to T0 (p < 0.05). Supplementary Table 3 reports the MD among the force values, for every considered FA points distance.
Discussion
Despite the widespread use of inter-arch elastics in orthodontics, the real force released during their clinical applications is still unknown. In this experimental study, clinical application distances were obtained from 167 Class II patients. During the treatment of this malocclusion, the typical inter-arch elastics configuration is represented by anchoring them on the lower first molar and the upper canine (8, 9).
In the analyzed sample, the average distance between those two force application points was 24.6 mm, which is larger than three times the lumen of either 1/4” (18.7 mm), or 3/16” (14 mm) elastics.
The mean distance from the lower 1st molar to the upper 1st premolar was 16.3 mm, which is slightly lower than the three times the lumen of a 1/4” elastic, and slightly higher than that of a 3/16” elastic. Therefore, it may be advisable to use these reference average measurements to select the proper elastic diameter and force in adult patients requiring the use of Class II elastics. To our knowledge, this is the first study in which similar data are provided.
The existing literature related to Class II treatment with inter-arch elastics highlighted optimal elastics forces ranging from 2 (56.69 g) to 6.5 oz (184.27 g) (3, 7, 16). In the present study, we tested 8 oz (226.79 g) force elastics, considering their spreading in the clinical setting (17).
The mechanical testing was initially performed on dry elastics at room temperature (18). The force values obtained by most of the dry elastics (T0) showed significant differences when compared to the force values declared by the manufacturers. These results are important since the differences were measured for all the possible Class II elastics of the considered manufacturers and not only for those suggested by a pool of clinical orthodontists (2, 3, 6, 8, 9, 19).
According to Kersey et al., differences between measured and declared forces, varied from negative to positive values, independent of the application points (18). In the present study, for elastics applied at 24.6 mm distance (upper canine-lower first molar), the observed differences ranged from −169.5 cN (6.1 oz) of the GLORIA 3M® elastics to 36.4 cN (1.3 oz) of the PUMA American Orthodontics® elastics, while for elastics applied at 16.3 mm (upper first premolar-lower first molar) distance, the observed differences ranged from −117.9 cN (4.2 oz) of the GLORIA 3M® elastics to 128.6 cN (4.6 oz) of the PUMA American Orthodontics® elastics. The elastic diameter showing the lowest discrepancy between the tested and declared force is the 3/16”, at a distance of 16.3 mm (upper first premolar-lower first molar). However, for the 3/16” diameter, the lowest discrepancy was observed for the 6.5 oz American Orthodontics elastic band, for the 2 oz 3M® elastic band and for 4.5 oz ORMCO® elastics. So regardless of the brands, it seems advisable to carefully choose the size (inches) of elastics based on the inter-arch distance rather than on the strength needed.
Mansour et al. analyzing 3/16” and 1/4” elastic diameters at a distance of 14.6 mm, revealed no significant differences between tested and declared forces (9). In particular, the ORMCO® 3/16” 4.5 oz showed the minimum discrepancy, as observed in our study.
In contrast, Kanchana et al., comparing elastics with different sizes, extended at a distance of 15 mm, observed that 3/16” Tomy® (Tomy Inc., Tokyo, Japan) 4 oz elastics showed the greatest discrepancy, confirming that manufacturing processes have a huge impact on the applied force (19).
Analyzing the existing literature about inter-arch elastics, many studies focused on testing inter-arch distances >20 mm, to simulate real clinical conditions (5, 9, 16, 18, 19). In previous works, force-extension curves were provided with distances arbitrarily set at 5- or 10-mm intervals from 0 to 60 mm. In this study, we have provided force-extension curves based on real clinical distances, trying to provide more useful information from a clinical perspective. Based on our measurements, the forces exerted by 3/16” ORMCO® elastics (Figure 3) showed the best performance. Kanchana et al. obtained the best force-extension curve for 1/4” elastics and their results in terms of measured strength for 3/16” elastics were greater with respect to our observations (18). However, according to Kanchana et al., tests were conducted in 2000 and in the last 20 years, some changes in the structure of the elastomer could explain the performance improvement detected in our study.
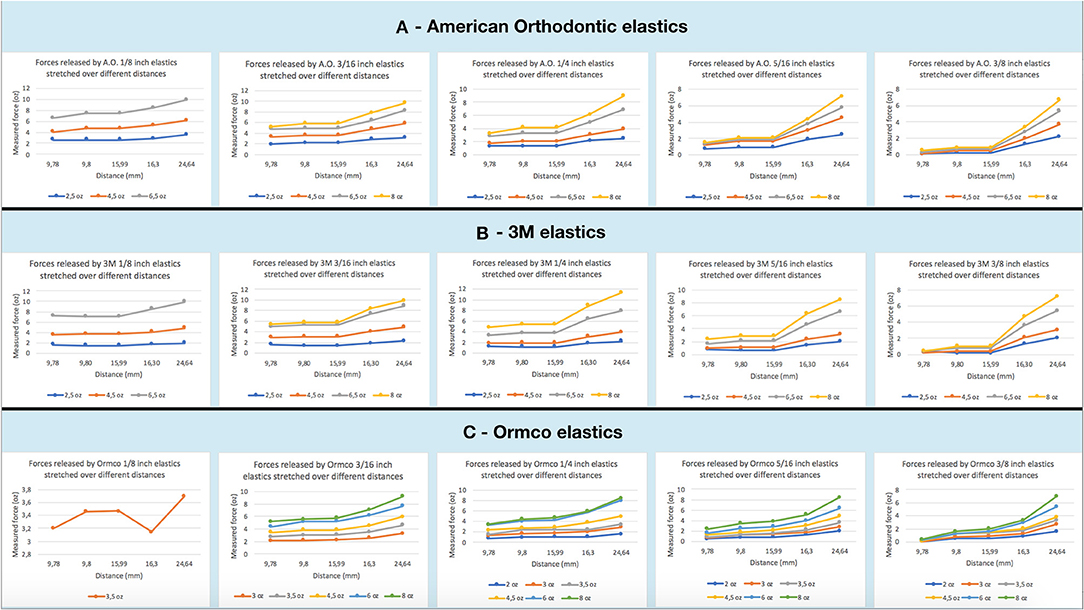
Figure 3. (A) Graphs of forces applied by American Orthodontics elastics stretched over measured distances. (B) Graphs of forces applied by 3M elastics stretched over measured distances. (C) Graphs of forces applied by Ormco elastics stretched over measured distances.
As previously reported, salivary pH, oral hygiene conditions, diet, and oral habits influence the elastics behavior in the oral environment (4, 20–22). Force degradation is the greatest disadvantage in using elastics, despite their application is expected to generate constant and optimal force for a specified time period.
In the present study, the wet test was conducted for a period of 12 h simulating a real clinical condition. In agreement with many previous studies, for almost all the elastics, a large force degradation was observed just after 1 h (3, 5, 23–25) of saliva immersion: at the 24.6 mm distance, the initial force loss of wet elastics was 14.12% for American Orthodontics®, of the 7.92% for 3M®, and of 14.61% for ORMCO®. These data are slightly lower than those reported by Fernandes et al. (15.26–20.72%) that performed the test at a distance of 30 mm (26). Therefore, from a clinical point of view, the percentages reported above could be used to calculate a force level close to the declared one to compensate for the initial force loss of the elastics.
An increase of the force level was observed between the first and the 6th h of artificial saliva immersion, while another force loss was revealed between the 6th and the 12th h.
This trend is particularly evident for 3M® 3/16” and 1/4” elastics, stretched between the upper canine and the lower first molar and between the upper first premolar and lower first molar (Figure 4).
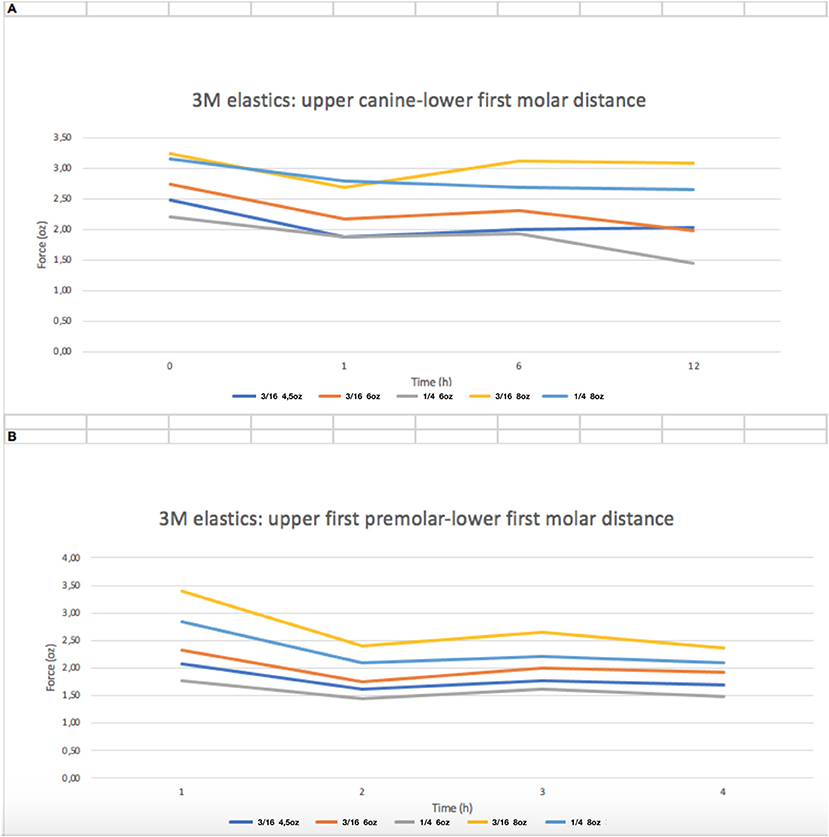
Figure 4. Force decay (oz) over time of 3M 3/16” and 1/4” elastics. (A) distance between upper canine and lower first molar; (B) distance between upper first premolar and lower first molar.
A possible cause of this mechanical behavior could be the transitory hardening of the material in saliva immersion (26). Therefore, as suggested by Lopes Nitrini et al. (25), Andreasen and Bishara (27), and Wang et al. (4), elastics do not need to be replaced frequently.
Furthermore, 3/16” elastics showed the lowest discrepancy between the declared and the measured forces and the lowest percentage of force degradation in a wet environment, especially for higher force levels (4.5, 5.5, 6, and 8 oz), confirming the results of previous studies (22). Therefore, in the clinical setting, 3/16” and at least 4.5 oz elastic bands should be used in Class II mechanics.
To our knowledge, only Baty et al. reported a possible clinically significant impact when the difference between the measured and the declared force (ΔF) of elastomeric auxiliaries is >10% (28).
In the present study, almost all the tested elastics had ΔF > 10%.
In conclusion, orthodontists should choose carefully the size and force of the elastics, and this experimental setup provided some suggestions to possibly improve the clinical performances in Class II treatments of adults, using 3/16” and at least 4.5 oz elastics and asking the patients to change them every 6 h.
Limitations of the Study
The most important limitation of this study is the in vitro design, which does not make it possible to fully reproduce actual clinical conditions. The simulation of the removal and insertion of elastics after meals or oral hygiene maneuvers was in fact not considered.
However, Liu et al. suggested that after a 1-day interval, the decrease in force values stabilizes, assuming non-significant variation characteristics. For these authors, the stretch variable, due to mouth opening and closing, does not imply a cumulative influence on the material (29).
A comprehensive evaluation of all the possible Class II elastics represented the real aim of the study: however, analyzing only those produced by three of the most important manufacturers in the orthodontic field cannot be considered a shortcut.
As reported by Peck et al., the distance between the maxillary canine and the mandibular first molar would increase during wide opening (16). Therefore, another limitation of the present study is represented by the centric occlusion measurements: however, the present data could be useful to create mathematical models simulating different mandibular positions.
Conclusion
- Forces exerted by most of the tested dry and wet elastics were significantly different with respect to the manufacturer's declaration.
- The 3/16” elastics showed the lowest discrepancy between tested and declared forces, at the average distance measured between upper first premolar and lower first molar. Increasing elastic extension, 3/16” diameter elastics showed the lowest increase in force magnitude.
- After 6 h of artificial saliva immersion, force degradation was reduced with respect to the first hour.
- The elastics with high force values showed the lowest percentage of force degradation over time.
Data Availability Statement
The original contributions presented in the study are included in the article/Supplementary Material, further inquiries can be directed to the corresponding author/s.
Author Contributions
TC and GR contributed to conception and design of the study. FS organized the database. GR performed the statistical analysis. TC and AS wrote the manuscript. GC: substantial contributions to the analysis and interpretation of data for the work, drafting the work for important intellectual content, and agreement to be accountable for all aspects of the work in ensuring that questions related to the accuracy or integrity of any part of the work are appropriately investigated and resolved. All authors contributed to manuscript revision, read, and approved the submitted version.
Conflict of Interest
The authors declare that the research was conducted in the absence of any commercial or financial relationships that could be construed as a potential conflict of interest.
Publisher's Note
All claims expressed in this article are solely those of the authors and do not necessarily represent those of their affiliated organizations, or those of the publisher, the editors and the reviewers. Any product that may be evaluated in this article, or claim that may be made by its manufacturer, is not guaranteed or endorsed by the publisher.
Supplementary Material
The Supplementary Material for this article can be found online at: https://www.frontiersin.org/articles/10.3389/fdmed.2021.748985/full#supplementary-material
References
1. Proffit WR, Fields HW, Sarver DM. Contemporary Orthodontics. Philadelphia: Mosby (2018). p. 276–88.
2. Qodcieh SMA, Al-Khateeb SN, Jaradat ZW, Abu Alhaija ESJ. Force degradation of orthodontic latex elastics: an in-vivo study. Am J Orthod Dentofac Orthop. (2017) 151:507–12. doi: 10.1016/j.ajodo.2016.08.023
3. Gioka C, Zinelis S, Eliades T, Eliades G. Orthodontic latex elastics: a force relaxation study. Angle Orthod. (2006) 76:475–9. doi: 10.1043/0003-3219(2006)076[0475:OLE]2.0.CO;2
4. Wang T, Zhou G, Tan X, Dong Y. Evaluation of force degradation characteristics of orthodontic latex elastics in vitro and in vivo. Angle Orthod. (2007) 77:688–93. doi: 10.2319/022306-76
5. Yang L, Lv C, Yan F, Feng J. Force degradation of orthodontic latex elastics analyzed in vivo and in vitro. Am J Orthod Dentofac Orthop. (2020) 157:313–9. doi: 10.1016/j.ajodo.2019.03.028
6. Kersey ML, Glover KE, Heo G, Raboud D, Major PW. A comparison of dynamic and static testing of latex and nonlatex orthodontic elastics. Angle Orthod. (2003) 73:181–6. doi: 10.1043/0003-3219(2003)73 <181:ACODAS>2.0.CO;2
7. Bales TR, Chaconas SJ, Caputo AA. Force-extension characteristics of orthodontic elastics. Am J Orthod. (1977) 72:296–302. doi: 10.1016/0002-9416(77)90215-9
8. Oesterle LJ, Owens JM, Newman SM, Shellhart WC. Perceived vs measured forces of interarch elastics. Am J Orthod Dentofac Orthop. (2012) 141:298–306. doi: 10.1016/j.ajodo.2011.08.027
9. Mansour A. A comparison of orthodontic elastic forces: focus on reduced inventory. J Orthod Sci. (2017) 6:136. doi: 10.4103/jos.JOS_58_17
10. Werneck EC, Mattos FS, da Silva MG, do Prado RF, Araújo AM. Evaluation of the increase in orthodontic treatment demand in adults. Braz Dent Sci. (2012) 15:47–52. doi: 10.14295/bds.2012.v15i1.738
11. American Association of Orthodontists' “Economics of Orthodontics”. Dental Tribune of America. (2016). Available online at: https://us.dental-tribune.com/news/adults-are-seeking-orthodontic-treatment-in-record-numbers/ (accessed May 28, 2021).
12. The number of adults seeking orthodontic treatment in the UK continues to rise. Br Dent. (2018) 224:847. doi: 10.1038/sj.bdj.2018.455
14. O'Neil R, Kau CH. Comparison of dental arch forms created from assessment of teeth, alveolar bone, and the overlying soft tissue. J Orofac Orthop. (2021) 82:413–21. doi: 10.1007/s00056-021-00282-6
15. Chow SC, Shao J, Wang H. Sample Size Calculations in Clinical Research. 2nd ed. Boca Raton: Chapman and Hall/CRC (2008).
16. Peck CC, Langenbach GEJ, Hannam AG. Dynamic simulation of muscle and articular properties during human wide jaw opening. Arch Oral Biol. (2000) 45:963–82. doi: 10.1016/S0003-9969(00)00071-6
17. Kim-Berman H, McNamara JA, Lints JP, McMullen C, Franchi L. Treatment effects of the carrierer motion 2DTM appliance for the correction of class II malocclusion in adolescents. Angle Orthod. (2019) 89:839–46. doi: 10.2319/121418-872.1
18. Kersey ML, Glover K, Heo G, Raboud D, Major PW. An in vitro comparison of 4 brands of nonlatex orthodontic elastics. Am J Orthod Dentofac Orthop. (2003) 123:401–7. doi: 10.1067/mod.2003.22
19. Kanchana P, Godfrey K. Calibration of force extension and force degradation characteristics of orthodontic latex elastics. Am J Orthod Dentofac Orthop. (2000) 118:280–7. doi: 10.1067/mod.2000.104493
20. Ash JL, Nikolai RJ. Relaxation of orthodontic elastomeric chains and modules in vitro and in vivo. J Dent Res. (1978) 57:685–90. doi: 10.1177/00220345780570050301
21. De Genova DC, McInnes-Ledoux P, Weinberg R, Shaye R. Force degradation of orthodontic elastomeric chains-A product comparison study. Am J Orthod. (1985) 87:377–84. doi: 10.1016/0002-9416(85)90197-6
22. Leão Filho JC, Gallo DB, Santana RM, Guariza-Filho O, Camargo ES, Tanaka OM. Influence of different beverages on the force degradation of intermaxillary elastics: an in vitro study. J Appl Oral Sci. (2013) 21:145–9. doi: 10.1590/1678-7757201302256
23. Aju Wahju Ardani IG, Susanti B, Djaharu'ddin I. Force degradation trend of latex and nonlatex orthodontic elastics after 48 hours stretching. Clin Cosmet Investig Dent. (2018) 10:211–20. doi: 10.2147/CCIDE.S173648
24. De Carvalho Notaroberto DF, Martins E, Martins M, de Andrade Goldner MT, de Moraes Mendes A, Quintão CCA. Force decay evaluation of latex and non-latex orthodontic intraoral elastics: in vivo study. Dental Press J Orthod. (2018) 23:42–7. doi: 10.1590/2177-6709.23.6.042-047.oar
25. Nitrini ATL, Chagas AS, Freitas KMS, Valarelli FP, Cançado RH, de Oliveira RCG, et al. Comparison of the force released by intermaxillary elastics used for different time periods. Turk J Orthod. (2019) 32:190–4. doi: 10.5152/TurkJOrthod.2019.18022
26. Fernandes DJ, Fernandes GMA, Artese F, Elias CN, Mendes AM. Force extension relaxation of medium force orthodontic latex elastics. Angle Orthod. (2011) 81:812–9. doi: 10.2319/120810-709.1
27. Andreasen GF, Bishara S. Comparison of elastic chains with elastics involved with intra-arch molar to molar forces. Angle Orthod. (1970) 40:151–8. doi: 10.1043/0003-3219(1970)040<0151:COACWE>2.0.CO;2
28. Baty DL, Volz JE, von Fraunhofer JA. Force delivery properties of colored elastomeric modules. Am J Orthod Dentofac Orthop. (1994) 106:40–6. doi: 10.1016/S0889-5406(94)70019-2
Keywords: class II, adult treatment, elastics, anchorage sites, forces
Citation: Castroflorio T, Sedran A, Spadaro F, Rossini G, Cugliari G, Quinzi V and Deregibus A (2022) Analysis of Class II Intermaxillary Elastics Applied Forces: An in-vitro Study. Front. Dent. Med. 2:748985. doi: 10.3389/fdmed.2021.748985
Received: 28 July 2021; Accepted: 13 December 2021;
Published: 18 January 2022.
Edited by:
Domenico Ciavarella, University of Foggia, ItalyReviewed by:
Uriel Zapata, EAFIT University, ColombiaRoberta Lione, University of Rome Tor Vergata, Italy
Tarek El-Bialy, University of Alberta, Canada
Copyright © 2022 Castroflorio, Sedran, Spadaro, Rossini, Cugliari, Quinzi and Deregibus. This is an open-access article distributed under the terms of the Creative Commons Attribution License (CC BY). The use, distribution or reproduction in other forums is permitted, provided the original author(s) and the copyright owner(s) are credited and that the original publication in this journal is cited, in accordance with accepted academic practice. No use, distribution or reproduction is permitted which does not comply with these terms.
*Correspondence: Tommaso Castroflorio, dG9tbWFzby5jYXN0cm9mbG9yaW9AZ21haWwuY29t