 Marcus Elfström
 Mattias Olsson
95% of researchers rate our articles as excellent or good
Learn more about the work of our research integrity team to safeguard the quality of each article we publish.
Find out more
ORIGINAL RESEARCH article
Front. Conserv. Sci. , 05 March 2025
Sec. Animal Conservation
Volume 6 - 2025 | https://doi.org/10.3389/fcosc.2025.1546782
At-grade fauna passages are much less resources demanding to construct compared to wildlife overpasses or underpasses at infrastructure barriers. Because smaller and intermediate-sized roads are much more common than major roads in most landscapes, at-grade passages have a high potential for cost-efficient barrier mitigation for wildlife. However, at-grade passages have besides risk for vehicle collision involvement, a higher disturbance potential, compared to most over- and underpasses, considering foremost its multiuse with vehicle traffic. We tested if the crossing probability in common Scandinavian ungulates; wildboar (Sus scrofa), roedeer (Capreolus capreolus) and fallow deer (Dama dama), was impacted due to different types of crossing structure, while accounting for availability to alternative crossing sites and environmental factors. We found no differences in crossing probability in wild boar (851 visits), roedeer (1,556 visits) and fallow deer (941 visits) when comparing wildlife visits at 4 at-grade fauna passages and the combined result from 8 wildlife-designed over-/underpasses. This indicates that fauna passage at-grade (with average daily traffic volume of 3,000–8,000) can show similar functionality, in terms of comparable proportions of usage out of all visits, compared to wildlife designed overpasses or underpasses. In addition, when separating among over-, underpasses and at-grade passages, we found no differences in crossing probability in roe deer and fallow deer. Wildboar showed no difference in crossing probability between overpass and at-grade passage, but higher crossing probability at underpass than at-grade. This suggests that establishing several wildlife passages at-grade instead of only a few over- or underpasses designed for wildlife at different grade may be an alternative to reduce infrastructure barriers also along fenced intermediate-sized roads.
Reducing barriers from roads and railroads is critical to mitigate habitat fragmentation. Increased permeability for wildlife along infrastructure is established by securing crossing structures that may allow usage by wild animals. The functionality in wildlife usage by crossing structures depends on both location and design (Denneboom et al., 2021; Rosell et al., 2023). However, the type of crossing structure constructed varies due to numerous factors, such as topography, size of infrastructure, speed and traffic flow. Elevated terrain, increased speed and traffic flow may restrict the suitability to apply crossing opportunities at-grade compared to crossing at different grade. Increased traffic volume impedes animal movement, e.g. among wild ungulates, causes direct mortality, and fragments habitat (Charry and Jones, 2009). We focus on wild ungulates common in South-central Sweden, namely wild boar (Sus scrofa), roedeer (Capreolus capreolus) and fallow deer (Dama dama), because they either are commonly involved in wildlife-vehicle accidents or cause most material damages when involved in traffic accidents, whereas all of them may represent high economic and social impact in society due to concerns within forestry, agriculture and recreational purposes (Jägerbrand et al., 2018). The highest frequency of vehicle-moose collisions in Sweden has been reported to occur on roads with traffic volumes of 4,000 – 6,000 vehicles per average day (Seiler, 2005). Major highways with more than 10,000 vehicles passing per day are often believed to constitute a significant or near complete barrier for wild ungulates (Charry and Jones, 2009). Thus, fauna passages at-grade are assumed not to be an alternative when mitigating barrier impact from the most severe barriers in terms of traffic flow disturbance and elevated risks of wildlife-vehicle accidents (Bhardwaj et al., 2022; Rosell et al., 2023). However, costs for overpasses designed for wildlife can typically range between 5-10 million USD to create, whereas underpasses usually are less expensive ranging between 2-5 million USD. At-grade passages, in its simplest design consists of fence openings that steer wildlife to cross perpendicular to the road direction, are relatively cheap and easy to construct, with roadside animal detection systems included may cost 100-200 thousand USD. Because medium-sized roads are much more common than major roads in most landscapes, at-grade passages have a high potential for cost-efficient barrier mitigation for large mammals such as wild ungulates if risks for animal-vehicle collision can be managed or accepted (Bhardwaj et al., 2022). This offers the possibility of establishing several fauna passages at-grade instead of a few over- or underpasses or other resource-demanding passages at different grade (Bhardwaj et al., 2022; Helldin, 2022).
However, we expect wildlife passage at grade to have somewhat reduced function, since wildlife is forced to co-use this type of multiuse passage with road traffic. But we lack understanding in functionality among different types of crossing structures designed for wildlife. At-grade fauna passages have a higher disturbance potential compared to most over- and underpasses, considering their multiuse with vehicle traffic and unnatural substrate such as pavement. Underpasses may also be less attractive to animals due to unnatural settings if the passage is too narrow and perhaps also generate acoustic effects such as echoes. Provided wildlife approach in the vicinity of crossing structures, we tested if the crossing probability differed due to different types of crossing structure, while accounting for availability to alternative crossing sites and environmental factors.
We compared the probabilities of wildlife visits resulting in passing through or not at different types of passage opportunities, i.e. underpasses, overpasses, and at-grade passages, all designed for large mammals across south-central Sweden. Overpasses (N=4) had mean minimum passage width = 25.3 m (range: 9.0-40.8 m) and mean passage length = 56.6 m (range: 38.7-80.2 m) (Figure 1). Underpasses (N=4) had mean passage height = 6.0 m (range: 2.5 -10.2 m), mean passage width = 16.3 m (range: 6.0-35.0 m) and mean passage length = 22.9 m (range: 15.3-38.9 m). At-grade passages (N=4) had mean passage width = 28.3 m (range: 25.9-32.0 m) and mean passage length same as road width = 7.6 m (range: 7.5-7.8 m). The different size dimensions were not accounted for when comparing crossing probability among different types of fauna passages.
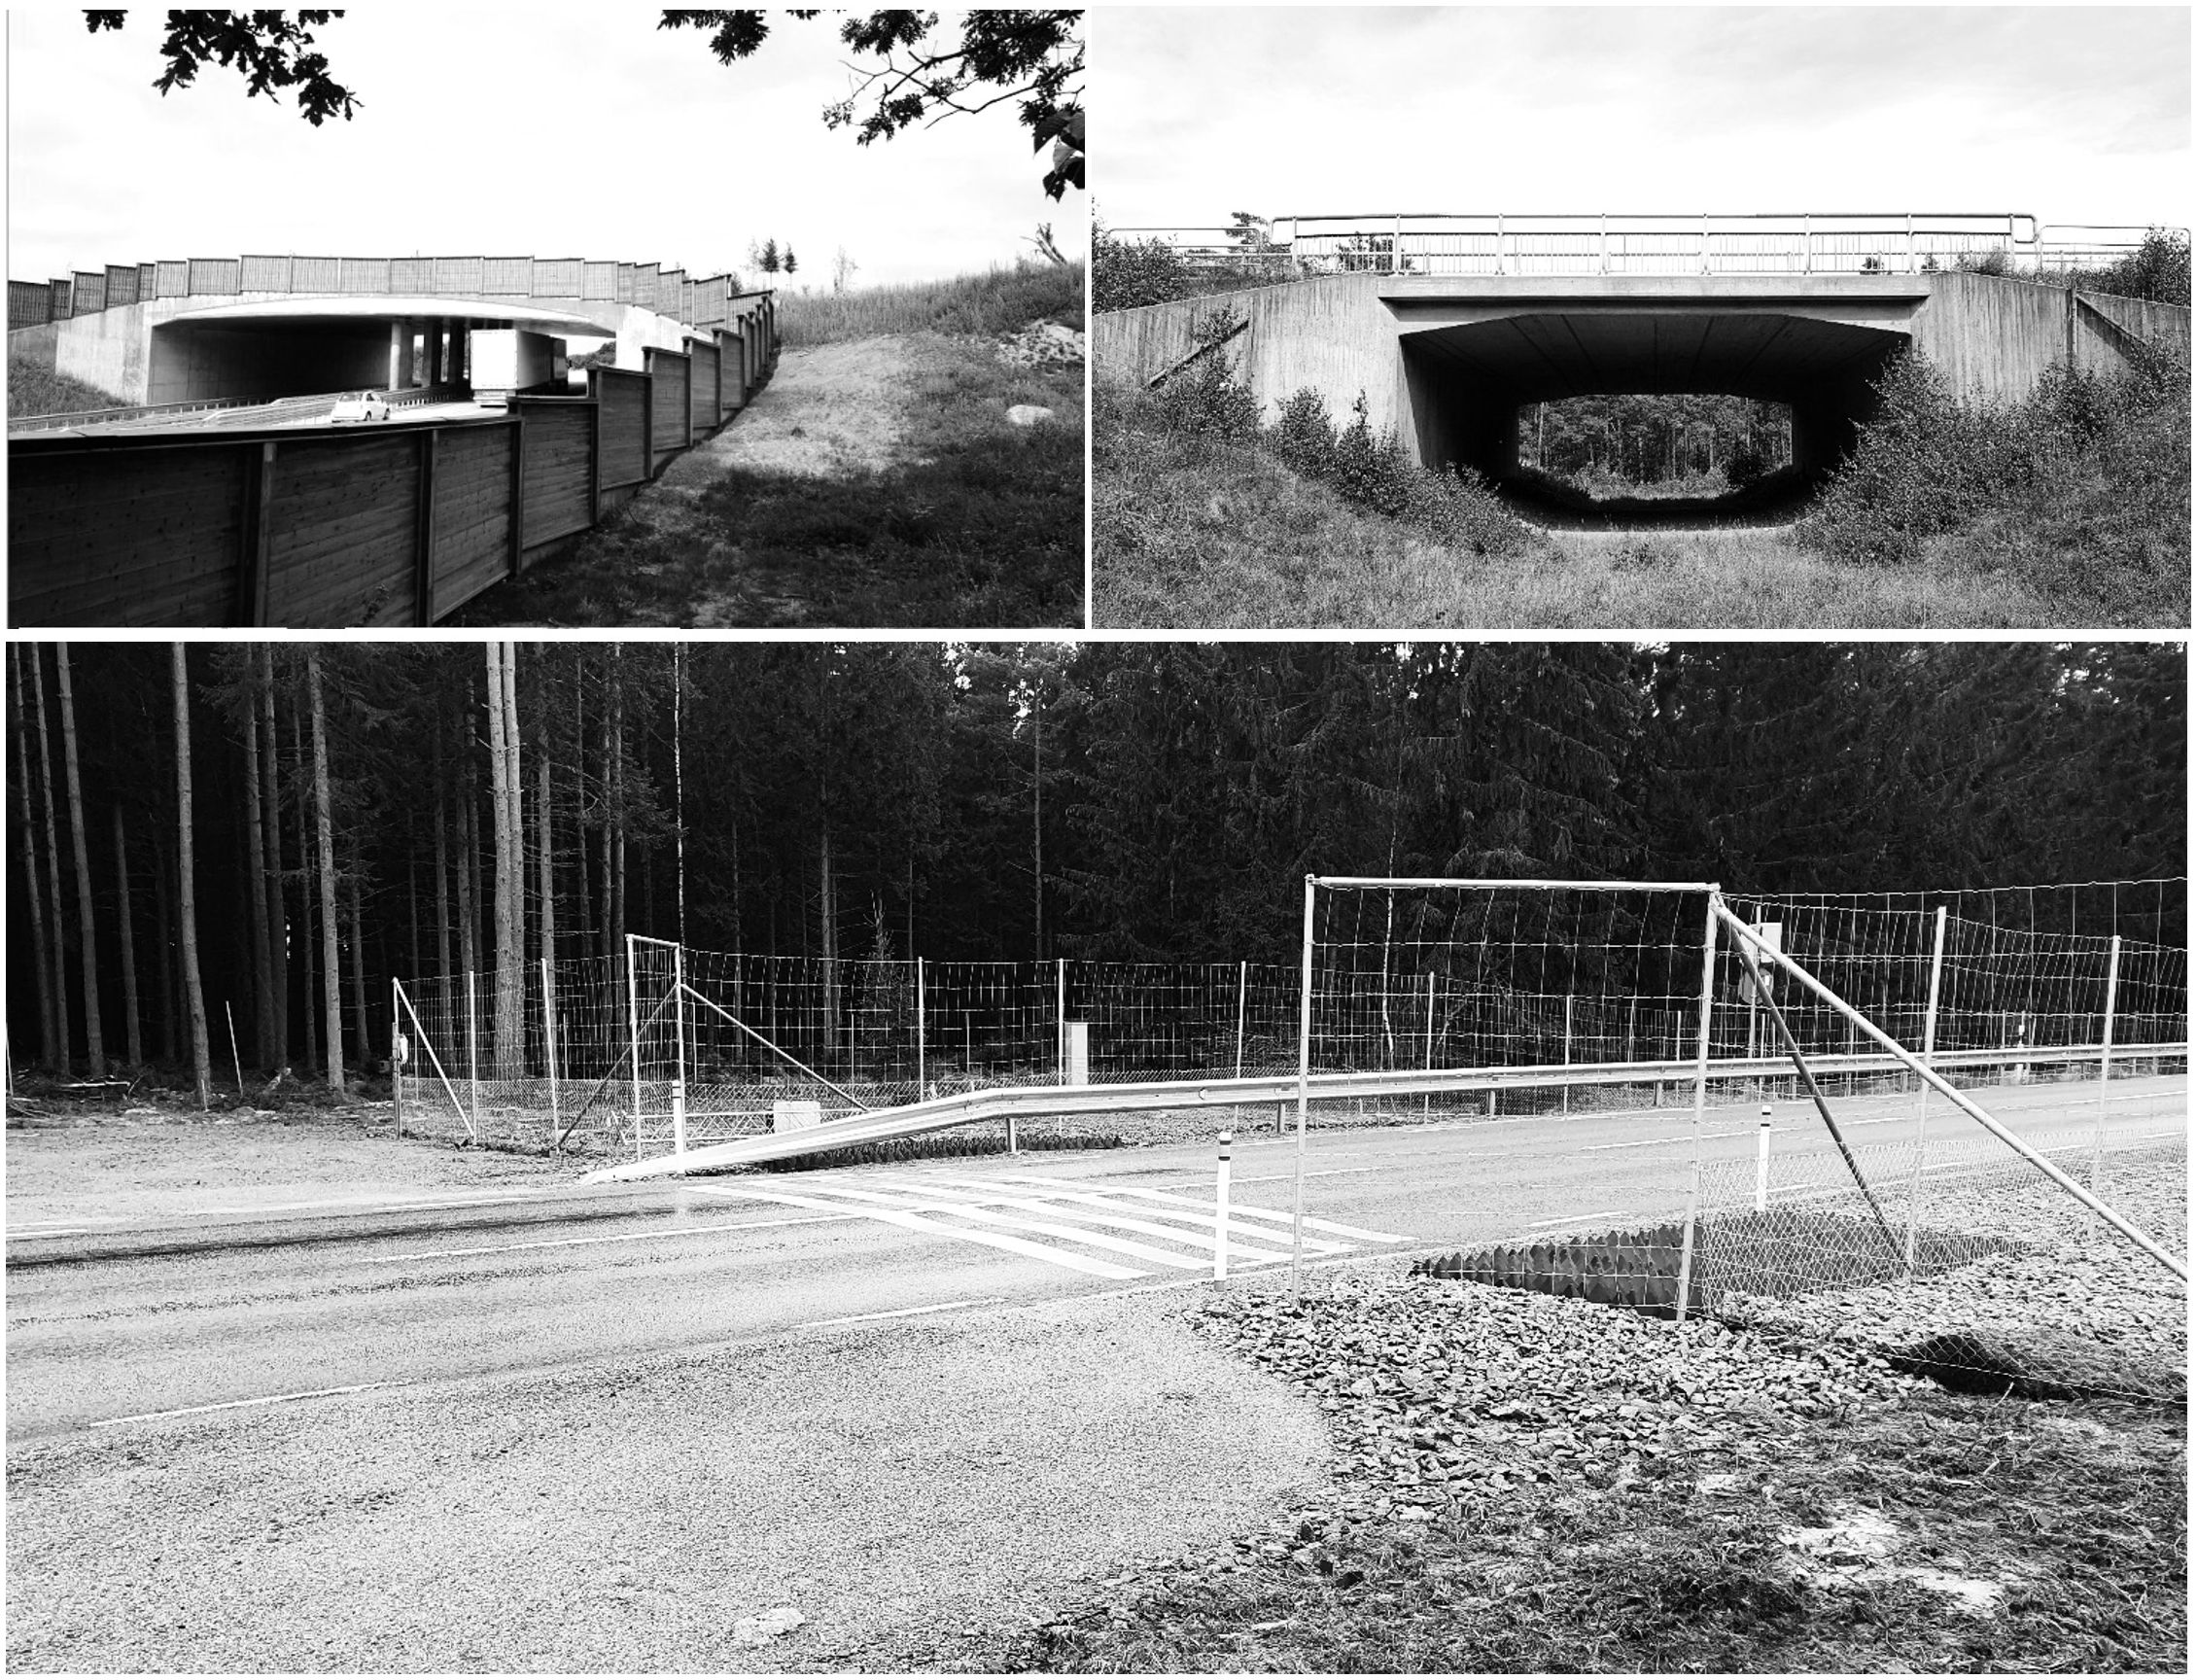
Figure 1. Example of fauna overpass (top left), fauna underpass (top right), and at-grade fauna passage (below), showcasing the different types of wildlife passages studied. In total four overpasses, four underpasses and four at-grade passages were included to compare crossing probability for common wild ungulates in Sweden.
All passage objects had alternative sites at different grades to cross the actual infrastructure barrier within a 4-km radius from passage sites, corresponding to a home range scale of wild ungulates in the region (Jarnemo et al., 2018). The nearest distance to alternative crossings was used as an index to measure availability to alternative crossings, i.e. a degree of barrier. These alternative crossing structures were all underpasses not specifically designed for wildlife but with size dimensions that suggests they may be used by focal ungulate species (Elfström et al., 2024; Bhardwaj et al., 2020), Figure 2.
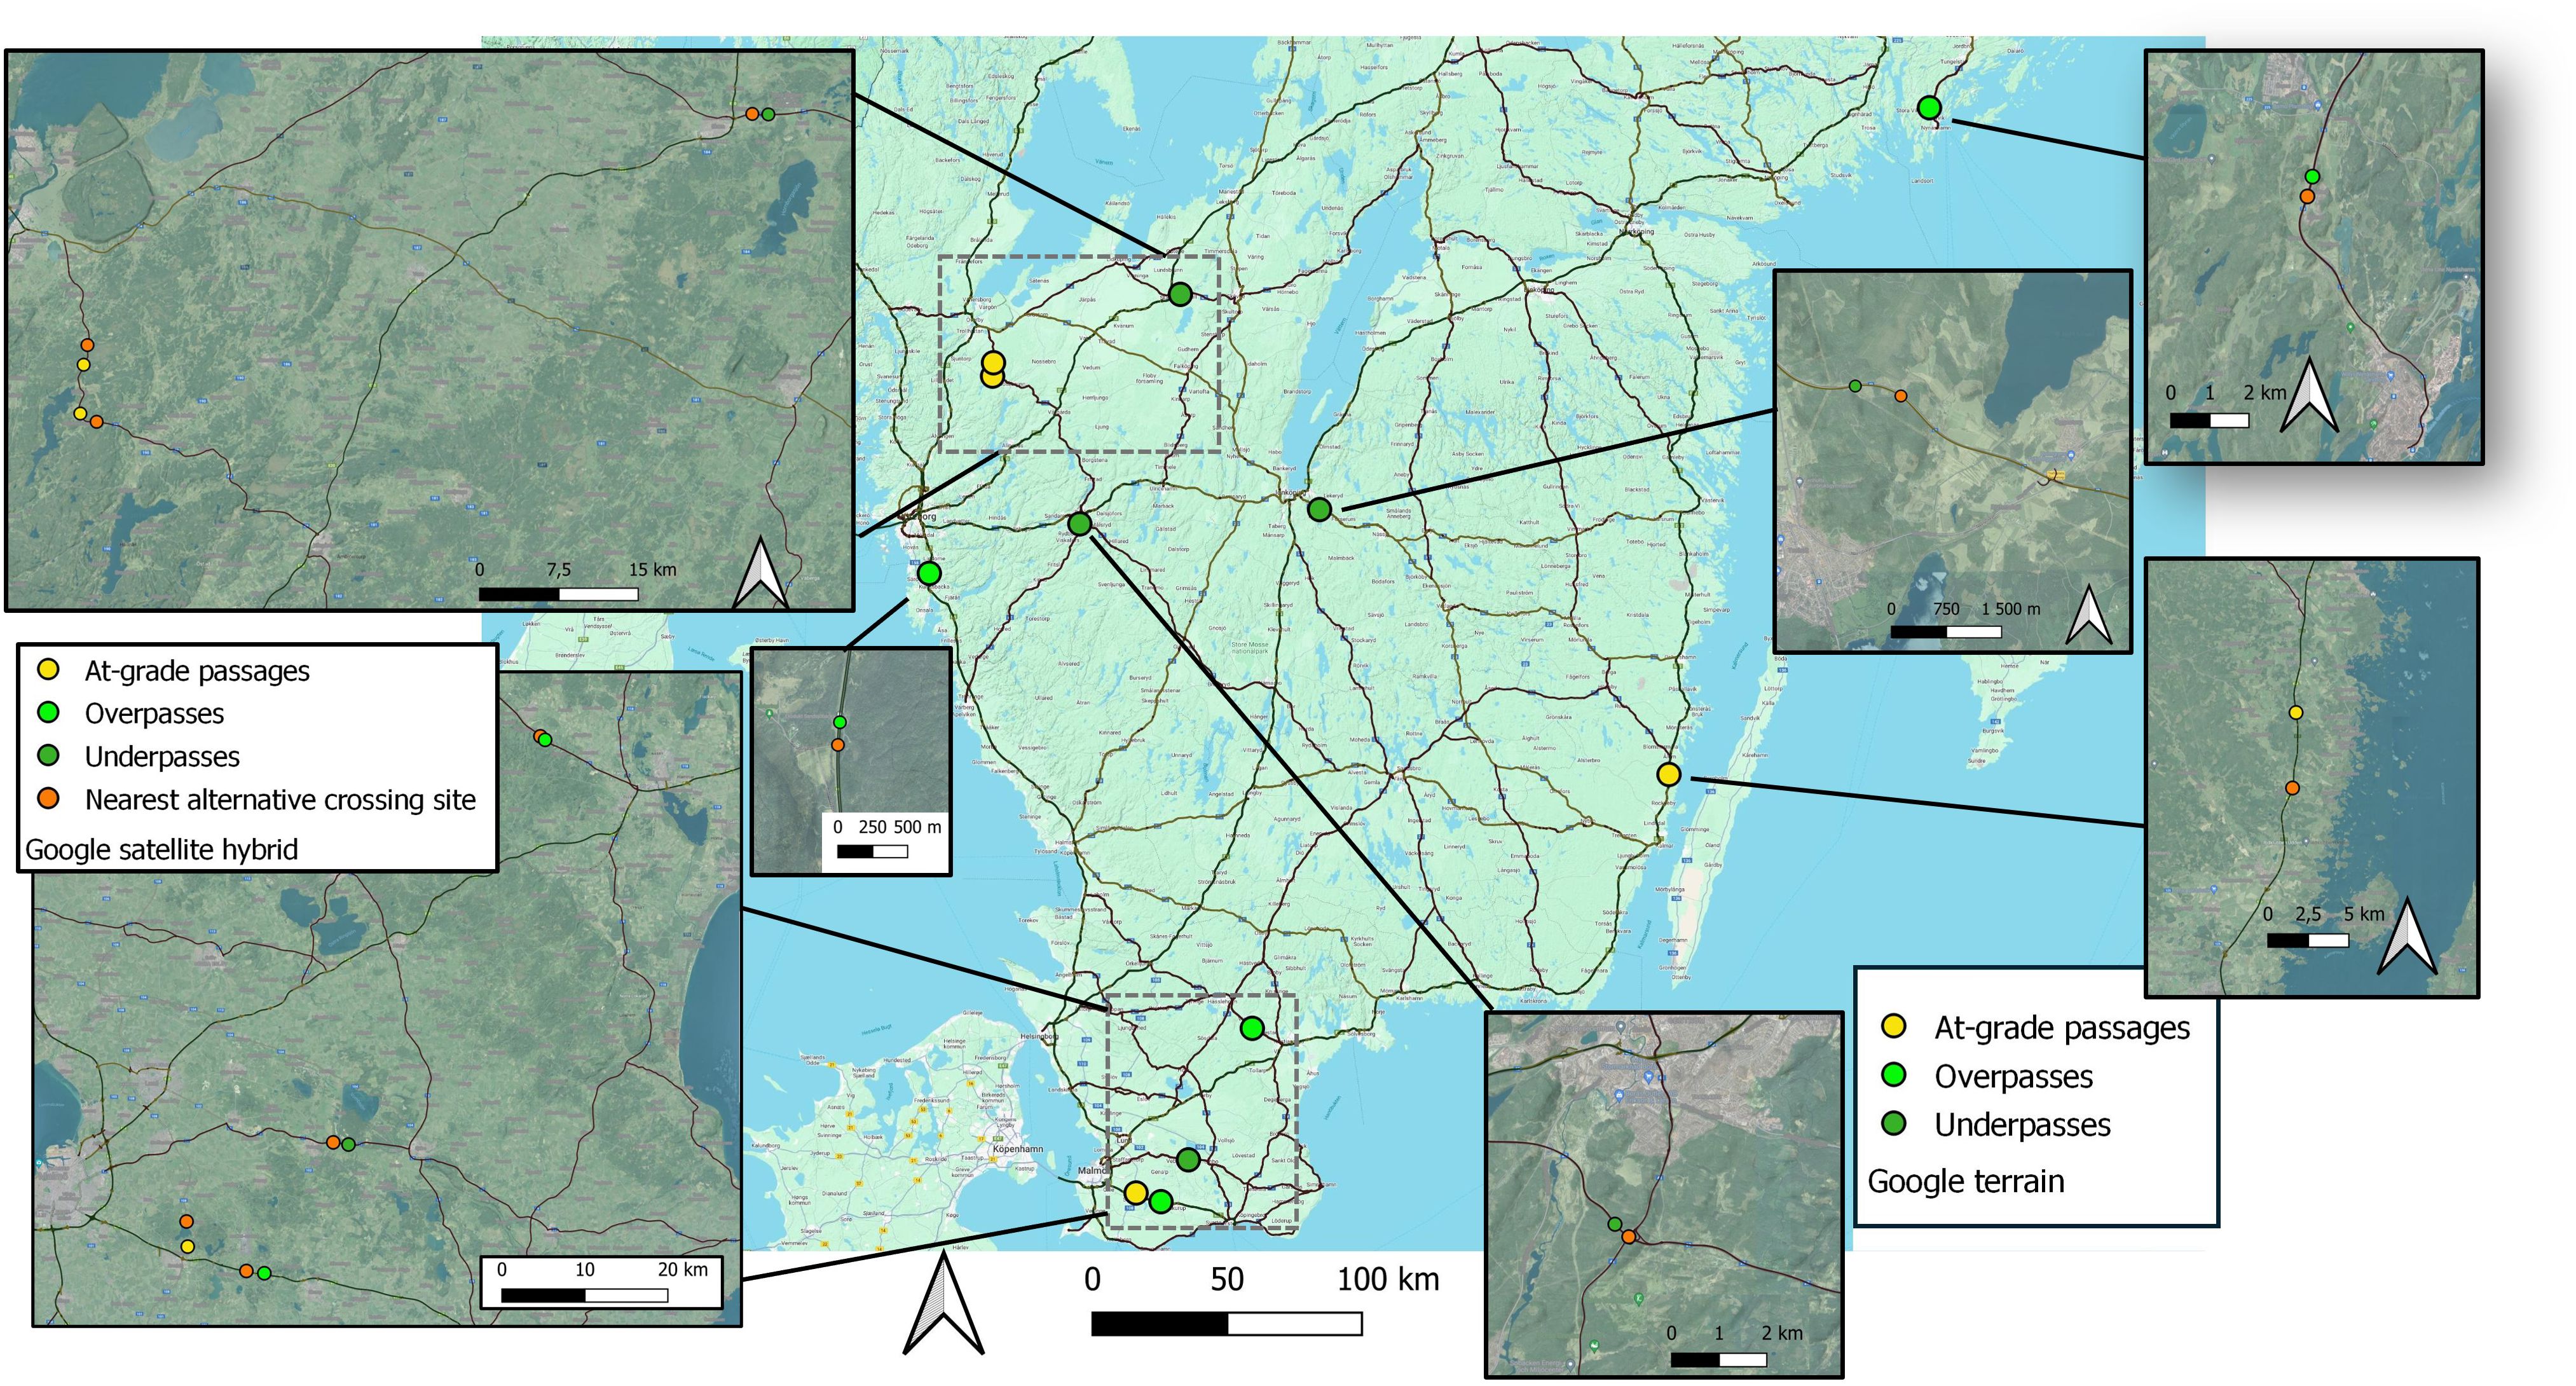
Figure 2. Study areas representing geographical positions for at-grade passages, underpasses and overpasses when analyzing crossing probability in wild ungulates in relation to type of crossing structure during the years 2018-2022 in south-central Sweden. The distribution of crossing sites encompasses most ranges of both latitude and longitude of South-central Sweden. All crossing sites were situated in forested surroundings.
All passage sites were required to have observed crossings made by the focal species, and a minimum of 15 visits per passage. All passage sites were situated in forested surroundings and were distributed across South-central Sweden (Figure 2). The landcover around each passage site, i.e. within a 4 km radius, was provided from the Swedish Mapping, Cadastral and Land Registration Authority (downloaded during 2019; https://www.lantmateriet.se/en). The landcover data had an error margin of 10 m, and we categorized available habitats into four main categories and estimated their proportions for each passage site (Supplementary Material; Supplementary Table S1). The proportions of landcover types were similar among the three different types of fauna passage. Mean proportions (± SD) of settlements around at-grade passages was 0.01 (± 0.01), and 0.03 (± 0.03) around overpasses and 0.05 (± 0.02) around underpasses. Mean proportions (± SD) of open pastures and crop fields around at-grade passages was 0.40 (± 0.12), and 0.33 (± 0.21) around overpasses and 0.38 (± 0.11) around underpasses. Mean proportions (± SD) of forested areas around at-grade passages was 0.58 (± 0.12), and 0.57 (± 0.17) around overpasses and 0.52 (± 0.13) around underpasses. Mean proportions (± SD) of open water bodies around at-grade passages was 0.01 (± 0.01), and 0.07 (± 0.05) around overpasses and 0.05 (± 0.03) around underpasses.
The frequency of wildlife-vehicle collisions exclusively along the road with a fauna passage and within a 2.5-km radius during the same period as the study occurred is presented in Table 1. The wildlife-vehicle collisions data was derived from the Swedish National Council for Wildlife accidents. The frequencies of wildlife-vehicle collisions are impacted by a combination of numerous factors, e.g. density of focal wildlife species, land use, number of leakage points such as improper endpoints of fencing at intersections, traffic flow and sighting distance for drivers to detect approaching wildlife. Thus, frequencies of collisions cannot be inferred directly to describe for instance wildlife abundance. But the frequency of wildlife-vehicle collisions can serve to describe for instance the degree of barrier impact for specific road sections. The infrastructure along the passage sites were all considered to be significant barriers for wild ungulates, because all road sections within a minimum length of 2.5 km from the passage site were equipped with fence against larger wildlife. Fencing has been proven to increase the crossing probability through underpasses (Dodd et al., 2007; Huijser et al., 2016). Annual average daily traffic volume (AADT) below wildlife overpasses was 23,500 (range 12,700–50,000). AADT above wildlife underpasses was 9,800 (range 8,700–11,500). AADT along the road through at-grade passages was 5,000 (range 3,000–8,000) and maximum allowed speed limit was 80 km/h in three at-grade passages and 100 km/h in the fourth at-grade passage.
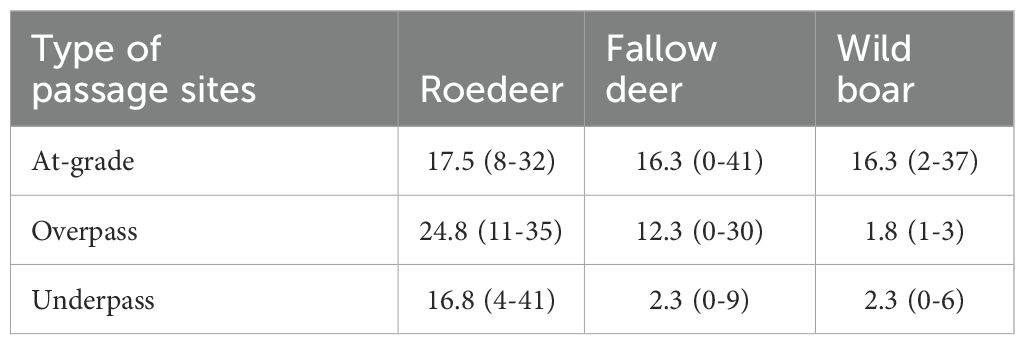
Table 1. Frequency distribution of reported wildlife-vehicle collisions per type of passage sites in our study (mean values and minimum and maximum range) along the road with a fauna passage and within a 2.5-km radius during 2018-2022 in south-central Sweden.
Animal movements were monitored by motion-triggered automatic cameras equipped with near-infrared recordings during dark hours. Cameras were located within 10 m from passage entrances and facing towards the opening. The number of cameras used to monitor animal movements through the passage site differed among types of passage. Typically, at-grade passages and overpasses required 6 cameras because of wider openings, i.e. larger available area in front of passage openings, whereas underpasses required 3 cameras. Thus, the effort behind generating wildlife observations differed, with more reference cameras utilized at at-grade passages and overpasses compared to at underpasses. Therefore, we only included wildlife visits that had been observed at one randomly selected reference camera adjacent to each passage opening (Figure 3). This setup made sure that the areas monitored in front of all passage sites were similar, i.e. the effort behind observing animal movements were comparable among at-grade, over- and underpasses. A successful crossing was defined as observations on a selected reference camera on either side of the road and on either camera on the opposite side of the road in at-grade passages, and at a passage camera in over- and underpasses. An event or wildlife visit was defined as observations of the same species within 10 minutes. Individual identity was not possible to separate. Thus, we were not able to control individual dependence among wildlife visits. All factors that were analyzed in relation to crossing probability are presented in Table 2.

Figure 3. Schematic study design of camera set-up at a crossing site along a road barrier. Blue square indicates placement of automatic wildlife camera and orange triangle represents the area monitored for wildlife movements per camera. Only wildlife visits that were registered at one selected reference camera per roadside were included when analyzing crossing probability in wild ungulates. Passage cameras were only used in over-/underpasses.
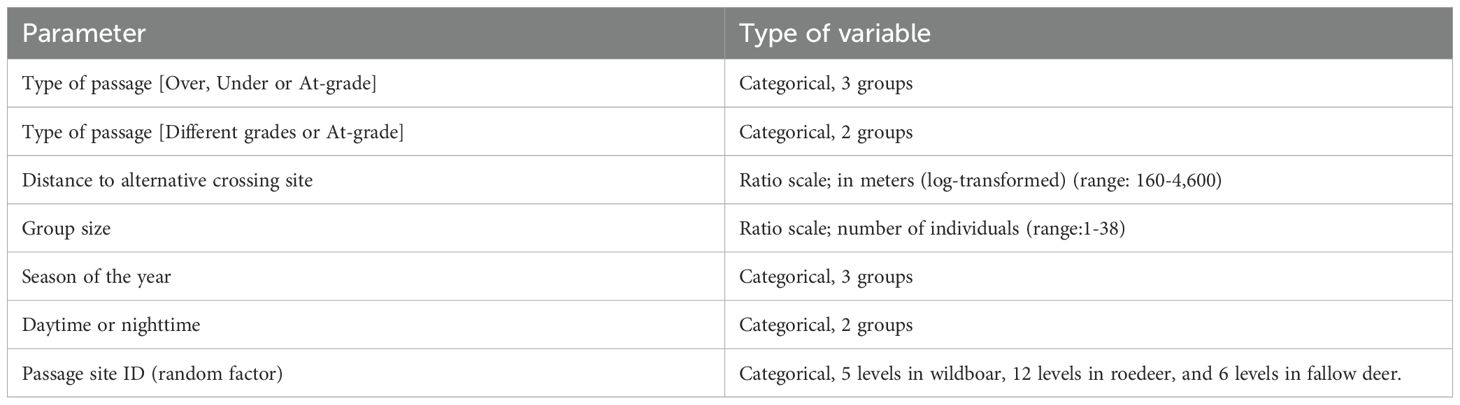
Table 2. Factors analyzed in relation to crossing probability from wild ungulate visits to at-grade passages, over- and underpasses in Sweden 2018-2022.
Crossing probability among different types of passages was compared during the same periods of the year among the crossing objects. The study periods were defined as spring (March–May), summer (June–August), and fall (September–October). The winter period (November–February) was excluded, due to harsher weather conditions such as condensation or snow accumulation on camera lens making it harder to identify observations made from automatic cameras. We did not consider any effect from different year because, although the overall reduction in traffic flow in many countries occurred during 2020 as a response to the COVID-19 epidemic, there was no evident difference in Sweden (Bíl et al., 2021).
All statistical analyses were carried out in R version 4.2.2 (R Development Core Team, 2023). The binary outcome of passing through or not was converted to a probability of passing through by applying logistic regression models. We applied binomial generalized linear mixed-effect models (GLMM) fit by maximum likelihood in the package ‘lme4’ (Bates and Maechler, 2010). We created all candidate models a priori our model selection (Table 3). The first candidate model separated between all three types of crossing structure: at-grade, over- and underpasses. The second candidate model separated instead only between at-grade crossings and over- and underpasses combined. The third candidate model considered the availability of alternative crossing site, besides different group size, daytime or nighttime and season of the year, without distinguishing among crossing structure. The fourth candidate model considered only different group sizes, daytime or nighttime and season of the year. The fifth candidate model only included object ID for crossing structure and is considered a null model. We evaluated the most parsimonious GLMM to explain the variation in crossing probability, based on Akaike’s Information Criteria scores for small sample sizes (AICc) and AICc weights (AICcw) (Akaike, 1973; Burnham and Anderson, 2002). We generated β and its 95% confidence intervals for the fixed effects of the GLMM using the package ‘AICcmodavg’ (Mazerolle, 2023). We averaged β and 95% confidence intervals for models with AICc < 4.00 and AICc weight > 5% (i.e. model-average) in package ‘AICcmodavg’ (Burnham and Anderson, 2002; Mazerolle, 2023). We controlled for any violations of model requirements based on residual plots from the package ‘DHARMa’ (Hartig, 2022), and for multicollinearity with variance inflation factors (Zuur et al., 2009).
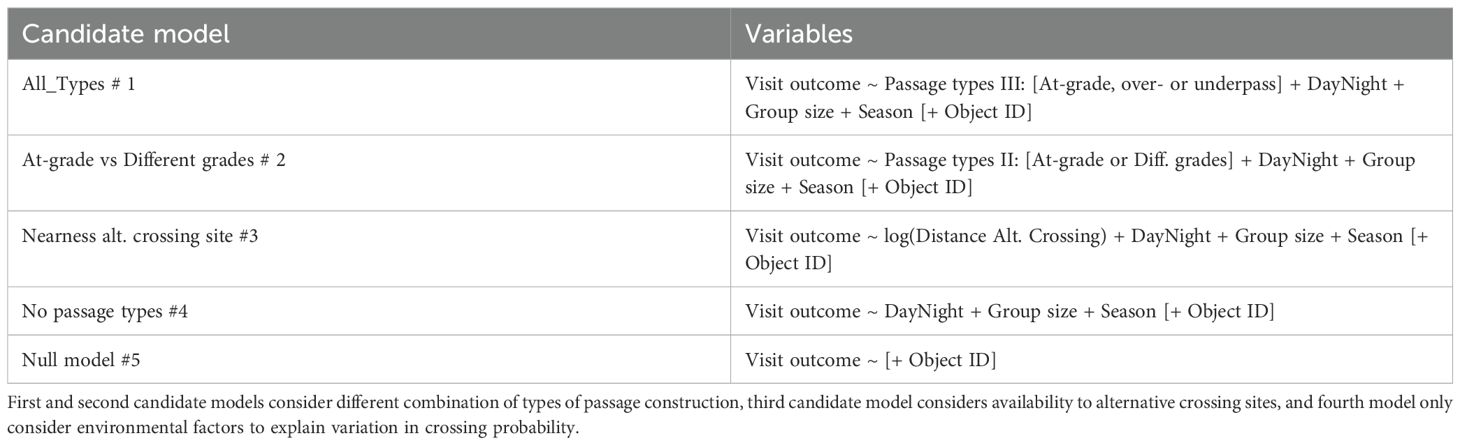
Table 3. Candidate models created before model selection to test which factors contribute to explain variation in crossing probability among wild ungulates visiting different types of crossing structure in Sweden.
We identified 851 visits from wild boar at two at-grade passages (191 visits), two overpasses (473 visits) and one underpass (187 visits) in Sweden during 2019-2022. We identified 1,556 visits from roedeer at four at-grade passages (267 visits), four overpasses (929 visits) and four underpasses (360 visits) in Sweden during 2018-2022. We identified 941 visits from fallow deer at two at-grade passages (269 visits), three overpasses (592 visits) and one underpass (80 visits) in Sweden during 2020-2022. The number of days monitoring wildlife movements elapsed to 1,764 days for at-grade passages, 1,254 days for underpasses and 1,342 days for overpasses (Supplementary Material; Supplementary Table S2). Average monitoring days for at-grade passages was 441 (range 244-646), and 336 (range 117-690) for underpasses and 314 (range 199-526) for overpasses.
All candidate models were similar in parsimonious rank, based on model selection for wild boar, roe deer and fallow deer crossing probability (Tables 4–6). Thus, variation in crossing probability was not different if separating wild boar, roe deer or fallow deer visits between different types of crossing structure compared to models without considering types of crossing structure. Candidate models without any factor that separated visits according to type of crossing structure (mod 3-4) were equally parsimonious as candidate models with type of crossing structure included (mod 1-2).
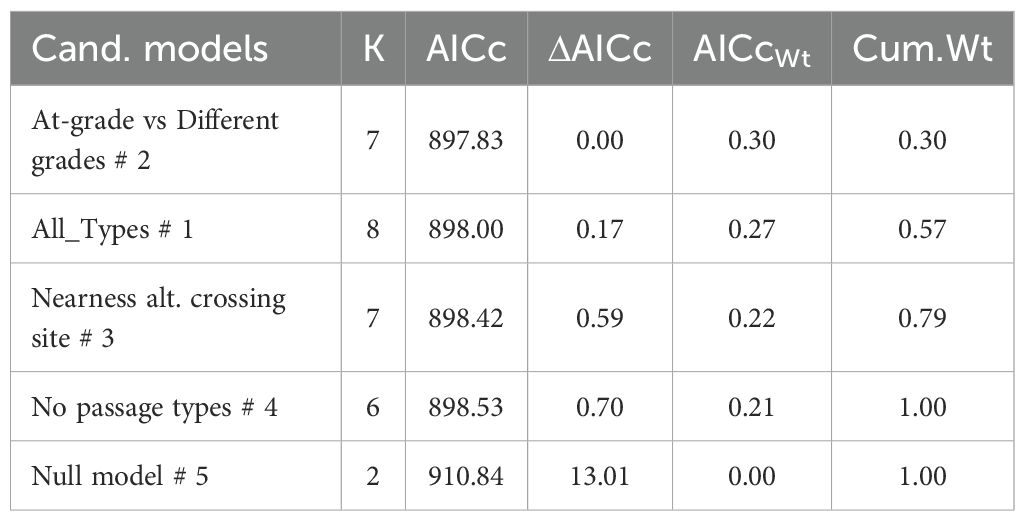
Table 4. The most parsimonious model to explain variation in crossing probability from 851 wild boar visits at two at-grade passages (191 visits), two overpasses (473 visits) and one underpass (187 visits) in Sweden during 2019-2022.
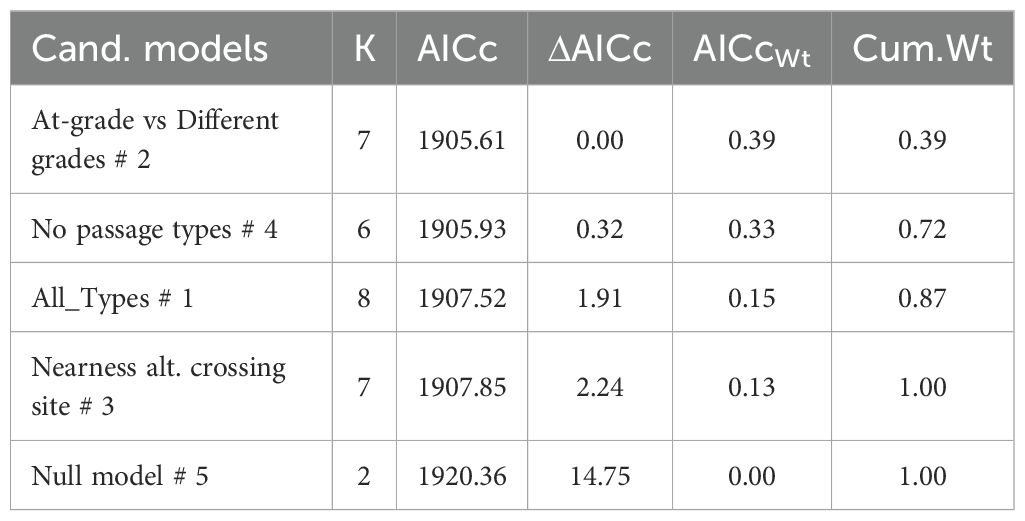
Table 5. The most parsimonious model to explain variation in crossing probability from 1,556 roedeer visits at four at-grade passages (267 visits), four overpasses (929 visits) and four underpasses (360 visits) in Sweden during 2018-2022.
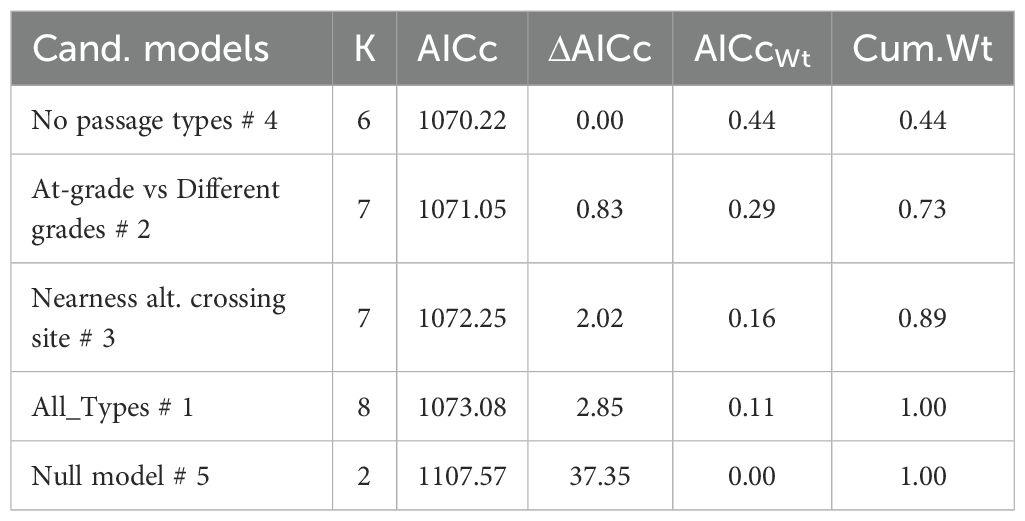
Table 6. The most parsimonious model to explain variation in crossing probability from 941 fallow deer visits at two at-grade passages (269 visits), three overpasses (592 visits) and one underpass (80 visits) in Sweden during 2020-2022. .
Coefficient estimates based on model average among the three highest ranked models reveals that wild boar, roedeer and fallow deer visits at at-grade passages showed no difference in crossing probability compared to over- and underpasses combined (wild boar: β= 1.31; 95% CI= -0.09 & 2.72 in Figure 4; roedeer: β= 0.86; 95% CI= -0.18 & 1.90 in Figure 5; and fallow deer: β= 1.10; 95% CI= -0.76 & 2.95 in Figure 6). Similarly, wild boar, roedeer and fallow deer visits at at-grade passages showed no difference in crossing probability compared to exclusively overpasses (wild boar: β= 0.90; 95% CI= -0.36 & 2.15 in Figure 4; roedeer: β= 0.60; 95% CI= -0.23 & 2.14 in Figure 5; and fallow deer: β= 1.13; 95% CI= -0.82 & 3.08 in Figure 6). Equally, model average reveals that roedeer and fallow deer visits at at-grade passages showed no difference in crossing probability compared to exclusively underpasses (roe deer: β= 0.76; 95% CI= -0.44 & 1.96 in Figure 5; and fallow deer: β= 1.00; 95% CI= -1.62 & 3.61 in Figure 6). However, wild boar visits at exclusively underpasses showed higher crossing probability compared to that at at-grade passages (β= 2.06; 95% CI= 0.50 & 3.62, Figure 4).
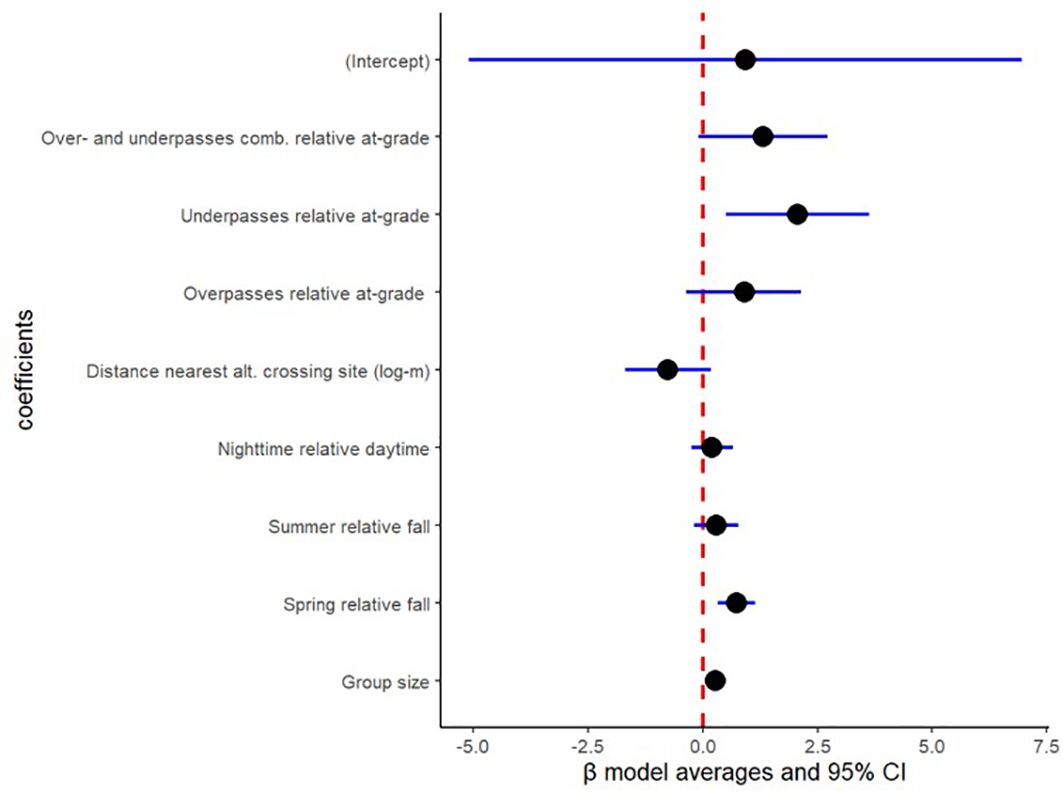
Figure 4. Binomial model output for wild boar in crossing probability from 851 visits at two at-grade passages (191 visits), two overpasses (473 visits) and one underpass (187 visits) in Sweden during 2019-2022, based on model average for ΔAICc<4.00 and AICcweigth>5%. Crossing structure was included as a random effect with variance=0.60.
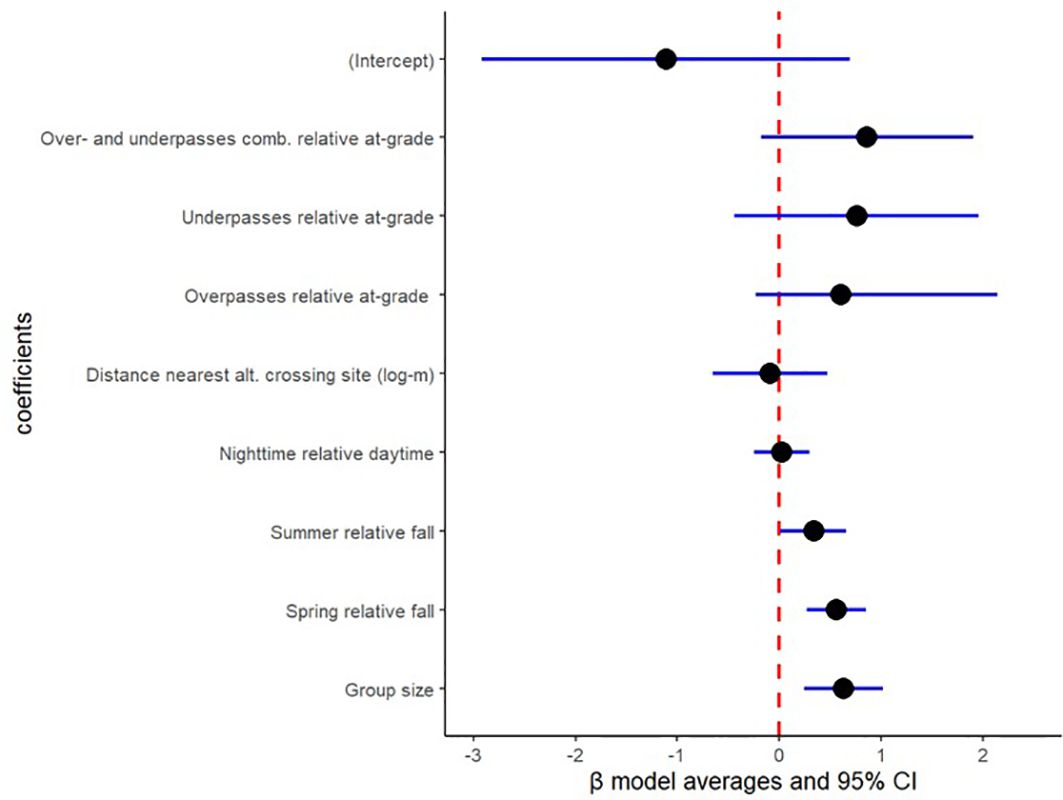
Figure 5. Binomial model output for roedeer in crossing probability from 1,556 roedeer visits at four at-grade passages (267 visits), four overpasses (929 visits) and four underpasses (360 visits) in Sweden during 2018-2022, based on model average for ΔAICc<4.00 and AICcweigth>5%. Crossing structure was included as a random effect with variance=0.75.
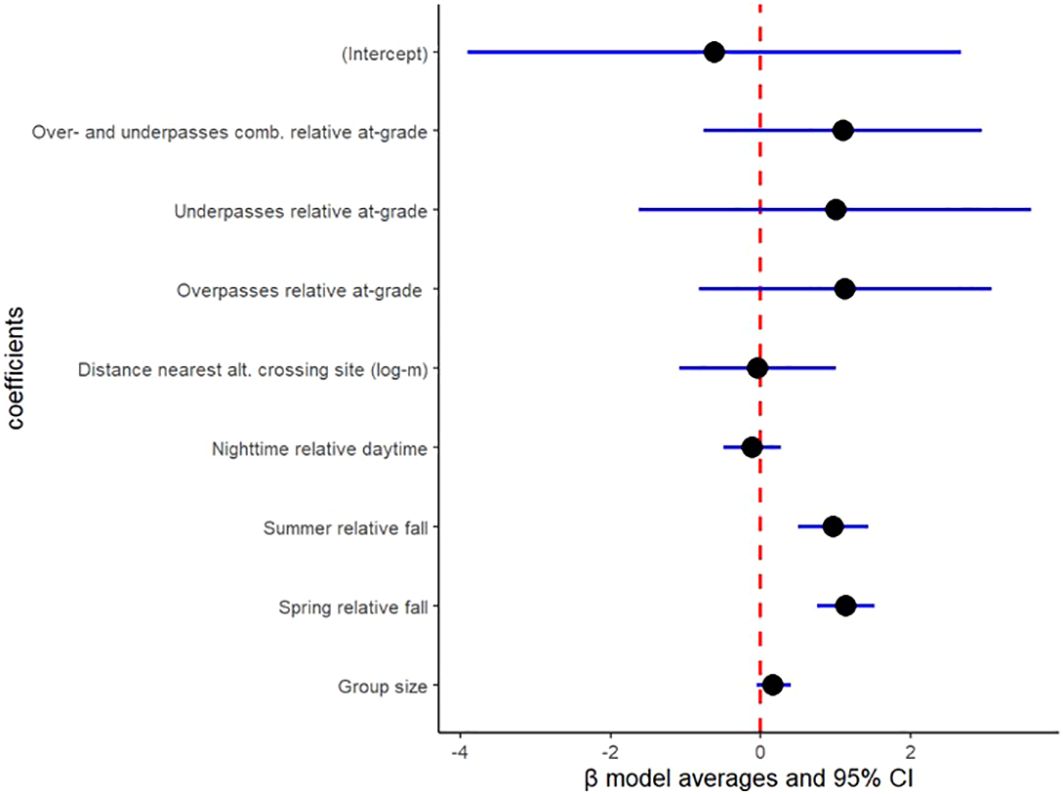
Figure 6. Binomial model output for fallow deer in crossing probability from 941 fallow deer visits at two at-grade passages (269 visits), three overpasses (592 visits) and one underpass (80 visits) in Sweden during 2020-2022, based on model average for ΔAICc<4.00 and AICcweigth>5%. Crossing structure was included as a random effect with variance=1.25.
Model average reveals that wild boar, roedeer and fallow deer visits showed no difference in crossing probability with increasing distance to nearest alternative crossing site (wild boar: β= -0.76; 95% CI= -1.69 & 0.17 in Figure 4; roedeer: β= -0.09; 95% CI= -0.65 & 0.47 in Figure 5; and fallow deer: β= -0.04; 95% CI= -1.09 & 1.01 in Figure 6).
Model average reveals that wild boar and roedeer visits showed higher crossing probability with increasing group size (wild boar: β= 0.28; 95% CI= 0.10 & 0.47 in Figure 4; and roedeer: β= 0.63; 95% CI= 0.24 & 1.02 in Figure 5). However, fallow deer visits showed similar crossing probability in relation to increasing group size (β= 0.17; 95% CI= -0.05 & 0.40, Figure 6).
Model average reveals that wild boar, roe deer and fallow deer visits showed higher crossing probability during spring than during fall (wild boar: β= 0.74; 95% CI= 0.34 & 1.14 in Figure 4; roedeer: β= 0.56; 95% CI= 0.27 & 0.85 in Figure 5; and fallow deer: β= 1.14; 95% CI= 0.75 & 1.52 in Figure 6). Likewise, model average reveals that roedeer and fallow deer visits showed higher crossing probability during summer than during fall (roedeer: β= 0.34; 95% CI= 0.01 & 0.66 in Figure 5; and fallow deer: β= 0.97; 95% CI= 0.50 & 1.44 in Figure 6). In contrast, wild boar visits during summer showed similar crossing probability compared to during fall (β= 0.30; 95% CI= -0.18 & 0.78, Figure 4).
Model average reveals that wild boar, roedeer and fallow deer visits during daytime showed no difference in crossing probability compared to during nighttime (wild boar: β= 0.20; 95% CI= -0.24 & 0.65 in Figure 4; roedeer: β= 0.02; 95% CI= -0.25 & 0.30 in Figure 5; and fallow deer: β= -0.11; 95% CI= -0.49 & 0.27 in Figure 6).
We found no differences in crossing probability in wild boar, roedeer and fallow deer when separating wildlife visits between over- and underpasses combined against at-grade passages. We found only tendencies for higher crossing probabilities at over- or underpasses compared to at-grade passages, but considering similar model support for candidate models without including the variable fauna passage type indicates that our crossing probabilities are more similar than different across passage types. Bhardwaj et al. (2022) concluded that although passing vehicles seem to delay crossings, at-grade passages seem to maintain connectivity for wild ungulates. This indicates that wildlife passage at-grade can show similar functionality, in terms of comparable proportions of usage out of all visits, compared to wildlife-designed overpasses or underpasses. In addition, when separating among over-, underpasses and at-grade passages, there was no difference in crossing probability in roe deer and fallow deer. Wild boar showed an increased crossing probability at underpass compared to at-grade passage. This may indicate that wild boar is more motivated to cross through underpasses than when visiting at-grade passages. However, only one underpass was available in terms of wild boar usage in this study, raising the question of whether this is a common pattern among underpasses or not. Only one underpass was included also when analyzing crossing probability by fallow deer, raising the same concern of whether the pattern of similar crossing probability is a common pattern. For roe deer, four underpasses were included in our comparison against at-grade and overpasses, and our result suggested the same pattern as for fallow deer. No difference in crossing probability between at-grade fauna passages and overpasses may indicate that at-grade passages show sufficient functionality for wildlife to cross intermediate-sized roads. However, we cannot rule out that wildlife stayed longer in the vicinity in and around overpasses which, thus, elevated the risk of being identified as multiple visits without crossing due to attractiveness. Although the same risk of that one true event or wildlife visit may have been treated as multiple visits, may also have occurred at at-grade passages, perhaps due to reluctance in using at-grade passages, alternatively because of grazing may occur also at and around at-grade passages (Bhardwaj et al., 2022).
Besides types of crossing structure, we controlled for environmental factors such as season, whether wildlife visited during day or night and group size. These factors may be of less importance for transportation administrations and management of wildlife in relation to infrastructure. Nevertheless, we can conclude that crossing probability increased with increasing group size in wild boar and roe deer, perhaps because individuals enjoy more comfort and less stress when accompanied by conspecifics in larger groups. Increased group size may also increase the probability of detecting animal movements in front of cameras and, thus, justifying controlling for number of individuals when analyzing crossing probability. Increased crossing probability during spring and summer compared to during fall may be due to other reasons than degree or type of infrastructural barriers, such as other temporal differences in food distribution in combination with behavioral differences related with mating seasons during fall (Mysterud, 1999; Ważna et al., 2020).
Large mammals may often approach near underpasses without using them to cross, e.g. within 50 m (Bhardwaj et al., 2020). This may reflect a reluctance by wild animals to use underpasses, but it may also reflect an intention of not having any need or desire to cross the infrastructure. Thus, we do not know whether an observed crossing probability through one specific over-, underpass or at-grade passage accurately reflects the perceived barrier impact on wildlife. An increased crossing probability by wild ungulates can be the result of both suitable design and locality of wildlife crossing, but also that animals lack other alternatives to cross and are therefore forced to utilize a specific underpass. We found no impact from controlling for availability to alternative crossing sites when analyzing crossing probability in ungulates. The involvement in wildlife-vehicle collisions from all focal species along the specific roads with fauna passages in our study suggests that unknown crossing opportunities may exist within a home-range scale also within sections with wildlife-excluding fencing. This may, at least in part, reduce any correlation between crossing probability and nearest distance to alternative crossing site. Other studies have reported that the nearest distance to alternative crossing sites impacted crossing probability. Bhardwaj et al. (2020) reported lower crossing probability with longer distance to alternative nearest crossing site in roedeer, based on animal tracks found in sand beds. However, Elfström et al. (2024) found an increased crossing probability with longer distance to nearest alternative crossing sites in roedeer, based on observations from movement-triggered automatic cameras.
Most wild ungulate visits resulted in crossing an at-grade passage with AADT of 6000 vehicles/day, with crossing probability ranging between 62% for roe deer and 84% for wild boar (Bhardwaj et al., 2022). Vehicle traffic flow among at-grade passages in our study ranged between 3,000 and 8,000 AADT. But we lack understanding for threshold when vehicle traffic flow is too high, considering wildlife-reluctance to cross and wildlife-vehicle collision risks, making at-grade passages not suitable for wild ungulates to cross infrastructure barriers. Thus, we caution against at-grade passages along roads with elevated traffic volumes, but if these passages still are constructed it would be most valuable to monitor them to estimate crossing probability from wildlife visits. Based on total number of wildlife crossings made and reported wildlife vehicle collisions from the same species (based on proximity to the at-grade passage), the individual risk for involvement in vehicle collisions has been quantified to 0.4% and 0.5% for two of the fauna passages at-grade included in our study (Bhardwaj et al., 2022; Elfström, 2022). In landscapes with endangered species and traffic mortality that would impact on its conservation, overpasses and underpasses may be more suitable across also intermediate-sized roads than fauna passages at-grade. A reduction in maximum allowed speed limit from currently 80 km/h through at-grade passages would probably reduce the risk of wildlife-vehicle collisions.
Major highways usually constitute significant barriers, but also intermediate roads fragment habitats for wildlife, especially road sections equipped with wildlife fencing. Mitigating barrier impacts within wildlife conservation and management must therefore allocate resources to improve permeability across all road types. Connectivity is probably more enhanced from several small crossing opportunities along the road network, rather than few, large, concentrated opportunities (Helldin, 2022). Over- and underpasses are probably a necessity for wild ungulates to cross major highways, and to benefit other species that avoid roads and traffic, by providing a crossing opportunity that is separated from major vehicle traffic. In areas where over- and underpasses are not feasible to construct, at-grade wildlife passages may provide a cost-efficient solution to connect habitats for large mammals across common road networks in most landscapes. However, at-grade passages will most often only target fewer species compared to a broad diversity of wildlife that may utilize and benefit from under- and overpasses.
Fencing to exclude wildlife from crossing infrastructure is most often focused on wild ungulates, because they are relatively common and large and, thus, constitutes a traffic safety risk in terms of human injuries and material costs when they are involved in traffic accidents. The aim of excluding wild ungulates from crossing infrastructure raises the need to secure crossing opportunities, such as at-grade fauna passages, along infrastructure with the same intermediate-sized traffic volume and for the same species, e.g. wild ungulates in focus to mitigate barrier impacts.
The raw data supporting the conclusions of this article will be made available by the authors, without undue reservation.
Ethical approval was not required for the study involving animals in accordance with the local legislation and institutional requirements because we collected data by monitoring wild animal movements with motion-triggered automatic cameras. No ethical approvement was required because human access is restricted at wildlife passages.
ME: Conceptualization, Data curation, Formal analysis, Investigation, Methodology, Project administration, Resources, Software, Supervision, Validation, Visualization, Writing – original draft, Writing – review & editing. MO: Funding acquisition, Writing – original draft, Writing – review & editing.
The author(s) declare that financial support was received for the research, authorship, and/or publication of this article. The study was conducted within the TRIEKOL research project financed by The Swedish Transport Administration.
We thank Jan-Olof Helldin for project coordination and for comments on the manuscript.
Authors ME and MO were employed by the company EnviroPlanning AB.
The author(s) declare that no Generative AI was used in the creation of this manuscript.
All claims expressed in this article are solely those of the authors and do not necessarily represent those of their affiliated organizations, or those of the publisher, the editors and the reviewers. Any product that may be evaluated in this article, or claim that may be made by its manufacturer, is not guaranteed or endorsed by the publisher.
The Supplementary Material for this article can be found online at: https://www.frontiersin.org/articles/10.3389/fcosc.2025.1546782/full#supplementary-material
Akaike H. (1973). Information theory and an extension of the maximum likelihood principle. Proceeding Second Int. Symposium Inf. Theory Budapest Hungary, 267–281.
Bates D. M., Maechler M. (2010). ). lme4: linear mixed-effects models using S4 classes R package version 0.999375-37. Available online at: http://CRAN.R-project.org/package=lme4:29 (Accessed November 23, 2024).
Bhardwaj M., Erixon F., Holmberg I., Seiler A., Håkansson E., Elfström M., et al. (2022). Ungulate use of an at-grade fauna passage and roadside animal detection system: A pilot study from Southern Sweden. Front. Environ. Sci. Sec. Conserv. Restor. Ecol. 10. doi: 10.3389/fenvs.2022.991551
Bhardwaj M., Olsson M., Seiler A. (2020). Ungulate use of non-wildlife underpasses. J. Environ. Manage. 273, 111095. doi: 10.1016/j.jenvman.2020.111095
Bíl M., Andrášik R., Cícha V., Arnon A., Kruuse M., Langbein J., et al. (2021). COVID-19 related travel restrictions prevented numerous wildlife deaths on roads: A comparative analysis of results from 11 countries. Biol. Conserv. 256, 109076. doi: 10.1016/j.biocon.2021.109076
Burnham K. P., Anderson D. R. (2002). Model selection and multimodel inference: a practical information-theoretic approach. 2nd ed. (New York: Springer-Verlag).
Charry B., Jones J. (2009). Traffic Volume as a primary road characteristic impacting wildlife: a tool for land use and transportation planning (University of California, UC Davis: ICOET). Available at: https://escholarship.org/uc/item/4fx6c79t (Accessed October 14, 2024).
Denneboom B., Bar-Massada A., Shwartz A. (2021). Factors affecting usage of crossing structures by wildlife – A systematic review and meta-analysis. Sci. Total Environ. 777, 146061. doi: 10.1016/j.scitotenv.2021.146061
Dodd N. L., Gagnon J. W., Boe S., Schweinsburg R. E. (2007). “Role of fencing in promoting wildlife underpass use and highway permeability,” in Proceedings of the international conference on ecology and transportation. Eds. Irwin C. L., Garrett P., McDermott K. P. (Center for Transportation and the Environment, North Carolina State University, Raleigh, USA), 475–487.
Elfström M. (2022). Miljöuppföljning - barriäreffekter för däggdjur vid planpassage för fauna och efter faunastängsling utmed väg 42 förbi Lagmansered under året 2020. Trafikverket i samverkan Med. EnviroPlanning AB. 1–79.
Elfström M., Håkansson E., Helldin J. O. (2024). “Wild ungulate use of underpasses – tunnel length and availability of crossing opportunity matters,” in Hlavac V., Strnad M., Zasadil P. (eds.) Biodiversity in the headlight of future transport. Book of Abstracts from IENE 2024 International Conference, Prague, September 9-13, 2024. Czech University of Life Sciences Prague & Nature Conservation Agency of the Czech Republic.
Hartig F. (2022). “DHARMa: residual diagnostics for hierarchical (multi-level/mixed) regression models,” in Theoretical ecology (University of Regensburg). Available at: https://cran.r-project.org/web/packages/DHARMa/vignettes/DHARMa.html (Accessed November 23, 2024).
Helldin J. O. (2022). Are several small wildlife crossing structures better than a single large? Arguments from the perspective of large wildlife conservation. Nat. Conserv. 47, 197–213. doi: 10.3897/natureconservation.47.67979
Huijser M. P., Fairbank E. R., Camel-Means W., Graham J., Watson V., Basting P., et al. (2016). Effectiveness of short sections of wildlife fencing and crossing structures along highways in reducing wildlife—vehicle collisions and providing safe crossing opportunities for large mammals. Biol. Conserv. 197, 61–68. doi: 10.1016/j.biocon.2016.02.002
Jägerbrand A. K., Gren I.-M., Seiler A., Johansson Ö. (2018). Uppdatering och nya effektsamband i effektmodellen för viltolyckor. (Linköping, Sweden: Calluna AB).
Jarnemo A., Neumann W., Ericsson G., Kjellander P., Andrén H. (2018). Hjortvilt i Sverige - En kunskapssammanställning (Naturvårdsverket, ISSN 0282-7298, Stockholm, Sweden: Swedish Environmental Protection Agency).
Mazerolle M. J. (2023). AICcmodavg: Model selection and multimodel inference based on (Q)AIC(c). R package version 2.3.3. Available online at: https://cran.r-project.org/package=AICcmodavg (Accessed November 23, 2024).
Mysterud A. (1999). Seasonal migration pattern and home range of roe deer (Capreolus capreolus) in an altitudinal gradient in southern Norway. J. Zoology 247, 479–486. doi: 10.1111/j.1469-7998.1999.tb01011.x
R Development Core Team. (2023). R: A language and environment for statistical computing (Vienna, Austria: R Foundation for Statistical Computing). Available at: https://www.R-project.org/ (Accessed November 23, 2024).
Rosell C., Chrétien L., Guinard E., Nowicki F., Righetti A., Seiler A., et al. (2023). “Solutions to mitigate impacts and benefit nature,” in A handbook for action. Ed. Rosell C., et al (IENE, Paris, France: IENE Biodiversity and infrastructure). Available at: https://www.biodiversityinfrastructure.org/ (Accessed October 14, 2024).
Seiler A. (2005). Predicting locations of moose-vehicle collisions in Sweden. J. Appl. Ecol. 42, 371–382. doi: 10.1111/j.1365-2664.2005.01013.x
Ważna A., Kaźmierczak A., Cichocki J., Bojarski J., Gabryś G. (2020). Use of underpasses by animals on a fenced expressway in a suburban area in western Poland. Nat. Conserv. 39, 1–18. doi: 10.3897/natureconservation.39.33967
Keywords: connectivity, ecoducts, fauna passage, permeability, wildlife passage
Citation: Elfström M and Olsson M (2025) Do wild ungulates utilize at-grade fauna passages as effectively as fauna overpasses or underpasses? Front. Conserv. Sci. 6:1546782. doi: 10.3389/fcosc.2025.1546782
Received: 02 January 2025; Accepted: 18 February 2025;
Published: 05 March 2025.
Edited by:
Luis P. Da Silva, Centro de Investigacao em Biodiversidade e Recursos Geneticos (CIBIO-InBIO), PortugalReviewed by:
Stefano Filacorda, University of Udine, ItalyCopyright © 2025 Elfström and Olsson. This is an open-access article distributed under the terms of the Creative Commons Attribution License (CC BY). The use, distribution or reproduction in other forums is permitted, provided the original author(s) and the copyright owner(s) are credited and that the original publication in this journal is cited, in accordance with accepted academic practice. No use, distribution or reproduction is permitted which does not comply with these terms.
*Correspondence: Marcus Elfström, bWFyY3VzLmVsZnN0cm9tQGVudmlyb3BsYW5uaW5nLnNl
Disclaimer: All claims expressed in this article are solely those of the authors and do not necessarily represent those of their affiliated organizations, or those of the publisher, the editors and the reviewers. Any product that may be evaluated in this article or claim that may be made by its manufacturer is not guaranteed or endorsed by the publisher.
Research integrity at Frontiers
Learn more about the work of our research integrity team to safeguard the quality of each article we publish.